
A Study of the Vertical Distribution and Sub-Peaks of Ozone below 12 km over Wuyishan Region Based on Ozone Sounding in Winter

 and
and
Abstract
:1. Introduction
2. Data and method
2.1. Instrument and Elements Detected
2.2. Ozone Content
2.3. Total Ozone Column
3. Results
3.1. Overview of Ozone Sounding
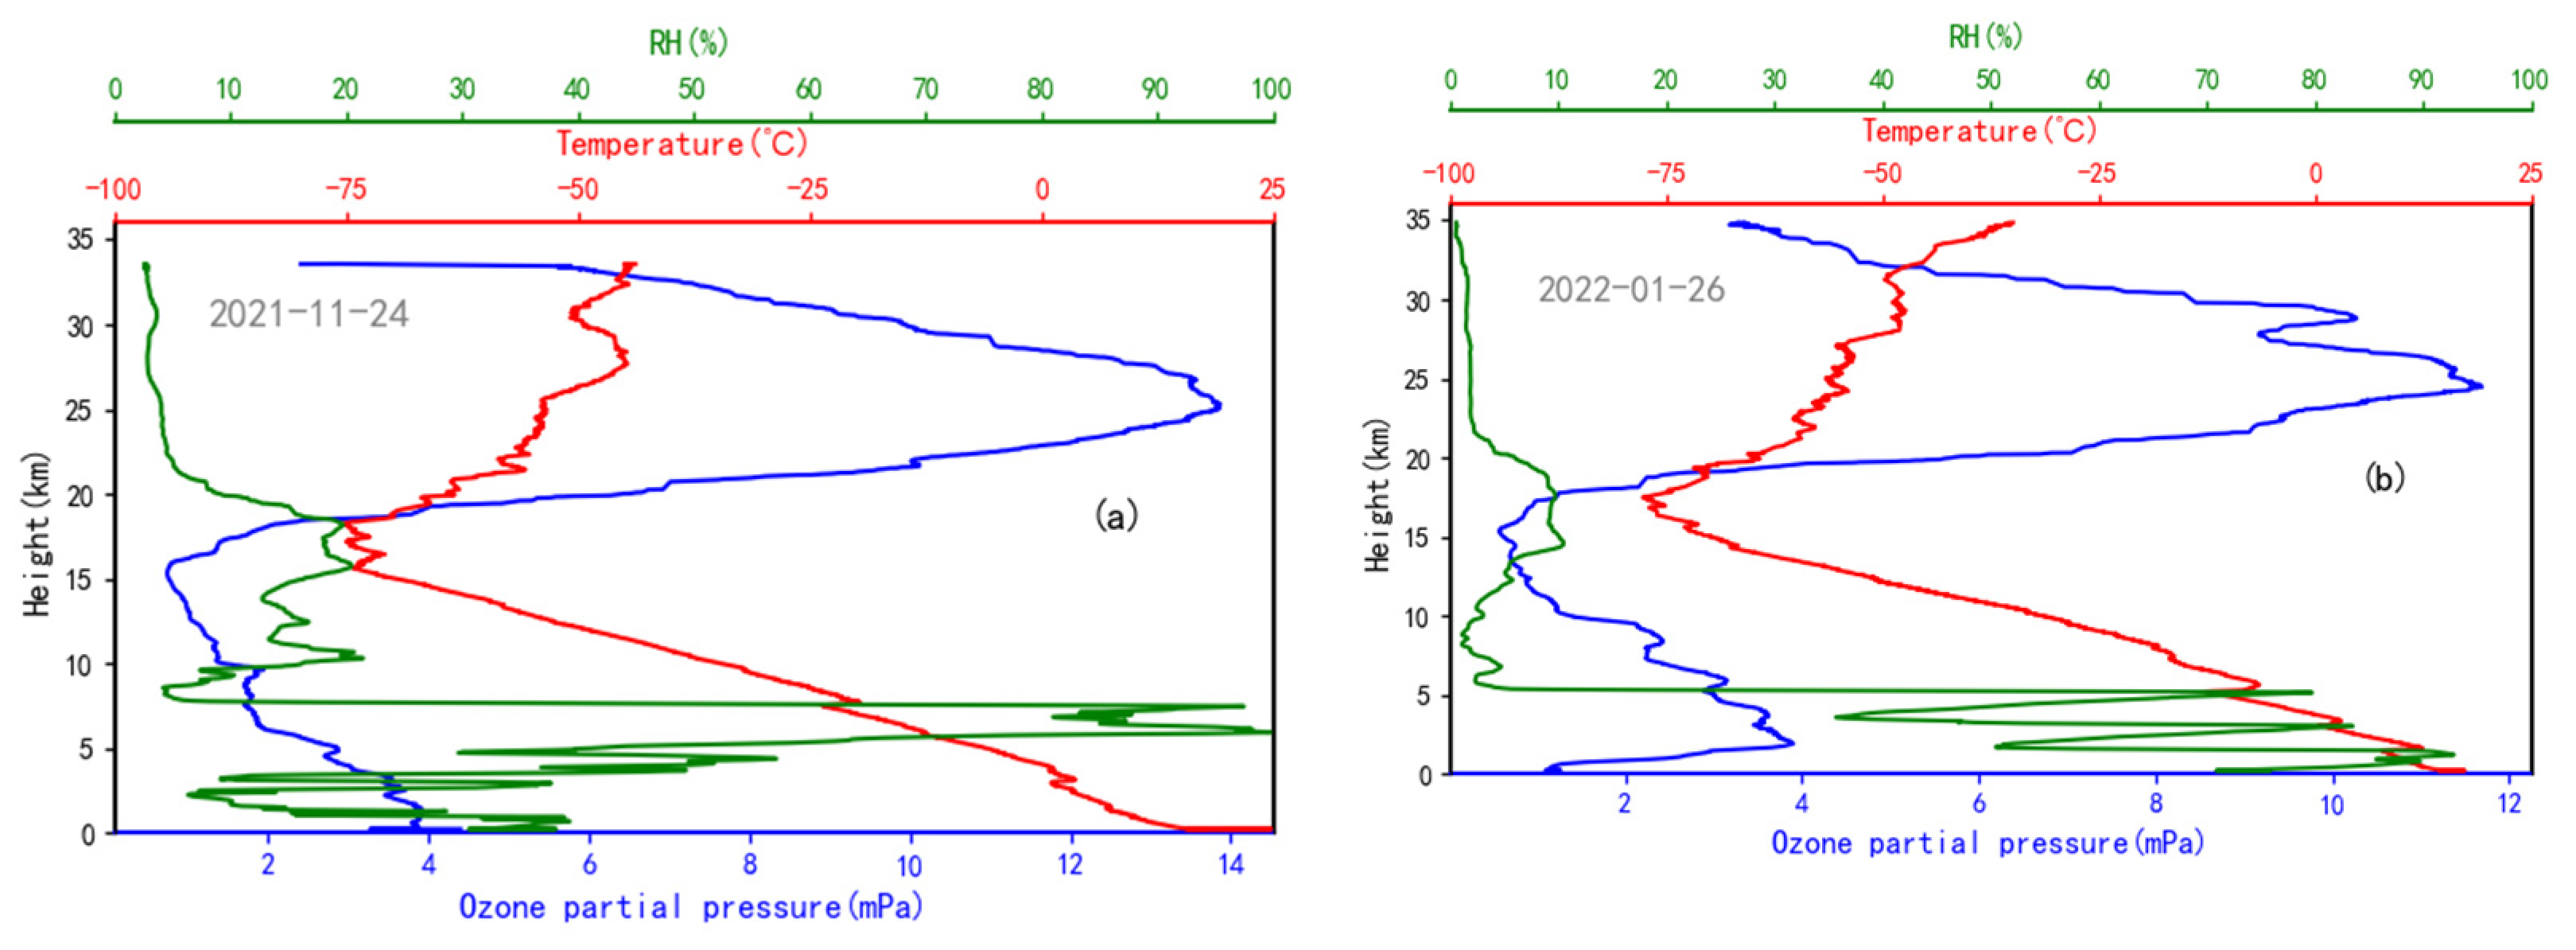
3.2. Ozone Partial Pressure and Temperature Profile
3.3. Tropospheric Ozone VMR
3.3.1. Trends with Height
3.3.2. Characteristics of Ozone Vertical Distribution
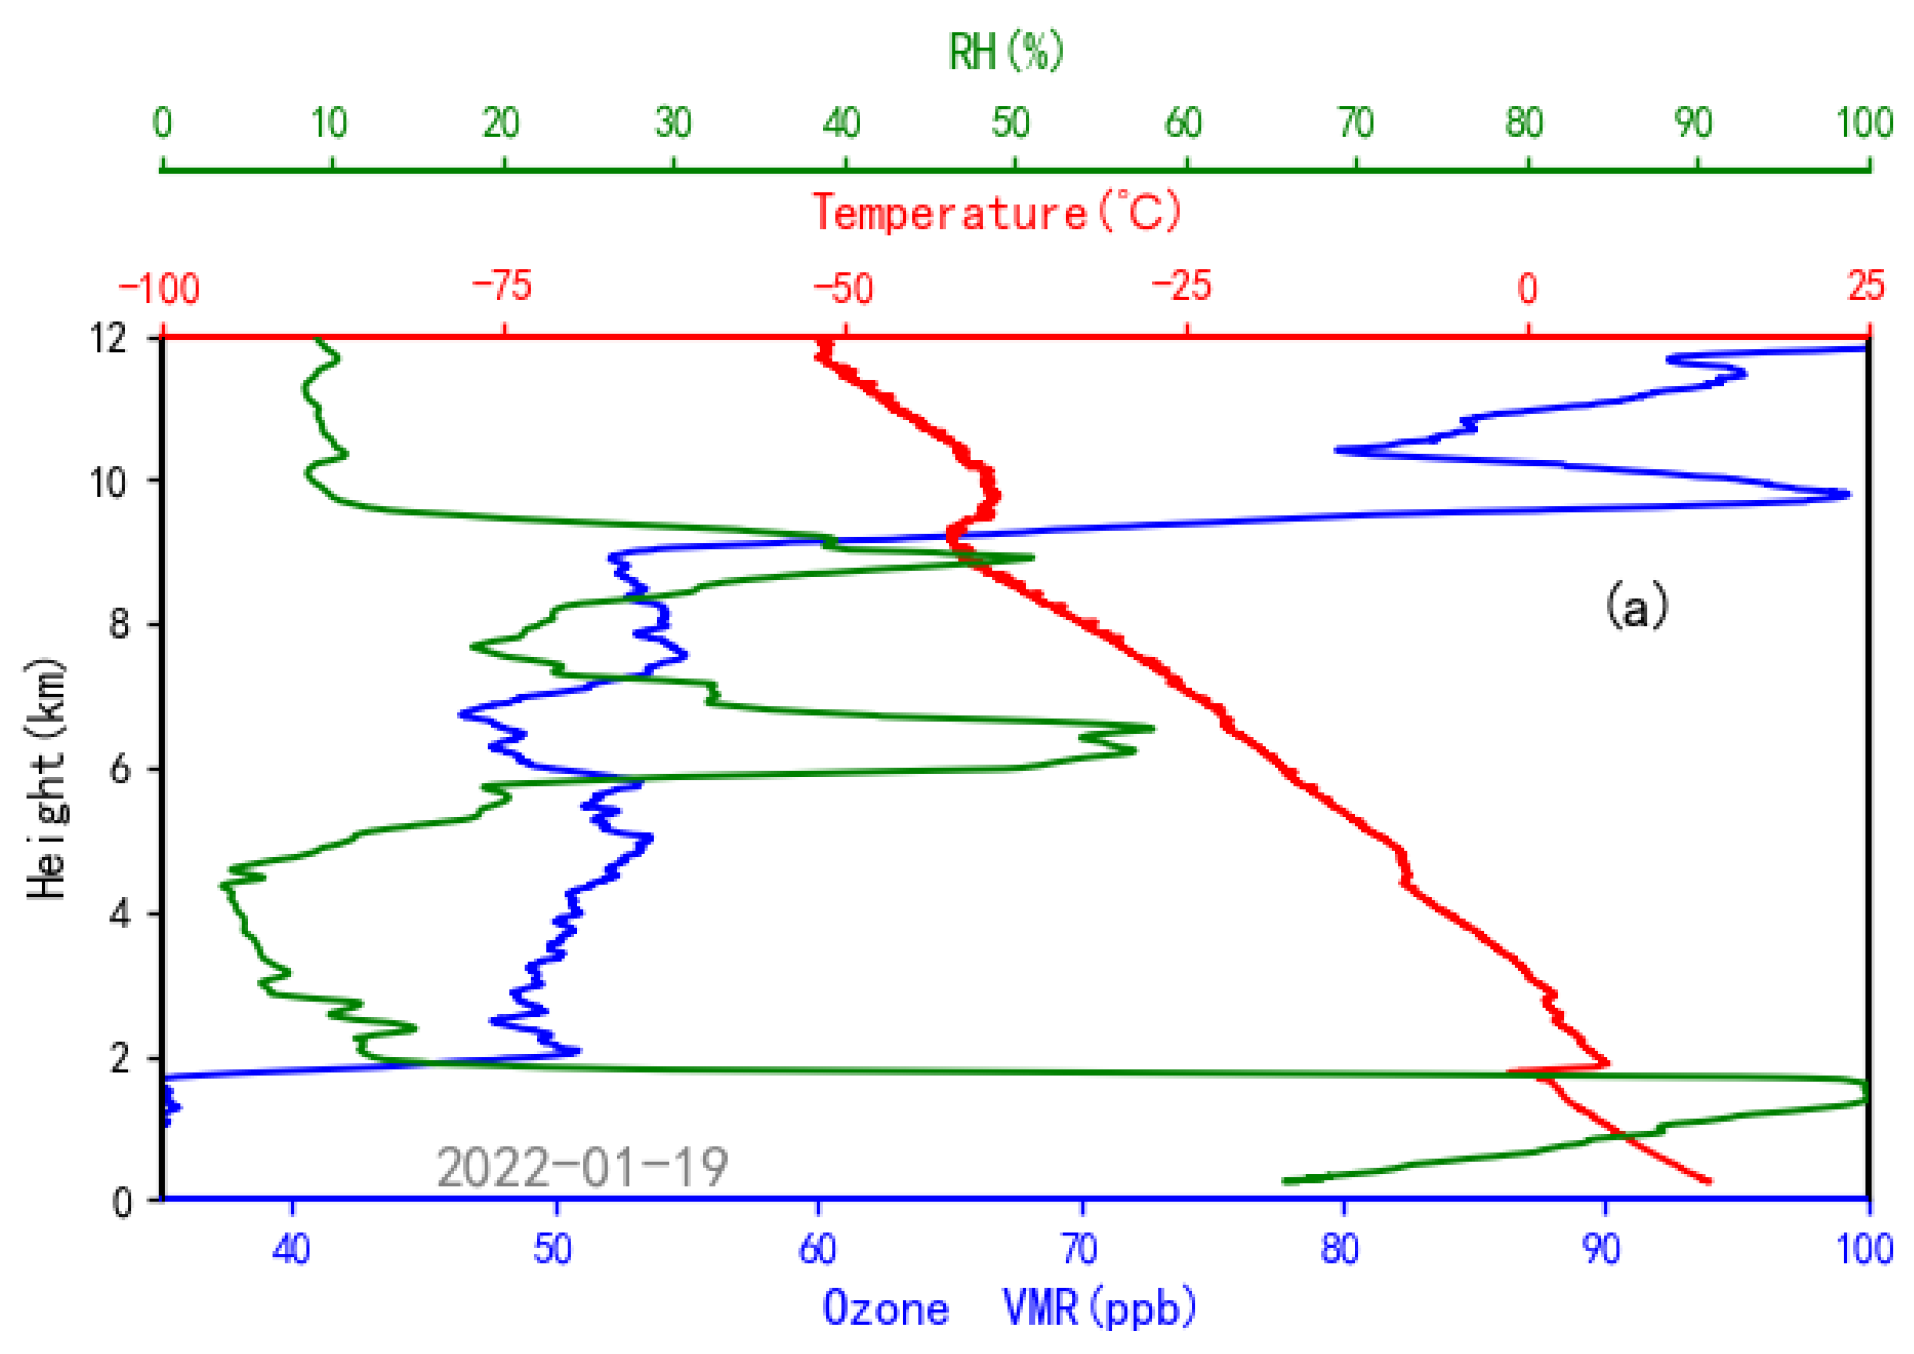
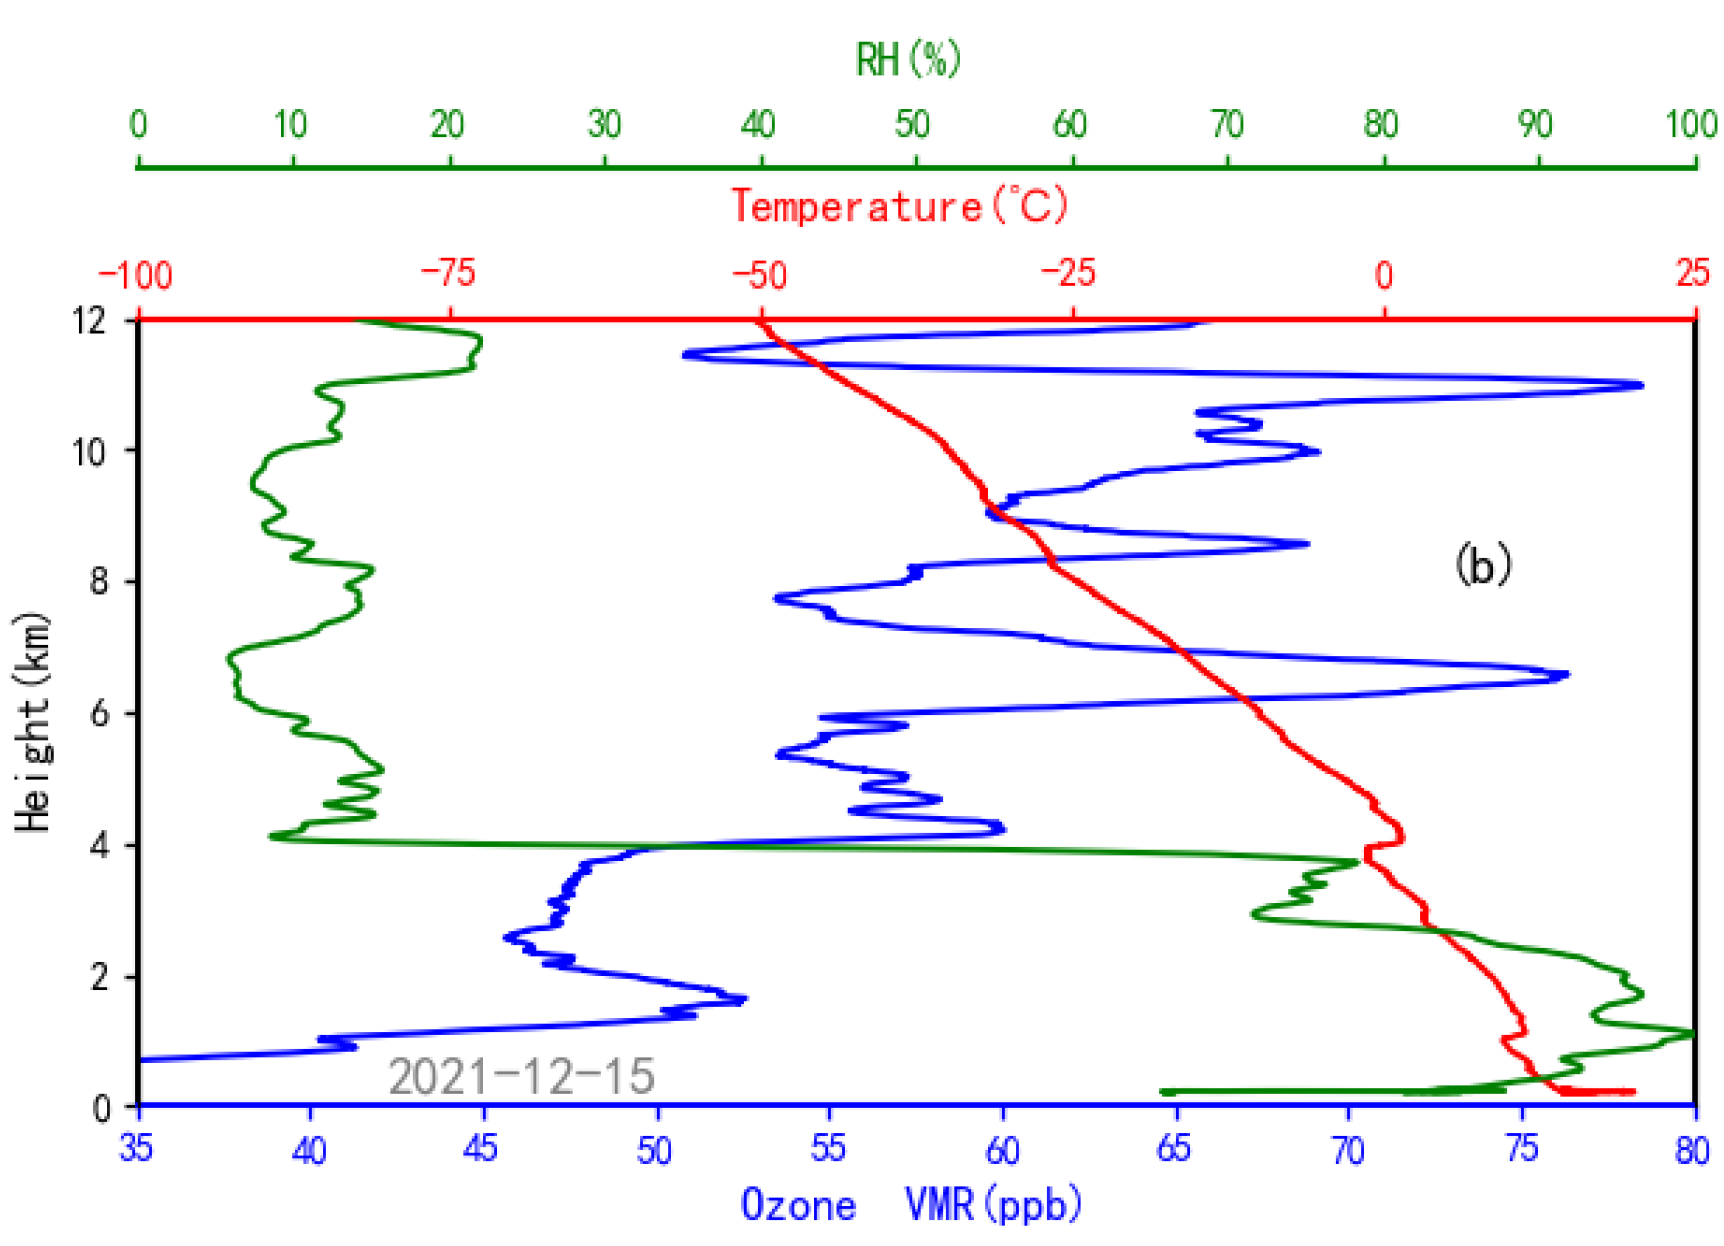
3.3.3. Tropospheric Ozone Sub-Peak Phenomenon below 12 km
3.4. Stratospheric Ozone VMR
3.5. Total Ozone Analysis
4. Discussion
5. Conclusions
- (1)
- Using China’s self-developed CTY-1 ozone-sounding sensor and HYDF-MCRS1 satellite navigation sounding receiver, the Shaowu sounding station of the Wuyi Mountain National Meteorological Observation Station performed the first scientific experiment of ozone-sounding observation in Fujian Province on 24 November 2021. The ozone-sounding observation is made regularly every Wednesday or Thursday (non-rainy days), and is of great scientific significance and practical value.
- (2)
- In the winter of 2022, the average maximum height of ozone-sounding observation at the Shaowu station is 37.2 km. The average flight time of the sounding balloon is 97 min; its average rise speed is 390 m/min. The average height of the tropopause is 17.2 km, and the average vertical decrement rate in the troposphere is 5.9 °C/km.
- (3)
- There are two trends of ozone partial pressure with height. One is that the ground decreases toward the tropopause, which is consistent with the temperature profile. The second is that the ozone partial pressure first shows an increasing trend from the ground to about 3 km, corresponding to one or more layers of temperature inversion structures in the temperature profile when the atmosphere is static and the relative humidity is stable. Then the ozone partial pressure decreases toward the tropopause. Both of these two types of the ozone partial pressure start to increase significantly after reaching the stratosphere and keep increasing to around 25 km, at which it reaches a maximum value. Above 25 km, the ozone partial pressure decreases again as the height increases until the end of the observation. The average height of the maximum ozone partial pressure is 24.9 km, and the average maximum value is 14 mPa.
- (4)
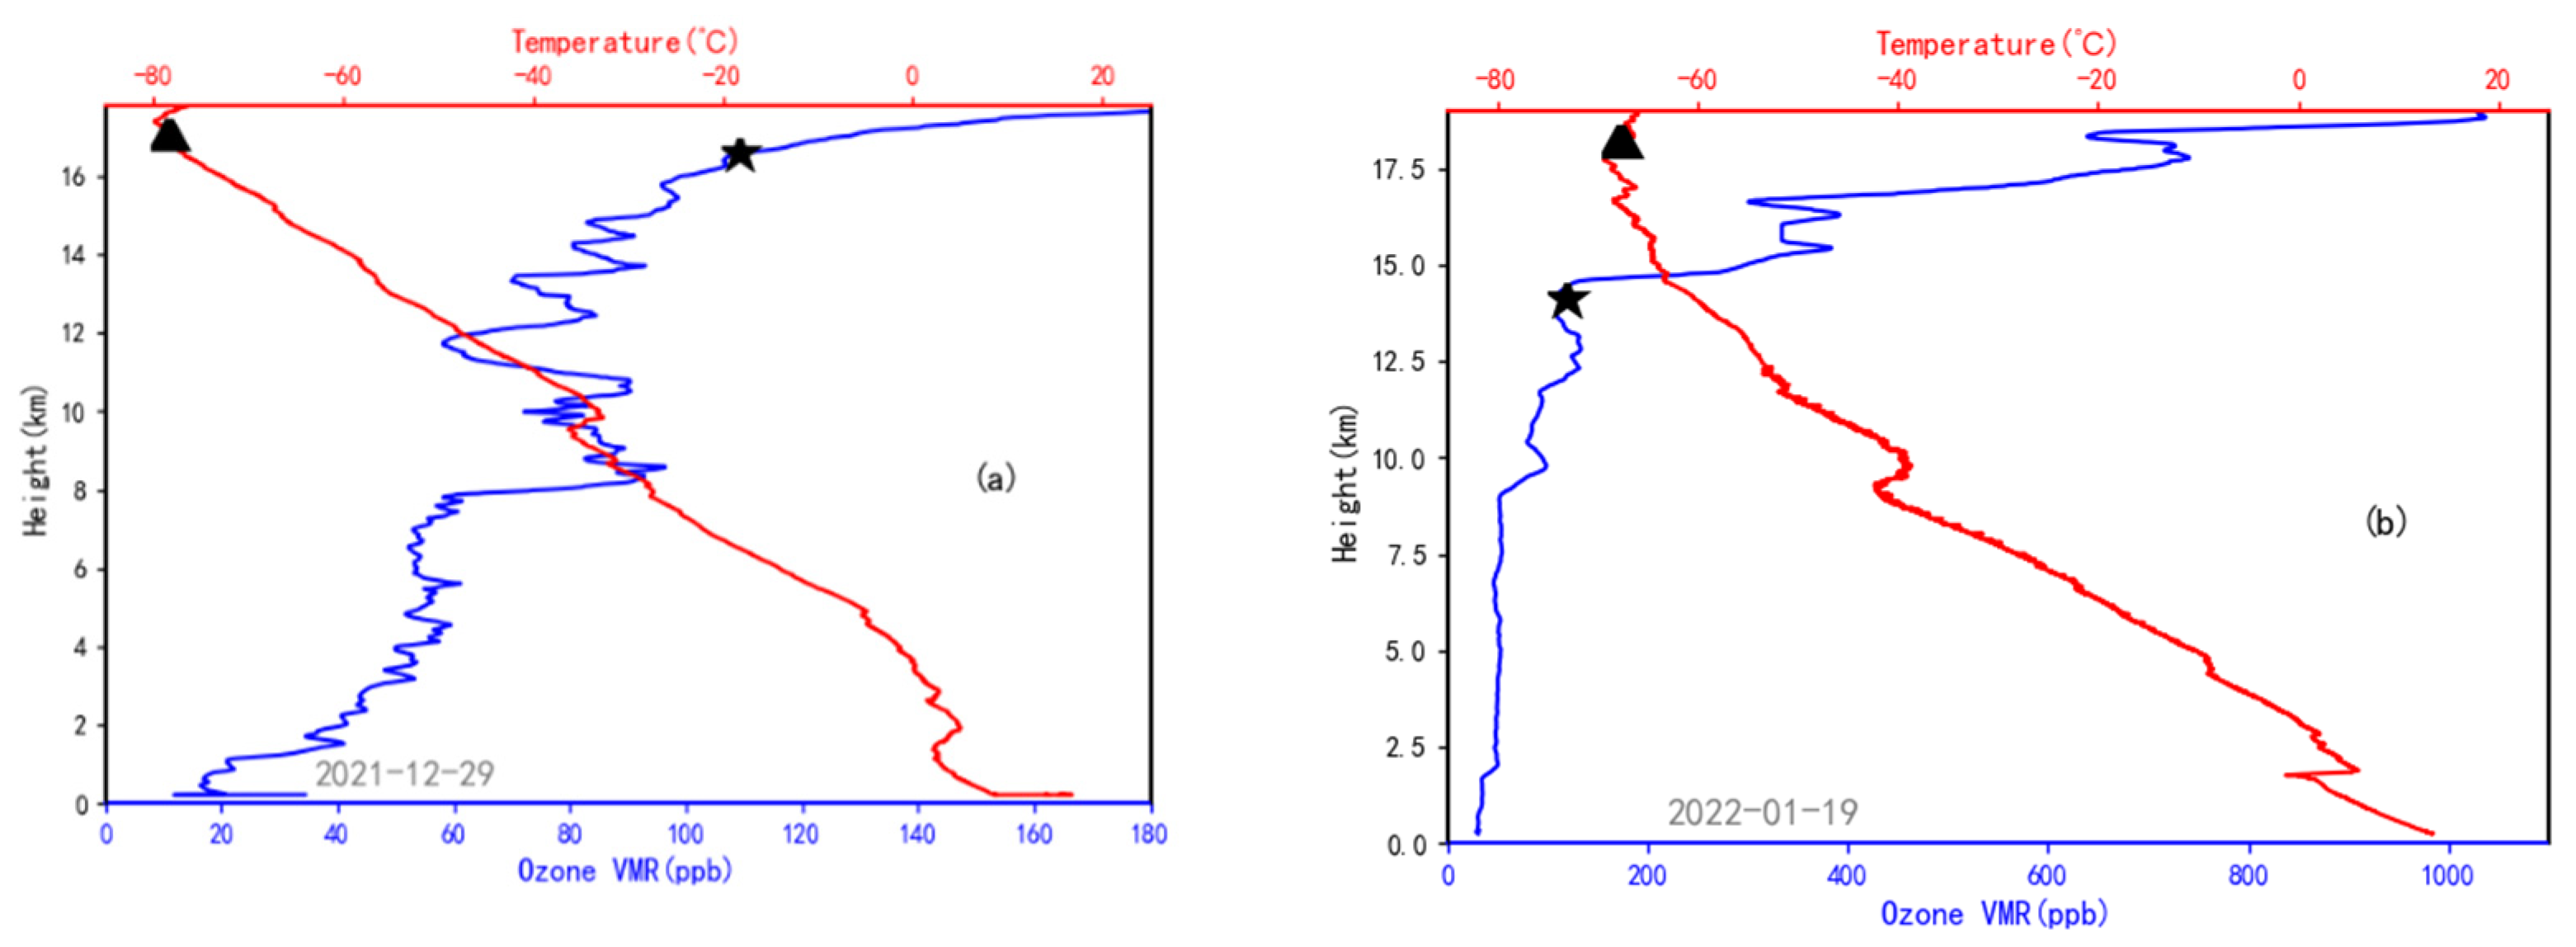
- There are also two trends of variation in the tropospheric ozone VMR with height. One is the fluctuating increase from the ground to the tropopause. After reaching the tropopause, the ozone VMR begins to rise rapidly; that is, the height of the ozone surge is consistent with the height of the tropopause. This phenomenon appeared in two cases. The tropospheric ozone VMR in the remaining 10 cases increases rapidly about 5 km away from the tropopause with ozone VMR variability larger than 20 ppb/km. The starting point of ozone surge layer is between 12.7–15.5 km, which is 2.9 km lower than the tropopause on average. In this surge layer, the ozone VMR increased three to four times in five cases, and the ozone VMR at tropopause was about 190–240 ppb. There is one case that the ozone VMR increased by six times, and the ozone VMR at tropopause reaches 745 ppb, which has the same characteristics as stratospheric ozone. This high VMR at tropopause is mainly due to the transport of stratospheric ozone to the upper troposphere by dynamic transport.
- (5)
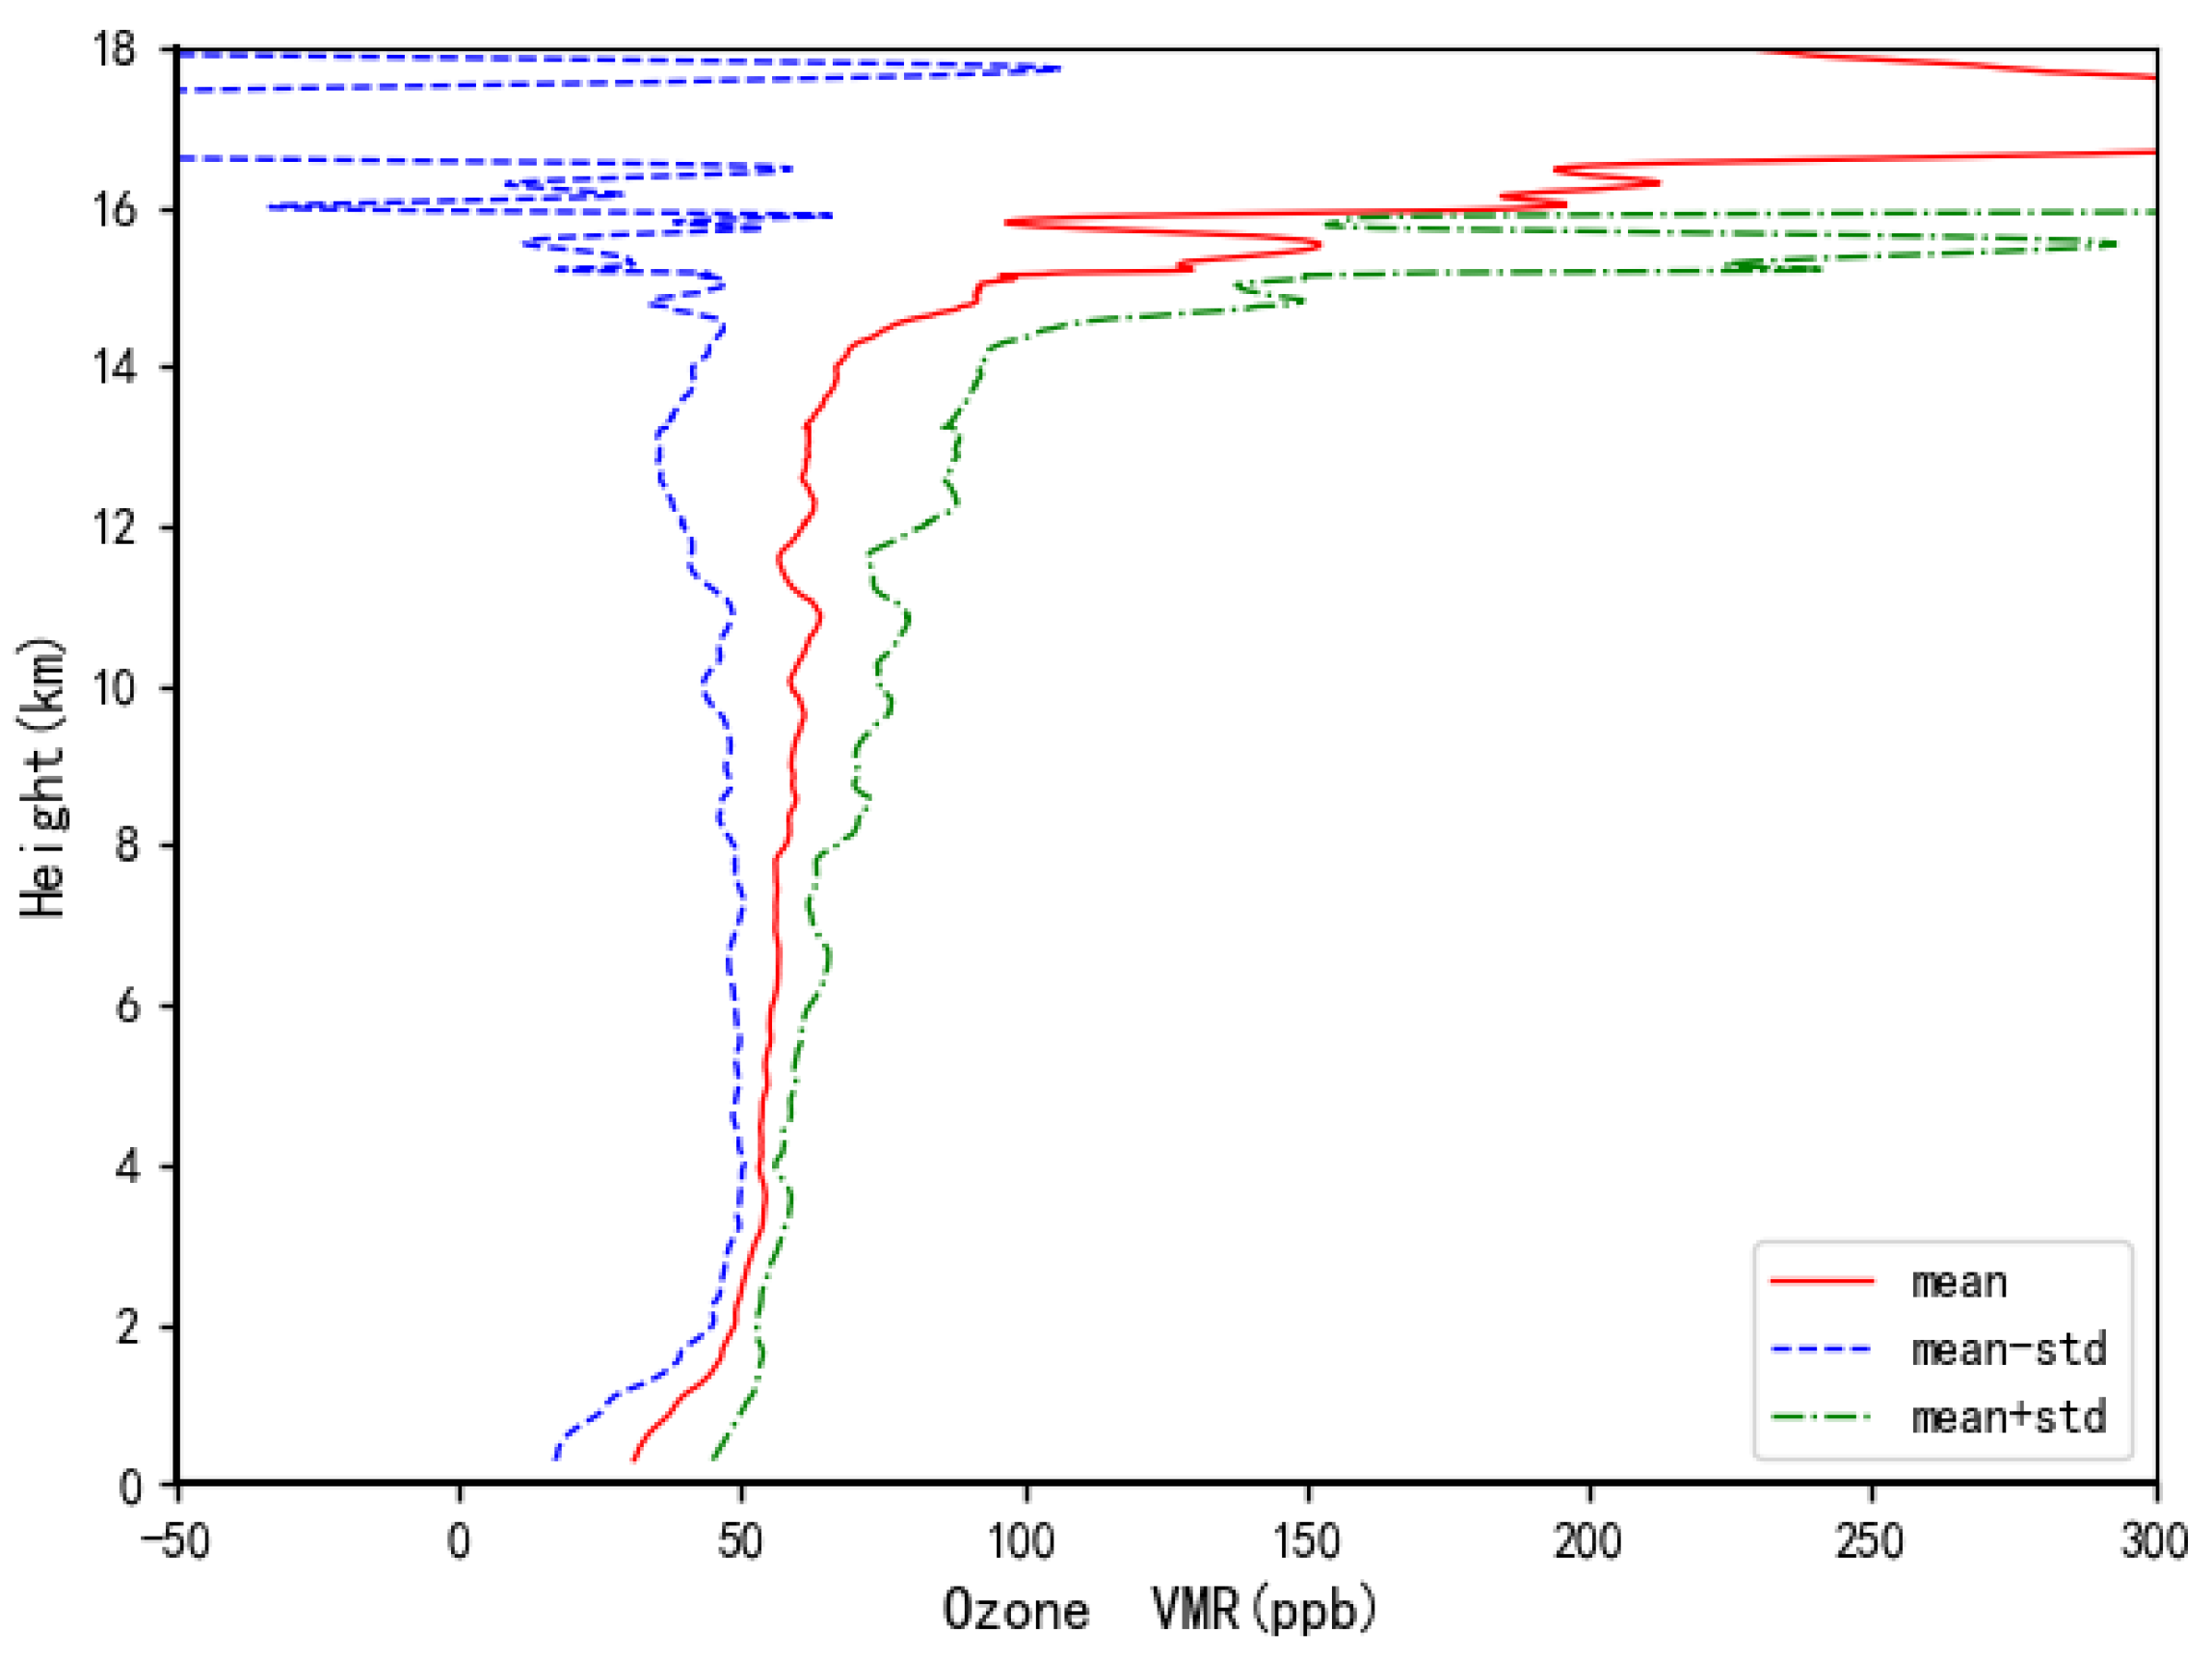
- The tropospheric ozone profile below 12 km has three types: no sub-peak (eight cases), single sub-peak (three cases), and a multiple sub-peak phenomenon (one case). It is found that the sub-peak phenomenon distributes in the height range of 6.7–11.5 km, and the corresponding relative humidity is less than 12%. The sub-peak VMR is 1.6–1.9 times larger than the average state at the same height, which is consistent with the characteristics of ozone in the middle and lower troposphere. The main reason for the sub-peak phenomenon of tropospheric ozone VMR below 12 km in winter is that the ozone VMR is affected by many factors such as temperature, air pressure, wind field, and radiation, and is restricted by atmospheric dynamics and weather processes.
- (6)
- The layer of the maximum stratospheric ozone VMR is within the height of 29.4–34.3 km, and the maximum value of the stratospheric ozone VMR can reach 7131.3–12,665.6 ppb. The average height of the maximum stratospheric ozone VMR is 31.3 km, with the average VMR of 8649 ppb. This average height is 6.4 km higher than that of ozone partial pressure.
- (7)
- The total ozone column ranges from 220.4 to 406 DU. The total ozone in the boundary layer (0–1.5 km) is 4.3 DU on average, accounting for 1.5% in total ozone column. The total ozone in the troposphere is 39.5 DU on average, accounting for 13.1% in total ozone column. The total ozone in the stratosphere is 262.4 Du on average, accounting for 86.9% in total ozone column.
- (8)
- Our study shows that the overall quality of 12 ozone-sounding observations at the Shaowu station in the winter of 2022 is high, and the data reliability is also high. The characteristics of various ozone profiles conform to the general law of the vertical distribution of ozone at low latitudes in the northern hemisphere.
Author Contributions
Funding
Acknowledgments
Conflicts of Interest
References
- Fishman, J.; Ramanathan, V.; Crutzen, P.J.; Liu, S.C. Tropospheric Ozone and Climate. Nature 1979, 282, 818–820. [Google Scholar] [CrossRef]
- Wang, T.J.; Sun, Z.B. Development of Study on Ozone Variation and Its Climatic Effect. Adv. Earth Sci. 1999, 14, 37–42. [Google Scholar]
- Ramanathan, V.; Dickinson, R.E. The Role of Stratospheric Ozone in the Zonal and Seasonal Radiative Energy Balance of the Earth-Tropospheric System. J. Atmos. Sci. 1979, 36, 1084–1104. [Google Scholar]
- Liao, Z.H.; Ling, Z.H.; Gao, M.; Sun, J.R.; Zhao, W.; Ma, P.K.; Quan, J.N.; Fan, S.J. Tropospheric ozone variability over Hong Kong based on recent 20-year (2000–2019) ozonesonde observation. J. Geophys. Res. Atmos. 2020, 126, e2020JD033054. [Google Scholar] [CrossRef]
- Paul, J.; Fortuin, F.; Kelder, H. An Ozone Climatology Based on Ozonesonde and Satellite Measurements. J. Geophys. Res. Atmos. 1998, 103, 31709–31734. [Google Scholar] [CrossRef]
- Wang, W.C.; Pinto, J.P.; Yung, Y.L. Climatic Effects Due to Halogenated Compounds in The Earth’s Atmosphere. J. Atmos. Sci. 1980, 37, 333–338. [Google Scholar] [CrossRef]
- Paul, L. A Seasonal Climatology of the Melbourne 1965–1975 Ozonesonde Record. J. South. Hemisph. Earth Syst. Sci. 2016, 66, 262–269. [Google Scholar]
- Zou, H.; Ji, C.P.; Zhou, L.P.; Wang, W.; Jian, Y.X. ENSO Signal in Total Ozone over Tibet. Adv. Atmos. Sci. 2001, 6, 267–271. [Google Scholar]
- Yang, J.M.; Qiu, J.H.; Zhao, Y.L. A Study of Umkehr Vertical Ozone Profiles of Beijing During 1990–2002. Chin. J. Atmos. Sci. 2005, 29, 709–716. [Google Scholar]
- Lal, S.; Venkataramani, S.; Chandra, N.; Cooper, O.R.; Brioude, J.; Naja, M. Transport Effects on the Vertical Distribution of Tropospheric Ozone over Western India. J. Geophys. Res. Atmos. 2014, 119, 10012–10026. [Google Scholar] [CrossRef] [Green Version]
- Bian, J.C.; Li, D.; Bai, Z.X.; Li, Q.; Daren, L.; Zhou, X. Transport of Asian Surface Pollutants to the Global Stratosphere from the Tibetan Plateau Region During the Asian Summer Monsoon. Natl. Sci. Rev. 2020, 7, 516–533. [Google Scholar] [CrossRef] [PubMed] [Green Version]
- Tilmes, S.; Lamarque, J.F.; Emmons, L.K.; Conley, A.; Schultz, M.G.; Saunois, M.; Thouret, V.; Thompson, A.M.; Oltmans, S.J.; Johnson, B.; et al. Technical Note: Supplemental Material: Ozonesonde Climatology between 1995 and 2011: Description, Evaluation and Applications. Eureka 2012, 2500, 100hPa. [Google Scholar] [CrossRef] [Green Version]
- Logan, J.A.; Megretskaia, I.A.; Miller, A.J.; Tiao, G.C.; Choi, D.; Zhang, L.; Stolarski, R.S.; Labow, G.J.; Hollansworth, S.M.; Bodeker, G.E.; et al. Trends in the Vertical Distribution of Ozone: A Comparison of Two Analyses of Ozonesonde Data. J. Geophys. Res. 1999, 104, 26373–26399. [Google Scholar] [CrossRef]
- Staufer, J.; Staehelin, J.; Stübi, R.; Peter, T.; Tummon, F.; Thouret, V. Trajectory Matching of Ozonesondes and MOZAIC Measurements in the UTLS—Part 2: Application to the Global Ozonesonde Network. Atmos. Meas. Tech. 2013, 6, 7099–7148. [Google Scholar] [CrossRef] [Green Version]
- Shams, S.B.; Walden, V.P.; Petropavlovskikh, I.; Tarasick, D.; Kivi, R.; Oltmans, S.; Bohnson, B.; Cullis, P.; Sterling, C.W.; Thӧlix, L.; et al. Variations in the Vertical Profile of Ozone at Four High-Latitude Arctic Sites from 2005 to 2017. Atmos. Chem. Phys. 2019, 19, 9733–9751. [Google Scholar] [CrossRef] [Green Version]
- Malderen, R.V.; Muer, D.D.; Backer, H.D.; Poyraz, D.; Verstraeten, W.W.; Bock, V.D.; Delcloo, A.W.; Mangold, A.; Laffineur, Q.; Allart, M.; et al. 50 Years of Balloon-Borne Ozone Profile Measurements at Uccle, Belgium: Short History, Scientific Relevance and Achievements in Understanding the Vertical Ozone Distribution. Atmos. Chem. Phys. 2021, 21, 12385–12411. [Google Scholar] [CrossRef]
- Liu, Q.J.; Zheng, X.D.; Luo, C.; Tang, J.; Ding, G.A.; Li, X.S.; Zhou, X.J. Intercomparison Of Ozone Vertical Profiles Between ECC Ozonesonde and Brewer Umkehr Made over Qinghai Plateau of China. Acta Meteorol. Sin. 1998, 12, 103–111. [Google Scholar]
- Song, Y.S.; Lu, D.; Li, Q.; Bian, J.C.; Wu, X.; Li, D.R. The Impact of Cut-off Lows on Ozone in the Upper Troposphere and Lower Stratosphere over Changchun from Ozonesonde Observations. Adcances Atmos. Sci. 2016, 33, 135–150. [Google Scholar] [CrossRef]
- Zhang, J.; Li, D.; Bian, J.C.; Xuan, Y.J.; Chen, H.B.; Bai, Z.X.; Wan, X.W.; Zheng, X.D.; Xia, X.G.; Lu, D.R. Long-Term Ozone Variability in the Vertical Structure and Integrated Column over the North China Plain: Results Based on Ozonesonde and Dobson Measurements during 2001–2019. Environ. Res. Lett. 2021, 16, 074053. [Google Scholar] [CrossRef]
- Shi, G.Y.; Xu, L.; Lu, W.X.; Ren, L.X.; You, R.G.; Zengmei, T.; Lwata, A.; Gonghong, M.; Feng, K. Balloon Observations of the Vertical Distribution of Atmospheric Ozone and Aerosols from 0 to 33 km. Chin. Sci. Bull. 1986, 31, 1165–1167. [Google Scholar] [CrossRef] [Green Version]
- Liu, Q.J.; Zheng, X.D.; Luo, C.; Tang, J.; Ding, G.A.; Li, X.S.; Zhou, X.J. Ozone Vertical Profile Characteristics over Qinghai Plateau Measured by Electrochemical Concentration Cell Ozonesondes. Adv. Atmos. Sci. 1997, 14, 481–490. [Google Scholar]
- Kunz, H.; Speth, P. Variability of Near-Ground Ozone Concentrations During Cold front Passages—A Possible Effect of Tropopause Folding Events. J. Atmos. Chem. 1997, 28, 77–95. [Google Scholar] [CrossRef]
- Cui, H.; Zhao, C.S.; Zheng, X.D.; Zheng, Y.G.; Qin, Y.; Chen, Z.Y.; Chen, L.Y. Analysis of an Extraordinary Tropospheric Ozone Enhancement Event at Lin-An in the Spring of 2001. Chin. J. Atmos. Sci. 2005, 29, 259–266. [Google Scholar]
- Yang, J.; Lu, D.R. Simulation of Stratosphere-Troposphere Exchange Effecting on the Distribution of Ozone over Eastern Asia. Chin. J. Atmos. Sci. 2004, 28, 581–588. [Google Scholar]
- Ma, Z.Q.; Zhang, X.L.; Xu, J.; Zhao, X.J.; Meng, W. Characteristics of Ozone Vertical Profile Observed in the Boundary Layer Around Beijing in Autumn. J. Environ. Sci. 2011, 23, 1316–1324. [Google Scholar] [CrossRef]
- Zhang, W.; Zou, Y.; Zheng, X.D.; Wang, N.; Yan, H.; Chen, Y.P.; Zhao, X.J.; Ji, Z.P.; Li, F.; Mai, B.R.; et al. Characteristics of the Vertical Distribution of Tropospheric Ozone in Late Autumn at Yangjiang Station in Pearl River Delta (PRD), China. Part Ⅰ: Observed Event. Atmos. Environ. 2021, 244, 117898. [Google Scholar] [CrossRef]
- Liang, W.J.; Yang, Z.; Luo, J.L.; Tian, H.Y.; Bai, Z.X.; Li, D.; Li, Q.; Zhang, J.Q.; Wang, H.Y.; Ba, B.; et al. Impact of the Atmospheric Apparent Heat Source over the Tibetan Plateau on Summertime Ozone Vertical Distribution over Lhasa. Atmos. Ocean. Sci. Lett. 2021, 14, 100047. [Google Scholar] [CrossRef]
- Wang, G.C.; Kong, Q.X.; Chen, H.B.; Xuan, Y.J.; Wan, X.W. Characteristics of Ozone Vertical Distribution in the Atmosphere over Beijing. Adv. Earth Sci. 2004, 19, 743–748. [Google Scholar]
- Peng, L.; Gao, W.; Geng, F.H.; Ran, L.; Zhou, H.R. Analysis of Ozone Vertical Distribution in Shanghai Area. Acta Sci. Nat. Univ. Pekin. 2001, 47, 805–811. [Google Scholar]
- Zheng, Y.G.; Chen, L.Y.; Chen, Z.Y.; Cui, H.; Zheng, X.D.; Qin, Y. Comparison of Characteristics of Ozone Vertical Distribution above Lin. an, Kunming, and Hong Kong during Spring 2001. Acta Sci. Nat. Univ. Pekin. 2005, 41, 104–114. [Google Scholar]
- Zhao, Q.; Liu, Y.; Guan, Z.Y.; Lu, C.H.; Cai, Z.N. Anomalous Feature of Ozone in Upper Troposphere/Lower Stratosphere over Beijing in Winter 2008. Trans. Atmos. Sci. 2015, 38, 796–803. [Google Scholar]
- Kong, Q.X.; Wang, G.C.; Liu, G.R.; Gu, Z.F.; Wan, X.W.; Bai, Y.A. Electrochemical Measurement of the Vertical Distribution of Ozone in the Atmosphere. Sci. Atmos. Sin. 1992, 16, 636–640. [Google Scholar]


| Terms | Maximum Height/km | Tropopause */km | Ozone Partial Pressure | Ozone Partial Pressure | Ozone VMR | |||
|---|---|---|---|---|---|---|---|---|
| Maximum /mPa | Height with Maximum/km | Minimum /mPa | Height with Minimum/km | Maximum /ppb | Height with Maximum/km | |||
| Range | 33.6–39.0 | 15.6–18.2 | 12.0–16.6 | 21.8–29.0 | 0.3–1.5 | 12.7–17.1 | 7131.3–12,665.6 | 29.4–34.3 |
| Average | 37.2 | 17.2 | 14.0 | 24.9 | 0.8 | 14.6 | 8649.0 | 31.3 |
| Terms | Boundary Layer | Troposphere | Stratosphere |
|---|---|---|---|
| Range/DU | 2.4—7.3 | 32.0—48.2 | 185.0—363.1 |
| Average/DU | 4.3 | 39.5 | 262.4 |
| Proportion/% | 1.5% | 13.1% | 86.9% |
Publisher’s Note: MDPI stays neutral with regard to jurisdictional claims in published maps and institutional affiliations. |
© 2022 by the authors. Licensee MDPI, Basel, Switzerland. This article is an open access article distributed under the terms and conditions of the Creative Commons Attribution (CC BY) license (https://creativecommons.org/licenses/by/4.0/).
Share and Cite
Zheng, Y.; Deng, H.; You, H.; Qiu, Y.; Zhu, T.; Cheng, X.; Wang, H. A Study of the Vertical Distribution and Sub-Peaks of Ozone below 12 km over Wuyishan Region Based on Ozone Sounding in Winter. Atmosphere 2022, 13, 979. https://doi.org/10.3390/atmos13060979
Zheng Y, Deng H, You H, Qiu Y, Zhu T, Cheng X, Wang H. A Study of the Vertical Distribution and Sub-Peaks of Ozone below 12 km over Wuyishan Region Based on Ozone Sounding in Winter. Atmosphere. 2022; 13(6):979. https://doi.org/10.3390/atmos13060979
Chicago/Turabian StyleZheng, Yulan, Huiying Deng, Huabiao You, Yiming Qiu, Tianfu Zhu, Xugeng Cheng, and Hong Wang. 2022. "A Study of the Vertical Distribution and Sub-Peaks of Ozone below 12 km over Wuyishan Region Based on Ozone Sounding in Winter" Atmosphere 13, no. 6: 979. https://doi.org/10.3390/atmos13060979