Article

Impact of Environmental Regulation on Efficiency of Green Innovation in China

1
School of Statistics, Dongbei University of Finance and Economics, Dalian 116021, China
2
School of Statistics and Big Data, Henan University of Economics and Law, Zhengzhou 450046, China
*
Author to whom correspondence should be addressed.
Atmosphere 2022, 13(5), 767; https://doi.org/10.3390/atmos13050767
Submission received: 7 April 2022 / Revised: 6 May 2022 / Accepted: 6 May 2022 / Published: 9 May 2022
(This article belongs to the Special Issue Advanced Climate Simulation and Observation)

Abstract

:
The implementation of a reasonable and effective environmental regulation policy can compensate for the dual externalities of green technology innovation and improve green innovation efficiency. Therefore, environmental regulation policy has gradually become an effective means of solving ecological environment problems and achieving green industrial transformation. This paper measures the green innovation efficiency of 30 provinces in China from 2009 to 2019 using the SBM (slacks-based measure) of super-efficiency based on the undesirable output. The dynamic panel regression model is established to explore the impact of different environmental regulations on green innovation efficiency and regional differences. The results reveal that the green innovation efficiency of the 30 provinces shows a fluctuating upward trend, but that differences among provinces are relatively significant. There is a nonlinear relationship between environmental regulation and green innovation efficiency. The impact of command-control and market incentive environmental regulations on green innovation efficiency shows inverted N-shaped and U-shaped patterns, respectively. In different regions, the impact of environmental regulation on green innovation efficiency is also different. In order to ensure that environmental regulation promotes green innovation efficiency, some recommendations are proposed for the government, enterprises, and three regions, respectively.

1. Introduction

The public nature of environmental resources and the externalities of ecological damage have long made it difficult to solve the problem of sustainable economic development solely by market mechanisms. However, green innovation technology can effectively alleviate increasingly severe ecological and environmental problems, reduce pollution emissions, and save energy consumption. It has become an essential means to promote sustainable and green economic development in China. Green innovation efficiency is used as a measure of green innovation technology. It is characterized by positive knowledge spillover externalities and negative environmental externalities. However, the effect is minimal, relying only on the autonomous allocation of regional innovation resources. The implementation of a reasonable and effective environmental regulation policy can compensate for the dual externalities of green technology innovation and improve green innovation efficiency [1]. Therefore, environmental regulation policy has gradually become an effective means of solving ecological environment problems and achieving green industrial transformation.
The impact mechanism of environmental regulation on green innovation efficiency is shown in Figure 1. In order to maintain a good state of the local environment, the government needs to adopt some environmental regulation policies, such as limiting emission standards and technical standards for enterprises. Suppose the intensity of environmental regulation is relatively low; in that case, the requirement of pollutant restrictions is not high, and the increased cost of pollutant discharge may be less than the cost of technological innovation. Therefore, enterprises will choose to increase pollution control expenditure to cope with environmental regulations, which will occupy the funds initially planned for innovation, to the detriment of the efficiency of green innovation. In the meantime, some enterprises from areas with high environmental regulation intensity or foreign enterprises may be attracted to move in. These enterprises will compete with existing enterprises, reducing the share of green innovation investment of local enterprises. Moreover, the excessive concentration of enterprises will generate additional undesirable outputs and cause a so-called “pollution paradise”, which is not conducive to green development.
Technological innovation is a better choice if the emission standards are set high in the long run. By improving their production processes, enterprises can, on the one hand, reduce the consumption of resources and the emission of pollutants and meet the emission standards required by the government, and, on the other hand, improve production efficiency, promote upgrading industrial structure, and enhance competitiveness, which is conducive to the sustainable development of enterprises and the development of local green innovation in the long run. Nevertheless, higher intensity of environmental regulation may not continue to promote green innovation efficiency, but rather, lead to some unintended consequences. The government must grasp the intensity of environmental regulations based on local conditions, which can promote green innovation efficiency without damaging the interests of local enterprises.

2. Literature Review

2.1. Review of Green Innovation Efficiency

Research on green innovation efficiency mainly takes the form of measurements of green innovation efficiency and analyses of influencing factors. For the measurement methods of green innovation efficiency, there are mainly data envelopment analyses (DEA) [2,3,4], stochastic frontier analyses [5,6], and multivariate statistical analyses [7]. Most of the literature measuring China’s green innovation efficiency shows that the overall efficiency value is gradually increasing, but that there are significant differences among regions [8,9]. There are influencing factors to positively promote green innovation efficiency, such as government scientific research sponsorship [10], public participation [11], and industrial agglomeration [12]. Since the process of green innovation will produce both desirable and undesirable outputs, this paper chooses the SBM of super-efficiency based on undesirable outputs to measure green innovation efficiency.

2.2. Review of Environmental Regulation

Environmental regulation means that the government standardizes the behavior of enterprises with a view to protect the environment. Environmental regulation can encourage enterprises to reform and innovate pollution control technology at a micro level. Environmental regulation can also guide enterprises to restructure and promote the upgrading of industrial structure at a macro level. At present, there are three types of environmental regulation policies in China, including command-control, market incentive, and public voluntary. The first two types of environmental regulations are called formal environmental regulations, and the last one is called informal environmental regulations. There are no unified indicators for measuring the intensity of environmental regulation. Scholars generally develop the indicators of environmental regulation intensity according to research issues and data availability. The main types of measurement are as follows: (a) the proportion of the cost of pollution control in industry added value [13] or GDP [14]; (b) indexes of the removal rate of pollutants, such as the standard discharge rate of industrial wastewater and the removal rate of sulfur dioxide [15], or the weighted composite index of various removal rate index of pollutants [16]; (c) pollutant emissions per unit output value [17,18]; (d) the ratio of pollution treatment investment to pollutant emissions [19,20].
Studies have shown that various environmental regulations can significantly affect energy saving and emission reduction [21]. Moreover, environmental regulation can promote technological and green innovation, thus boosting regional economic development [22,23,24]. The joint development of command-control environmental regulations and market incentive environmental regulations can play a better role [25]. Most of the literature analyses environmental regulation using only a single means without considering the differences in the effects of different environmental regulation means. This paper selects two significant environmental regulation policies, namely command-control and market incentive environmental regulation, to analyze the difference in effect.

2.3. Research on Impact of Environmental Regulation on Green Innovation Efficiency

Research on the impact of environmental regulation on green innovation efficiency can be divided into the following three perspectives:
(1)
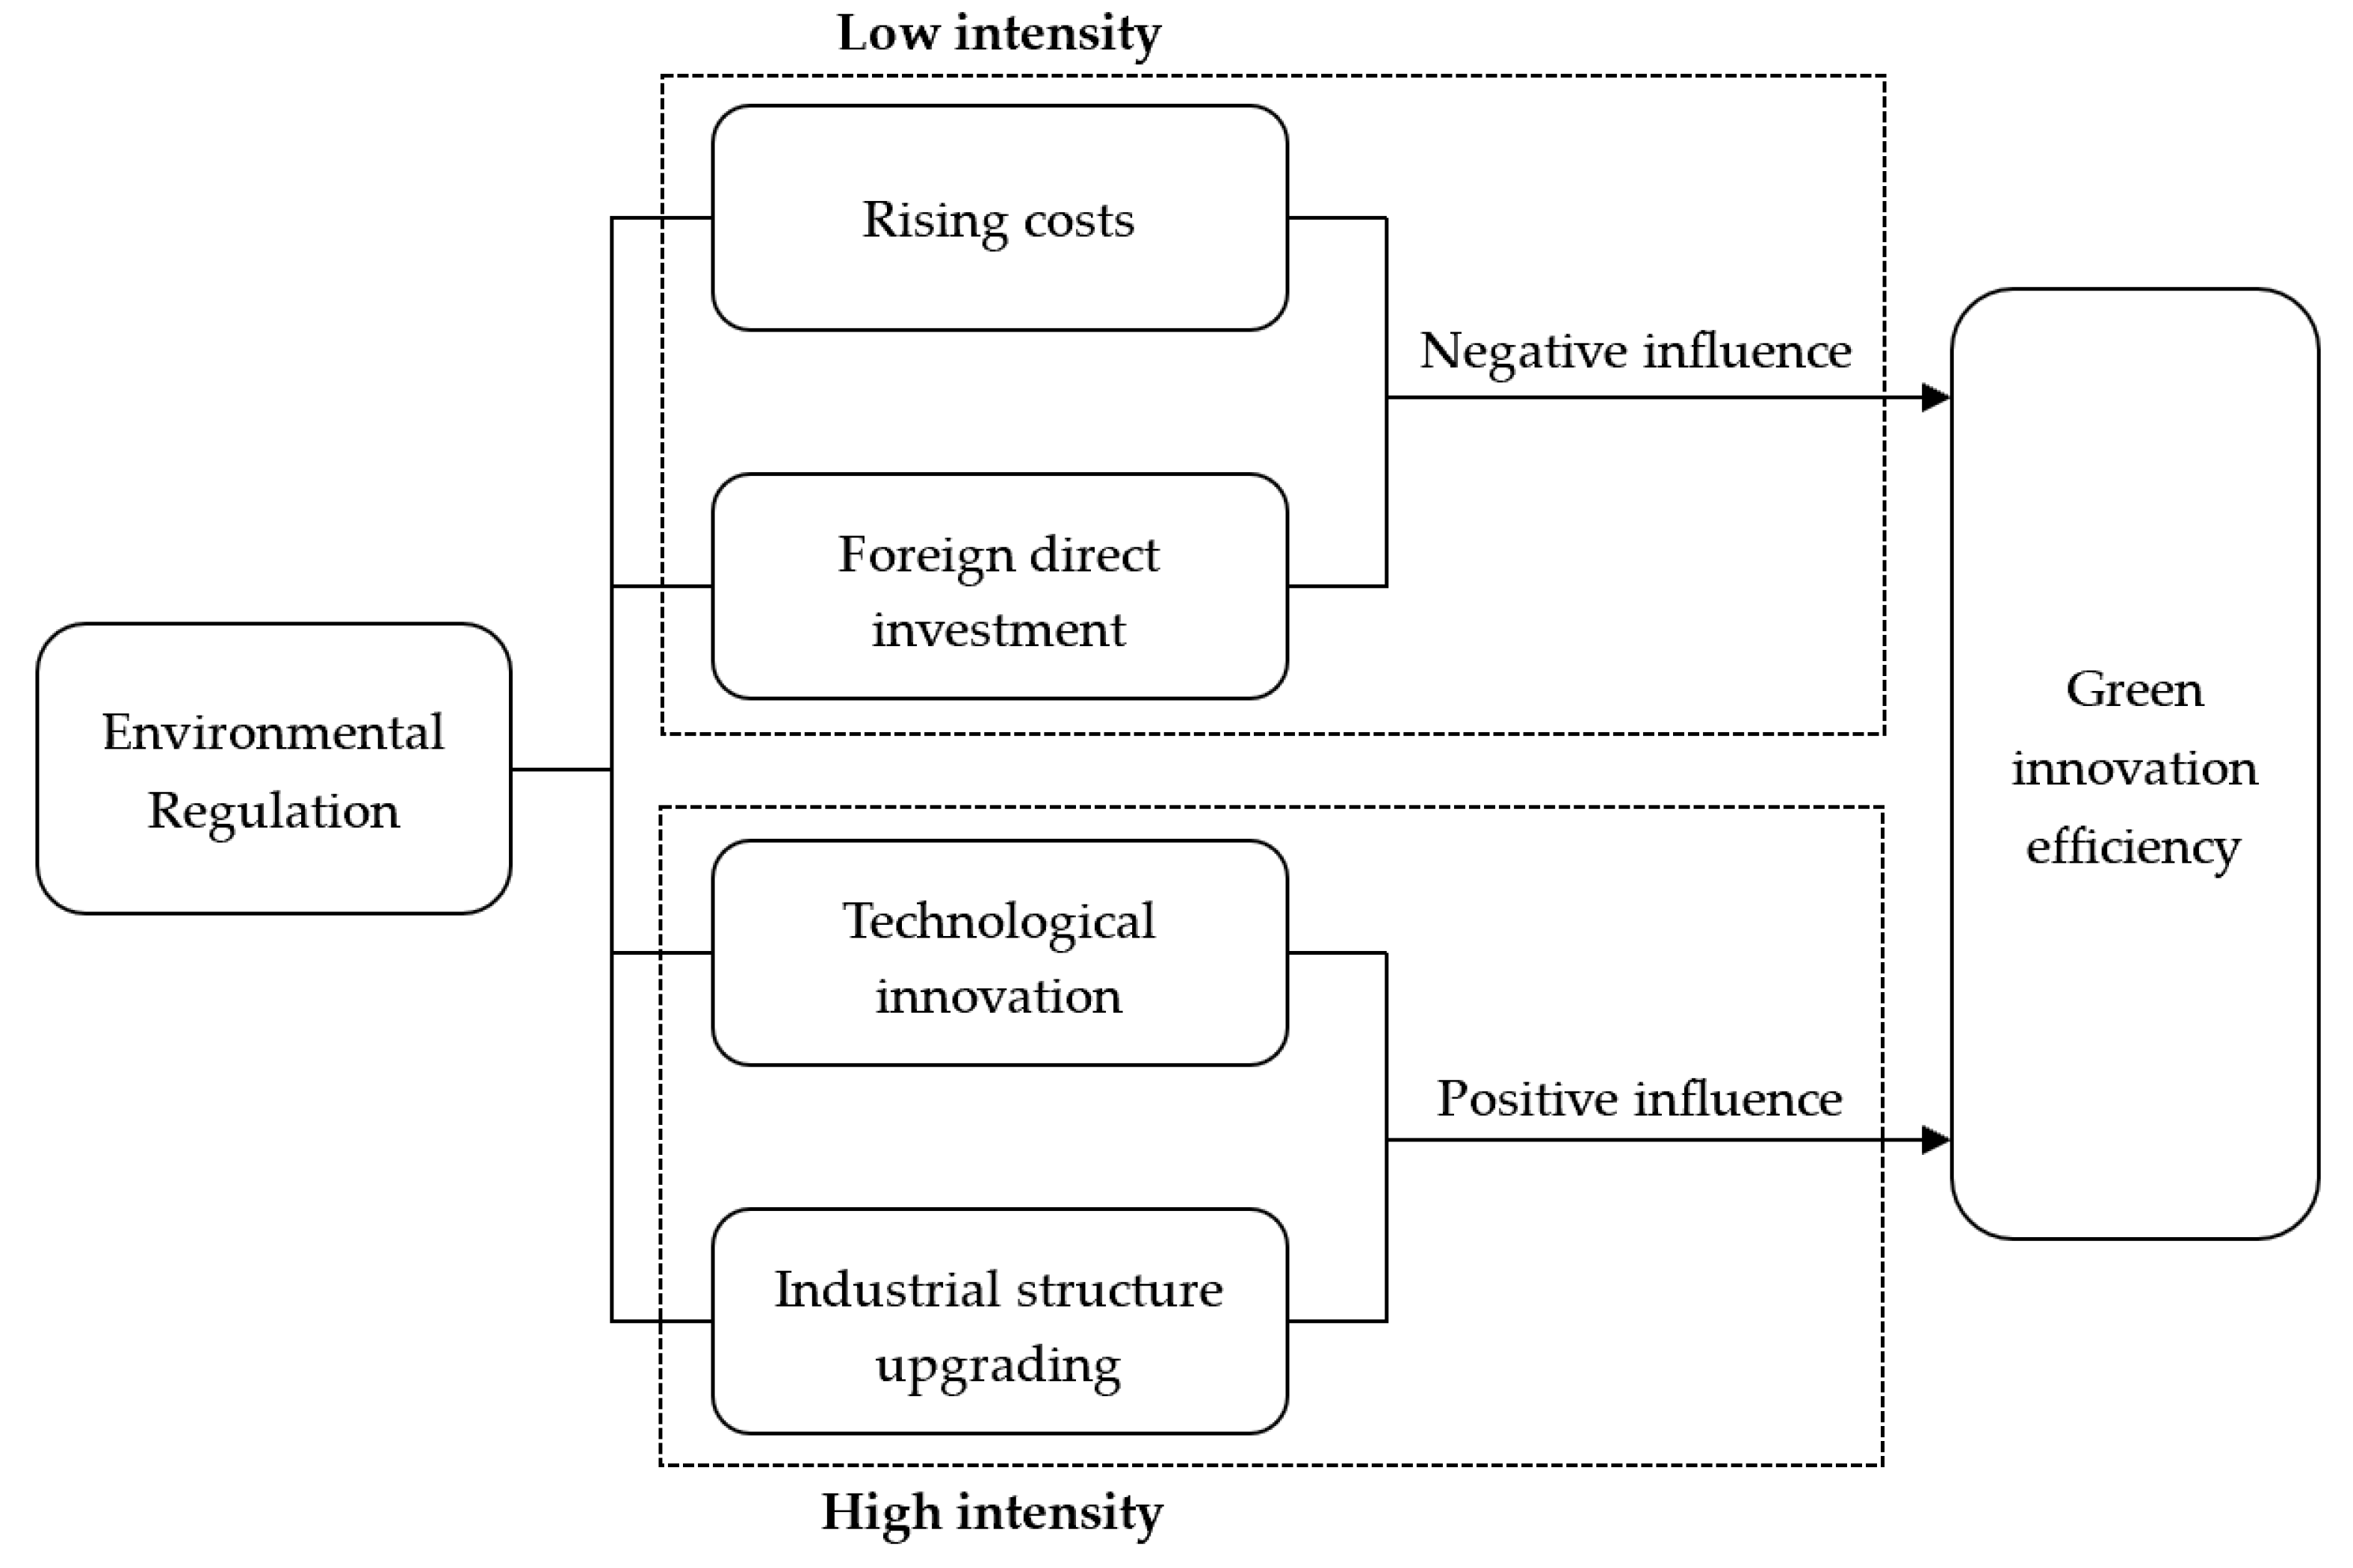
Scholars who support the “Porter hypothesis” believe that environmental regulation will encourage enterprises to embrace technological innovation, which, in turn, improves the green innovation efficiency of society as a whole. Brunnermeier and Cohen found that for every $1 increase in environmental governance costs, green innovation efficiency would increase by 0.4% on average [26]. Castellacci and Lie found that mandatory environmental regulations had a potent positive effect on green innovation efficiency [27]. Singh et al. found that environmental regulation policies in Japan drove green innovation efficiency for society as a whole [28]. Zhang and Wang found that both environmental regulation policies and government financial support have a positive effect on green innovation efficiency, but that the former has a greater impact [29]. Wang and Zhang (2018) argued that different environmental regulation policies would positively promote green innovation efficiency, and command-control environmental regulation has a more significant promoting effect [30]. Wang and He (2022) believed that environmental regulation could promote green innovation, and green innovation can promote the upgrading of industrial structures [31].
(2)
Other scholars argue that environmental regulations are not conducive to green innovation efficiency because strict restrictions on environmental emissions may increase the costs of enterprises. Domazlicky and Weber argued that the benefits of technological change brought about by environmental regulations could not compensate for the increased costs to the enterprises [32]. Sinn proposed the “green paradox”, arguing that environmental regulations increased the expenditure of enterprises on emission reduction and reduced the efficiency of green innovation [33]. Li and Bi believed that environmental regulation is not conducive to the technological progress of enterprises and green innovation [34].
(3)
Another view is that the impact of environmental regulation on green innovation efficiency is uncertain. Kneller and Manderson argued that mandatory environmental regulation policies would increase the costs of pollutant reduction and R&D (Research and Development) in the UK while having little impact on the total capital accumulation [35]. Peuckert pointed out that environmental regulation would squeeze expenditure, inhibit technological innovation in the short run, and promote development in the long run [36]. Peng et al. found that formal and informal environmental regulation policies showed a U-shaped and inverted U-shaped relationship with green innovation efficiency, respectively [37]. Luo and Chen found that environmental regulations have a non-linear relationship with green efficiency through the threshold regression model [38]. Gao and Xiao believed that autonomous environmental regulations have a U-shaped impact on improving the green innovation efficiency of industrial enterprises [39].
Based on the above analysis, existing studies have stated that environmental regulations have positive, negative, and uncertain effects on green innovation efficiency. This effect is considered from a national perspective, with little consideration for inter-regional heterogeneity. This paper constructs a dynamic panel system GMM model to analyze the impact of different types of environmental regulations on green innovation efficiency. A regression model was established for the eastern, central, and western regions to analyze the regional differences.

3. Research Method

3.1. SBM of Super-Efficiency

The traditional models of Data Envelopment Analysis (DEA) are radial measures of efficiency, requiring that the input and output change in the same proportion. However, it is not easy to meet this condition in actual production. Based on the traditional DEA model, Tone proposed a slacks-based measure of efficiency (SBM), which is non-radial and deals with input/output slacks directly [40]. Tone proposed the SBM of super-efficiency, an evolutionary form of SBM in the following year, which can further evaluate Decision Making Units (DMUs) with an efficiency value greater than 1 to obtain more accurate efficiency results [41]. This paper uses the SBM of super-efficiency to measure the green innovation efficiency of provinces in China. The model is as follows.
ρ * = min 1 m i = 1 m x ¯ i x i k 1 s 1 + s 2 r = 1 s 1 y ¯ r d y r k d + q = 1 s 2 y ¯ q u y q k u s . t . x ¯ j = 1 , k n λ j x i j y ¯ d j = 1 , k n λ j y r j g y ¯ u j = 1 , k n λ j y q j b λ j 0 , i = 1 , 2 , , m ; j = 1 , 2 , , n ; r = 1 , 2 , , s 1 ; q = 1 , 2 , , s 2
where ρ * is the efficiency of green innovation, whereby the higher the efficiency value, the higher the level of green innovation; x , y d , and y u represent the necessary elements in the input matrix, the desirable output matrix, and the undesirable output matrix, respectively; and n represents the number of DMU, namely the number of provinces in this paper ( n = 30 ). Each DMU has m inputs, s 1 desirable outputs, and s 2 undesirable outputs. λ is the weight vector.

3.2. Kernel Density Estimation

The Kernel Density Estimation (KDE) method, first proposed by Parzen, is a non-parametric test method for solving the probability density function of random variables [42]. It can analyze the dynamic evolution characteristics of the sample distribution according to the sample data. Compared with the parameter estimation method, the functional form of the kernel density can be set flexibly with few restrictions on the data, which is one of the common methods to study the unbalanced distribution. The expression of kernel density estimation is as follows.
f h x = 1 n h i 1 n K x x i h
In Formula (2), f x represents the density function of green innovation efficiency. n is the number of observed provinces. h represents the bandwidth, and its value affects the shape and smoothness of the KDE curve. The smaller the bandwidth, the higher the estimation accuracy. x i represents the green innovation efficiency of i province, and x represents the mean value of the green innovation efficiency. K is the kernel function. The Gaussian kernel function is uesde in this paper to estimate the dynamic evolution of the distribution of green innovation efficiency, as shown in Formula (3).
K x = 1 2 π exp ( x 2 2 )

3.3. System-GMM

This paper adopts the dynamic GMM (Generalized Method of Moments) model to measure the impact of environmental regulation on green innovation efficiency. The dynamic GMM model can effectively overcome the biased regression results caused by autocorrelation in the regression process. GMM estimation mainly includes the difference GMM and the system GMM. In contrast, the system GMM reduces some omission errors caused by the difference GMM, effectively improving the estimation efficiency [43]. In empirical research, the system GMM method is preferred for estimates. From the above analysis, it can be seen that there is not only a linear relationship between environmental regulation and green innovation efficiency; in order to verify whether there is a more complex linear relationship between environmental regulation and green innovation efficiency, a cubic term of environmental regulation intensity is introduced. The production process of green innovation is a process of continuous accumulation and dynamic adjustment, which may be affected by the previous period of green technology innovation. It is necessary to introduce the lag term of green innovation efficiency. Therefore, the dynamic panel GMM model is established as follows.
G I i , t = α 0 + α 1 G I i , t 1 + β 1 E R i , t + β 2 E R i , t 2 + β 3 E R i , t 3 + γ m K i , t + u i + ε i , t
where G I i , t represents the green innovation efficiency of i province in t year; G I i , t 1 is the first-order lag term of green innovation efficiency; α 0 is a constant term; E R represents the intensity of environmental regulation, which is the core explanatory variable; β 1 , β 2 , and β 3 are the coefficient terms of the core explanatory variables; K i , t is the control variable and γ m is the coefficient term of the control variable; finally, u i represents the individual effect and ε i , t represents the random error term. Different β coefficient values lead to different trend characteristics of regression curve, as shown in Table 1.

3.4. Indicator Selection and Variable Description

3.4.1. Construction of Green Innovation Efficiency System

Based on relevant literature [7,8], this paper comprehensively considers the entire input and output process of green innovation and constructs the system of green innovation efficiency from the perspectives of input, desirable output, and undesirable output, as shown in Table 2.

3.4.2. Measurement of Environmental Regulation Intensity

There are currently three main types of environmental regulation policies in China. The two most important types concern command-control and market incentives. The third type is the public-voluntary environmental regulation policy which lacks data. Therefore, this paper selects the first two types of environmental regulation policies as the research objects and measures the intensity of the two environmental regulation policies, respectively.
Command-control environmental regulation refers to the use of mandatory measures by the government on enterprises to achieve a specific environmental goal and the formulation of a series of standards to regulate the behavior of enterprises, including emission standards, technical standards, etc. Based on emission standards, this paper looks for indicators to measure the intensity of command-control environmental regulation [17,18]. According to the current situation of pollutant discharge in China and the availability of data, the comprehensive index of three types of pollutant is measured as the intensity of command-controlled environmental regulation, including industrial soot emissions, industrial sulfur dioxide emissions, and industrial wastewater emissions. The data source for the three types of pollutant is China Statistics Yearbook on Environment. The calculation formulas are as follows.
R i j s = R i j min R j max R j min R j
W j = R i j / R ¯ j
E R 1 = 1 3 j = 1 3 W j × R i j s
In Formula (5), R i j represents the emission of the pollutant j in province i , and R i j s represents the standardized result; min R j and max R j represent the maximum and maximum value of the emissions of the pollutant j in all provinces, respectively. In Formula (6), W j represents the weight of the pollutants j , and R ¯ j represents the average emission of the pollutants j in all provinces. In Formula (7), E R 1 represents the intensity of command-control environmental regulation, which is the weighted average of the three pollutants.
Market incentive environmental regulation encourages enterprises to find technologies and methods to reduce pollutant emissions through economic means in order to minimize the degree of environmental pollution. Currently, the measures include levying an emissions tax on enterprises and establishing a system of emission rights trading and emission fee. The systems of emissions tax and emission rights have not played a good role in China, but the pollutant discharge fee system was implemented earlier. Therefore, the intensity of market-incentive environmental regulation ( E R 2 ) is measured by the proportion of pollutant discharge fees ( P F ) to regional GDP ( G D P ), as shown in Formula (8). The data on pollutant discharge fees and regional GDP respectively come from the China Environmental Statistical Yearbook and the China Statistical Yearbook.
E R 2 = P F G D P

3.4.3. Variable Description

This paper selects the panel data of 30 provinces from 2009 to 2019 to construct the dynamic GMM model. The variable description is shown in Table 3. The data of control variables came from the China Statistical Yearbook, China Statistical Yearbook on Science and Technology, and China Industrial Economy Statistical Yearbook.

4. Analysis of Empirical Results

4.1. Measurement and Analysis of Green Innovation Efficiency in China

4.1.1. Evolution of Green Innovation Efficiency

This paper uses MATLAB to measure the green innovation efficiency of 30 provinces. The results are shown in Appendix A, Table A1. In order to more intuitively see the evolution of green innovation efficiency in 30 provinces, a spatial distribution map of green innovation efficiency was drawn for 30 provinces in 2009 and 2019 by ArcGIS, as shown in Figure 2.
The evolution of green innovation efficiency from 2009 to 2019 shows that the value of efficiency is gradually improving in China. The number of provinces with low green innovation efficiency is gradually decreasing. In 2009, the number of provinces with low green innovation efficiency was 12, but only six remained in 2019. There are 12 provinces whose average value of green innovation efficiency is greater than one over the ten years. Most provinces are developed coastal provinces and key provinces supported by the government with a better natural environment. The green innovation efficiency of developed provinces is higher because they have better development opportunities, attract more talents, and produce more creative output. Beijing has the highest average green innovation efficiency at 1.9873. Research institutes in Beijing, with the largest number, attract many talents every year. Beijing enjoys excellent development conditions, and its innovation level is at the forefront in China. Beijing is also the first province to implement an environmental policy in China. It was better to control pollution discharge as a pilot of pollution discharge rights. Some remote provinces with a beautiful environment may not have much input in innovation but enjoy more government support policies. Their values of green innovation efficiency are relatively high due to the low green undesirable output. The average value of green innovation efficiency in Xinjiang ranks second at 1.2849. The green innovation efficiency increased the most in Qinghai, from 0.2332 in 2009 to 1.0104 in 2019, increasing more than four times.
From the perspective of various regions, the green innovation efficiency of eastern provinces is higher than that of other regions, especially some coastal provinces, such as Jiangsu, Zhejiang, and Guangdong, whose green innovation efficiency stays at a high level. The green innovation efficiency of provinces in central China is at a middle level, but there are still some provinces with low green innovation efficiency. For example, the average innovation efficiency in Heilongjiang is the lowest, mainly because the traditional industry is relatively developed in the early years, causing sizeable environmental pollution, and the transformation process to the new technology industry is still slow. Although the economy in western China is less developed, the green innovation efficiency is not at a low level, especially the green innovation efficiency in Xinjiang is at the forefront of the country.

4.1.2. Dynamic Evolution of Green Innovation Efficiency

This paper uses the KDE method to analyze the dynamic distribution situation of green innovation efficiency for 30 provinces in China. The years 2010, 2013, 2016, and 2019 were selected as observation time points to draw Kernel density curves for the four years, as shown in Figure 3.
As shown in Figure 3, the center of the green innovation efficiency distribution curve in China has shifted significantly to the right, indicating that the green innovation efficiency of each province has gradually improved over time. In terms of distribution shape, the four curves show a broad distribution, and the right tails tend to be elongated, indicating that there are significant differences in the green innovation efficiency among provinces. The kernel density curve in 2013 shows a unimodal distribution, while the curves in 2016 and 2019 are characterized by a clear bimodal distribution, indicating a trend toward polarization of the green innovation efficiency in China. As there are many provinces with green innovation efficiency of around 1, the main peak of the four curves increases significantly, while the height of the small peak in the right tail tends to decline slowly. The difference between provinces with low green innovation efficiency is expanding, while the difference between provinces with high green innovation efficiency is narrowing. The evolution of green innovation efficiency in China is not coordinated among different regions. The four curves are right-skewed distribution. The vertical height of the peak increases, and the horizontal width decreases over time. Although there are regional differences in green innovation efficiency in China, such differences are gradually narrowing and have the characteristics of dynamic convergence.

4.2. Impact of Environmental Regulation on Green Innovation Efficiency

4.2.1. Empirical Analysis of the Impact Effect of Different Environmental Regulations

This paper adopts the dynamic panel system GMM model for regression analysis to analyze the impact of different environmental regulations on green innovation efficiency. In order to prevent heteroscedasticity, non-proportional indicators were logarithmically treated. Stata was used to obtain regression results, as shown in Table 4. First of all, the rationality of variables and regression model selection is analyzed. ADF tests are performed on the variables, all of which are stationary. The p-value of AR(2) of the two models is greater than 0.05, indicating that there was no serial correlation, which proved the rationality of the model selection. The p-value of Sargan’s test is greater than 0.05, which makes it difficult to reject the null hypothesis that all instrumental variables are valid, indicating that the instrumental variables selected by the system GMM model are reasonable.
To verify the effect of time variation in green innovation efficiency on the accuracy of the regression model, a static panel regression model is also constructed and compared with the dynamic panel regression model in this paper. A new index (DISO, distance between indices of simulation and observation) can comprehensively describe the overall performance of different models, with smaller values of DISO indicating higher model prediction accuracy. See Hu et al. and Zhou et al. for the calculation method of DISO [44,45]. The DISO values for the static panel models of command-control and market incentive environ-mental regulation are 0.93 and 0.96, respectively. The DISO values for the dynamic panel regression models of command-control and market incentive environ-mental regulation are 0.57 and 0.54, respectively. The comparison results show that the dynamic panel model outperforms the static panel model for both the command-control and market incentive environmental regulation. Adding time-varying factors of dependent variables can indeed improve model prediction accuracy. As can be seen from Table 4, the lag term L . G I of green innovation efficiency passes the significance test, indicating that the green innovation efficiency of the previous period has a very significant promoting effect on the current period. The green innovation activity is a continuous and dynamic accumulation process. The technological progress and innovation activity in the previous period will influence green innovation in the subsequent period.
The two types of environmental regulation intensity have different effects on green innovation efficiency. Specifically, the regression curve between the intensity of command-control environmental regulation and the green innovation efficiency shows an inverted N-shaped pattern, with a downward-upward-downward trend. In the first stage, before reaching the inflection point of 0.5071, the increase in pollution control costs drains the funds for technological innovation. The green innovation efficiency decreases with the increase of environmental regulation intensity. When the intensity of command-control environmental regulation exceeds 0.5071, the second stage is reached. At this stage, most enterprises begin to choose to carry out technological innovation, and command-control environmental regulation plays a role in promoting green innovation efficiency. When the intensity of command-control environmental regulation reaches the second inflection point 1.3677, the green innovation efficiency decreases again. The possible reason is that when the intensity of environmental regulations is too high, some enterprises fail to meet the standards or turn to operate in areas with less stringent environmental regulations. In this case, the green innovation efficiency will decline. In other words, if command-control environmental regulation is to promote green innovation efficiency, the intensity of environmental regulation should be controlled between the two inflection points.
The regression curve between market incentive environmental regulation intensity and green innovation efficiency shows a U-shaped pattern. When the intensity of market incentive environmental regulation does not reach the inflection point 1.2461, the cost of enterprises to pollutant discharge is low. Therefore, most enterprises do not choose to carry out technological innovation. As the intensity of environmental regulation increases, the cost of pollutant discharge increases, while the fund for technological innovation and the green innovation efficiency decreases. When the environmental regulation intensity index rises again, reaching 1.2461, the cost of pollutant discharge is already very high. Most enterprises tend to innovate to reduce pollution at the source. On the right side of the inflection point, green innovation efficiency increases with the increase of environmental regulation intensity.
Government support, urbanization, technological progress, openness, and industrial structure optimization positively affect green innovation efficiency. Government support has the greatest impact. Innovation is inseparable from high-tech development industries, for which government support is vital. A place with a high level of urbanization will have better conditions for innovation and development, attracting more high-tech industries to promote the development of green innovation efficiency. There is no doubt that technological progress can contribute to green innovation efficiency and enable enterprises to produce more output with less input. The impact of openness on green innovation efficiency is significantly positive. Places with a high degree of openness to trade are likely to attract capital and talent inflows, which lead to technological innovation and promote green efficiency development. Industrial structure optimization refers to the transformation of knowledge-intensive industries, which is conducive to improving energy efficiency, reducing the impact on the ecological environment, and promoting green innovation efficiency. Human capital has a negative impact on green innovation efficiency, indicating that the negative effect of pollution brought by human input is higher than the positive effect of innovation.

4.2.2. Regional Model Estimation

The economic development and resource endowments of 30 provinces in China are not uniform. It would be inappropriate to formulate the same policies on environmental regulation according to the national situation. In order to explore whether there are differences in the impact of environmental regulation on green innovation efficiency in different regions, 30 provinces are divided into three regions (eastern, central, and western regions). The regressions were conducted separately for the three regions, and the estimated results for the core explanatory variables are shown in Table 5.
As shown in Table 5, the impacts of environmental regulations on green innovation efficiency among the eastern, central, and western regions are different. The regression curve between the intensity of command-control environmental regulation and green innovation efficiency in eastern China shows an inverted U-shaped pattern. When the intensity of environmental regulation does not exceed inflection point 1.619, improving the intensity of command-control environmental regulation can positively promote green innovation efficiency. If the intensity of environmental regulation is set too high, it will cause great pressure on some enterprises and reduce their profits. Some enterprises will choose to move to places with less stringent environmental regulations, which is not conducive to the development of local green innovation efficiency. Market incentive environmental regulation plays a direct role in promoting green innovation efficiency, which is related to the sufficient capital and talent reserve in eastern China. When the intensity of market incentive environmental regulation increases, there are more opportunities to enhance technological innovation in eastern China to promote the improvement of green innovation efficiency.
The intensity of command-control environmental regulation has no significant impact on green innovation efficiency in central China. The relationship between market incentive environmental regulation intensity and green innovation efficiency is U-shaped. When the intensity of market incentive environmental regulation reaches 0.7565, the improvement of green innovation efficiency can be promoted.
There is a U-shaped relationship between green innovation efficiency and environmental regulation in western China, whether command-control or market incentive. When the intensity of environmental regulation is relatively low, most enterprises choose to increase pollution discharge fees for waste treatment, which takes up the cost of technological innovation and is not conducive to the development of green innovation efficiency. When the intensity of environmental regulation reaches a certain value, enterprises will increase pollution discharge fees. By contrast, it is more cost-effective to use technological innovation to tackle pollution at the source. As technological innovation improves, so will green innovation efficiency.

5. Conclusions and Recommendations

5.1. Conclusions

This paper uses the SBM of a super-efficiency model based on the undesirable output to measure green innovation efficiency, and establishes the dynamic panel system GMM model to analyze the impact of environmental regulation intensity thereon. The main conclusions of the study are as follows:
(1)
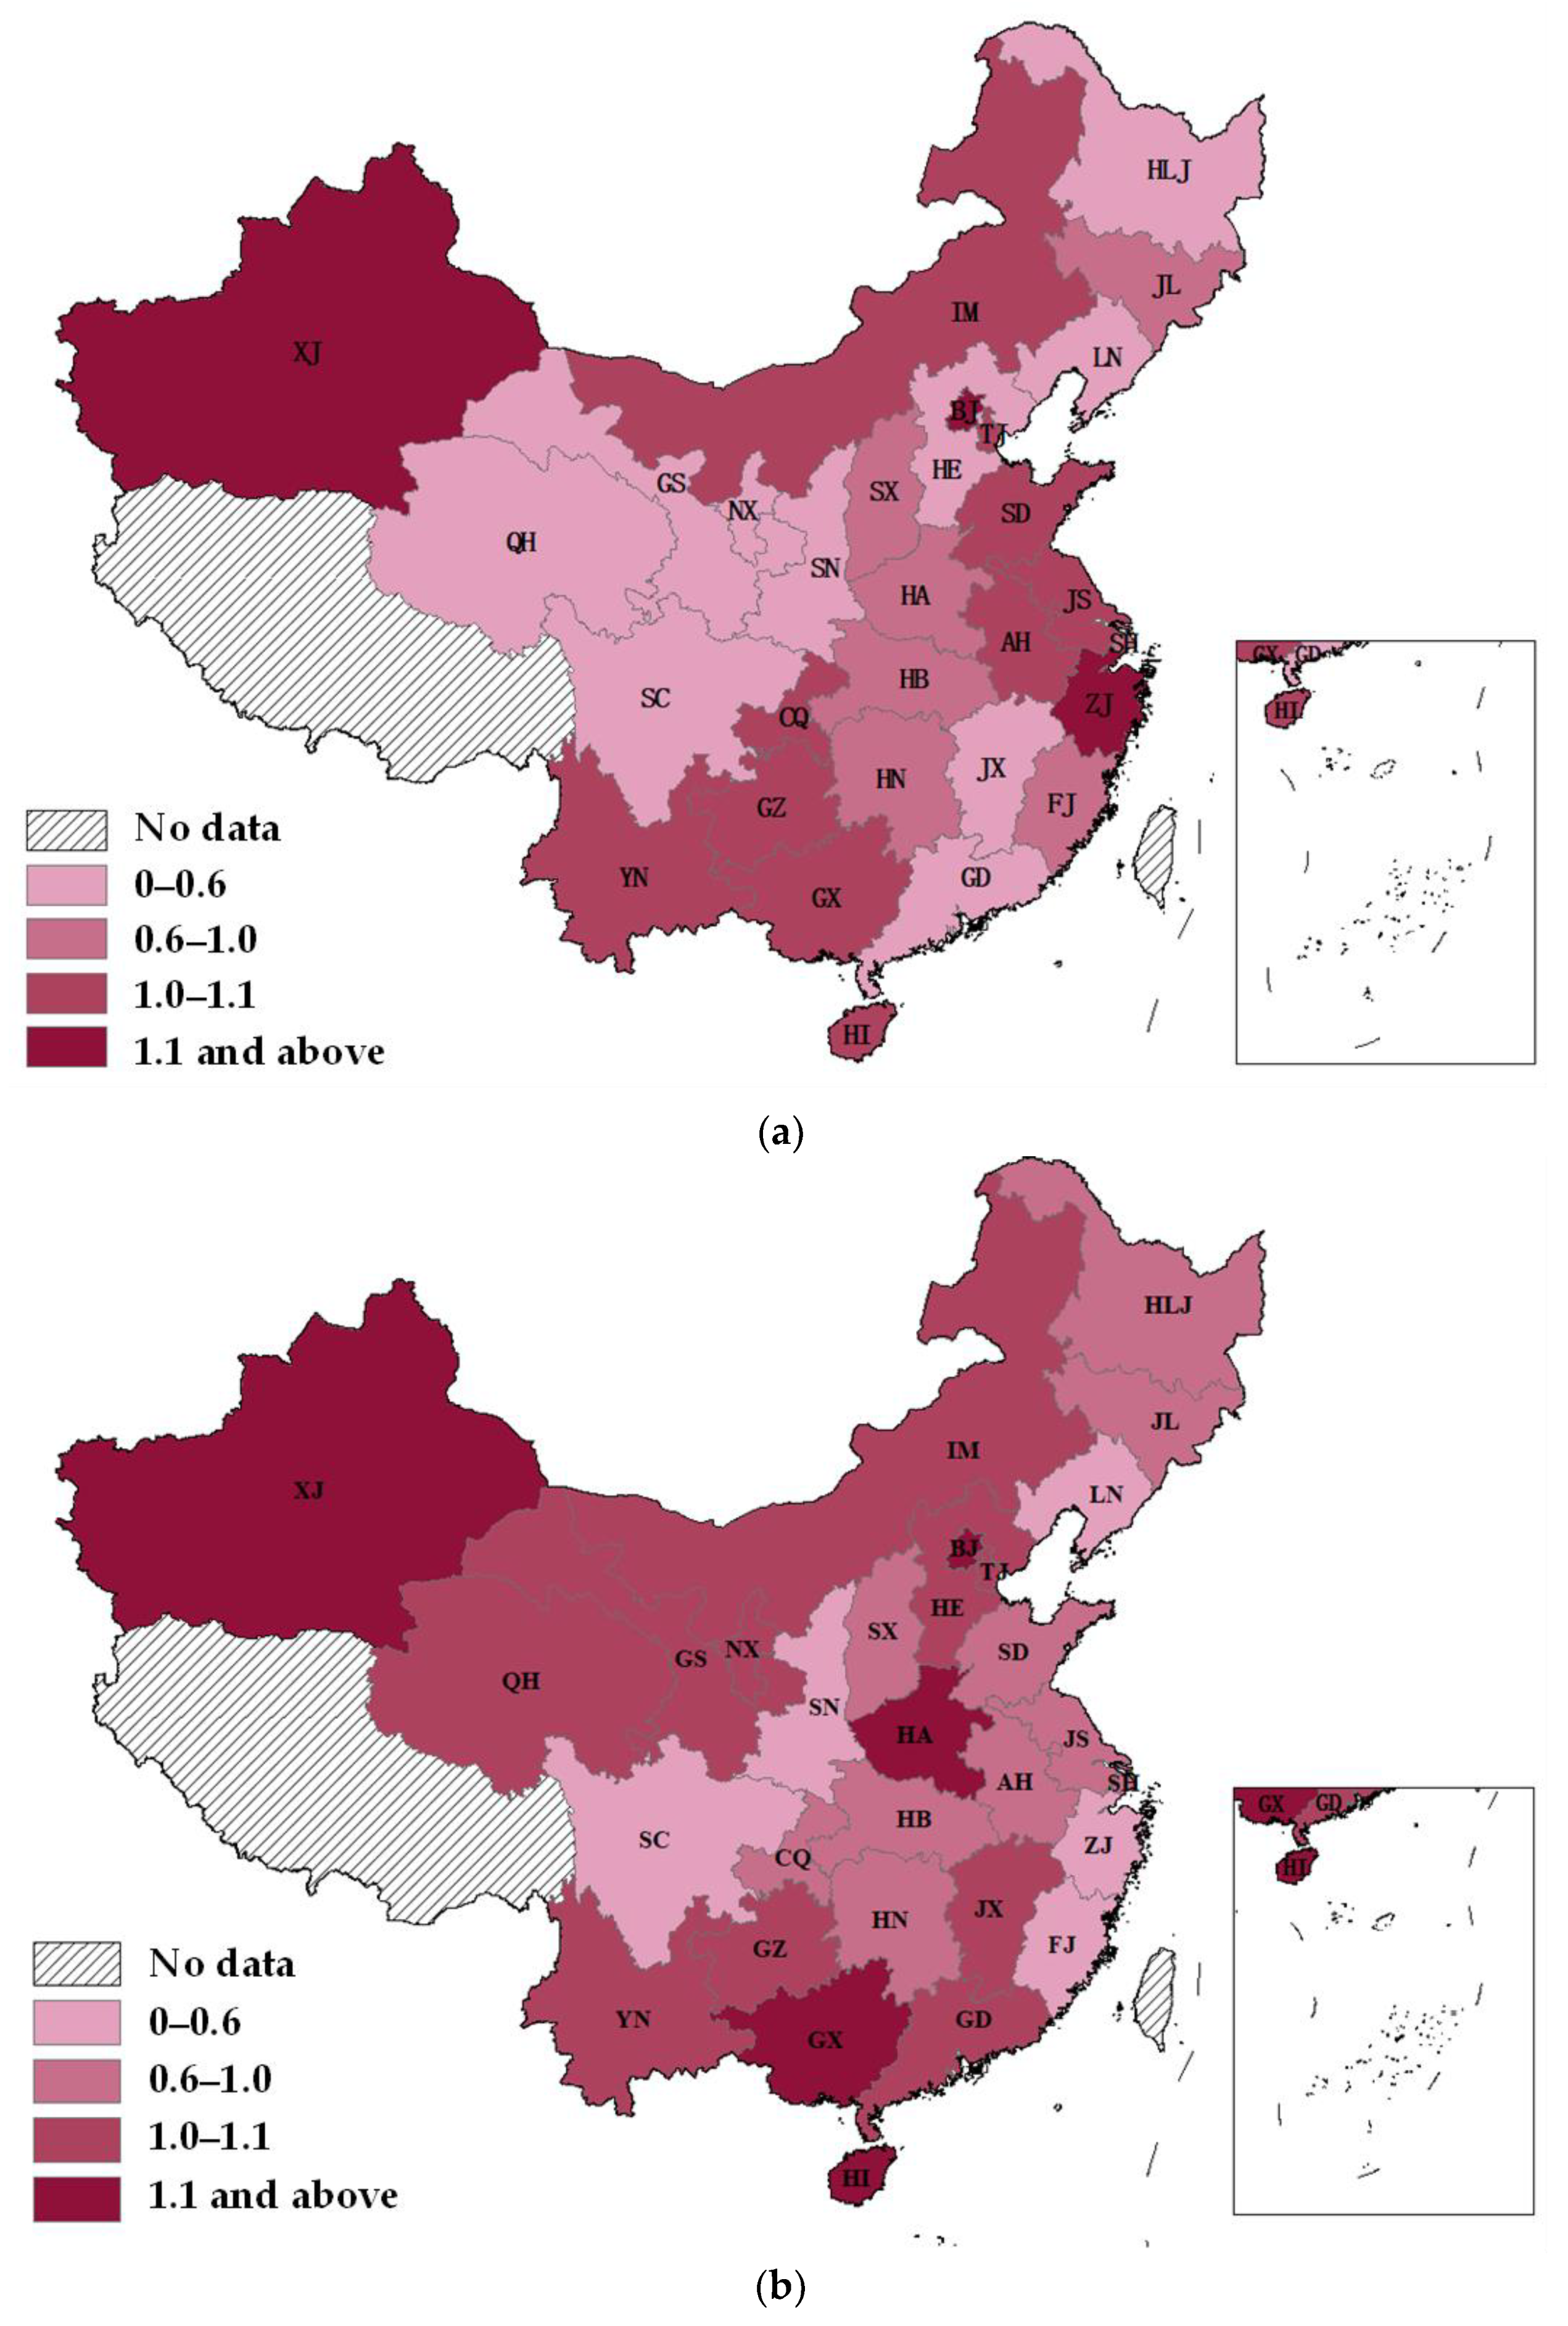
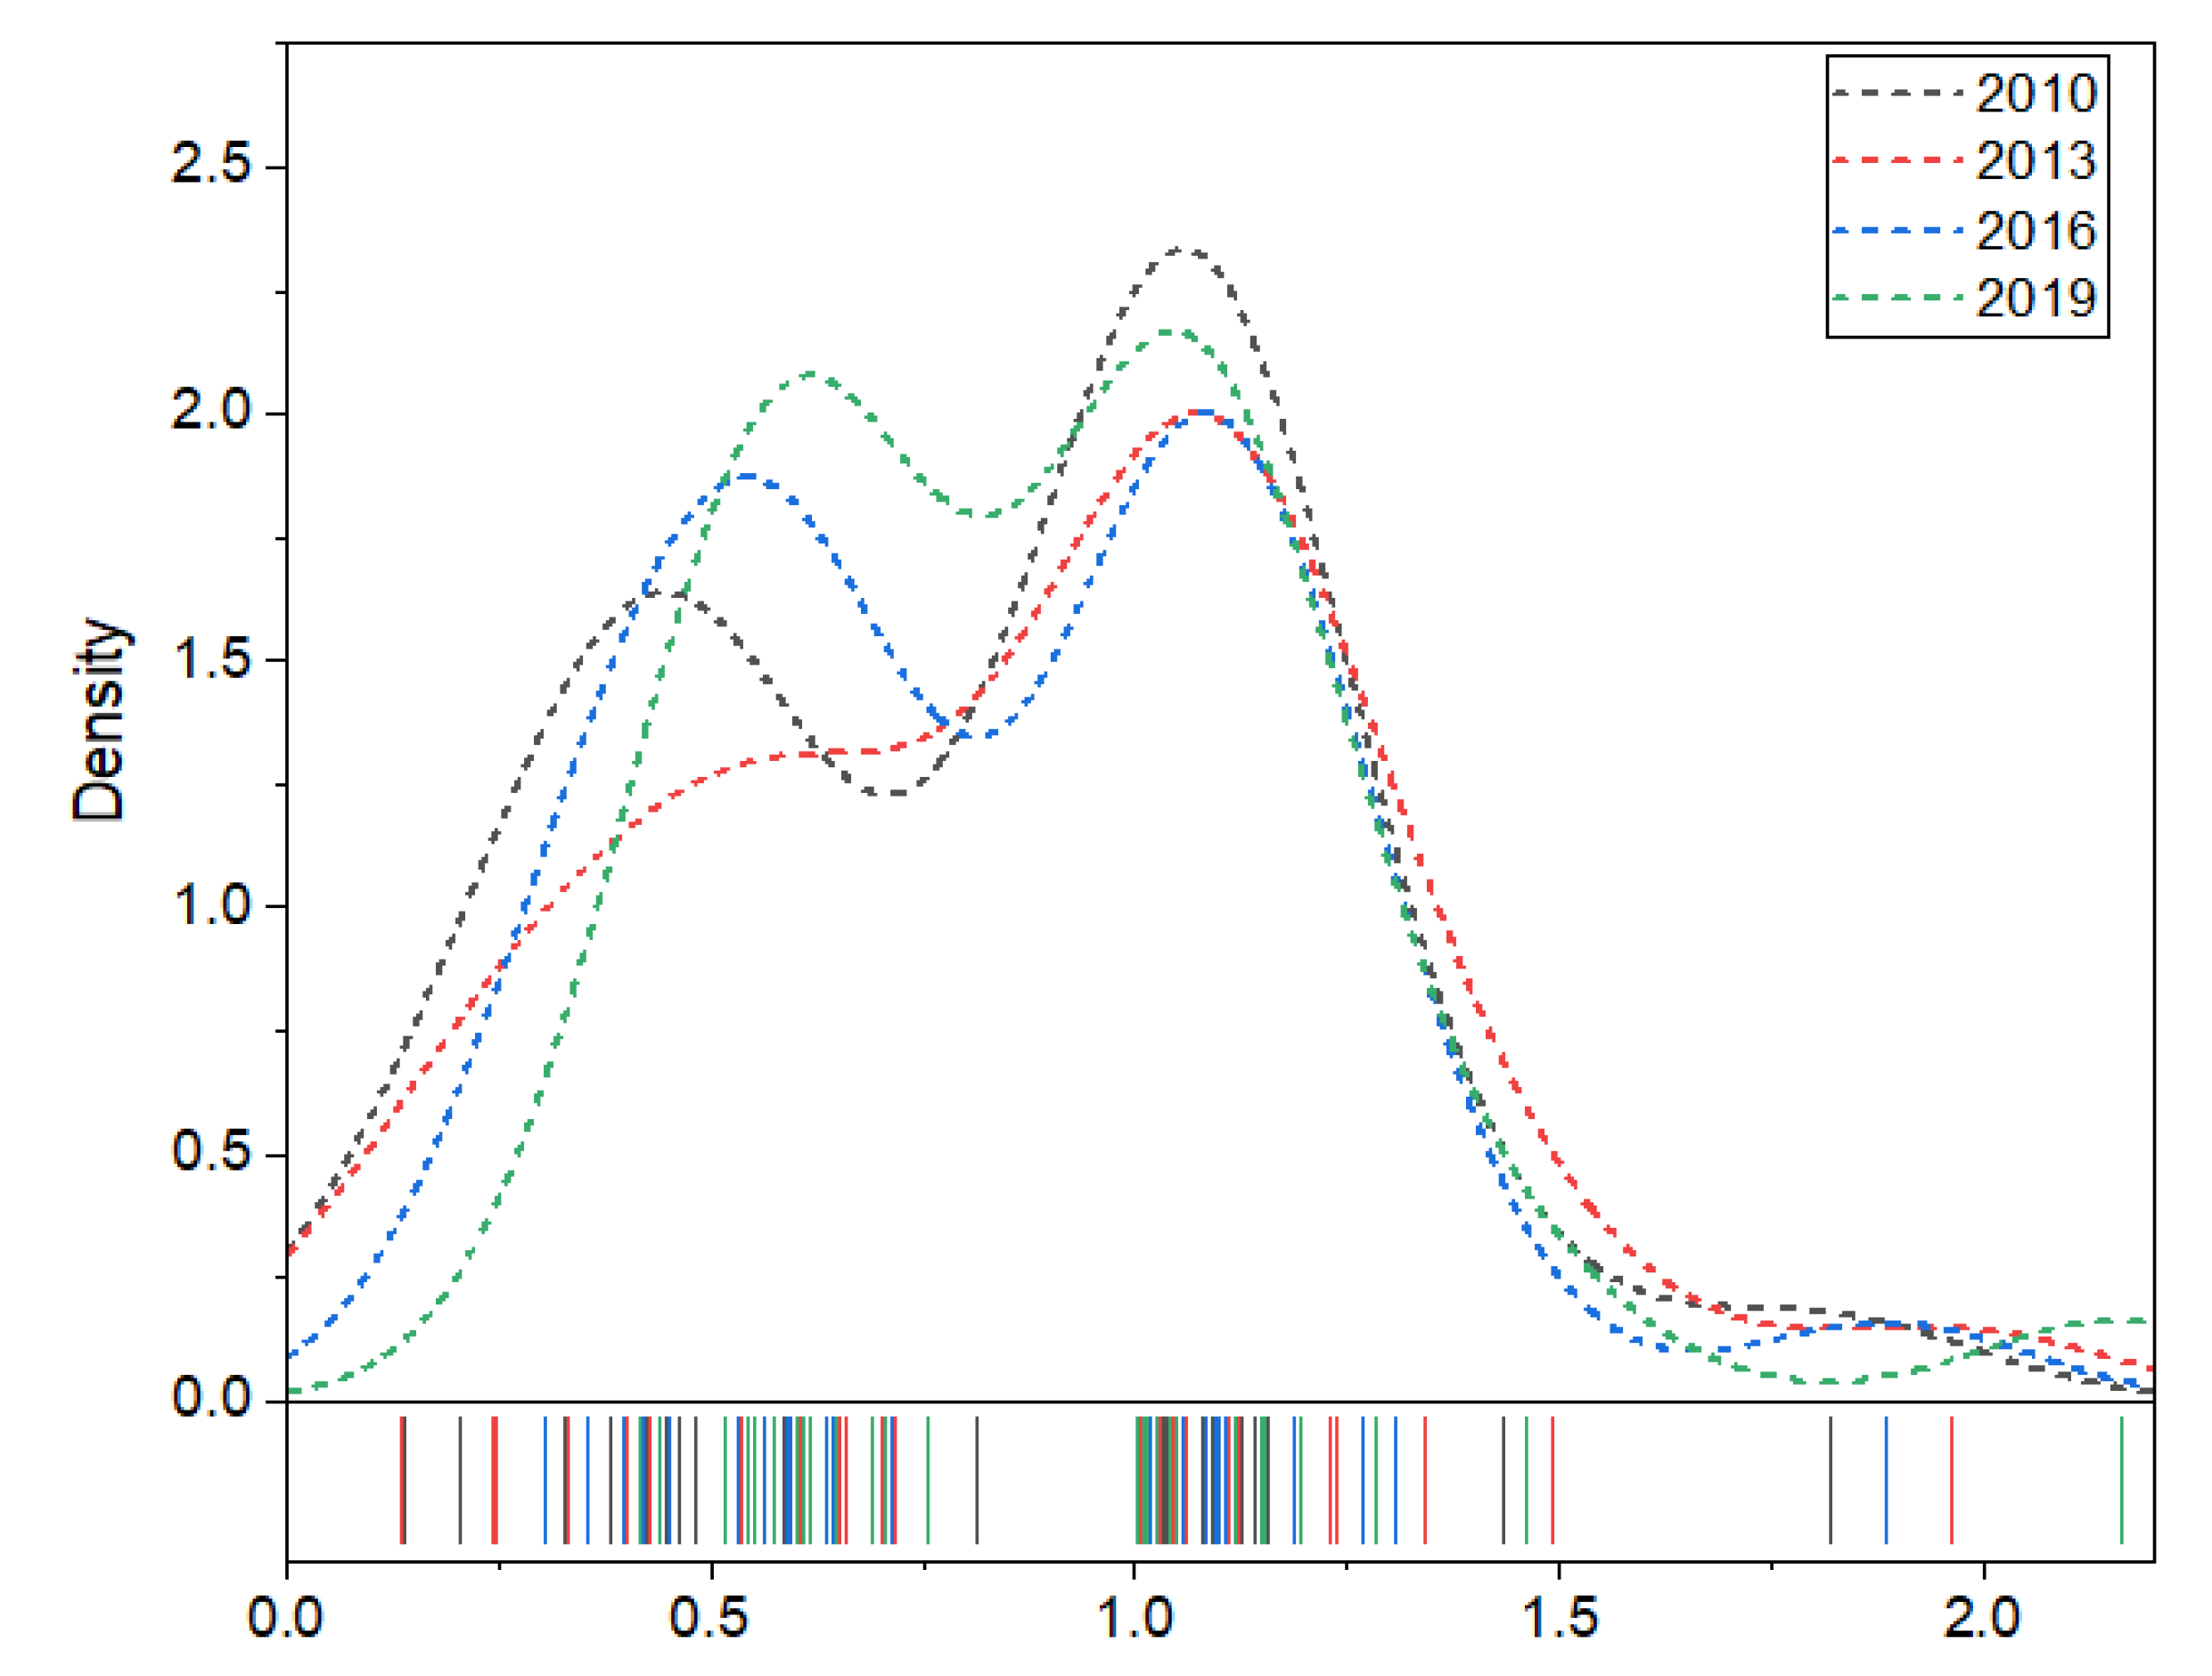
The green innovation efficiency in China is showing a rising trend over time and is at a high level overall. However, it varies greatly among different regions in China. The green innovation efficiency in eastern China is higher than the national average, while that in central and western China is lower than the national average.
(2)
The impact of command-control environmental regulation on green innovation efficiency follows an inverted N-shaped pattern, with the trend of downward-upward-downward. The market incentive environmental regulation has a U-shaped influence on green innovation efficiency, with a downward-upward trend. The intensity of command-control environmental regulation in most provinces of China is in a range that can effectively promote the improvement of green innovation efficiency. However, the intensity of market incentive environmental regulation in most provinces has not reached the threshold that can effectively promote the improvement of green innovation efficiency.
(3)
The impact of environmental regulations on green innovation efficiency also varies across regions. Command-control environmental regulation has an inverted U-shaped impact on green innovation efficiency in eastern China. Additionally, market incentive environmental regulations have a direct positive impact on green innovation efficiency. The impact of market incentive environmental regulations on green innovation efficiency follows a U-shaped pattern in central China. Both types of environmental regulation have a U-shaped effect on green innovation efficiency in western China.

5.2. Recommendations

Recommendations are made for different subjects, aiming to protect the ecological environment and promote the efficiency of green innovation through environmental regulation.
(1)
For environmental regulation to contribute to green innovation efficiency, the government must ensure that the intensity of environmental regulation reaches the threshold for technological innovation. However, command-control environmental regulations should not be so severe that enterprises are pressured to close or move out. Therefore, the government should control the pollution discharge standard so that the pollution discharge fee is close to or even greater than the cost of enterprises to prevent and control pollution. Encourage enterprises to carry out technological innovation, improve the industrial structure and prevent pollution from the source. The market incentive environmental regulation policies in most provinces of China have not worked well. The government should provide better guidance regarding market-incentive environmental regulations and make them work hand in hand with command-control environmental regulations to jointly achieve good policy effects. Additionally, the government can adopt a combination of incentives and mandatory measures to manage enterprises. Enterprises that do a good job in terms of discharging pollutants should be given some incentive subsidies or appropriate tax reductions. For some heavily polluting enterprises, compulsory policies can be adopted. The government should urge them to rectify the situation and force them to optimize their industrial structure. Additionally, the government should better guide enterprises which are seeking to engage in technological innovation and focus on environmental protection.
(2)
The contribution of technological innovation to green innovation is significant. As the primary creators in innovation activities, enterprises have the responsibility to promote the innovation of the whole industry. The role of enterprises is crucial. First of all, enterprises should fully understand the government’s environmental regulation policies and implement pollution prevention and control policies. Secondly, enterprises choose the most appropriate way to control pollution according to the needs of their development and based on maximizing their benefits. Enterprises should adjust their industrial structure and use more environmentally friendly raw materials for production. The concept of green production runs through the whole production process, and enterprises try to minimize the pollution from the source. Finally, enterprises should reduce investment in industries that produce more pollutants, develop green industries, and play the role of sustainable incentive for green industries.
(3)
Environmental regulation policies in different regions have different impacts on the efficiency of green innovation. The government should improve the environmental regulation policy system and formulate policies according to the development needs and the resource endowment of different regions and the conditions for policy implementation. The previous development strategy can be continued in eastern China to attract talents for technological innovation and promote regional innovation while developing the economy. More incentive policies and measures should be implemented to accelerate green innovation efficiency. The implementation of command-control environmental regulation policies should not be too strict to prevent the emergence of a “pollution paradise”. The intensity of environmental regulation should be increased, and policies should be actively implemented so that the intensity of environmental regulation reaches a threshold in central and western China. The government should force enterprises to meet emission standards through innovation, thereby promoting green innovation and efficiency.

Author Contributions

T.S. drafted the paper and conducted the data interpretation. D.L. conceptualized and designed the research. Y.J. constructed empirical models and obtained the results. J.L. collected data. All authors have read and agreed to the published version of the manuscript.

Funding

This paper is supported by the Key Program of the National Philosophy and Social Science Foundation of China (Grant No. 21ATJ003), and Innovation Team of Philosophy and Social Sciences in Henan Colleges and Universities (2017–CXTD-07).

Institutional Review Board Statement

Not applicable.

Informed Consent Statement

Not applicable.

Data Availability Statement

Although the data used in this paper are from various publicly available yearbooks in China, some yearbooks are not freely available. The data for each variable can be obtained from the corresponding yearbook provided in the paper. Alternatively, the datasets used in this paper are available from the corresponding authors on reasonable request.

Conflicts of Interest

The authors declare no conflict of interest.

Appendix A

Table A1. Green innovation efficiency in China from 2009 to 2019.
RegionProvince20092010201120122013201420152016201720182019
EasternBeijing/BJ1.95721.81971.82181.89591.96371.97032.00411.88472.1512.23072.1611
Tianjin/TJ1.04321.0081.01561.1151.11181.09161.0431.08271.01020.5741.0248
Liaoning/LN0.50771.02650.55230.48310.55060.40760.46590.45050.40910.43990.4404
Shanghai/SH0.58470.48371.00680.70960.60540.56920.55180.5950.6031.00220.6007
Jiangsu/JS1.06171.09951.10091.221.23071.07451.04691.09831.12370.68830.608
Zhejiang/ZJ1.16321.08111.09771.08691.06181.05341.01841.09931.02291.00310.5523
Fujian/FJ0.61630.46260.65671.06420.7010.59960.6510.6360.56270.50230.5155
Shandong/SD1.04790.58710.70050.68130.65190.590.56970.53380.55050.63390.7032
Guangdong/GD0.45961.43241.16431.18791.34031.39581.09321.10781.28961.14531.148
Hainan/HI1.11981.12491.12641.10271.09441.09811.10441.10021.09711.08231.1544
Hebei/HE0.43780.42320.39950.64330.42870.44050.40870.41840.44351.04151.1192
CentralShanxi/SX1.00171.09741.00770.69221.00911.03981.08210.35650.48011.01971.0025
Neimenggu/NM1.08471.14261.18651.11511.11071.09251.07590.56131.151.05861.0264
Jilin/JL0.61621.03320.42850.5691.01550.60020.78030.60090.49330.55470.756
Heilongjiang/HL0.18850.13970.26170.41670.24750.27290.24340.30590.24390.42260.6098
Anhui/AH1.08591.08971.04441.10561.11031.07751.05041.0551.04031.02710.6167
Jiangxi/JX0.41680.44010.57071.02171.01510.71560.56941.01130.63940.54511.0252
Henan/HA0.70610.81231.01631.04451.2391.21121.2261.18611.17641.27951.1949
Hubei/HB0.58230.56310.51780.55730.53690.62680.64990.64330.6810.66110.576
Hunan/HN0.64150.81240.77341.03481.02810.77750.65480.71150.59350.56530.6473
Guangxi/GX1.02411.03621.01011.04371.12241.14621.19951.26871.28291.26481.4608
WesternChongqin/CQ1.061.04811.37381.08021.04651.1351.17281.01171.0520.68240.6914
Sichuan/SC0.55090.32741.0750.74110.71850.73450.75330.63670.64620.63760.5428
Guizhou/GZ1.06320.20460.27310.30170.24460.27740.31561.01671.0281.03861.0411
Yunnan/YN1.1081.05771.01060.79981.0061.02010.64461.04061.06041.05051.049
Shaanxi/SN0.2960.41820.43390.40510.33030.42540.32130.39750.4030.37070.4159
Gansu/GS0.46650.44780.63680.76010.65960.60910.7180.5890.5570.5431.0143
Qinghai/QH0.23321.01741.39321.00730.13321.02461.03951.09251.0051.01881.0104
Ningxia/NX0.4650.38010.40910.40480.40010.3790.37270.35370.27030.40791.0145
Xinjiang/XJ1.40491.15581.04181.54361.49181.45771.19341.30761.0641.19191.2816

References

  1. Fan, F.; Zhang, X.; Lian, H. Impact of Environmental Regulations on Green Innovation Efficiency of the Yangtze River Economic Belt: Intermediary Effect Test Based on Foreign Direct Investment. Sci. Technol. Manag. Res. 2021, 41, 191–196. [Google Scholar]
  2. Adhikari, C.B.; Bjorndal, T. Analyses of technical efficiency using SDF and DEA models: Evidence from Nepalese agriculture. Appl. Econ. 2012, 44, 3297–3308. [Google Scholar] [CrossRef] [Green Version]
  3. Han, J. Research on Efficiency of Regional Green Innovation in China. Res. Financ. Econ. Issues 2012, 11, 130–137. [Google Scholar]
  4. Feng, Z. Research on Green Innovation Efficiency of Chinese Industrial Enterprises. Forum Sci. Technol. China 2013, 2, 82–88. [Google Scholar]
  5. Faria, A.; Fenn, P.; Bruce, A. Production technologies and technical efficiency: Evidence from Portuguese manufacturing industry. Appl. Econ. 2005, 37, 1037–1046. [Google Scholar] [CrossRef] [Green Version]
  6. Xiao, W.; Lin, B. Government support, R&D Management and Technological Innovation Efficiency: An Empirical Analysis Based on China’s Industry. Manag. World 2014, 4, 71–80. [Google Scholar]
  7. Li, X.; Zeng, Y. The Measurement of China’s Regional innovative Green Development Efficiency and Its Influencing Factors. Sci. Technol. Prog. Policy 2020, 37, 33–42. [Google Scholar]
  8. Xu, W.; Li, L.; Zheng, J.; Liu, C. Comparison of regional differences between green innovation efficiency and Ecological Welfare performance in China. Stat. Decis. 2021, 37, 56–59. [Google Scholar]
  9. Xu, Y.; Liu, S. Spatial pattern evolution and influencing factors of green innovation efficiency in the Yellow River Basin. J. Nat. Resour. 2022, 37, 627–644. [Google Scholar] [CrossRef]
  10. Bai, J.; Jiang, F. Collaborative Innovation, Spatial Relevance and Regional Innovation Performance. Econ. Res. J. 2015, 50, 174–187. [Google Scholar]
  11. Qin, B.; Guo, Y.; Ge, L. How Public Participation Affects Corporate Green Technology Innovation? Analysis Based on Intermediary Effect and Spatial Effect. J. Technol. Econ. 2022, 41, 50–61. [Google Scholar]
  12. Zhu, D.; Luo, Y.; Lu, Z. Environmental regulation, industrial agglomeration and green innovation efficiency. Stat. Decis. 2021, 37, 53–57. [Google Scholar]
  13. Ederington, J.; Minier, J. Is environmental policy a secondary trade barrier? An empirical analysis. Can. J. Econ. 2003, 36, 137–154. [Google Scholar] [CrossRef]
  14. Song, S. Research on Regional Difference in the Effect of Different Environmental Regulation Tools on Polluting Industry Investment-empirical Analysis of the Four Regions of China from the Perspective of Investment Location. West Forum 2017, 27, 90–99. [Google Scholar]
  15. Zhang, Z.; Zhao, G. FDI, Environmental Regulation and Technological Progress. J. Quant. Tech. Econ. 2012, 29, 19–32. [Google Scholar]
  16. Fu, J.; Li, L. A Case Study on the Environmental Regulation, the Factor Endowment and the International Competitiveness in Industries. Manag. World 2010, 10, 87–98. [Google Scholar]
  17. Hao, S.; Zhang, Y. The Impact of Environmental Regulation on Economic Agglomeration: From the Perspective of New Economic Geography. Soft Sci. 2016, 30, 27–30. [Google Scholar]
  18. Ren, X.; Liu, Y.; Zhao, G. The impact and transmission mechanism of economic agglomeration on carbon intensity. China Popul. Resour. Environ. 2020, 30, 95–106. [Google Scholar]
  19. Yan, W.; Guo, S.; Shi, Y. Environmental Regulation, Industrial Structure Upgrading, and Employment Effect: Linear or nonlinear? Econ. Sci. 2012, 6, 23–32. [Google Scholar]
  20. Xu, K.; Yuan, Y. Empirical Study of Environmental Regulation and Industrial Structure Adjustment: A Sys-GMM Estimation Based on Different Pollutants Control. J. Ind. Technol. Econ. 2014, 33, 101–109. [Google Scholar]
  21. Huang, Q.; Gao, M. Quantity and quality effects of environmental regulation on economic growth: Test based on simultaneous equations. Economist 2016, 4, 53–62. [Google Scholar]
  22. Wang, Z.; Wen, Y.; Zou, C. The Analysis of the Impact of Environmental Regulation on Technological Innovation Mechanism. J. Nanjing Univ. Financ. Econ. 2012, 3, 8–13. [Google Scholar]
  23. Deng, Y.; Wang, L.; Zhou, W. Does Environmental Regulation Promote Green Innovation Capability?—Evidence from China. Stat. Res. 2021, 38, 76–86. [Google Scholar]
  24. Zhang, W.; Chen, Y. Research on the Impact of Environmental Regulation Tools and R&D Subsidies on Green Technology Innovation. Ecol. Econ. 2022, 38, 36–46. [Google Scholar]
  25. Sun, Y.; Liu, Y. Comparison between environmental tax and pollutant discharge permit and policy choice of pollution. Public Financ. Res. 2015, 4, 96–99. [Google Scholar]
  26. Brunnermeier, S.B.; Cohen, M.A. Determinants of environmental innovation in US manufacturing industries. J. Environ. Econ. Manag. 2003, 45, 278–293. [Google Scholar] [CrossRef]
  27. Castellacci, F.; Lie, C.M. A taxonomy of green innovators: Empirical evidence from South Korea. J. Clean. Prod. 2017, 143, 1036–1047. [Google Scholar] [CrossRef] [Green Version]
  28. Singh, R.K.; Yabar, H.; Nozaki, N.; Niraula, B.; Mizunoya, T. Comparative study of linkage between environmental policy instruments and technological innovation: Case study on end-of-life vehicles technologies in Japan and EU. Waste Manag. 2017, 4, 114–122. [Google Scholar] [CrossRef]
  29. Zhang, X.; Wang, Y. Effects of Environmental Regulation and R&D Investment on Green Technology Innovation. Sci. Technol. Prog. Policy 2017, 17, 111–119. [Google Scholar]
  30. Wang, J.; Zhang, Y. Environmental regulation, green technological innovative intention and green technological innovative behavior. Stud. Sci. Sci. 2018, 2, 352–360. [Google Scholar]
  31. Wang, F.; He, Z. Environmental regulation, green innovation and upgrading of industrial structure. Stat. Decis. 2022, 38, 73–76. [Google Scholar]
  32. Domazlicky, B.R.; Weber, W.L. Does environmental protection lead to slower productivity growth in the chemical industry? Environ. Resour. Econ. 2004, 28, 301–324. [Google Scholar] [CrossRef]
  33. Sinn, H.W. Public policies against global warming: A supply side approach. Int. Tax Public Financ. 2008, 15, 360–394. [Google Scholar] [CrossRef]
  34. Li, W.; Bi, K. Study on impact of environmental regulation intensity on green technology innovation in pollution intensive industries: An empirical test based on panel data from 2003 to 2010. RD Manag. 2013, 6, 72–81. [Google Scholar]
  35. Kneller, R.; Manderson, E. Environmental regulations and innovation activity in UK manufacturing industries. Resour. Energy Econ. 2012, 34, 211–235. [Google Scholar] [CrossRef]
  36. Peuckert, J. What shapes the impact of environmental regulation on competitiveness? Evidence from Executive Opinion Surveys. Environ. Innov. Soc. Transit. 2014, 10, 77–94. [Google Scholar] [CrossRef]
  37. Peng, W.; Cheng, F.; Lu, J. Research on threshold effect of environmental regulation on provincial green innovation efficiency. South China J. Econ. 2017, 9, 73–84. [Google Scholar]
  38. Luo, Y.; Chen, P. Research on threshold effect of environmental regulation on improvement of China’s industrial green innovation efficiency. J. Northeast. Univ. 2018, 2, 147–154. [Google Scholar]
  39. Gao, H.; Xiao, T. Can heterogeneous environmental regulation force the optimization of industrial structure? Jianghan Trib. 2022, 3, 13–21. [Google Scholar]
  40. Tone, K. A slacks-based measure of efficiency in data envelopment analysis. Eur. J. Oper. Res. 2001, 130, 498–509. [Google Scholar] [CrossRef] [Green Version]
  41. Tone, K. A slacks-based measure of super-efficiency in data envelopment analysis. Eur. J. Oper. Res. 2002, 143, 32–41. [Google Scholar] [CrossRef] [Green Version]
  42. Parzen, E. On Estimation of a Probability Density Function and Mode. Ann. Math. Stat. 1962, 33, 1065–1076. [Google Scholar] [CrossRef]
  43. Zhang, H.; Li, L.; Zhao, M. Digital Inclusive Finance and Green Total Factor Productivity: Empirical Test Based on System GMM. New Financ. 2022, 3, 31–40. [Google Scholar]
  44. Hu, Z.; Chen, X.; Zhou, Q.; Chen, D.; Li, J. DISO: A rethink of Taylor diagram, International Journal of Climatology. Int. J. Climatol. 2019, 39, 2825–2832. [Google Scholar] [CrossRef]
  45. Zhou, Q.; Chen, D.; Hu, Z.; Chen, X. Decompositions of Taylor diagram and DISO performance criteria. Int. J. Climatol. 2021, 41, 5726–5732. [Google Scholar] [CrossRef]
Figure 1. The impact mechanism of environmental regulation on green innovation efficiency.
Atmosphere 13 00767 g001
Figure 2. Spatial evolution of green innovation efficiency in China from 2009 to 2019. (a) 2009; (b) 2019.
Atmosphere 13 00767 g002
Figure 3. Kernel density distribution of green innovation efficiency in China.
Atmosphere 13 00767 g003
Table 1. Characteristics of some common regression curve.
Coefficient ValueShape of
Regression Curve
Indication
β 2 = β 3 = 0 , β 1 0 Monotonically increasing or decreasingThe intensity of environmental regulation promotes or inhibits green innovation efficiency.
β 3 = 0 , β 2 > 0 , β 1 < 0 U-shapedThe green innovation efficiency first decreases and then increases with the increase of the intensity of environmental regulation.
β 3 = 0 , β 2 < 0 , β 1 > 0 Inverted U-shapedThe green innovation efficiency first increases and then decreases with the increase of the intensity of environmental regulation.
Δ = 4 β 2 2 12 β 1 β 3 > 0 ,
β 1 > 0 , β 2 < 0 , β 3 > 0
N-shapedThe green innovation efficiency first increases, decreases to a certain level, and finally increases again with the increase of the intensity of environmental regulation.
Δ = 4 β 2 2 12 β 1 β 3 > 0 ,
β 1 < 0 , β 2 > 0 , β 3 < 0
Inverted N-shapedThe green innovation efficiency first decreases, increases to a certain level, and finally decreases again with the increase of the intensity of environmental regulation.
Table 2. Input-output system of green innovation efficiency.
TypeIndicatorDefinitionSource
InputGreen inputEnergy consumption
(ten thousand tons of standard coal)
China Energy Statistical Yearbook
Innovation
input
Full-time equivalent of R&D personnel
(ten thousand man-years)
China Statistical Yearbook on Science and Technology
Internal expenditure of R&D funds
(ten thousand yuan)
China Statistical Yearbook on Science and Technology
OutputInnovation desirable
output
New product sales revenue
(ten thousand yuan)
China Statistical Yearbook on Science and Technology
Regional GDP (billion yuan)China Statistical Yearbook
Number of domestic patent applications
accepted (piece)
China Statistical Yearbook on Science and Technology
Green
undesirable output
Total industrial sulfur dioxide emissions (ton)China Statistics Yearbook on Environment
Organic matter content in industrial
wastewater (ton)
China Statistics Yearbook on Environment
Table 3. Variable Description.
TypeVariable NameDefinition
Explained
variable
Green innovation efficiency ( G I )Efficiency measured by the SBM of super-efficiency
Explanatory variable Environmental Regulation Intensity ( E R )Intensity of command-control environmental regulation ( E R 1 ) and market incentive environmental regulation ( E R 2 )
Control
variable
Government support ( G S ) Proportion of local fiscal expenditure in regional GDP
Urbanization ( U R ) Urbanization rate
Technical progress ( T P ) Turnover of technology market
Openness ( O P ) Ratio of total import and export trade to GDP
Human capital ( H C ) Full-time equivalent of R&D personnel
Foreign direct investment ( F D I ) Total amount of foreign investment actually used
Optimization of industrial structure ( I S ) Proportion of tertiary industry value in regional GDP
Table 4. Regression results of impact of environmental regulation on green innovation efficiency.
VariableDynamic Panel System GMM Model
(1) Command-Control
Environmental Regulation
(2) Market Incentive
Environmental Regulation
L . G I 0.3888 ***0.3239 ***
(7.22)(5.93)
E R −1.0215 **−0.2415 ***
(−2.33)(−3.56)
E R 2 1.3781 **0.0969 **
(2.3)(2.48)
E R 3 −0.4908 **-
(−2.2)-
G S 1.6306 *2.5172 **
(1.89)(2.42)
U R 1.2206 ***0.7418 ***
(4.92)(2.92)
L N T P 0.1426 ***0.1067 ***
(3.3)(−2.72)
L N O P 0.1292 ***0.1143 ***
(3.59)(2.76)
L N H C −0.1953 ***−0.1955 ***
(−14.06)(−10.41)
L N F D I 0.0250.0538 **
(1.39)(2.41)
I S 0.5402 *0.4316 *
(1.68)(1.67)
C o n s −0.8971−0.2862
(−1.39)(−0.6)
Curve typeInverted N-shapedU-shaped
Inflection point0.5071
1.3677
1.2461
AR(1)−3.8475−4.0413
p-value0.00010.0001
AR(2)−1.7165−1.7925
p-value0.08610.0731
Sargan24.422524.8043
p-value0.49510.4734
Note: * a significance level of 10%, ** a significance level of 5%, *** a significance level of 1%. The values of Z-statistic are in parentheses.
Table 5. Regional regression results.
VariableDynamic Panel System GMM Model
EasternCentralWestern
E R 1 0.2102 ***-−0.1654 ***
(7.64)-(14.9)
E R 1 2 −0.0964 ***-0.0922 ***
(3.87)-(8.07)
Curve typeInverted U-shaped-U-shaped
Inflection point1.619-0.8970
E R 2 1.8050 ***−0.1112 **−0.1043 ***
(7.22)(−2.16)(−3.76)
E R 2 2 -0.0735 ***0.063 ***
-(7.56)(8.32)
Curve typeStraight lineU-shapedU-shaped
Inflection point-0.75650.6020
Note: ** a significance level of 5%, *** a significance level of 1%. The values of Z-statistic are in parentheses.
Publisher’s Note: MDPI stays neutral with regard to jurisdictional claims in published maps and institutional affiliations.

