
A Study on Possible Solar Influence on the Climate of the Southern Hemisphere

Ioffe Physico-Technical Institute, 194021 St. Petersburg, Russia
Atmosphere 2022, 13(5), 680; https://doi.org/10.3390/atmos13050680
Submission received: 18 March 2022
/
Revised: 14 April 2022
/
Accepted: 21 April 2022
/
Published: 24 April 2022
(This article belongs to the Special Issue The Influence of Solar and Astronomical Factors on Earth)
Abstract
:Three multi-proxy reconstructions of temperature in the Southern Hemisphere, were analyzed over the last millennium. Fourier and wavelet analysis showed that century-scale (55–120 years) and bicentennial (ca 250 years) variability is present in this series. That means that the climate of the Southern Hemisphere has periodicities similar to the solar cycles of Gleissberg and Suess. However, a comparison of the century-long variations in the Southern Hemisphere temperature records with the corresponding variation in four solar activity proxies showed that only one reconstruction of) displays century-long correlation with solar activity. The solar-like periodicities in the other two records do not show significant correlation with solar cycles. Therefore, based on the results obtained, it is difficult to draw a definite conclusion about the influence of solar activity on the climate of the Southern Hemisphere. To clarify this issue, it is necessary to obtain and analyze new independent temperature reconstructions in the Southern Hemisphere.
1. Introduction
For a long time, scientists have searched for a possible effect of solar activity on atmospheric dynamics and terrestrial climate (see, e.g., [1,2]). Research in this field has advanced considerably during recent decades, but a detailed physical mechanism explaining the connection between solar activity, space weather, and climate is still unclear. Moreover, the geographic distribution of solar-climate evidence is not uniform. Most of the indications were obtained from the Northern Hemisphere [3,4,5,6,7,8,9,10,11,12], whereas evidence from the Southern Hemisphere is not so copious [13,14,15,16]. This is largely due to the fact that the Southern Hemisphere is less covered by meteorological records, in particular by long-term temperature paleoreconstructions. In addition, the authors of [17], who carefully studied the possible influence of solar activity on the climate of Northern Fennoscandia, established that the available data are insufficient for a final conclusion. Ogurtsov et al. [17] noted that the study of new long-term temperature reconstructions is necessary to clarify this issue. In this context, the study of a possible solar-climatic relationship in the Southern Hemisphere, especially on a long-term scale, looks promising. Despite the paucity of long-term reconstructions of the Southern Hemisphere climate, several such series can be found in the current literature. Present work is devoted to search for a solar-climate link by means of three millennial multi-proxy reconstructions of annual temperature in the Southern Hemisphere obtained by Jones et al. [18], Mann and Jones [19], and Neukom et al. [20]. As these series cover a whole millennium, they are suitable for studying the influence of all known solar periodicities on climate: (a) the Schwabe quasi-11-year cycle, (b) the Hale quasi-22-year cycle, (c) the Gleissberg century-scale cycle (period of 55–130 years), and (d) the bicentennial cycle of Suess (period 170–250 years). In this work, I focused on studying the possible impact of long-term variations in solar activity on the climate. This is because: (a) on the one hand, serious evidence of the influence of the century-long solar cycle on the climate has been obtained in the Northern Hemisphere [4,21]; (b) on the other hand, a roughly 50–150 yr natural periodicity is present in many Northern Hemisphere temperature proxies [22]. This intrinsic variability can obscure the solar impact on climate. Therefore, testing these effects in the Southern Hemisphere is of considerable scientific interest.
2. Materials and Methods
The temperature reconstructions used in the work are shown in Figure 1. The reconstruction of Jones et al. [18] was obtained using seven multi-proxy (tree-ring, ice core, corals, historic documents) temperature predictors. Mann and Jones [19] used five tree-ring and ice-core proxy records. Neucom et al. (2014) generalized 111 multi-proxy (tree-ring, ice core, corals, historic documents, sediments) temperature indicators.
The dataset of Mann and Jones [19] is decadally resolved, whereas the other two are annually resolved.
A serious difficulty in solar-climatic studies is related to the shortness of available experimental data. The longest instrumental record of solar activity, the number of sunspot groups, has been available since 1610 AD. The use of indirect (proxy) data makes it possible to overcome these difficulties. Cosmogenic isotopes 14C and 10Be have long been known as reliable indicators of long-term changes in the GCR flux and solar activity [23,24]. They are generated in the stratosphere and troposphere due to high-energy (500 MeV–50 GeV) charged cosmic particles, are included in a number of recirculation processes, and are finally fixed in tree rings (14C), polar ice, and bottom sediments (10Be). In this work, I used both direct data on cosmogenic 10Be concentration and reconstructions of such parameters of solar activity as the total solar irradiance (TSI) and solar modulation potential (a value indicating how much energy (per unit charge) a cosmic ray particle must have to avoid being deflecting by the heliospheric magnetic field) obtained using these beryllium records. Thus, to study a possible solar-climate relationship, I used the following long-term indicators of solar activity:
- (a)
- Concentration of the cosmogenic 10Be in the South Pole core obtained by Bard et al. [25];
- (b)
- Total solar irradiance reconstructed by means of the cosmogenic isotopes 14C and 10Be [25];
- (c)
- Concentration of the cosmogenic 10Be in the two Antarctic records (South Pole and Dome Fuji stations) obtained by Delaygue and Bard [26];
- (d)
All indicators of solar activity used in the work are shown in Figure 2.
3. Results
Wavelet and Fourier spectra of the analyzed time series, calculated over the last 1000 years, were used for detecting the periodicities in the temperature proxies. Local and global wavelet spectra are shown in Figure 3. Fourier spectra are shown in Figure 4. Because the time series of Mann and Jones [19] was decadally smoothed, estimation of 0.95 significance level of the Fourier spectrum was based on evaluation of the background noise as a mean (median) spectral power, which then was multiplied by the corresponding value (2.99). Morlet wavelet spectrum of the temperature proxy [19] was normalized by variance—no estimation of significance of its details was made. Second-order polynomial trends were preliminarily subtracted from all series.
Both Fourier and wavelet analysis showed that:
- (a)
- (b)
- (c)
- Strong fluctuations on the scale of ca 100 years are presented in a reconstruction of Neucomb et al. [20]. They give a significant (p < 0.05) peak in Fourier spectrum at a period of 91 years. A strong and highly significant ca 250 year cyclicity exists in proxy series [18] during all the millennium. See Figure 3C,F and Figure 4C.
Thus, some century-long and bicentennial variability was found in the analyzed reconstructions of the Southern Hemisphere temperature. These periodicities may be the result of the influence of the solar cycles of Gleissberg (century-type variation) and Suess (bicentennial variation). To examine a possible relationship between the solar-type temperature variations in the Southern Hemisphere and solar activity, correlation coefficients were calculated between time series wavelet filtered in the Gleissberg band (58–133 years).
Bold figures in the table represent correlation coefficients with significance p < 0.05. Phase shifts in years as well as statistical significance (in italics) are given in brackets.
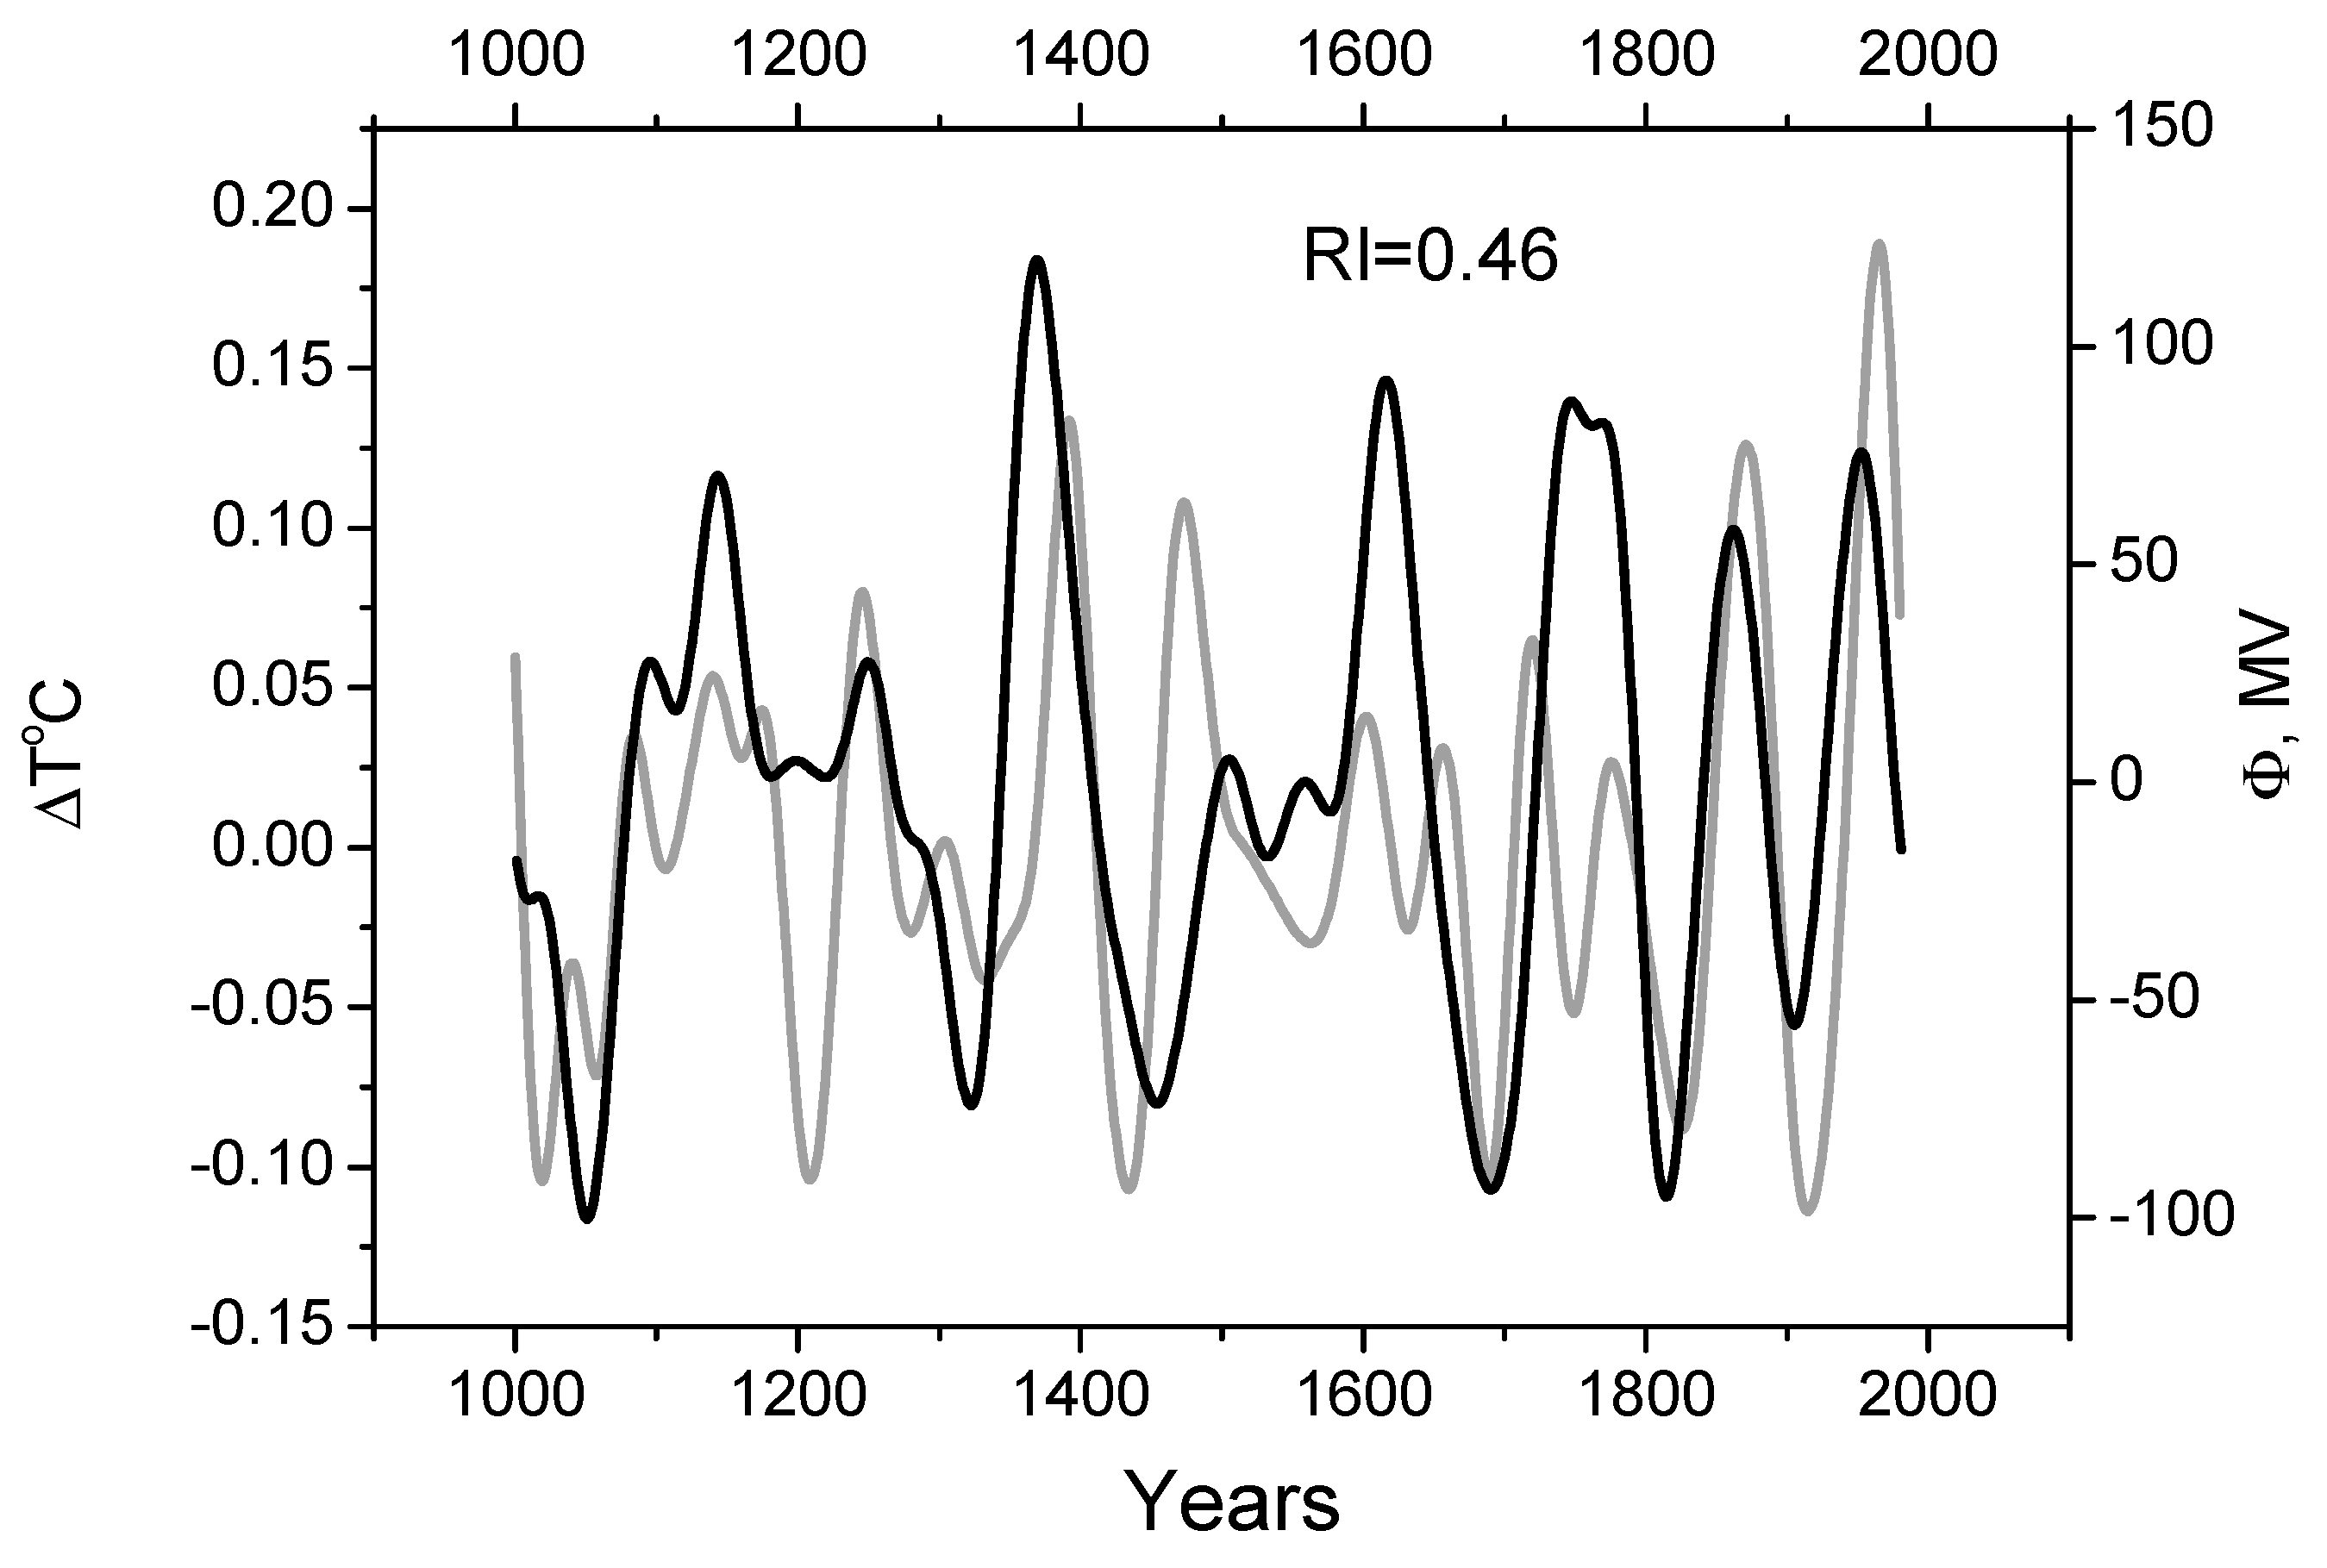
Table 1 shows that the century-scale variation of reconstruction of Jones et al. [18] correlates significantly with the solar proxies (see Figure 5). The two other proxies show no century-scale correlation with solar activity.
No significant correlation was found between the bicentennial temperature variations in the Southern Hemisphere and the corresponding solar cycle of Suess.
4. Discussion and Conclusions
An analysis of three millennial reconstructions of the Southern Hemisphere temperature showed that all of them contain century-scale variations and one contains a bicentennial variation. Century-long periodicity in temperature proxy of Jones et al. [18] correlates significantly with the corresponding variation (the cycle of Gleissberg) in four solar reconstructions. In contrast, the century-scale and bicentennial periodicities in the other two records do not show a correlation with the corresponding solar cycles of Gleissberg and Suess. Thus, at this stage it is difficult to draw an unambiguous conclusion about whether solar activity affects the climate of the Southern Hemisphere. The results obtained provide new evidence in favor of the existence of internal (natural) climate variability with periods close to solar cycles. The presence of such periodicities can complicate the identification of solar-climatic relationships. Obtaining and analysis of new independent and representative reconstructions of temperature in the Southern Hemisphere is necessary to clarify the question about possible solar–climatic association. Improving the quality of solar and climatic paleoreconstructions is also important.
Funding
This research received no external funding.
Institutional Review Board Statement
Not applicable.
Informed Consent Statement
Not applicable.
Data Availability Statement
All the data were taken from public websites https://www.ncei.noaa.gov/pub/data/paleo/contributions_by_author/jones1998/jonesdata.txt, https://www.ncei.noaa.gov/pub/data/paleo/contributions_by_author/mann2003b/mann2003b.txt, ftp://ftp.ncdc.noaa.gov/pub/data/paleo/contributions_by_author/neukom2014/neukom2014recon.txt, ftp://ftp.ncdc.noaa.gov/pub/data/paleo/climate_forcing/solar_variability/bard_irradiance.txt, https://www.ncei.noaa.gov/pub/data/paleo/climate_forcing/solar_variability/delaygue2010be10.txt (accessed on 20 April 2022).
Acknowledgments
The author is thankful to two anonymous referees for their constructive comments, which helped to improve the article.
Conflicts of Interest
The authors declare no conflict of interest.
References
- Gray, L.; Beer, J.; Geller, M.; Haigh, J.; Lockwood, M.; Matthes, K.; Cubasch, U.; Fleitmann, D.; Harrison, G.; Hood, L.; et al. Solar influence on climate. Rev. Geophys. 2010, 48, RG4001. [Google Scholar] [CrossRef]
- Lockwood, M. Solar Influence on Global and Regional Climates. Surv. Geophys. 2012, 33, 503–534. [Google Scholar] [CrossRef] [Green Version]
- Karlén, W.; Kuylenstierna, J. On solar forcing of Holocene climate: Evidence from Scandinavia. Holocene 1996, 66, 359–365. [Google Scholar] [CrossRef]
- Ogurtsov, M.; Kocharov, G.; Lindholm, M.; Meriläinen, J.; Eronen, M.; Nagovitsyn, Y. Evidence of solar variation in tree-ring-based climate reconstructions. Sol. Phys. 2002, 205, 403–417. [Google Scholar] [CrossRef]
- Raspopov, O.M.; Dergachev, V.A.; Kolström, N. Hale cyclicity of solar activity and its relation to climate variability. Sol. Phys. 2004, 224, 455–463. [Google Scholar] [CrossRef]
- Helama, S.; Fauria, M.M.; Mielikainen, K.; Timonen, M.; Eronen, M. Sub-Milankovitch solar forcing of past climates: Mid and late Holocene perspectives. GSA Bull. 2010, 122, 1981–1988. [Google Scholar] [CrossRef] [Green Version]
- Lockwood, M.; Harrison, R.; Woollings, T.; Solanki, S. Are cold winters in Europe associated with low solar activity? Environ. Res. Lett. 2010, 5, 024001. [Google Scholar] [CrossRef]
- Yamaguchi, Y.T.; Yokoyama, Y.; Miyahara, H.; Sho, K.; Nakatsuka, T. Synchronized Northern Hemisphere climate change and solar magnetic cycles during the Maunder Minimum. Proc. Natl. Acad. Sci. USA 2010, 107, 20697–20702. [Google Scholar] [CrossRef] [Green Version]
- Brugnara, Y.; Brönnimann, S.; Luterbacher, J.; Rozanov, E. Influence of the sunspot cycle on the Northern Hemisphere wintertime circulation from long upper-air data sets. Atmos. Chem. Phys. 2013, 13, 6275–6288. [Google Scholar] [CrossRef] [Green Version]
- Ogurtsov, M.; Lindholm, M.; Jalkanen, R.; Veretenenko, S.V. North Atlantic sea surface temperature, solar activity and the climate of Northern Fennoscandia. Adv. Space Res. 2017, 59, 980–986. [Google Scholar] [CrossRef]
- Owens, M.J.; Lockwood, M.; Hawkins, E.; Usoskin, I.; Jones, G.S.; Barnard, L.; Schurer, A.; Fasullo, J. The Maunder minimum and the Little Ice Age: An update from recent reconstructions and climate simulations. J. Space Weather Space Clim. 2017, 7, A33. [Google Scholar] [CrossRef]
- Connolly, R.; Soon, W.; Connolly, M.; Baliunas, S.; Berglund, J.; Butler, C.J.; Cionco, R.G.; Elias, A.G.; Fedorov, V.M.; Harde, H.; et al. How much has the Sun influenced Northern Hemisphere temperature trends? An ongoing debate. Res. Astron. Astrophys. 2021, 21, 131. [Google Scholar] [CrossRef]
- Cullather, R.; Shindell, D. Solar forcing of Southern Hemisphere climate change during the Maunder Minimum. In AGU Fall Meeting Abstracts; American Geophysical Union: Washington, DC, USA, 2005. [Google Scholar]
- Varma, V.; Prange, M.; Lamy, F.; Merkel, U.; Schulz, M. Solar-forced shifts of the Southern Hemisphere Westerlies during the Holocene. Clim. Past 2011, 7, 339–347. [Google Scholar] [CrossRef] [Green Version]
- Heredia, T.; Elias, A.G. A study on possible solar and geomagnetic effects on the precipitation over northwestern Argentina. Adv. Space Res. 2013, 51, 1883–1892. [Google Scholar] [CrossRef]
- Heredia, T.; Bazzano, F.M.; Cionco, R.; Soon, W.; Medina, F.D.; Elias, A.G. Searching for solar-like interannual to bidecadal effects on temperature and precipitation over a Southern Hemisphere location. J. Atmos. Solar-Terr. Phys. 2019, 193, 105094. [Google Scholar] [CrossRef]
- Ogurtsov, M.; Helama, S.; Jalkanen, R.; Jungner, H.; Lindholm, M.; Veretenenko, S. Solar-type periodicities in the climate variability of Northern Fennoscandia during the last three centuries: Real influence of solar activity or natural instability in the climate system. Holocene 2022, 32, 99–112. [Google Scholar] [CrossRef]
- Jones, P.D.; Briffa, K.; Barnett, T.P.; Tett, S.F.B. High-resolution palaeoclimatic records for the last millennium: Interpretation, integration and comparison with general circulation model control-run temperatures. Holocene 1998, 8, 455–471. [Google Scholar] [CrossRef]
- Mann, M.E.; Jones, P.D. Global surface temperatures over the past two millennia. Geophys. Res. Lett. 2003, 30, 1820. [Google Scholar] [CrossRef] [Green Version]
- Neukom, R.; Gergis, J.; Karoly, D.; Wanner, H.; Curran, M.; Elbert, J.; González-Rouco, J.F.; Linsley, B.K.; Moy, A.; Mundo, I.; et al. Inter-hemispheric temperature variability over the last millennium. Nat. Clim. Chang. 2014, 4, 362–367. [Google Scholar] [CrossRef]
- Ogurtsov, M.; Lindholm, M.; Jalkanen, R.; Veretenenko, S.V. New evidence of solar variation in temperature proxies from Northern Fennoscandia. Adv. Space Res. 2013, 52, 1647–1654. [Google Scholar] [CrossRef]
- Mann, M.; Park, J.; Bradley, R. Global interdecadal and century-scale climate oscillations during the past five centuries. Nature 1995, 378, 266–270. [Google Scholar] [CrossRef]
- Beer, J.; Siegenthaler, U.; Bonani, G.; Finkel, R.C.; Oeschger, H.; Suter, M.; Wölfli, W. Information on past solar activity and geomagnetism from 10Be in the Camp Century ice core. Nature 1988, 331, 675–679. [Google Scholar] [CrossRef]
- Bard, E.; Raisbeck, G.M.; Yiou, F.; Jouzel, J. Solar modulation of cosmogenic nuclide production over the last millennium: Comparison between 14C and 10Be records. Earth Planet. Sci. Lett. 1997, 150, 453–462. [Google Scholar] [CrossRef]
- Bard, E.G.; Raisbeck, F.; Yiou, T.; Jouzel, J. Solar irradiance during the last 1200 years based on cosmogenic nuclides. Tellus B 2000, 52, 985–992. [Google Scholar] [CrossRef]
- Delaygue, G.; Bard, E. An Antarctic view of Beryllium-10 and solar activity for the past millennium. Clim. Dyn. 2011, 36, 2201–2218. [Google Scholar] [CrossRef]
Figure 1.
Reconstructions of annual temperature in Southern Hemisphere: (A) the time series of Jones et al. [18]; (B) the time series of Mann and Jones [19]; (C) the time series of Neucomb et al. [20].

Figure 2.
(A) Concentration of the cosmogenic 10Be in Antarctic ice [25]; (B) total solar irradiance (TSI) reconstructed by Bard et al. [25]; (C) concentration of the cosmogenic 10Be in Antarctic ice [26]; (D) solar modulation parameter Φ (in MV) reconstructed by Delaygue and Bard [26].

Figure 3.
(A) Local Morlet wavelet spectrum of temperature proxy after Jones et al. [18]. The spectrum is normalized to 0.95 confidence level calculated for a red noise with AR(1) = 0.35. (B) Local Morlet wavelet spectrum of temperature proxy of Mann and Jones [19]. The spectrum is normalized to variance. (C) Local Morlet wavelet spectrum of temperature proxy of Neucomb et al. [20]. The spectrum is normalized to 0.95 confidence level calculated for a red noise with AR(1) = 0.65. (D) Global wavelet spectrum of temperature proxy of Jones et al. [18]. (E) Global wavelet spectrum of temperature proxy of Mann and Jones [19]. (F) Global wavelet spectrum of temperature proxy of Neucomb et al. [20].

Figure 4.
(A) Fourier spectrum of temperature proxy of Jones et al. [18]. (B) Fourier spectrum of temperature proxy of Mann and Jones [19]. (C) Fourier spectrum of temperature proxy of Neucomb et al. [20]. Confidence levels are based on spectra of appropriate noises.

Figure 5.
Time series wavelet filtered (MHAT basis) in 58–133-year band. Gray curve—temperature reconstruction of Jones et al. [18], black curve—solar modulation parameter Φ [22]. Second-order polynomial trends were preliminarily subtracted from both series.


Table 1.
Correlation coefficient between Southern Hemisphere temperatures and solar activity calculated over the last millennium. All the time series wavelet filtered in 58–133-year scale band.
Table 1.
Correlation coefficient between Southern Hemisphere temperatures and solar activity calculated over the last millennium. All the time series wavelet filtered in 58–133-year scale band.
| Reference | [25] | [25] | [26] | [26] |
|---|---|---|---|---|
| [18] | −0.17 (0, 0.40) | 0.19 (0, 0.22) | 0.21 (0, 0.33) | −0.22 (0, 0.27) |
| [19] | −0.39 (0, 0.036) | 0.41 (0, 0.014) | 0.46 (0, 0.029) | −0.41 (0, 0.046) |
| [20] | −0.08 (0, >0.5) | 0.18 (0, 0.31) | 0.15 (0, >0.5) | −0.07 (0, >0.5) |
Publisher’s Note: MDPI stays neutral with regard to jurisdictional claims in published maps and institutional affiliations. |
© 2022 by the author. Licensee MDPI, Basel, Switzerland. This article is an open access article distributed under the terms and conditions of the Creative Commons Attribution (CC BY) license (https://creativecommons.org/licenses/by/4.0/).
Share and Cite
MDPI and ACS Style
Ogurtsov, M. A Study on Possible Solar Influence on the Climate of the Southern Hemisphere. Atmosphere 2022, 13, 680. https://doi.org/10.3390/atmos13050680
AMA Style
Ogurtsov M. A Study on Possible Solar Influence on the Climate of the Southern Hemisphere. Atmosphere. 2022; 13(5):680. https://doi.org/10.3390/atmos13050680
Chicago/Turabian StyleOgurtsov, Maxim. 2022. "A Study on Possible Solar Influence on the Climate of the Southern Hemisphere" Atmosphere 13, no. 5: 680. https://doi.org/10.3390/atmos13050680
Note that from the first issue of 2016, this journal uses article numbers instead of page numbers. See further details here.