Article

Improving the Estimation of Throughfall Amounts in Primeval Forests along an Elevation Gradient on Mountain Gongga, Southwest China

1
Institute of Mountain Hazards and Environment, Chengdu 610041, China
2
University of Chinese Academy of Sciences, Beijing 100049, China
3
State Key Laboratory of Hydraulics and Mountain River Engineering, College of Water Resource and Hydropower, Sichuan University, Chengdu 610065, China
*
Author to whom correspondence should be addressed.
Atmosphere 2022, 13(4), 639; https://doi.org/10.3390/atmos13040639
Submission received: 8 March 2022 / Revised: 14 April 2022 / Accepted: 15 April 2022 / Published: 18 April 2022
(This article belongs to the Special Issue Climate Change Impact on the Forest Hydrological Cycle)

Abstract

:
Differences in rainfall partition into throughfall among different primeval forests distributed along an altitude gradient are inadequately investigated and understood. Through continuous and automatic monitoring of natural rainfall and throughfall along an elevation gradient on Mountain Gongga, we examined the response of throughfall to various rainfall patterns in the broadleaved forest (BF), broadleaved-coniferous mixed forest (MF), and coniferous forest (CF) across individual rain events from May to October in 2019. A series of linear models that estimate throughfall amount were obtained and compared. Results showed that throughfall was jointly controlled by rainfall characteristics (including amount, duration, average, and peak intensity) and leaf area index (LAI). Rainfall amount was the primary control for throughfall amount. The models with all rainfall parameters and LAI as variables did not markedly outperform (R2 enhancement by 0–0.02) the simple linear models with rainfall amount as the only variable; therefore, the latter are recommended due to simplicity and easiness of use. Although the correlation of throughfall with LAI was less prominent compared to rainfall parameters, LAI showed a significant positive linear correlation (p < 0.05) with the estimated rainfall amount threshold (the rainfall required to saturate the canopy) by the single-variable linear models at the monthly scale. Over the study period, penetration proportions of rainfall in BF, MF, and CF were 83%, 75%, and 80%, respectively. The rainfall amount threshold in CF (0.70 mm) was less than those in BF (0.80 mm) and MF (0.92 mm). Rain events of higher intensity exhibited a higher mean penetration proportion than lower intensity rain events. The use of single-variable linear models developed here, despite some overestimations of throughfall amount, could lead to an overall satisfactory estimation of rainfall redistribution in mountainous areas.

1. Introduction

As the major input source of the forest water cycle, rainfall penetrates through the canopy to the forest floor, and then infiltrates the soil and enriches the soil solution, streams, and groundwater with nutrients [1]. Rainfall in the forest is redistributed: some proportion is retained by the crown canopy for a period of time and then evaporates (as interception); some drips off the branches and leaves and then reaches the soil as throughfall; and some flows down along the stems and branches to the base of plants as stemflow [2]. Throughfall and stemflow eventually reach the ground, participate in the soil water movement, and then recharge to the deep soil layer. Throughfall accounts for the majority of rainfall, while stemflow is volumetrically minor but reaches deeper soil and becomes easier accessible to roots [3,4].
Rainfall partitioning by trees affects the hydrological and biogeochemical fluxes between the atmosphere and soil in the forest [5,6]. Given the high spatial variability of forest vegetation, soil properties and soil moisture condition exhibit large spatial heterogeneity [7,8]. Understanding rainfall partitioning helps explain the variability of soil moisture conditions [9,10], recharge of groundwater, and generation of runoff [11,12]. Therefore, studies about rainfall partitioning are essential to research on water balance in forests [13].
In general, as mentioned in previous studies, rainfall amount that reaches soils is regulated by stand characteristics, including forest type, vegetation cover, height, base diameter, and branch insertion angle [14,15,16], and meteorological variables such as rainfall parameters, evaporation, and the amount of water stored in the canopy [17,18,19,20]. So, it is hard to figure out the relationships between rainfall partitioning pathways and all these stand characteristics and meteorological variables in practice. Thus, the identification of primary factors is essential.
A number of studies have quantified the hydrologic processes in forest systems; however, most of them either focused on the estimation model of canopy interception [21,22,23,24] or were aimed at special stand species or a single plant [10,15,25,26,27,28,29,30,31]. Differences in rainfall partitioning and throughfall proportion among primeval forests (undisturbed for a long time) distributed along an altitude gradient on a mountain, which is featured by varying forest structures and meteorological conditions, are less understood and rarely studied.
The parameters associated with rainfall partitioning can be found in the literature or directly measured, but it sometimes is not easy, especially when long-time continuous monitoring data in the wild is difficult to be obtained, considering the equipment management restrictions and high expense of collecting meteorological and stand variables data [2,32]. Easier measurement and fewer parameters used for estimation of throughfall help to simplify the explanation of rainfall partition pathway in comparison with interception and stemflow.
There are various methods for measurements of throughfall in a forest. Different types of pluviometers network, which is uniformly distributed, moved periodically or maintained in their original and randomly chosen positions around trees, have been used in previous studies [13]. However, water flux in the forest is usually measured using collectors with funnels which need to be emptied manually. According to a review of 90 studies on rainfall partitioning, 48% and 18% of the 90 studies measured gross rainfall and throughfall by normal automatic rain gauges, but only one study monitored throughfall on a larger measuring area by troughs connected to rain gauges [6].
In order to find out the relationships between rainfall partitioning patterns and related parameters (e.g., stand structures and meteorological characteristics), variables should be matched at the same temporal scale because the relationship between rainfall and throughfall depends on the temporal scale considered [33]. Data obtained over a long period cannot be interpolated to a finer temporal scale as many details will be lost during interpolation. Therefore, event-scale-based measurement provides better insights into rainfall partitioning than periodic measurements and are recommended for revealing rainfall partition pathway [34]. When long-term continuous automatic monitor devices are used to collect rainfall and throughfall, the delineation of rain events becomes a primary task. If there is no more rainfall received in a continuous period, that is considered the end of a rain event. When the time interval between rain events is very long or when the observation duration is relatively short, the end of an event can easily be recorded by manual observation. However, when dealing with high-frequency observations over a long period of time, it is more appropriate to set up a quantitative standard for the end of a rainfall event [35]. The duration and time interval of rain events affect the canopy wetting and drying cycles [36], thus, the interval of two successive rain events should be long enough to dry the canopy when the standard for judging the end of a rain event was set.
It is not unusual for measured throughfall to exceed the rainfall value (throughfall percentage is over 100%) within a rain event because the interception can be negative [2]. Reliable measurements of rainfall and throughfall are needed, and to have is accurate throughfall estimation. In a light rain event (event with small rainfall intensity), the rainfall may be completely intercepted by the canopy. Therefore, the rainfall amount threshold is introduced to determine whether throughfall will occur or not [20]. Meanwhile, throughfall lags behind rainfall, and the delay time should be taken into account when dealing with the matching of rainfall and throughfall.
Through continuous automatic in situ rainfall and throughfall monitoring across three vegetation zones along an elevation gradient on Mountain Gongga, the present study aimed to: (i) figure out the characteristics of throughfall and its primary factors under three primeval forests; (ii) quantify the rainfall partition into throughfall at individual rainfall event scale; (iii) discuss the differences in throughfall under different vegetation zones and rainfall conditions.

2. Materials and Methods
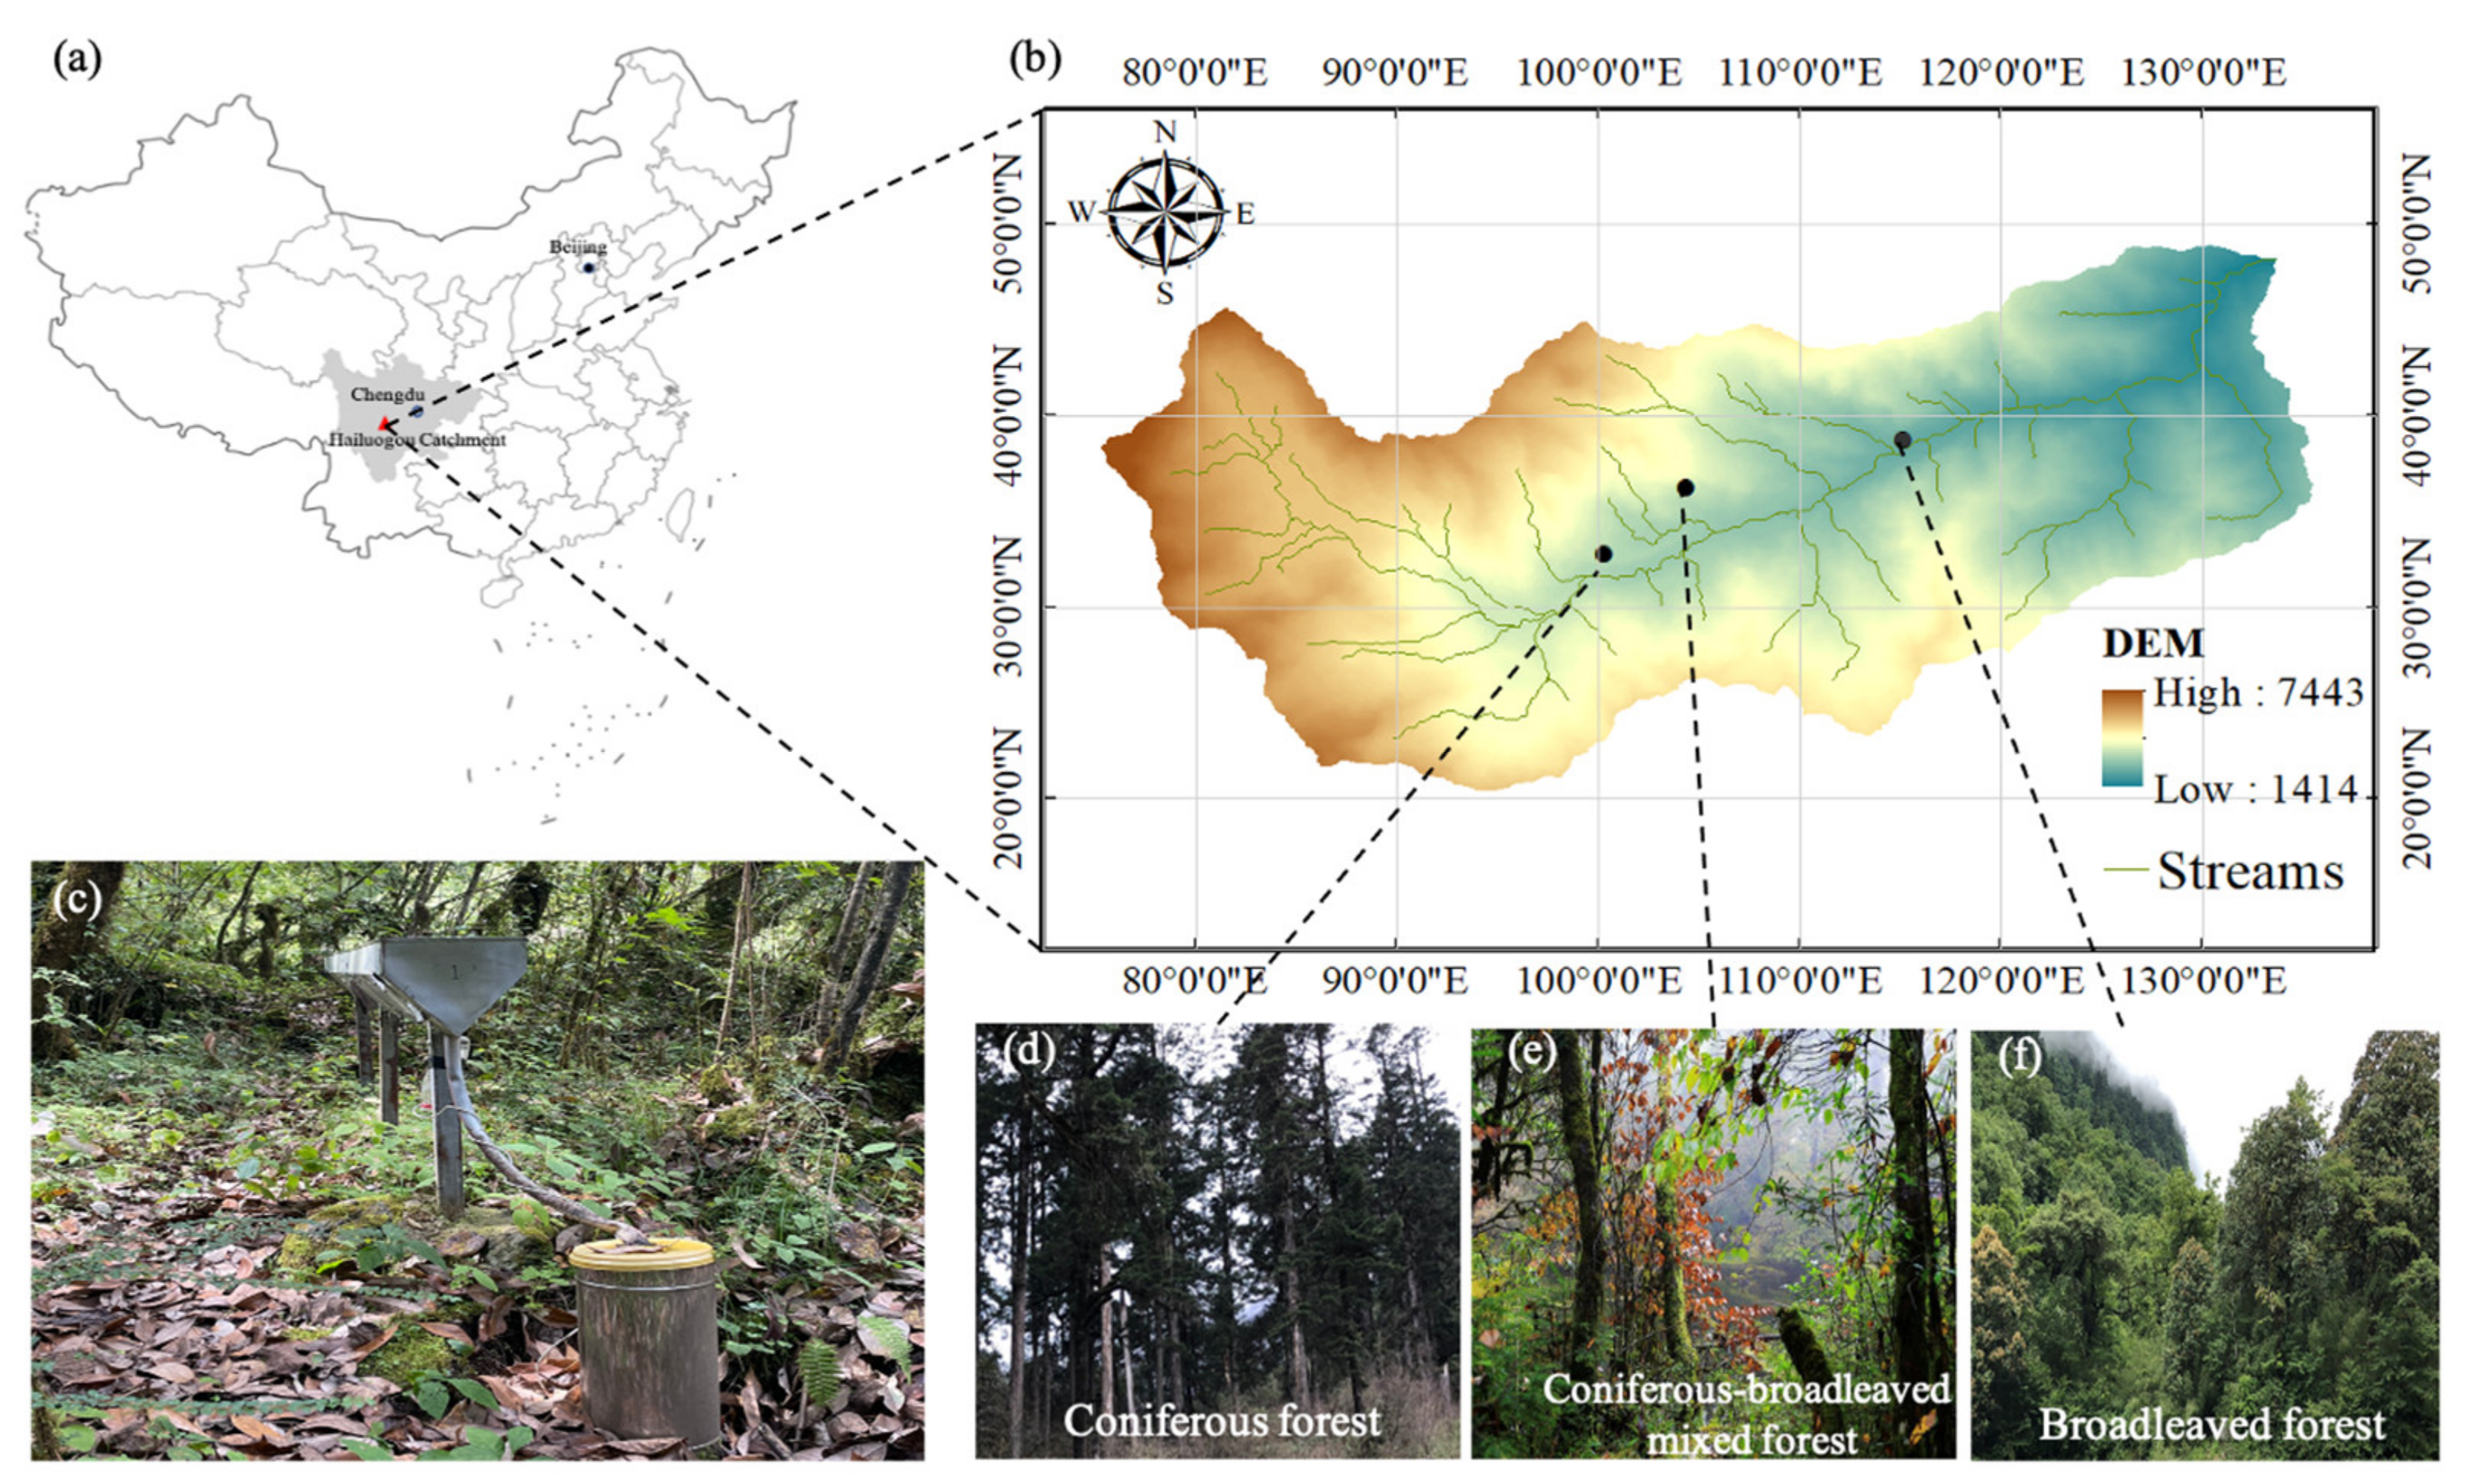
2.1. Study Site

The study site is located in the Hailuogou catchment (102°00′ E, 29°34′ N) on the eastern slope of Mountain Gongga in southwest China (Figure 1a). The altitude of this area changes rapidly within a short horizontal distance (rising 6400 m within 29 km). Various vegetation zones with a total of approximately 2500 vegetation species are observed with the increase in elevation and changing environments from dry-hot valley to permafrost desert conditions [37]. According to the data from two long-term meteorological stations at the Gongga Station of Alpine Ecosystem of the Chinese Academy of Sciences, the annual average temperature and precipitation are 12.7 ℃ and 1050.3 mm (1992–2010) at 1600 m a.s.l., respectively, and 4.2 ℃ and 1947.4 mm (1988–2010) at 3000 m a.s.l., respectively [38]. The rainfall is characterized by high frequency (261 rainy days per year) and low intensity [39]. Generally, the dry season is from November to April and the wet season is from May to October. The rainfall in the wet season accounts for 86.9% and 79.7% of the annual rainfall at 1600 m a.s.l. and 3000 m a.s.l., respectively [40].
There are seven vegetation zones on the eastern slope of Mountain Gongga, among which broadleaved forest (BF), coniferous-broadleaved mixed forest (MF), and dark coniferous forest (CF) account for 24.34%, 18.84%, and 33.28% of the total area of the catchment, respectively [41]. Therefore, three hillslopes (30 m in with and 100 m in length) were selected in this study in BF (at 2286 m asl, 29°35′44″ N, 102°02′55″ E), MF (at 2856 m asl, 29°34′47″ N, 102°00′20″ E) and CF (at 3020 m asl, 29°34′25″ N, 101°59′25″ E) as study plot (Figure 1b). Dominant tree species in CF are Abies fabri with sparse shrubs under the forest canopy, including Rhododendron, Podophylla, Viburnum, and Fargesia. Abies fabri, Hemlock, Populus purdomii, Birch, and Maple are the major tree species in MF and shrubs are vigorously growing. In BF, dominant tree species are Quercus engleriana, Bracteatum, Fagus, and Maple with ferns and moss are also exuberant at the ground surface [41]. According to previous studies [39], stemflow accounts for about 1% or even less of the gross rainfall in this study area due to the rough trunk-covered developed moss. Therefore, the stemflow was ignored in this study, and throughfall was considered the only part of gross rainfall passing through the canopy.

2.2. Data Collection

At each plot, the gross rainfall was collected using a tipping bucket rain gauge (20 cm in diameter) which was installed at a height of 0.5 m above the ground in an open field (100 m away from any trees). Five slightly sloped (about 2°) throughfall trench collectors (300 cm × 25 cm × 30 cm with V-shape metal troughs) were placed 1 m above the ground to eliminate the spatial non-uniform distribution of throughfall. There was a pipe connecting the throughfall trench to a tipping bucket for throughfall amount recording (Figure 1c). In order to guarantee the quality of data, manual cleaning was carried out weekly to avoid blockage of the throughfall collector. All tipping buckets were connected to a CR1000 datalogger (Campbell Scientific Ltd., Logan, UT, USA), and the time interval for data collection was set at 1-h. Data were collected during the growing season (May-October) in 2019.
For each throughfall collector, the throughfall amount was calculated as
T f = A G × R A T
where   T f is the throughfall amount (mm), A G is the opening area of the tipping bucket rain gauge (mm2), A T is the opening area of the metal trough (mm2), R is the resolution of the tipping bucket rain gauge (0.2 mm).
Monthly LAI data was obtained from the MODIS/TERRA satellite products provided by NASA (https://ladsweb.modaps.eosdis.nasa.gov, accessed on 12 December 2021). The fourth level (L4) 8 d product in 2019, MOD15A2, was used in this study with a spatial resolution of 500 m. The MODIS data products including LAI is developed by the MODIS Land Discipline Group (MODLAD), which is a suite of higher level (beyond at- sensor radiance) products relevant to earth system science and global change research. These products are publicly available through the Earth Resources Observation System (EROS) Data Center Distributed Active Archive Center [42].

2.3. Data Processing and Exploration

The interval time between two successive rain events is the canopy drying period. According to the observation, the canopy dried out within 12 h after rainfall. Therefore, 12 h without rainfall was chosen as a mark of the end of an individual rain event. According to the accuracy of the rain gauge, the initiation of a new rainfall event was defined when there is over 0.2 mm rainfall within one hour (exceeding the instrument noise threshold), and the end of an event was defined when the rainfall amount during a 12-h period was less than 0.2 mm (i.e., the level of instrument noise) [43]. Meanwhile, the characteristics of each rain event, including rainfall amount (PG, mm), duration (Dru, h), average intensity (In, mm/h), and peak intensity (Inpeak, mm/h) were calculated according to the rain event delineation.
For each vegetation zone, the delineated rain events were classified into three groups: short events (<20 h), moderate events (20–60 h), and long events (>60 h). Each group was further divided into high-intensity and low-intensity subgroups according to the average intensity of the rain event.
This study focused on the comparisons of throughfall amount (Tf) among the three vegetation zones without considering the spatial variability within each vegetation zone. Values of throughfall amount obtained with five collectors in the same plot were averaged as the final throughfall value of this plot. The beginning and termination of throughfall may lag behind rainfall due to the canopy interception, especially when the rainfall has low intensity. We hypothesized that rainfall and throughfall had the same duration. The start and end of an individual throughfall event was determined according to the rainfall duration and delay time, and the throughfall amount was then calculated. The penetration proportion of a rain event was determined as the ratio of throughfall amount to rainfall amount. Abnormal rain events with a penetration proportion exceeding 100% or with no throughfall occurrence were excluded from analyses in this study.
The rainfall amount threshold for initiation of throughfall is usually defined as the rainfall amount required to saturate the canopy. It is similar to the definition of the water storage capacity of the forest canopy, which has been presented by Klaassen et al. (1998). In the present study, the rainfall amount threshold was calculated as the intercept of the model obtained by regression analysis to correlate throughfall amount and rainfall amount.

2.4. Statistical Analyses

For all rain events during the study period in each vegetation zone, Pearson correlations of throughfall amount and penetration proportion with rainfall parameters (amount, duration, intensity, and peak intensity) and LAI were analyzed. In addition, multivariable linear models were established between rainfall parameters, LAI, and throughfall amount by multiple regression analysis. All of the statistical analyses were performed using SPSS18.0 statistical software (SPSS Inc., Chicago, IL, USA).

3. Results

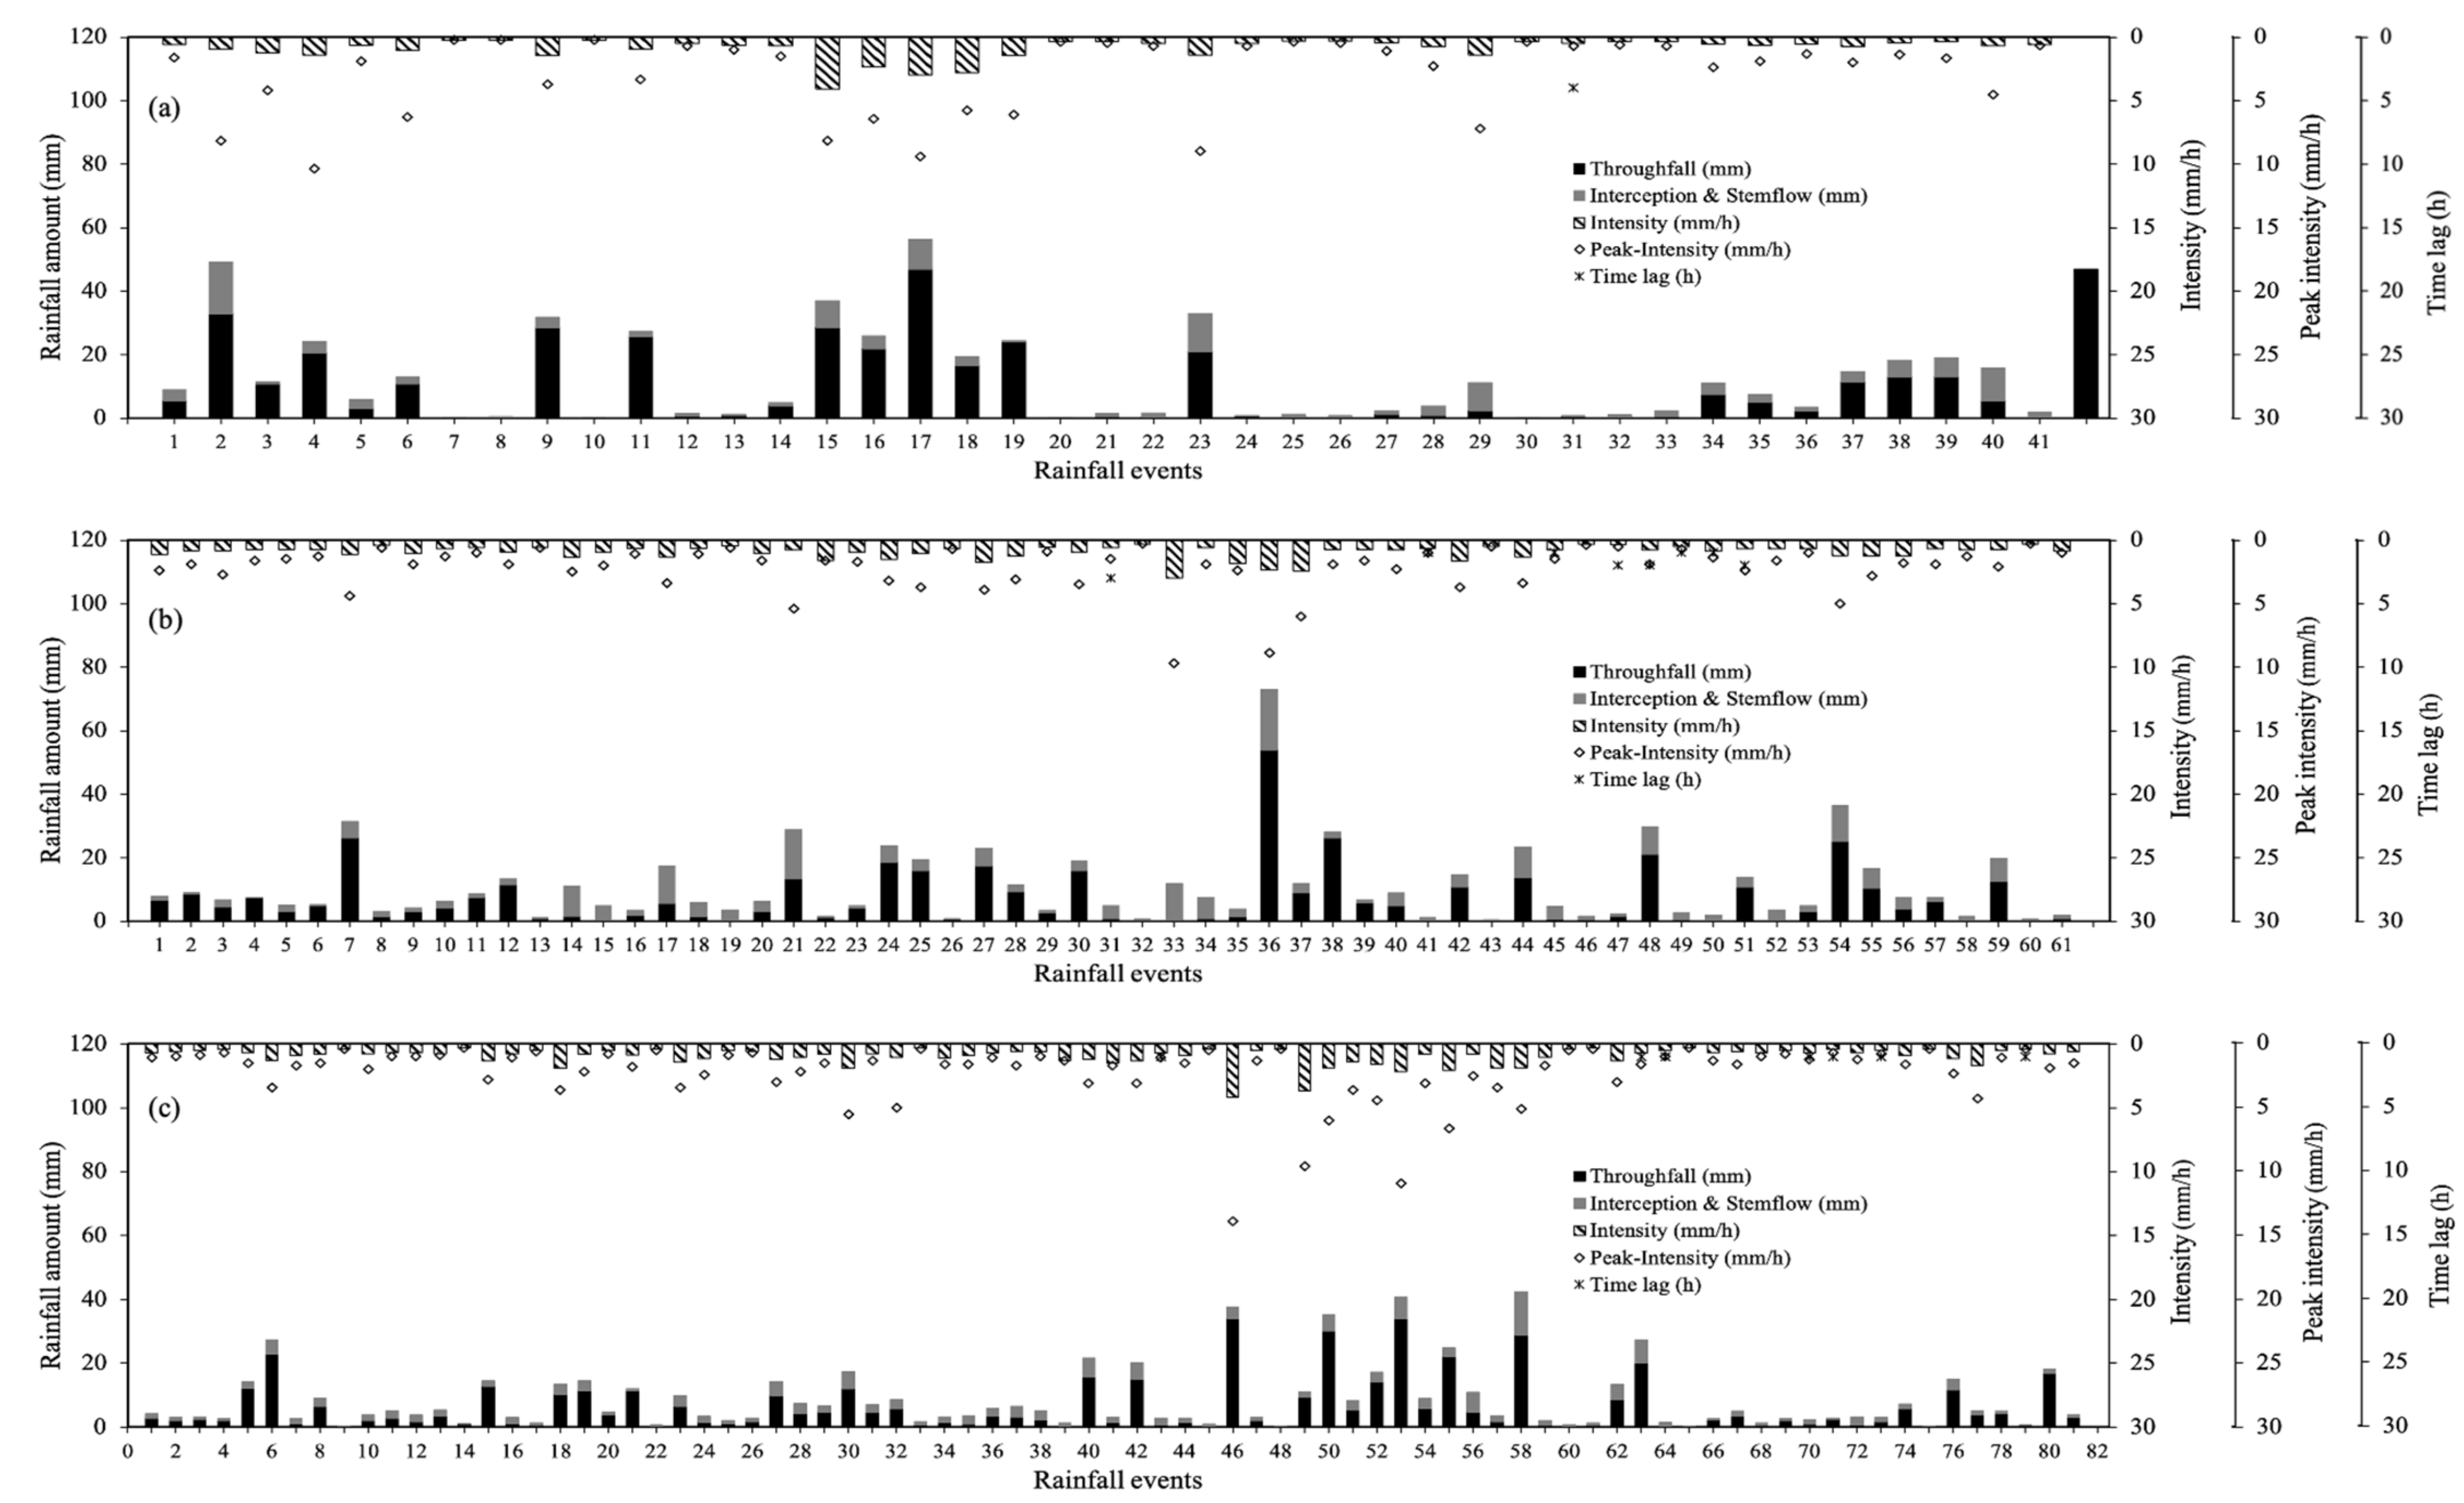
3.1. Rainfall Characteristics

3.1.1. Rain Events Delineation

From May to October 2019, a total rainfall amount of 1283.66 mm, 1187.10 mm, and 1037.70 mm was measured in CF, MF, and BF, respectively. Correspondingly, a total throughfall amount of 908.10 mm, 777.32 mm, and 591.43 mm was measured in CF, MF, and BF, respectively. Penetration proportions in CF, MF and BF were 71%, 65% and 57%, respectively. Obviously, total rainfall amount, throughfall amount, and penetration proportion increased with increasing altitude.
The monitoring data of all rain events excluding the abnormal ones were analyzed. The rainfall amount, average intensity, peak intensity, throughfall amount, and time lag of each rain event were shown in Figure 2. Across a total of 41 rain events delineated in CF (Figure 2a), the rainfall amount ranged from 0.24 mm to 56.38 mm with a mean of 12.08 mm, the average intensity and peak intensity were 0.90 mm/h and 10.34 mm/h, respectively. Across a total of 61 rain events delineated in MF (Figure 2b), the rainfall amount ranged from 0.50 mm to 72.90 mm with a mean of 10.66 mm, the average intensity and peak intensity were 0.96 mm/h and 9.70 mm/h, respectively. Across a total of 81 rain events delineated in BF (Figure 2c), the rainfall amount ranged from 0.30 mm to 42.40 mm with a mean of 8.38 mm, the average intensity and peak intensity were 0.96 mm/h and 13.90 mm/h, respectively. Nearly half of the rain events had a total amount of less than 5 mm and an intensity lower than 0.7 mm/h in all these three vegetation zones. The time lag of the occurrence of throughfall in most rain events was less than one hour except for a few rain events (about 8%) that lasted 1–2 h. Overall, heavy rainfall amount (>10 mm), high average intensity (>1 mm/h), and high peak intensity (>2 mm/h) were commonly observed in one rain event.

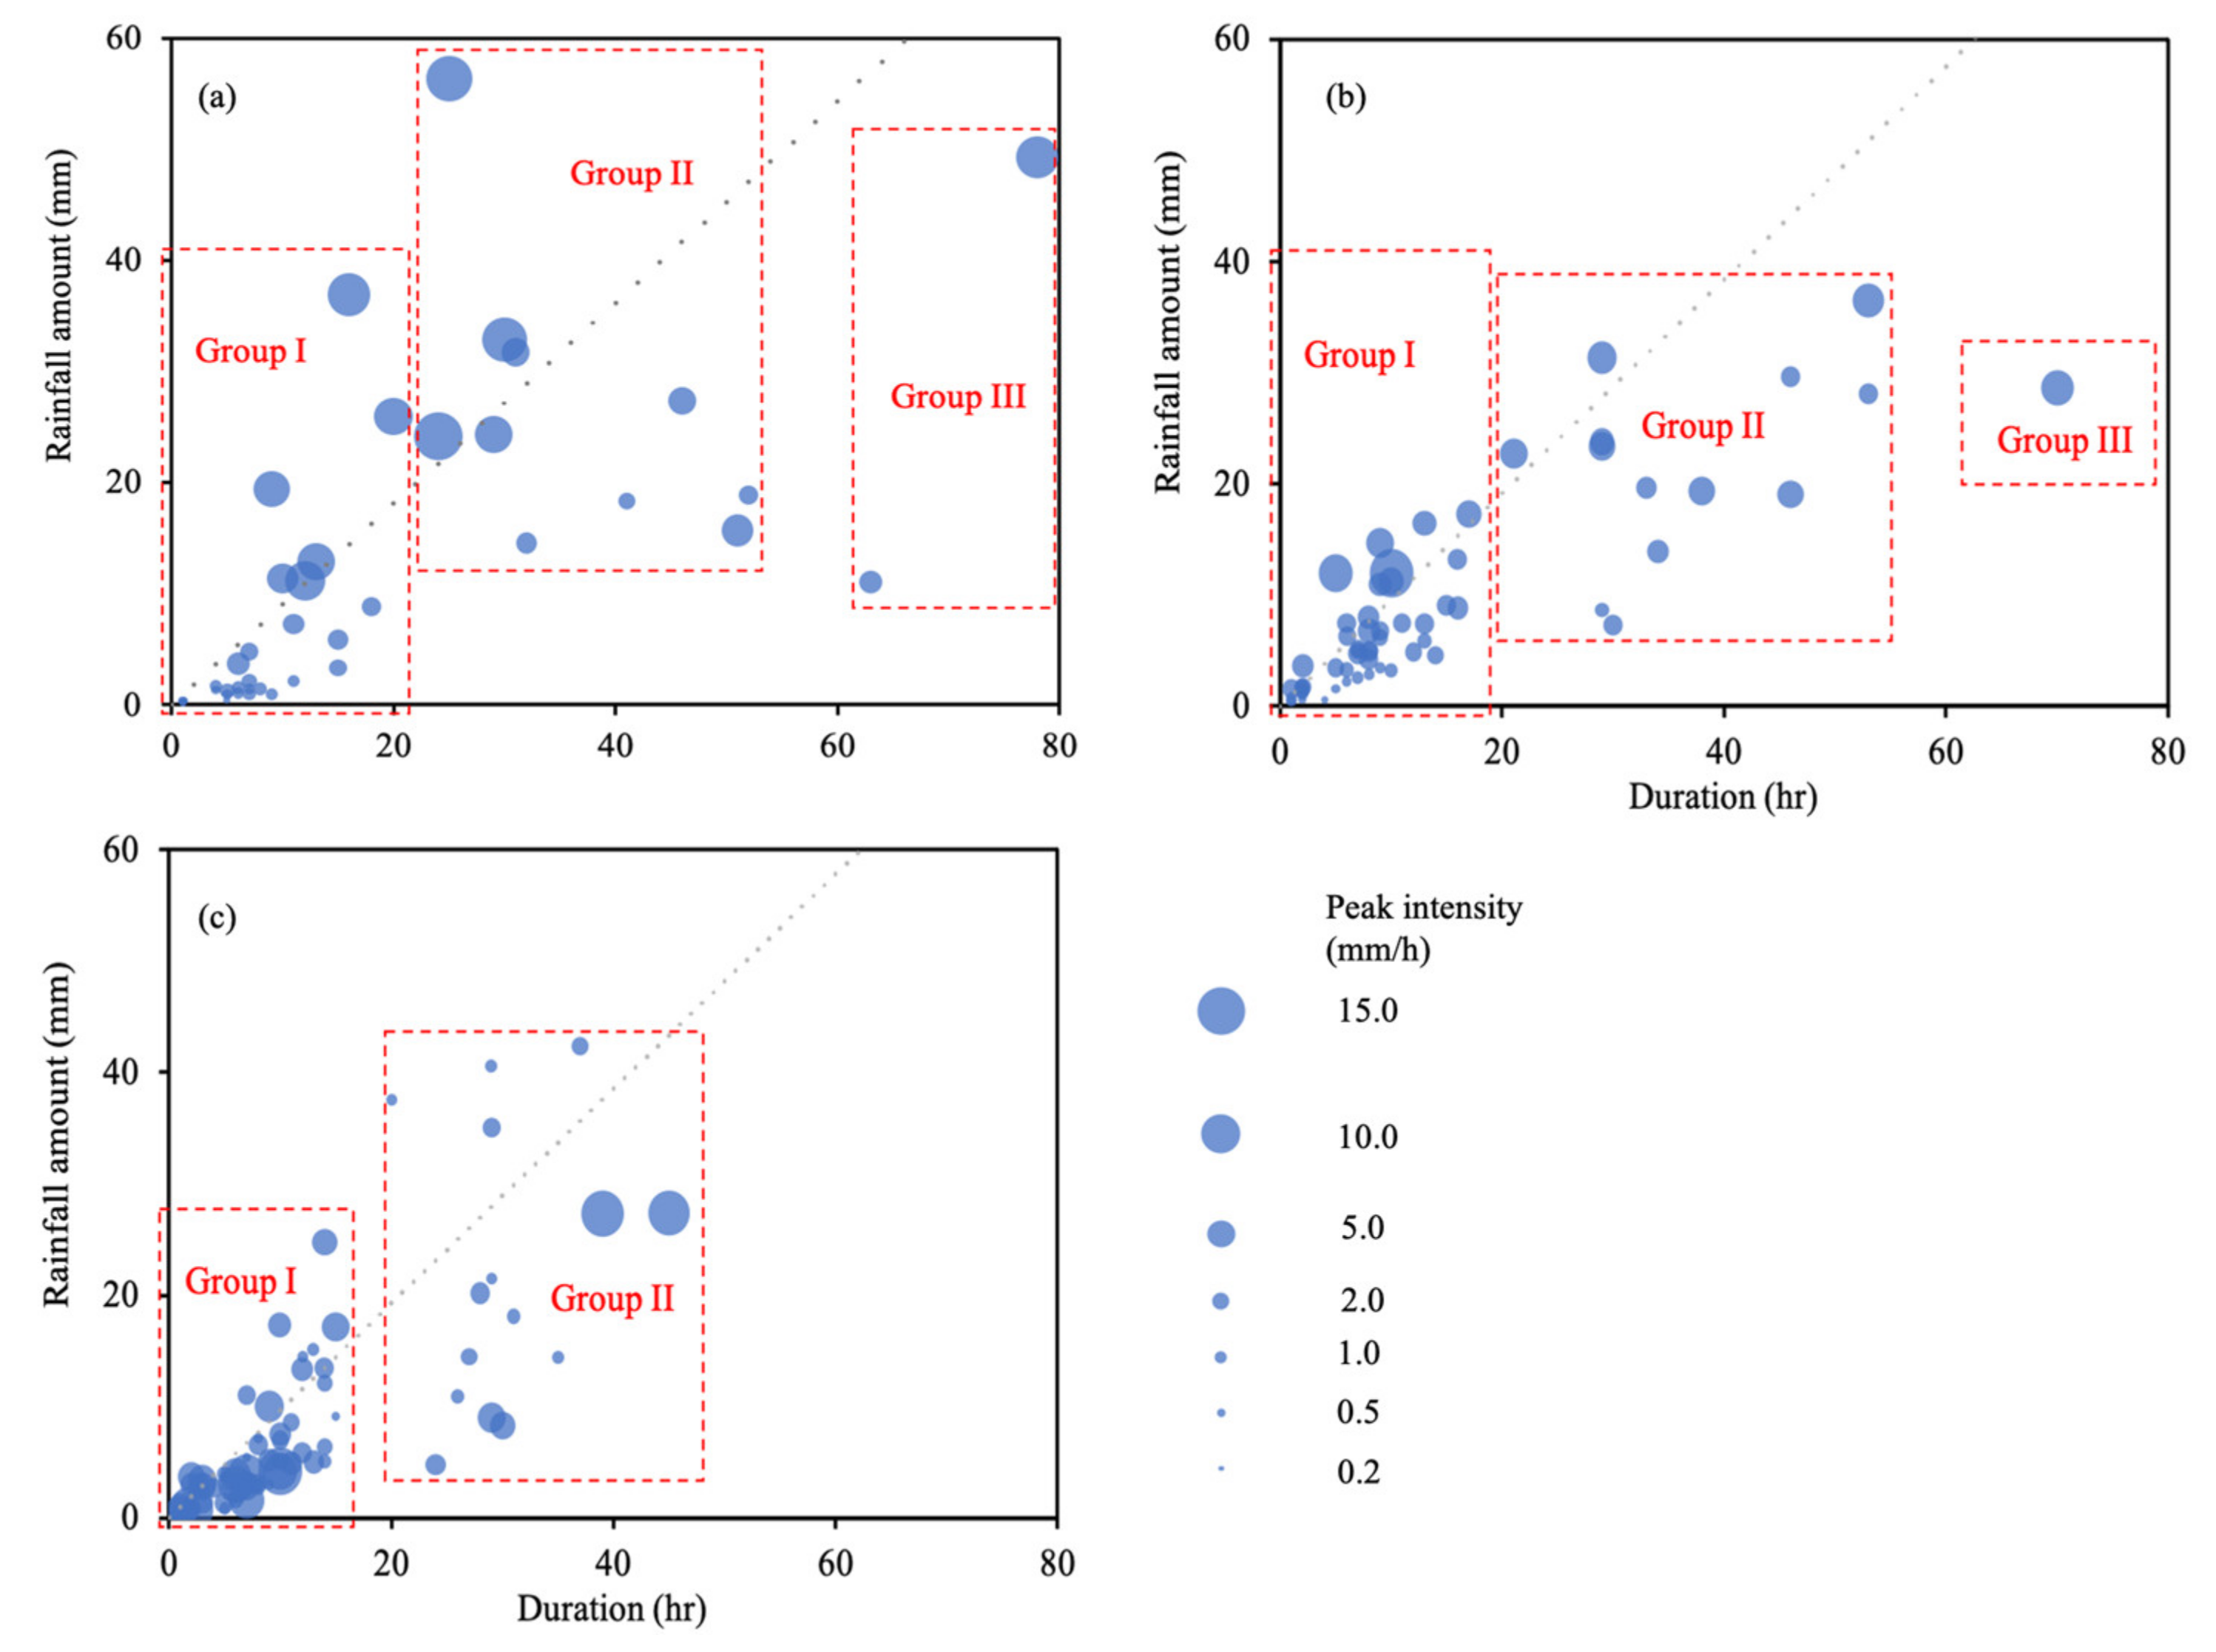
3.1.2. Classification of Rainfall Events

The rain events were classified into three groups for each vegetation zone according to rainfall duration (Figure 3 and Table 1). Group I (n = 29 in CF, n = 46 in MF and n = 66 in BF) represented the short-duration rain events with a duration shorter than 20 h. Group II (n = 10 in CF, n = 14 in MF and n = 15 in BF) represented the moderate-duration rain events with a duration of 20–60 h. Group III (n = 2 in CF, n = 1 in MF and n = 0 in BF) represented the long-duration rain events with a duration longer than 60 h. Rain events in each group were divided into two subgroups according to average intensity. If the average intensity was higher than its mean for this vegetation zone, the rain event was classified as a high-intensity subgroup; otherwise, the rain event was classified as a low-intensity subgroup. In both CF and BF, rain events exhibited all three types of duration, while in BF, rain events occurred with only short- and moderate-duration. Among all three vegetation zones, rain events concentrated in the low-intensity subgroup in Group I, accounting for more than 50% of all the events. Contrastingly, high-intensity rain events in Group II contributed the most to the total rainfall amount (40% for CF, 35% for MF, and 34% for BF). Therefore, light rain events were more frequent, but their contribution to total rainfall amount was less than heavy rain events. Moreover, across all the events in three vegetation zones, the mean penetration proportion was found to be greater in high-intensity rain events (71%), as compared to low-intensity rain events (58%).

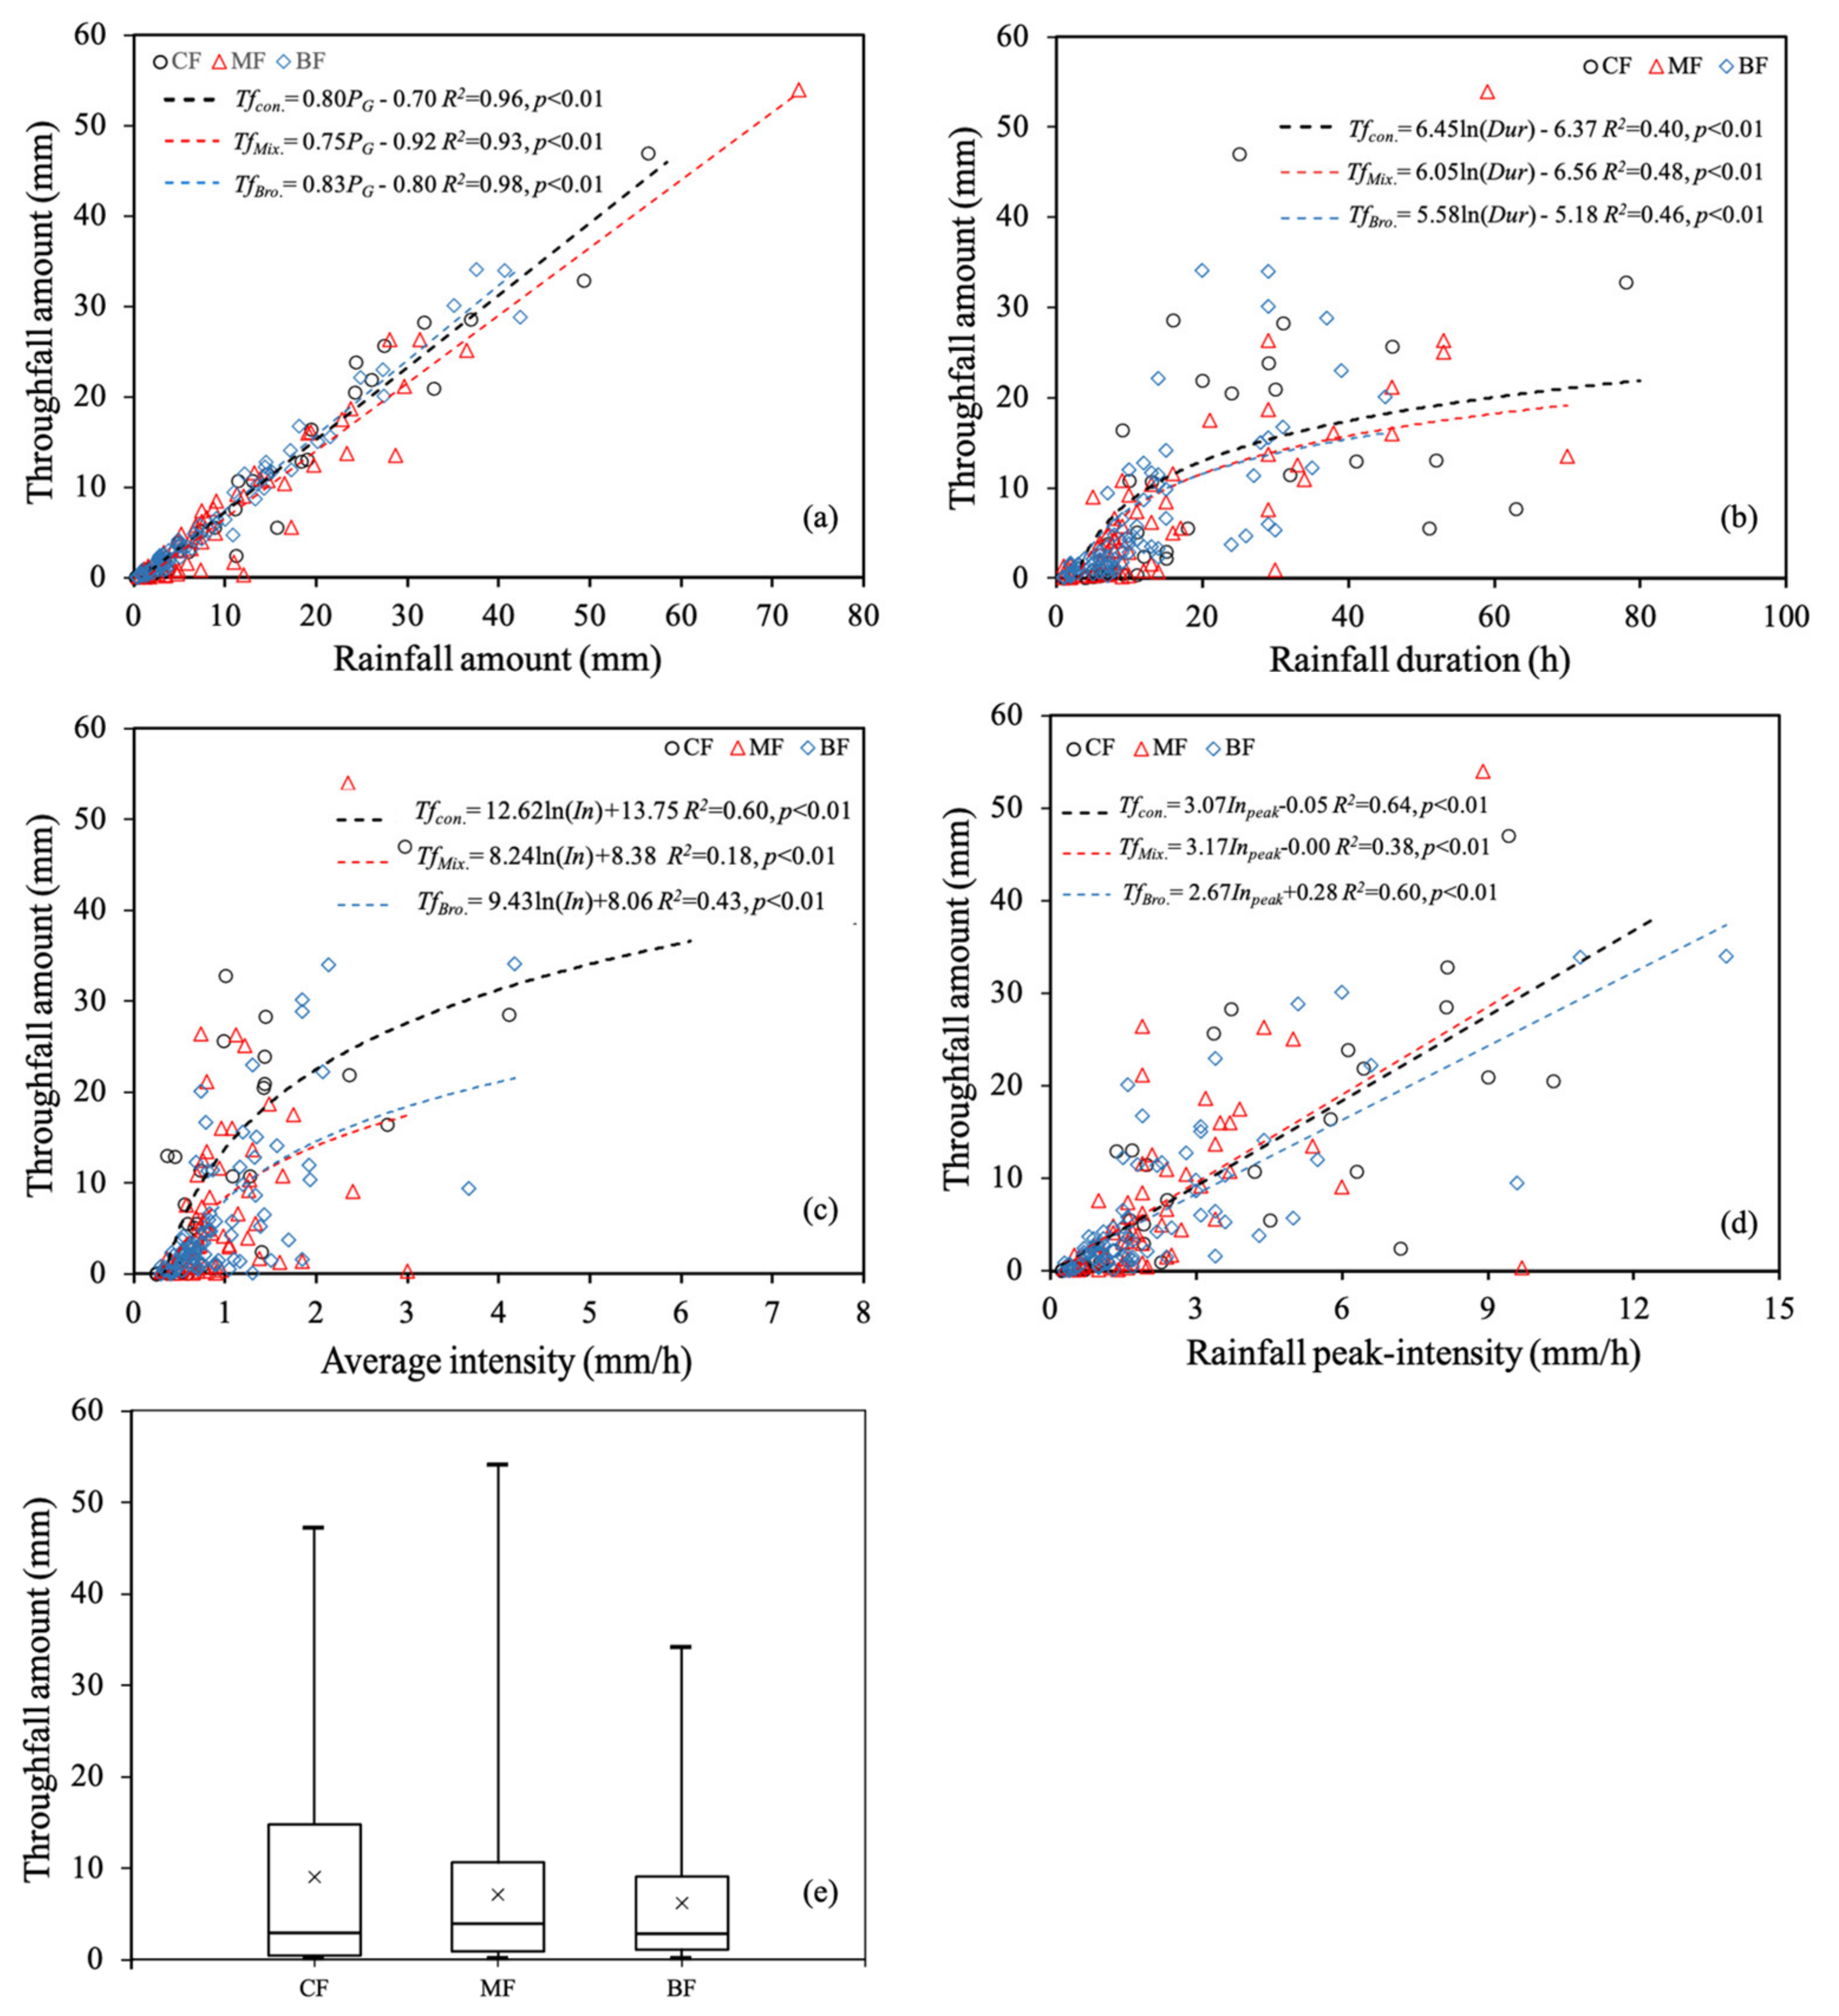
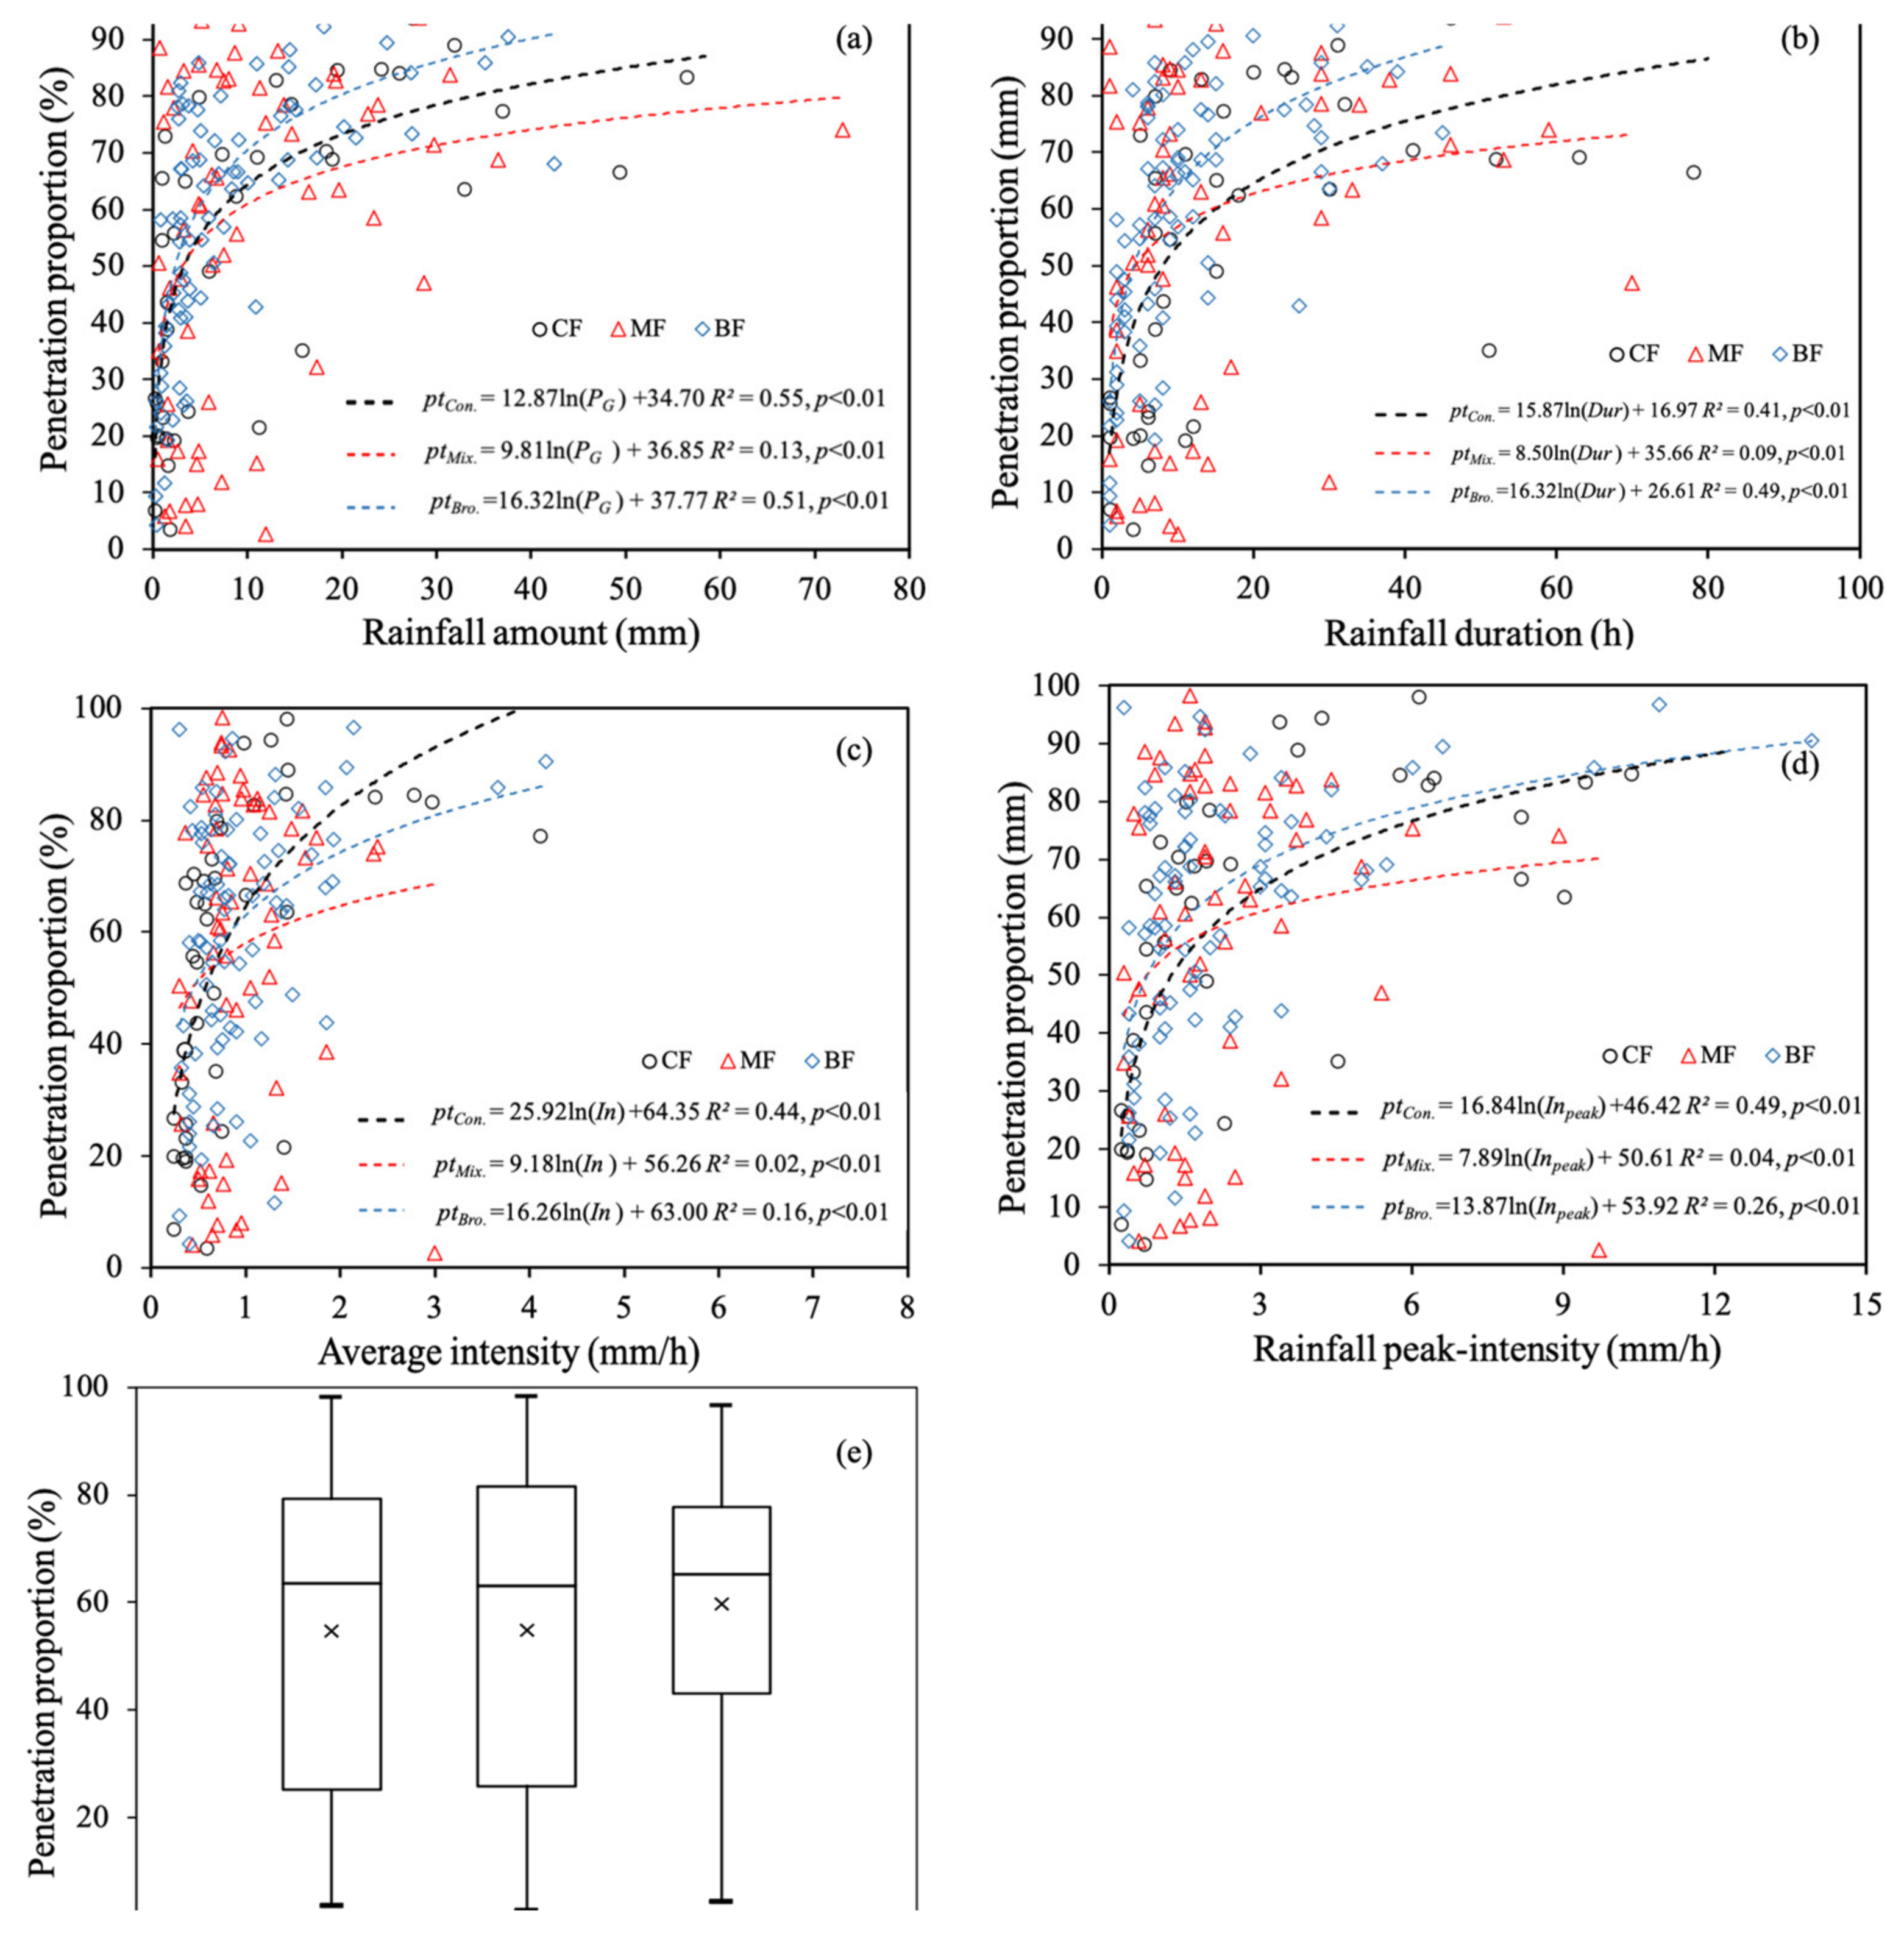
3.2. Throughfall in Relation to Rainfall Parameters and LAI

Results of the Pearson correlation analysis (Table 2) showed that there were significant positive correlations of throughfall amount with rainfall amount, duration, average intensity, and peak intensity at the confidence level of p < 0.01. Throughfall amount was also significantly correlated with LAI in both CF and BF. Penetration proportion increased with the increase in rainfall amount, duration, and intensity in all three vegetation zones, except that no significant relationships were found between penetration proportion and rainfall intensity in MF.
Figure 4 shows the fitted models relating throughfall amount to rainfall amount, duration, intensity, and peak intensity. Throughfall amount exhibited positive, linear correlations with rainfall amount and peak intensity (Figure 4a,d), while it increased logarithmically with the increase in rainfall duration and average intensity (Figure 4b,c). According to the determination coefficient (R2), the fitted models for CF and BF were better than MF, and the correlations of throughfall amount with rainfall amount were the strongest, as compared to those with the other rainfall parameters. Using the linear models shown in Figure 4a, rainfall amount thresholds for initiation of throughfall in CF, MF, and BF were estimated to be 0.70 mm, 0.92 mm, and 0.80 mm, respectively. The box plots (Figure 4e) described the comparison of the mean, median, 25th, and 75th percentile values of throughfall amount among CF, MF, and BF. Throughfall amount varied in a wide range but were mostly (approx. 75%) less than 10 mm in all three vegetation zones. The measured values of throughfall amount were the most concentrated in BF but the least concentrated in CF. Both the mean (8.96 mm in CF, 7.10mm in MF, and 6.13 mm in BF) and median (2.91 mm in CF, 3.90mm in MF, and 2.84 mm in BF) values of throughfall amount were of similar levels across different forests.
The penetration proportion increased logarithmically with the increase in rainfall amount, duration, average intensity, and peak intensity, and tended to become stable gradually when it reached 70% (Figure 5). The goodness of fit of the models relating penetration proportion to each individual rainfall parameter (indicated by R2) was worse than that of the corresponding models for throughfall amount shown in Figure 4. R2 of the fitted models relating penetration proportion to rainfall parameters individually was highest in MF, followed by CF and BF. The models with rainfall peak intensity as a variable had higher R2 than the models with rainfall average intensity as the variable. When rainfall amount was greater than 1 mm, penetration proportion in MF was lowest among the three vegetations (Figure 5a). Similarly, when rainfall average intensity was greater than 1 mm/h, penetration proportion in MF was lower than those in the other two vegetation zones (Figure 5c). Figure 5e shows that the distribution of the observed penetration proportions in CF and MF was more dispersed than that in BF. Similar means and median percentiles of penetration proportion were found in CF, MF, and BF.

3.3. Estimation of Throughfall

During the study period, throughfall amount was significantly, positively correlated not only with the rainfall parameters but also LAI (Table 2). The models for estimating throughfall amount, which were obtained through multiple linear regression analysis of the data of total events and the low-intensity rain event subgroups of Group I, were shown in Table 3. By comparing the determination coefficient (R2) of multi-variable linear regressions and single-variable linear regressions in the same forest, it is found that the models taking more influencing factors into account could lead to a better estimation of throughfall amount. However, a good estimation (R2 > 0.80) could still be achieved by the models using only rainfall amount as the variable. For the models trained with the data of all rain events, the differences in determination coefficient (R2) between multiple linear regressions and simple linear regressions were small (0.01–0.02); however, for models trained with the data of light rain events, the differences were greater (0.02–0.07). Therefore, more variables should be used for estimating throughfall in light rain events.
The relationships between the estimated and observed values of throughfall amount were linear (R2 > 0.9, slopes of 0.93–0.98, and intercepts of 0.14–0.48 mm), and the fitted regression lines only slightly deviate from the 1:1 line (Figure 6). This corroborates the high accuracies of the linear models developed in this study. Moreover, a critical value for each model is found: when the observation throughfall amount exceeds the critical value, it is overestimated; otherwise, it is underestimated. The critical values in CF, MF, and BF were 8.62 mm, 7.06 mm, and 6.12 mm, respectively, which decreased with increasing altitude. It was found that, across the three forest zones, the throughfall amount was overestimated for more than 60% of all rain events and even more than 90% of low-intensity rainfall events in Group I.

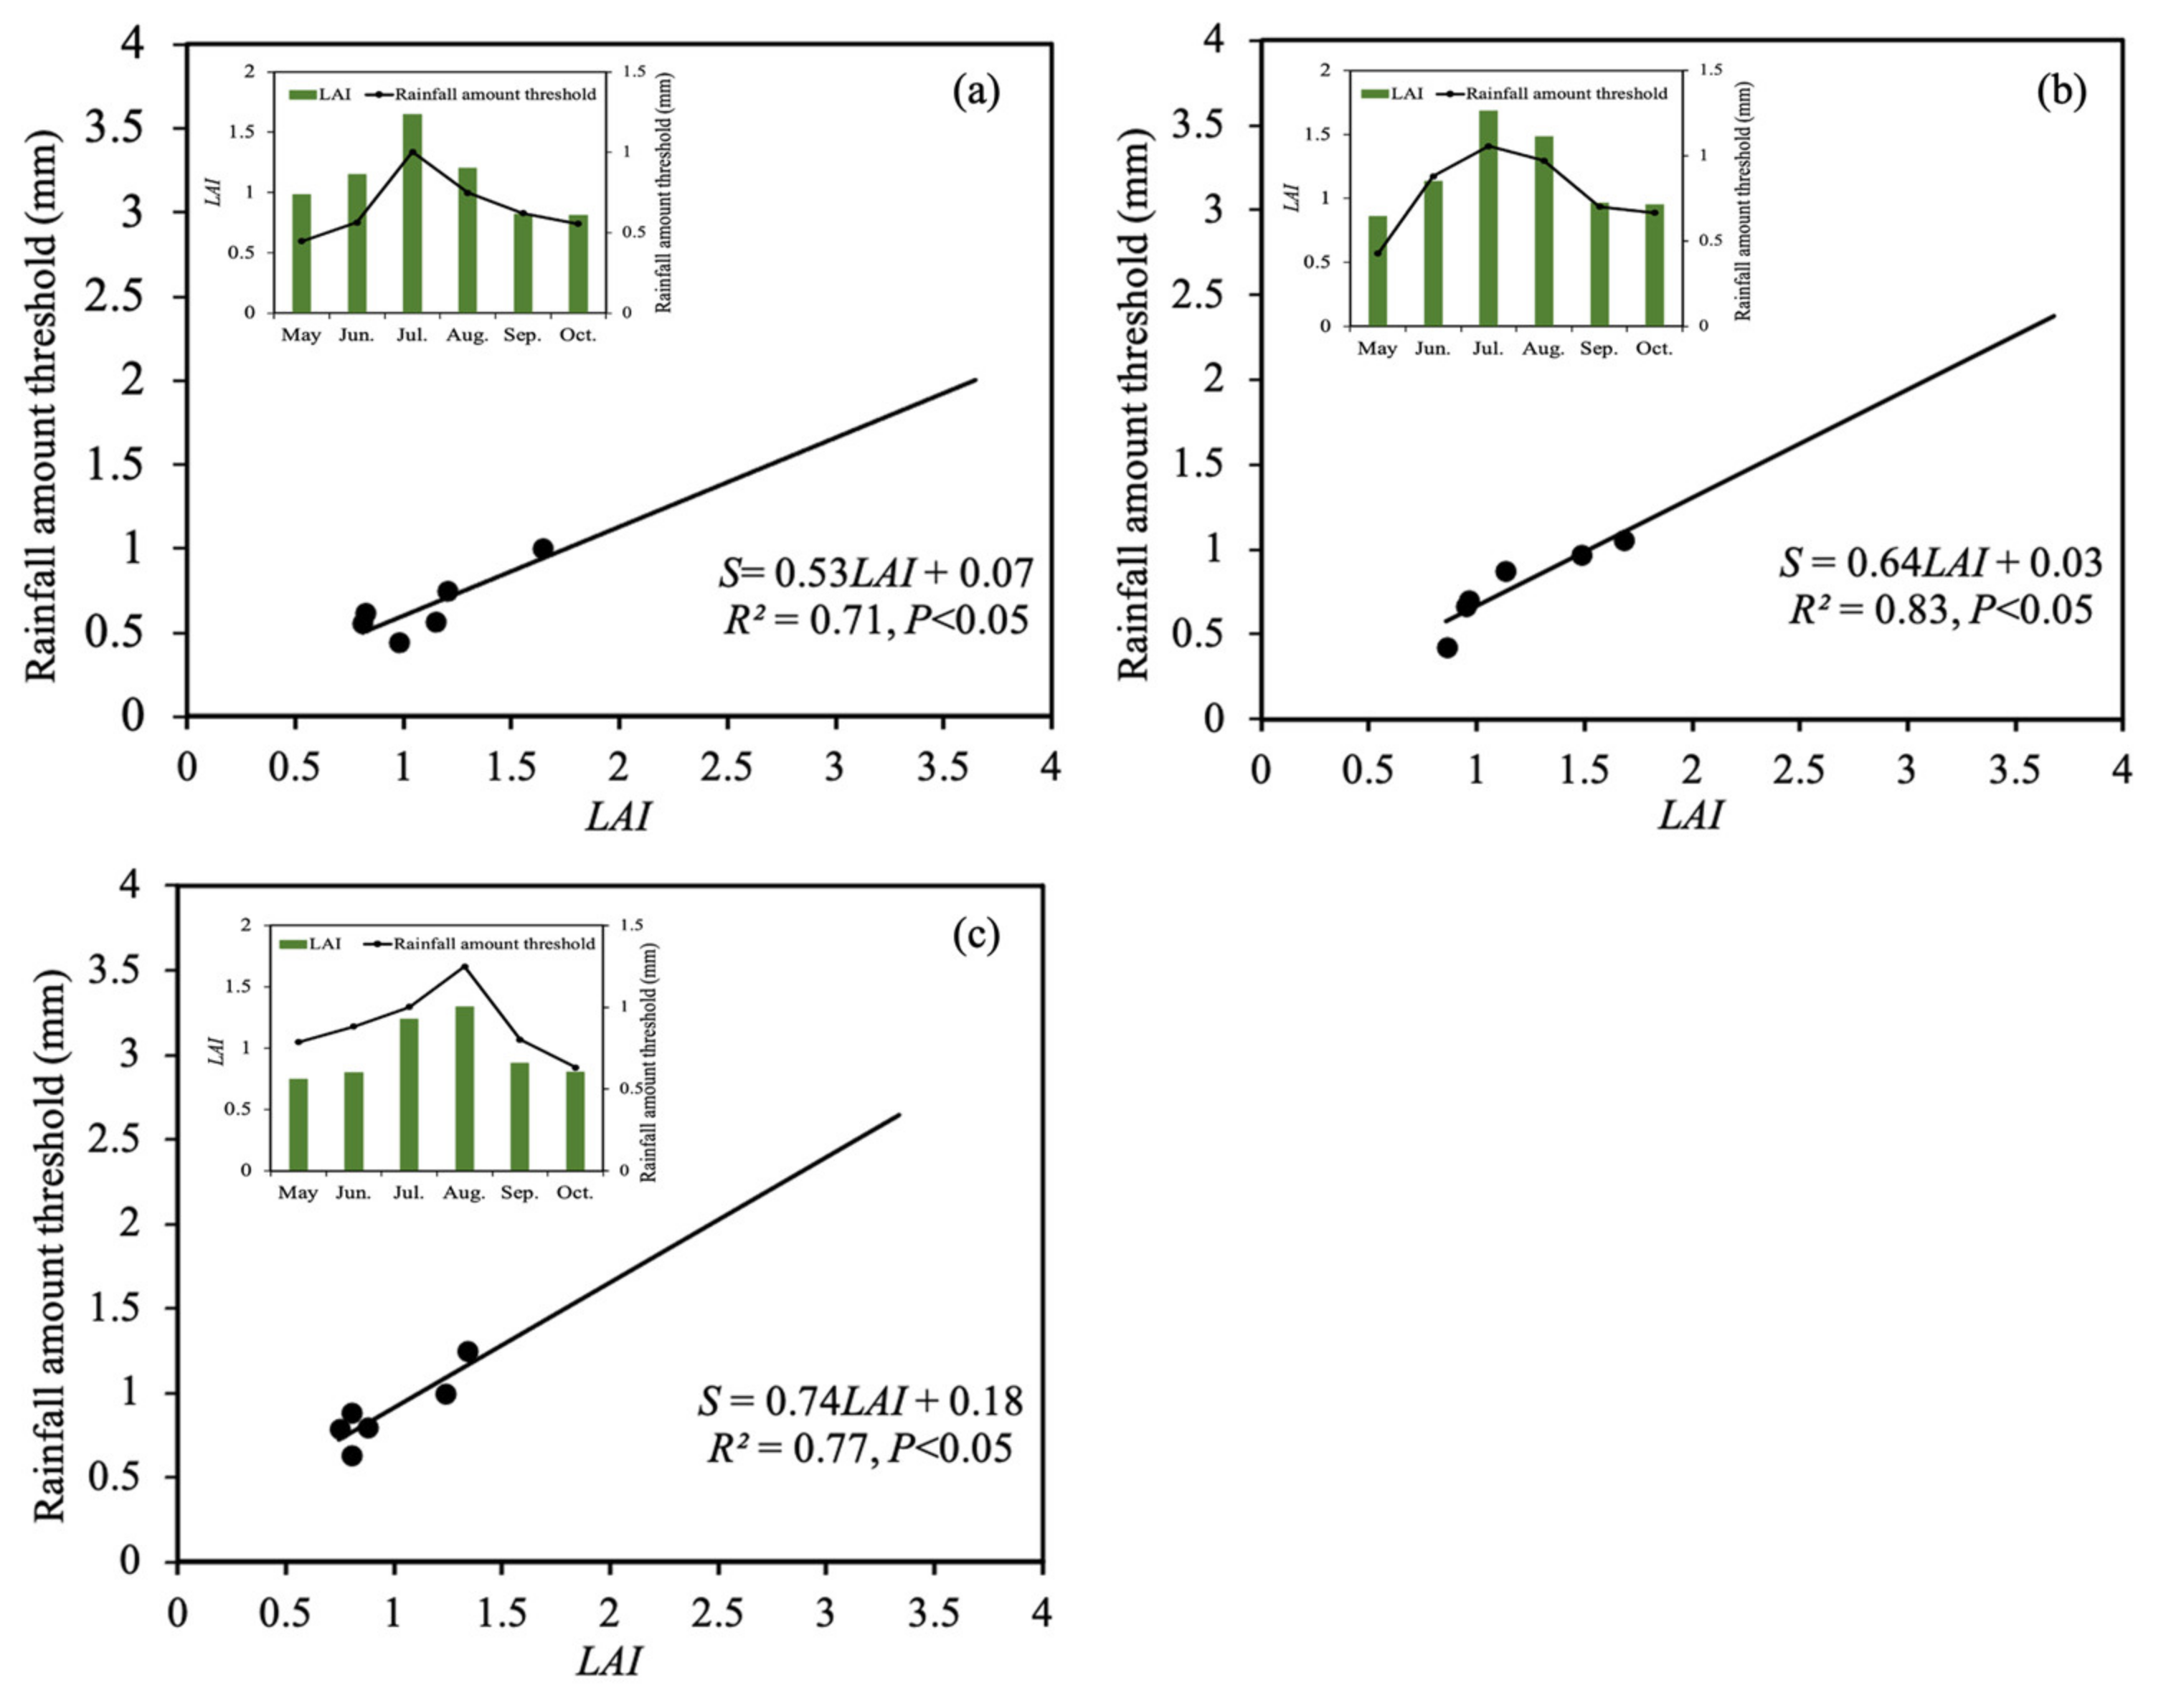
3.4. Relationships between Rainfall Amount Threshold and LAI

Despite the fact that LAI is not the dominant affecting factor of the throughfall compared to rainfall characteristics according to the results of correlation analyses, we found that the rainfall amount threshold estimated from the established linear models with rainfall amount as the only variable (Table 3) was significantly correlated to LAI. The Pearson correlations were 0.84 in BF, 0.91 in MF, and 0.88 in CF, respectively. Positively linear relationships between rainfall amount threshold and LAI at a monthly scale in each of the three forest types were shown in Figure 7. Therefore, monthly changes in rainfall amount threshold can be predicted from LAI, an easily obtained parameter that varies over time within a year.

4. Discussion

4.1. Differences in Throughfall among Three Study Forests

Penetration proportions (i.e., the slopes of the linear models relating throughfall amount to rainfall amount) were 80%, 75%, and 83% in CF, MF, and BF, respectively. Similarly, previous studies (Table 4) found that the penetration proportion varies greatly with tree species. According to a review that assessed 68 different plant species at 31 sites around the world [44], the penetration proportion ranges from 32% to 88%. Llorens and Domingo (2007) reported that variation coefficients of penetration proportion were about 8% for Fagus sylvatica and Quercus ilex and 11% for Abies alba. Among the most frequent rain events (with a rainfall amount > 1 mm and rainfall intensity < 1 mm/h), penetration proportion was highest in BF, followed by MF and CF. One reason is that rainfall intensity was higher in BF than in the other two vegetation types, which made it easier for rainfall to pass through the canopy and result in a higher penetration proportion. Another reason is that the LAI of MF and CF were larger than that of BF, reflecting higher interceptions by a canopy that could lead to lower penetration proportions. Unfortunately, we did not obtain more forest structure parameters except LAI to illustrate the effect of forest structure on throughfall characteristics.
Rainfall amount thresholds for initializing throughfall in CF, MF, and BF were 0.70 mm, 0.92 mm, and 0.80 mm, respectively, which were within the range of threshold values reported by previous studies [25,45,46]. The highest rainfall amount threshold found in MF indicates the largest water requirement to saturate the canopy, which can be attributed to the most closed and complex structure of vegetation in MF (represented by the highest LAI). The amount of water required to saturate the canopy was the least in CF, which can be attributed to the simplest structure of the canopy in CF. Leaf area was found to be the best predictor of water storage on forest canopies [47]. In addition, the highest evaporation observed in MF [37] may also explain partly the largest amount of water required to saturate the canopy and thus the highest rainfall amount threshold.
Across all the three vegetation types, penetration proportions in heavy rain events were larger than those in light rain events. This agrees with the findings of previous studies conducted for various vegetations in different areas around the world. Zhang et al., (2015) revealed that penetration proportion in shrubs increased with the increase in rainfall intensity within limits. Carlyle-Moses (2004) reported that upon high-intensity rainfall with larger raindrop volume, terminal velocity, and kinetic energy, a greater proportion of rainfall could be ‘splashed’ from the canopy, which therefore led to a higher amount of throughfall. It was also discovered that the most significant interception of rainfall by canopy could occur during light rain events [29,46], indicating that light rainfall may lead to a low penetration proportion.

4.2. Factors Affecting Throughfall

Positive correlations of throughfall amount and penetration proportion with rainfall duration, average intensity, and peak intensity, among which the correlations with rainfall amount were the strongest. This finding is in accordance with the observations in other regions by previous studies [4,20,45,48]. Nevertheless, the correlation between throughfall amount and LAI observed in this study was less prominent. Apparently, it is rainfall characteristics, rather than stand characteristics (e.g., LAI), that determine the amount of throughfall. Particularly, rainfall amount is the primary factor affecting throughfall occurrence [29,49,50].

4.3. Improving the Estimation and Monitoring of Throughfall

Considering that throughfall amount is significantly correlated not only with rainfall characteristics but also with LAI (except LAI in MF), multiple linear models are supposed to perform better in estimating throughfall [29,51]. Nevertheless, the models developed in this study with rainfall parameters and LAI as variables (Table 3) cannot achieve substantially better performance in estimating throughfall amount, as compared to the simple models with rain amount as the only variable. During the study period, rainfall events with higher rainfall amount generally had a higher intensity (r = 0.61, p < 0.01, n = 183) and longer duration (r = 0.76, p < 0.01, n = 183). Since close correlations often exist among rainfall duration, average intensity, and rainfall amount [20], it is reasonable that throughfall amount can be satisfactorily estimated with rainfall amount as the only predictor. It should be noted that, for light rain events, the use of multivariable linear models is recommended if the major rainfall parameters and LAI are all available so that a slightly more reliable estimation of throughfall amount can be achieved.
The rainfall amount threshold, which is affected by the water storage capacity of the canopy and evaporation from the canopy [52], exhibited significant positive correlations with LAI and determined the occurrence of throughfall in this study. To date, there is no consensus on the relationship between throughfall and canopy characteristics [31,44,53]. Water storage capacity of plant cover, an influencing factor of interception loss, is often related to canopy characteristics, especially the variables related to leaf surface area such as LAI [53,54]. In many interceptions predicting models, the water storage capacity of the canopy was a key parameter [18,22,52,55,56]. Therefore, LAI is a useful parameter that can be used to estimate not only the rainfall amount threshold for throughfall prediction but also canopy water storage capacity for interception prediction.
The estimated penetration proportion based on vegetation types varied between 75% and 83% across CF, MF, and BF, which was higher than the measured values (57–71%) and apparently overestimated. Slight overestimation of the throughfall amount also happened in this study (Figure 6). These can be attributed largely to technical problems with monitoring. Despite the weekly cleaning operations of throughfall trough collectors, blockage occurred sometimes and thus led to unintended inclusion of light rain events in throughfall monitoring; however, these light rain events may be excluded in data processing of rainfall amount. Throughfall may be overestimated using the models developed from such monitoring data, which were sometimes inaccurate. Improvement of the quality of throughfall data is essential to the development of better models. Therefore, optimization of monitoring methods, such as increasing the number of observation sites and throughfall collectors (increasing the collection surface) and relocating the collectors randomly [6,57,58], is highly desirable in future studies.

5. Conclusions

The rain events observed in this study were dominated by low-intensity rainfall events with an amount of 1–5 mm and intensity of less than 1 mm/h. For individual rain events, throughfall was affected by rainfall characteristics and LAI. Rainfall amount was the primary determinant for throughfall amount. Based on the whole set of monitoring data, multivariable linear models and single-variable linear models were established to estimate throughfall amount and showed similar performances. Nevertheless, for the data of low-intensity rain events, in addition to the rainfall amount used in the single-variable models, the inclusion of more influencing factors as variables in the models can improve the accuracy of estimation. Although the correlations of LAI with throughfall amount were less prominent than those of rainfall parameters, LAI exhibited significant positive linear correlations with the estimated rainfall amount threshold for initialization of throughfall at a monthly temporal scale. Penetration proportion was highest in BF (83%) and lowest in MF (75%). Rain events with higher intensity could show a higher average penetration proportion, as compared with the low-intensity rain events. The rainfall threshold was lowest in CF (0.70 mm) and highest in MF (0.92 mm). The use of the single-variable linear models developed in this study, despite the satisfactory performances achieved, may lead to an overestimation of the throughfall amount.

Author Contributions

Conceptualization, R.Y., J.C. and L.G.; methodology, R.Y., J.C. and L.G.; software, R.Y.; validation, R.Y., J.C.; formal analysis, R.Y.; investigation, R.Y., F.W.; resources, G.W., X.T. and J.C.; data curation, R.Y.; writing—original draft preparation, R.Y.; writing—review and editing, L.G., J.C.; visualization, R.Y.; supervision, X.T.; project administration, G.W. and X.T.; funding acquisition, G.W. and X.T. All authors have read and agreed to the published version of the manuscript.

Funding

This research was funded by the Strategic Priority Research Program of the Chinese Academy of Sciences (grant number XDA23090201), the National Natural Science Foundation of China (grant number 41790431), the Second Tibetan Plateau Scientific Expedition and Research Program (grant number 2019QZKK0903) and the Key Research Program of Frontier Sciences, Chinese Academy of Sciences (grant number QYZDJ-SSW-DQC006).

Institutional Review Board Statement

Not applicable.

Informed Consent Statement

Not applicable.

Data Availability Statement

Not applicable.

Acknowledgments

We are grateful to the editors and reviewers for their constructive comments and suggestions.

Conflicts of Interest

The authors declare no conflict of interest.

References

  1. Fujieda, M.; Kudoh, T.; de Cicco, V.; de Calvarcho, J. L Hydrological processes at two subtropical forest catchments the Serra do Mar Sao Paulo Brazil. J. Hydrol. 1997, 196, 26–46. [Google Scholar] [CrossRef]
  2. Crockford, R.H.; Richardson, D.P. Partitioning of rainfall into throughfall stemflow and interception effect of forest type ground cover and climate. Hydrol. Processes 2000, 14, 2903–2920. [Google Scholar] [CrossRef]
  3. Levia, D.F.; Frost, E.E. A review and evaluation of stemflow literature in the hydrologic and biogeochemical cycles of forested and agricultural ecosystems. J. Hydrol. 2003, 274, 1–29. [Google Scholar] [CrossRef]
  4. Swaffer, B.A.; Holland, K.L.; Doody, T.M.; Hutson, J. Rainfall partitioning, tree form and measurement scale: A comparison of two co-occurring, morphologically distinct tree species in a semi-arid environment. Ecohydrology 2014, 7, 1331–1344. [Google Scholar] [CrossRef]
  5. Dunkerley, D. Measuring interception loss and canopy storage in dryland vegetation: A brief review and evaluation of available research strategies. Hydrol. Process. 2000, 14, 669–678. [Google Scholar] [CrossRef]
  6. Llorensr, P.; Domingo, F. Rainfall partitioning by vegetation under Mediterranean conditions. A review of studies in Europe. J. Hydrol. 2007, 335, 37–54. [Google Scholar] [CrossRef]
  7. Tobón, C.; Sevink, J.; Verstraten, J.M. Solute fluxes in throughfall and stemflow in four forest ecosystems in northwest Amazonia. Biogeochemistry 2004, 70, 1–25. [Google Scholar] [CrossRef]
  8. Zhang, Y.-F.; Wang, X.-P.; Hu, R.; Pan, Y.-X.; Zhang, H. Stemflow in two xerophytic shrubs and its significance to soil water and nutrient enrichment. Ecol. Res. 2013, 28, 567–579. [Google Scholar] [CrossRef]
  9. Liang, W.-L.; Kosugi, K.I.; Mizuyama, T. Soil water dynamics around a tree on a hillslope with or without rainwater supplied by stemflow. Water Resour. Res. 2011, 47, 1–16. [Google Scholar] [CrossRef]
  10. Wang, X.-P.; Wang, Z.-N.; Berndtsson, R.; Zhang, Y.-F.; Pan, Y.-X. Desert shrub stemflow and its significance in soil moisture replenishment. Hydrol. Earth Syst. Sci. 2011, 15, 561–567. [Google Scholar] [CrossRef] [Green Version]
  11. Buttle, J.M.; Toye, H.J.; Greenwood, W.J.; Bialkowski, R. Stemflow and soil water recharge during rainfall in a red pine chronosequence on the Oak Ridges Moraine, southern Ontario, Canada. J. Hydrol. 2014, 517, 777–790. [Google Scholar] [CrossRef]
  12. Pérez-Suárez, M.; Arredondo-Moreno, J.T.; Huber-Sannwald, E.; Serna-Pérez, A. Forest structure, species traits and rain characteristics influences on horizontal and vertical rainfall partitioning in a semiarid pine-oak forest from Central Mexico. Ecohydrology 2014, 7, 532–543. [Google Scholar] [CrossRef]
  13. Serrato, F.B.; Diaz, A.R. A simple technique for measuring rainfall interception by small shrub- “interception flow collection box”. Hydrol. Processes 1998, 12, 471–481. [Google Scholar] [CrossRef]
  14. Ford, E.D.; Deans, J.D. The Effects of Canopy Structure on Stemflow, Throughfall and Interception Loss in a Young Sitka Spruce Plantation. J. Appl. Ecol. 1978, 15, 905. [Google Scholar] [CrossRef]
  15. Aston, A. Rainfall interception by eight small trees. J. Hydrol. 1979, 42, 383–396. [Google Scholar] [CrossRef]
  16. Yuan, C.; Gao, G.; Fu, B. Stemflow of a xerophytic shrub (Salix psammophila) in northern China: Implication for beneficial branch architecture to produce stemflow. J. Hydrol. 2016, 539, 577–588. [Google Scholar] [CrossRef]
  17. Klaassen, W.; Bosveld, F.; de Water, E. Water storage and evaporation as constituents of rainfall interception. J. Hydrol. 1998, 212, 36–50. [Google Scholar] [CrossRef] [Green Version]
  18. Muzylo, A.; Llorens, P.; Valente, F.; Keizer, J.; Domingo, F.; Gash, J. A review of rainfall interception modelling. J. Hydrol. 2009, 370, 191–206. [Google Scholar] [CrossRef] [Green Version]
  19. Garcia-Estringana, P.; Alonso-Blázquez, N.; Alegre, J. Water storage capacity, stemflow and water funneling in Mediterranean shrubs. J. Hydrol. 2010, 389, 363–372. [Google Scholar] [CrossRef]
  20. Zhang, Y.; Wang, X.-P.; Hu, R.; Pan, Y.-X.; Paradeloc, M. Rainfall partitioning into throughfall, stemflow and interception loss by two xerophytic shrubs within a rain-fed re-vegetated desert ecosystem, northwestern China. J. Hydrol. 2015, 527, 1084–1095. [Google Scholar] [CrossRef]
  21. Návar, J.; Francisco, C.; Enrique, J. Spatial variations of interception loss components by Tamaulipan thornscrub in northeastern Mexico. For. Ecol. Manag. 1999, 124, 231–239. [Google Scholar] [CrossRef]
  22. van Dijk, A.; Bruijnzeel, L. Modelling rainfall interception by vegetation of variable density using an adapted analytical model. Part 2. Model validation for a tropical upland mixed cropping system. J. Hydrol. 2001, 247, 239–262. [Google Scholar] [CrossRef]
  23. Ghimire, C.P.; Bruijnzeel, L.A.; Lubczynski, M.W.; Bonell, M. Rainfall interception by natural and planted forests in the Middle Mountains of Central Nepal. J. Hydrol. 2012, 475, 270–280. [Google Scholar] [CrossRef]
  24. Ma, C.; Li, X.; Luo, Y.; Shao, M.; Jia, X. The modelling of rainfall interception in growing and dormant seasons for a pine plantation and a black locust plantation in semi-arid Northwest China. J. Hydrol. 2019, 577, 123849. [Google Scholar] [CrossRef]
  25. Herwitz, S.R. Interception storage capasities of tropical rainforest canopy trees. J. Hydrol. 1985, 77, 237–252. [Google Scholar] [CrossRef]
  26. Bellot, J.; Escarre, A. Stemflow and throughfall determination in a resprouted Mediterranean holm-oak forest. Ann. Sci. For. 1998, 55, 847–865. [Google Scholar] [CrossRef] [Green Version]
  27. Granier, A.; Biron, P.; Lemoine, D. Water balance, transpiration and canopy conductance in two beech stands. Agric. For. Meteorol. 2000, 100, 291–308. [Google Scholar] [CrossRef]
  28. Owens, M.K.; Lyons, R.K.; Alejandro, C.L. Rainfall partitioning within semiarid juniper communities: Effects of event size and canopy cover. Hydrol. Process. 2006, 20, 3179–3189. [Google Scholar] [CrossRef]
  29. Staelens, J.; De Schrijver, A.; Verheyen, K.; Verhoest, N. Rainfall partitioning into throughfall, stemflow, and interception within a single beech (Fagus sylvatica L.) canopy: Influence of foliation, rain event characteristics, and meteorology. Hydrol. Process. 2008, 22, 33–45. [Google Scholar] [CrossRef]
  30. Mużyło, A.; Llorens, P.; Domingo, F. Rainfall partitioning in a deciduous forest plot in leafed and leafless periods. Ecohydrology 2012, 5, 759–767. [Google Scholar] [CrossRef]
  31. Shou, W.; Musa, A.; Liu, Z.; Qian, J.; Niu, C.; Guo, Y. Rainfall partitioning characteristics of three typical sand-fixing shrubs in Horqin Sand Land, north-eastern China. Water Policy 2017, 48, 571–583. [Google Scholar] [CrossRef]
  32. Levia, D.F.; Frost, E.E. Variability of throughfall volume and solute inputs in wooded ecosystems. Prog. Phys. Geogr. Earth Environ. 2006, 30, 605–632. [Google Scholar] [CrossRef]
  33. Llorens, P.; Poch, R.; Latron, J.; Gallart, F. Rainfall interception by a Pinus sylvestris forest patch overgrown in a Megiterranean mountainous abandoned area I. Monitoring design and results down to the event scale. J. Hydrol. 1997, 199, 331–345. [Google Scholar] [CrossRef]
  34. Whelan, M.; Anderson, J. Modelling spatial patterns of throughfall and interception loss in a Norway spruce (Picea abies) plantation at the plot scale. J. Hydrol. 1996, 186, 335–354. [Google Scholar] [CrossRef]
  35. Guo, L.; Fan, B.; Zhang, J.; Lin, H. Occurrence of subsurface lateral flow in the Shale Hills Catchment indicated by a soil water mass balance method. Eur. J. Soil Sci. 2018, 69, 771–786. [Google Scholar] [CrossRef]
  36. Link, T.E.; Unsworth, M.; Marks, D. The dynamics of rainfall interception by a seasonal temperate rainforest. Agric. For. Meteorol. 2004, 124, 171–191. [Google Scholar] [CrossRef] [Green Version]
  37. Hu, Z.; Wang, G.; Sun, X.; Zhu, M.; Song, C.; Huang, K.; Chen, X. Spatial-Temporal Patterns of Evapotranspiration Along an Elevation Gradient on Mount Gongga, Southwest China. Water Resour. Res. 2018, 54, 4180–4192. [Google Scholar] [CrossRef]
  38. Hu, Z.; Wang, G.; Sun, X. Precipitation and air temperature control the variations of dissolved organic matter along an altitudinal forest gradient, Gongga Mountains, China. Environ. Sci. Pollut. Res. 2017, 24, 230–10400. [Google Scholar] [CrossRef]
  39. Sun, X.Y.; Wang, G.X.; Li, W.; Liu, G.S.; Lin, Y. Measurements and modeling of canapy inteception in the Gongga Mountain subalpine succession forest. Adv. Water Sci. 2011, 22, 23–29. (In Chinese) [Google Scholar]
  40. Wu, Y.-H.; Li, W.; Zhou, J.; Cao, Y. Temperature and precipitation variations at two meteorological stations on eastern slope of Gongga Mountain, SW China in the past two decades. J. Mt. Sci. 2013, 10, 370–377. [Google Scholar] [CrossRef]
  41. Lin, Y. The effect of vegetation spatial heterogeneity in alpine forest ecosysterm on evaporation process. In Institute of Mountain Hazards and Environment; Chinese Academy of Sciences: Beijing, China, 2010. [Google Scholar]
  42. Yang, P.; Chen, Z.; Zhou, Q.; Zha, Y.; Wu, W.; Shibasaki, R. Comparisons of MODIS LAI products and LAI estimates derived from Landsat TM. In Proceedings of the IEEE International Geoscience and Remote Sensing Symposium (IGARSS), Denver, CO, USA, 31 July 2006. [Google Scholar]
  43. Jin, Z.; Guo, L.; Lin, H.; Wang, Y.; Yu, Y.; Chu, G.; Zhang, J. Soil moisture response to rainfall on the Chinese Loess Plateau after a long-term vegetation rehabilitation. Hydrol. Process. 2018, 32, 1738–1754. [Google Scholar] [CrossRef]
  44. Magliano, P.N.; Whitworth-Hulse, J.I.; Baldi, G. Interception, throughfall and stemflow partition in drylands: Global synthesis and meta-analysis. J. Hydrol. 2019, 568, 638–645. [Google Scholar] [CrossRef]
  45. Marin, C.T.; Bouten, W.; Sevink, J. Gross rainfall and its partitioning into throughfall, stemflow and evaporation of intercepted water in four forest ecosystems in western Amazonia. J. Hydrol. 2000, 237, 40–57. [Google Scholar] [CrossRef]
  46. Price, A.; Carlyle-Moses, D. Measurement and modelling of growing-season canopy water fluxes in a mature mixed deciduous forest stand, southern Ontario, Canada. Agric. For. Meteorol. 2003, 119, 69–85. [Google Scholar] [CrossRef]
  47. Keim, R.; Skaugset, A.; Weiler, M. Storage of water on vegetation under simulated rainfall of varying intensity. Adv. Water Resour. 2006, 29, 974–986. [Google Scholar] [CrossRef]
  48. Yu, F. The Research on Characteristics of Throughfall in Subtropical Secondary Forests and the Relationship with Soil Moisture; Central South University of Forestry and Technology: Changsha, China, 2017. [Google Scholar]
  49. Návar, J. Stemflow variation in Mexico’s northeastern forest communities: Its contribution to soil moisture content and aquifer recharge. J. Hydrol. 2011, 408, 35–42. [Google Scholar] [CrossRef]
  50. Fan, J.; Oestergaard, K.T.; Guyot, A.; Jensen, D.G.; Lockington, D.A. Spatial variability of throughfall and stemflow in an exotic pine plantation of subtropical coastal Australia. Hydrol. Process. 2015, 29, 793–804. [Google Scholar] [CrossRef]
  51. Keim, R.F.; Skaugset, A.E. A linear system model of dynamic throughfall rates beneath forest canopies. Water Resour. Res. 2004, 40, 1–12. [Google Scholar] [CrossRef] [Green Version]
  52. Gash, J.H.C. An analytical model of rainfall interception by forests. Q. J. R. Meteorol. Soc. 1979, 105, 43–55. [Google Scholar] [CrossRef]
  53. Park, A.; Cameron, J.L. The influence of canopy traits on throughfall and stemflow in five tropical trees growing in a Panamanian plantation. For. Ecol. Manag. 2008, 255, 1915–1925. [Google Scholar] [CrossRef]
  54. Wang, X.-P.; Zhang, Y.-F.; Hu, R.; Pan, Y.-X.; Berndtsson, R. Canopy storage capacity of xerophytic shrubs in Northwestern China. J. Hydrol. 2012, 454, 152–159. [Google Scholar] [CrossRef]
  55. Rutter, A.J.; Kershaw, K.A.; Robins, P.C.; Morton, A.J. A predictive model of rainfall interception in forests, 1. Derivation of the model from observation in a plantation of Corsican pine. Agric. Meteorol. 1971, 9, 367–384. [Google Scholar] [CrossRef]
  56. Kume, T.; Manfroi, O.J.; Kuraji, K.; Tanaka, N.; Horiuchi, T.; Suzuki, M.; Kumagai, T. Estimation of canopy water storage capacity from sap flow measurements in a Bornean tropical rainforest. J. Hydrol. 2008, 352, 288–295. [Google Scholar] [CrossRef]
  57. Lloyd, C.R.; Gash, J.H.C.; Shuttleworth, W.J. The measurement and modelling of rainfall interception by Amazonian rain forest. Agric. For. Meteorol. 1988, 43, 277–294. [Google Scholar] [CrossRef]
  58. Rodrigo, A.; Àvila, A. Influence of sampling size in the estimation of mean throughfall in two Mediterranean holm oak forests. J. Hydrol. 2001, 243, 216–227. [Google Scholar] [CrossRef]
Figure 1. (a) The location of study site (from ULR http://bzdt.ch.mnr.gov.cn/, accessed on 15 April 2022). (b) An overview of the Hailuogou catchment showing the elevation gradient and the locations of the monitoring sites of broadleaved forests (BF), broadleaved-coniferous mixed forests (MF), and coniferous forests (CF). (c) The collector is composed of a V-shaped inclined metal trench connected to a tipping bucket rain gauge. (df) shows the stands in the three vegetation zones.
Atmosphere 13 00639 g001
Figure 2. The rainfall amount (PG), average intensity (In), peak intensity (Inpeak), throughfall amount (Tf), and time lag of each event in CF (a), MF (b), and BF (c).
Atmosphere 13 00639 g002
Figure 3. Distribution pattern of rain events in duration groups and intensity groups in CF (a), MF (b), and BF (c).
Atmosphere 13 00639 g003
Figure 4. Throughfall amount as a function of individual rainfall amount (a), duration (b), average intensity (c), and peak intensity (d). Box plots in (e) depict the mean, median, 25th, and 75th percentile values of throughfall amount in CF, MF, and BF. The whiskers show the maximum and minimum values of throughfall amount.
Atmosphere 13 00639 g004
Figure 5. Throughfall penetration proportion as a function of individual rainfall amount (a), duration (b), average intensity (c), and peak intensity (d). Box plots in (e) depict the mean, median, 25th, and 75th percentile values of throughfall amount in CF, MF, and BF. The whiskers show the maximum and minimum values of throughfall amount.
Atmosphere 13 00639 g005
Figure 6. Comparison of the estimated and observed throughfall amount in CF (a), MF (b), and BF (c). Throughfall amount was estimated using the established linear models with rainfall amount as the only variable. Red dots were the critical values for division of overestimation. The dashed lines were the 1:1 line of the estimated and observed throughfall amount.
Atmosphere 13 00639 g006
Figure 7. Estimation of rainfall amount threshold (S) by leaf area index (LAI) at monthly scale in CF (a), MF (b) BF (c).
Atmosphere 13 00639 g007
Table 1. Detailed statistical information of measured rainfall parameters and penetration proportion for each rainfall subgroup.
Vegetation TypesGroupMean Rainfall (mm)Mean Duration (h)Mean Peak Intensity (mm/h)Mean of Average Intensity (mm/h)Mean Throughfall (mm)Mean Penetration Proportion (%)No. of EventsEvent Proportion (%)Rainfall Proportion (%)
CFGroup ILow-intensity2.296.960.880.471.1739235611
High-intensity19.6513.336.342.1615.147461524
Group IILow-intensity16.9044.002.390.5610.746341014
High-intensity32.8230.836.991.6127.728561540
Group IIILow-intensity30.1770.505.280.7820.24682512
MFGroup ILow-intensity4.187.481.180.652.7050315120
High-intensity9.057.933.111.485.2748152521
Group IILow-intensity18.0738.712.100.7313.647071119
High-intensity32.8936.864.641.4724.487571135
Group IIILow-intensity28.7070.005.400.8013.4947124
BFGroup ILow-intensity3.356.471.010.602.0953475823
High-intensity9.958.683.571.557.2662192328
Group IILow-intensity14.1631.001.940.7410.69747915
High-intensity29.1330.136.141.9023.248081034
CF is coniferous forest; MF is coniferous-broadleaved mixed forest; BF is broadleaved forest with respect to the light rain events (i.e., low-intensity rainfall subgroup) in Group I, the most frequent occurrence in this study, the mean rainfall amount and mean rainfall intensity were the smallest in CF while these two rainfall parameters in MF and BF were of similar levels.
Table 2. Pearson correlations among throughfall, rainfall parameters, and LAI.
Rainfall (mm)Duration
(h)
Peak Intensity (mm/h)Average Intensity (mm/h)LAITime Lag (h)
CFThroughfall amount (mm)0.9788 **0.5826 **0.8003 **0.7463 **0.3287 **−0.1169
Penetration proportion (%)0.6106 **0.4497 **0.5417 **0.5231 **0.2198−0.0003
MFThroughfall amount (mm)0.9651 **0.7928 **0.6203 **0.3963 **0.2141−0.0239
Penetration proportion (%)0.3179 **0.2939 **0.10040.0714−0.0658−0.1927
BFThroughfall amount (mm)0.9883 **0.7508 **0.7764 **0.6652 **0.3817 **−0.0892
Penetration proportion (%)0.5602 **0.5288 *0.4513 **0.3759 **0.0467−0.1016
CF is coniferous forest; MF is coniferous-broadleaved mixed forest; BF is broadleaved forest. * represents a significance level of p < 0.05; ** represents a significance level of p < 0.01.
Table 3. Multi-variable linear models relating throughfall amount to rainfall parameters and LAI in comparison with single-variable linear models relating throughfall to rainfall amount for all rain events or light rain events in Group I in CF, MF, and BF.
Vegetation TypesAll Rain EventsLow Intensity Rain Events in Group I
ModelR2pModelR2p
Coniferous forestTfCon. = 0.88PG − 0.04Dur − 0.46Inpeak + 0.53In + 1.97LAI − 2.420.97<0.01TfCon. = 0.80PG − 0.68Inpeak + 0.59In + 0.61LAI − 1.050.93<0.01
TfCon. = 0.80PG − 0.700.96<0.01TfCon. = 0.66PG − 0.350.91<0.01
Coniferous-broadleaved mixed forestTfMix. = 0.90PG − 0.03Dur − 1.24Inpeak + 0.83In + 1.02LAI − 1.230.95<0.01TfMix. = 1.51PG − 0.34Dur − 0.96Inpeak − 1.02In + 0.24LAI − 0.330.90<0.01
TfMix. = 0.75PG − 0.920.93<0.01TfMix. = 0.87PG − 1.080.83<0.01
Broadleaved forestTfBro. = 0.81PG − 0.02Dur + 0.46Inpeak − 0.79In + 1.26LAI − 0.500.98<0.01TfBro. = 1.20PG − 0.18Dur + 0.23Inpeak − 3.57In + 0.19LAI − 1.00.95<0.01
TfBro. = 0.83PG − 0.800.98<0.01TfBro. = 0.82PG − 0.640.90<0.01
Table 4. Rainfall amount (PG), throughfall amount (Tf), and rainfall threshold (S) in different tree species.
ReferenceLocationStand SpeciesPG (mm)Tf (%)S (mm)Data Use
Bellot and Escarre (1998)NE SpainQuercus ilex, Arbutus unedo and Phyllirea media1296.26751.5839 events
Granier et al., (2000)FranceYoung beech stand92726-57 events
Carlyle-Moses (2004)NE of MexicoWhite oak, Ash, and Cedar394.883.370.23925 events
Owens et al., (2006)USAAshe juniper117660.8-158 events
Muzylo and Domingo (2011)NE SpainDowny oaks558.2880.665 events
Swaffer et al., (2014)AustraliaE. diversifolia and A. verticillata50266.4–65.9--
Zhang et al., (2015)Tengger DesertC. korshinskii and A. ordosica461.574.31 and 74.830.52 and 1.22102 events
Shou et al., (2017)NW of ChinaCaragana
microphylla, Hedysarum fruticosum, and Salix gordejevii
246.264.2-25 events
Publisher’s Note: MDPI stays neutral with regard to jurisdictional claims in published maps and institutional affiliations.

