Article

Quantifying Sustainable Land-Water-Energy-Food Nexus: The Case of Sustainable Livelihoods in an East African Rift Valley

1
College of Land Management, Nanjing Agricultural University, Nanjing 210095, China
2
College of Agriculture and Natural Resources, Dilla University, Dilla 419, Ethiopia
3
National and Local Joint Engineering Research Center for Rural Land Resources Use and Consolidation, Nanjing 210095, China
4
Faculty of Agriculture, Food and Consumer Sciences, University for Development Studies, Tamale 1882, Ghana
*
Author to whom correspondence should be addressed.
Atmosphere 2022, 13(4), 638; https://doi.org/10.3390/atmos13040638
Submission received: 26 February 2022 / Revised: 2 April 2022 / Accepted: 4 April 2022 / Published: 18 April 2022
(This article belongs to the Section Biosphere/Hydrosphere/Land–Atmosphere Interactions)

Abstract

:
The sustainable management of Land-Water-Energy-Food (LWEF) nexus requires an environmental characterization that allows the comparison of complex interlinkages between nexus resources and livelihoods. This complexity makes this characterization difficult coupled with limited study in quantifying sustainability of LWEF nexus and its linkage with livelihood. Therefore, the present study aimed to investigate the link between sustainable LWEF nexus and livelihoods. In order to address the objective the proposed methodology starts with a detailed identification of LWEF and livelihood indicators which depicts well-defined, shared, and holistic methods to evaluate sustainability. With this we used analytical hierarchy process and pair wise comparison matrix in combination with weighting model. The result of composite LWEF nexus index was 0.083 representing, low sustainability. Besides, this composite index implies the use and management of LWEF nexus resources in the study area is very low, as the composite index approach to 1, the use and management of nexus resources are in a good condition which characterized by sustainability. This could be linked with nexus resources consumption, use, and management. From the analysis of the weight of land, water, energy and food nexus resources, the highest weight was observed for food. The focus of on food production only shows no clear synergy on provisioning, supporting or regulating nexus resources to address livelihoods. The result further showed that LWEF nexus resources have strong correlation with livelihoods. This was evidenced by social (r > 0.8, p < 0.01), natural (r > 0.3, p < 0.05) and physical (r > 0.6, p < 0.01) livelihood indicators showed strong positive correlation with LWEF nexus resources. Based on the finding of the study, it was observed that managing nexus resources not only provide a significant contribution to achieve sustainable LWEF nexus, but also be effective for enhancing livelihood through food security. This could be attained by strong evidence based policy to ensure sustainable use of nexus resources. The results provided by this study would serve as the foundation for future study, policy formulation and implementation.

1. Introduction

Land, water, energy, and food (LWEF) are natural resources vital for sustaining life on earth [1,2] and also crucial for the wellbeing of people and economic activities [3]. Globally, more than one billion people suffer from water, energy and food insecurity, and also correspondingly, from amplifying land degradation [3,4]. This could be due to population growth, urbanization, rising economy, change in consumption patterns, and climate change, which pose pressure on those four resources [5,6]. Thus, the issue of LWEF security is a big obstacle for global sustainable development [3,4] which is expected to be achieved by 2030.
Nexus thinking emerged from an understanding that natural resources are beginning to limit, to a substantial degree, economic growth and human wellbeing goals, by creating pressure on interlinked resources [7,8]. This pressure on resources could finally result in shortages of land, water, energy, and food [9]. This could be serious for people living at a lower economic level, hamper economic development, lead to social and geopolitical tensions which cause natural resources degradation [10,11].
Effective natural resource management via the nexus approach is required for the sustainable use of LWEF nexus resource [12]. These resources are vital natural resources needed to solve critical global issues of hunger, improving health and building a sustainable and desirable economy. Due to interlinkage between them, the exploitation of one often sets the prerequisite of the abundances of another; therefore, a possible systemic approach to minimize trade-offs and maximize synergies was needed [3,7]. The importance of systemic approaches in the management and governance of natural resources and food systems has been recognized, due to increasing demands for services and growing desires for higher living standards.
The progress towards water, energy, and food (WEF) nexus have motivated many discussions on how to manage these interlinked resources [13] and broadened to include other resources or disciplines, such as soil, land use, climate, waste, ecosystems, health, and others, forming an even more multi-dimensional and multidisciplinary concept [14]. Despite the progress in recent years, there remain many challenges in scientific research in adding land as part of the WEF nexus system on a small geographical scale [15]. The scientific challenges are primarily related to data, information, and knowledge gaps on these four nexus resources interlinkage [2,16].
Additionally, the nexus resources are further complicated by the fact that these resources are subject to exogenous parameters that are highly dynamic over time and in space [17,18]. These include population growth, migration, regional economics and socioeconomic development [6]. When modeling the nexus for a specific geographic location such as a country, national level inputs might further increase the complexity of understanding the interlinkages [19].
These concerns the need for a possible assessment system based on the concept of a sustainable natural resource indicator [20]. A sustainability indicator can be defined as a measurable aspect of environmental, economic, or social systems that is useful for monitoring changes in system characteristics relevant to the continuation of human and environmental well-being [21,22]. Sustainability indicators tend to be the most suitable for providing valuable initial assessment, which are required for decision-making from grassroots level [20,23].
The relationship between nexus resource and livelihoods is said to be a symbiotic relationship in the form of a vicious cycle, due to ability to affect one another [24]. So far, ample empirical studies were conducted on the link between individual nexus resources and livelihoods. However, studies linking LWEF nexus and livelihood were barely conducted in the study area. In this paper, we present four basic sections that need to be addressed. These are: (1) LWEF nexus and livelihood indicators, (2) sustainability of LWEF nexus resources in the area, (3) linkage between LWEF nexus and livelihood, (4) food-focused approach and its impacts on LWEF nexus sustainability. Therefore, this study specifically seeks to (i) identify LWEF nexus and livelihoods indicators; (ii) analyze sustainability of LWEF nexus and its contribution for livelihoods improvement; (iii) assess the livelihoods strategies and its sensitivity with sustainable LWEF nexus. The findings from this study will add to the literature on the subject area and provide foundation for future studies, policy formulation and implementation in the study area and beyond.

2. Methods

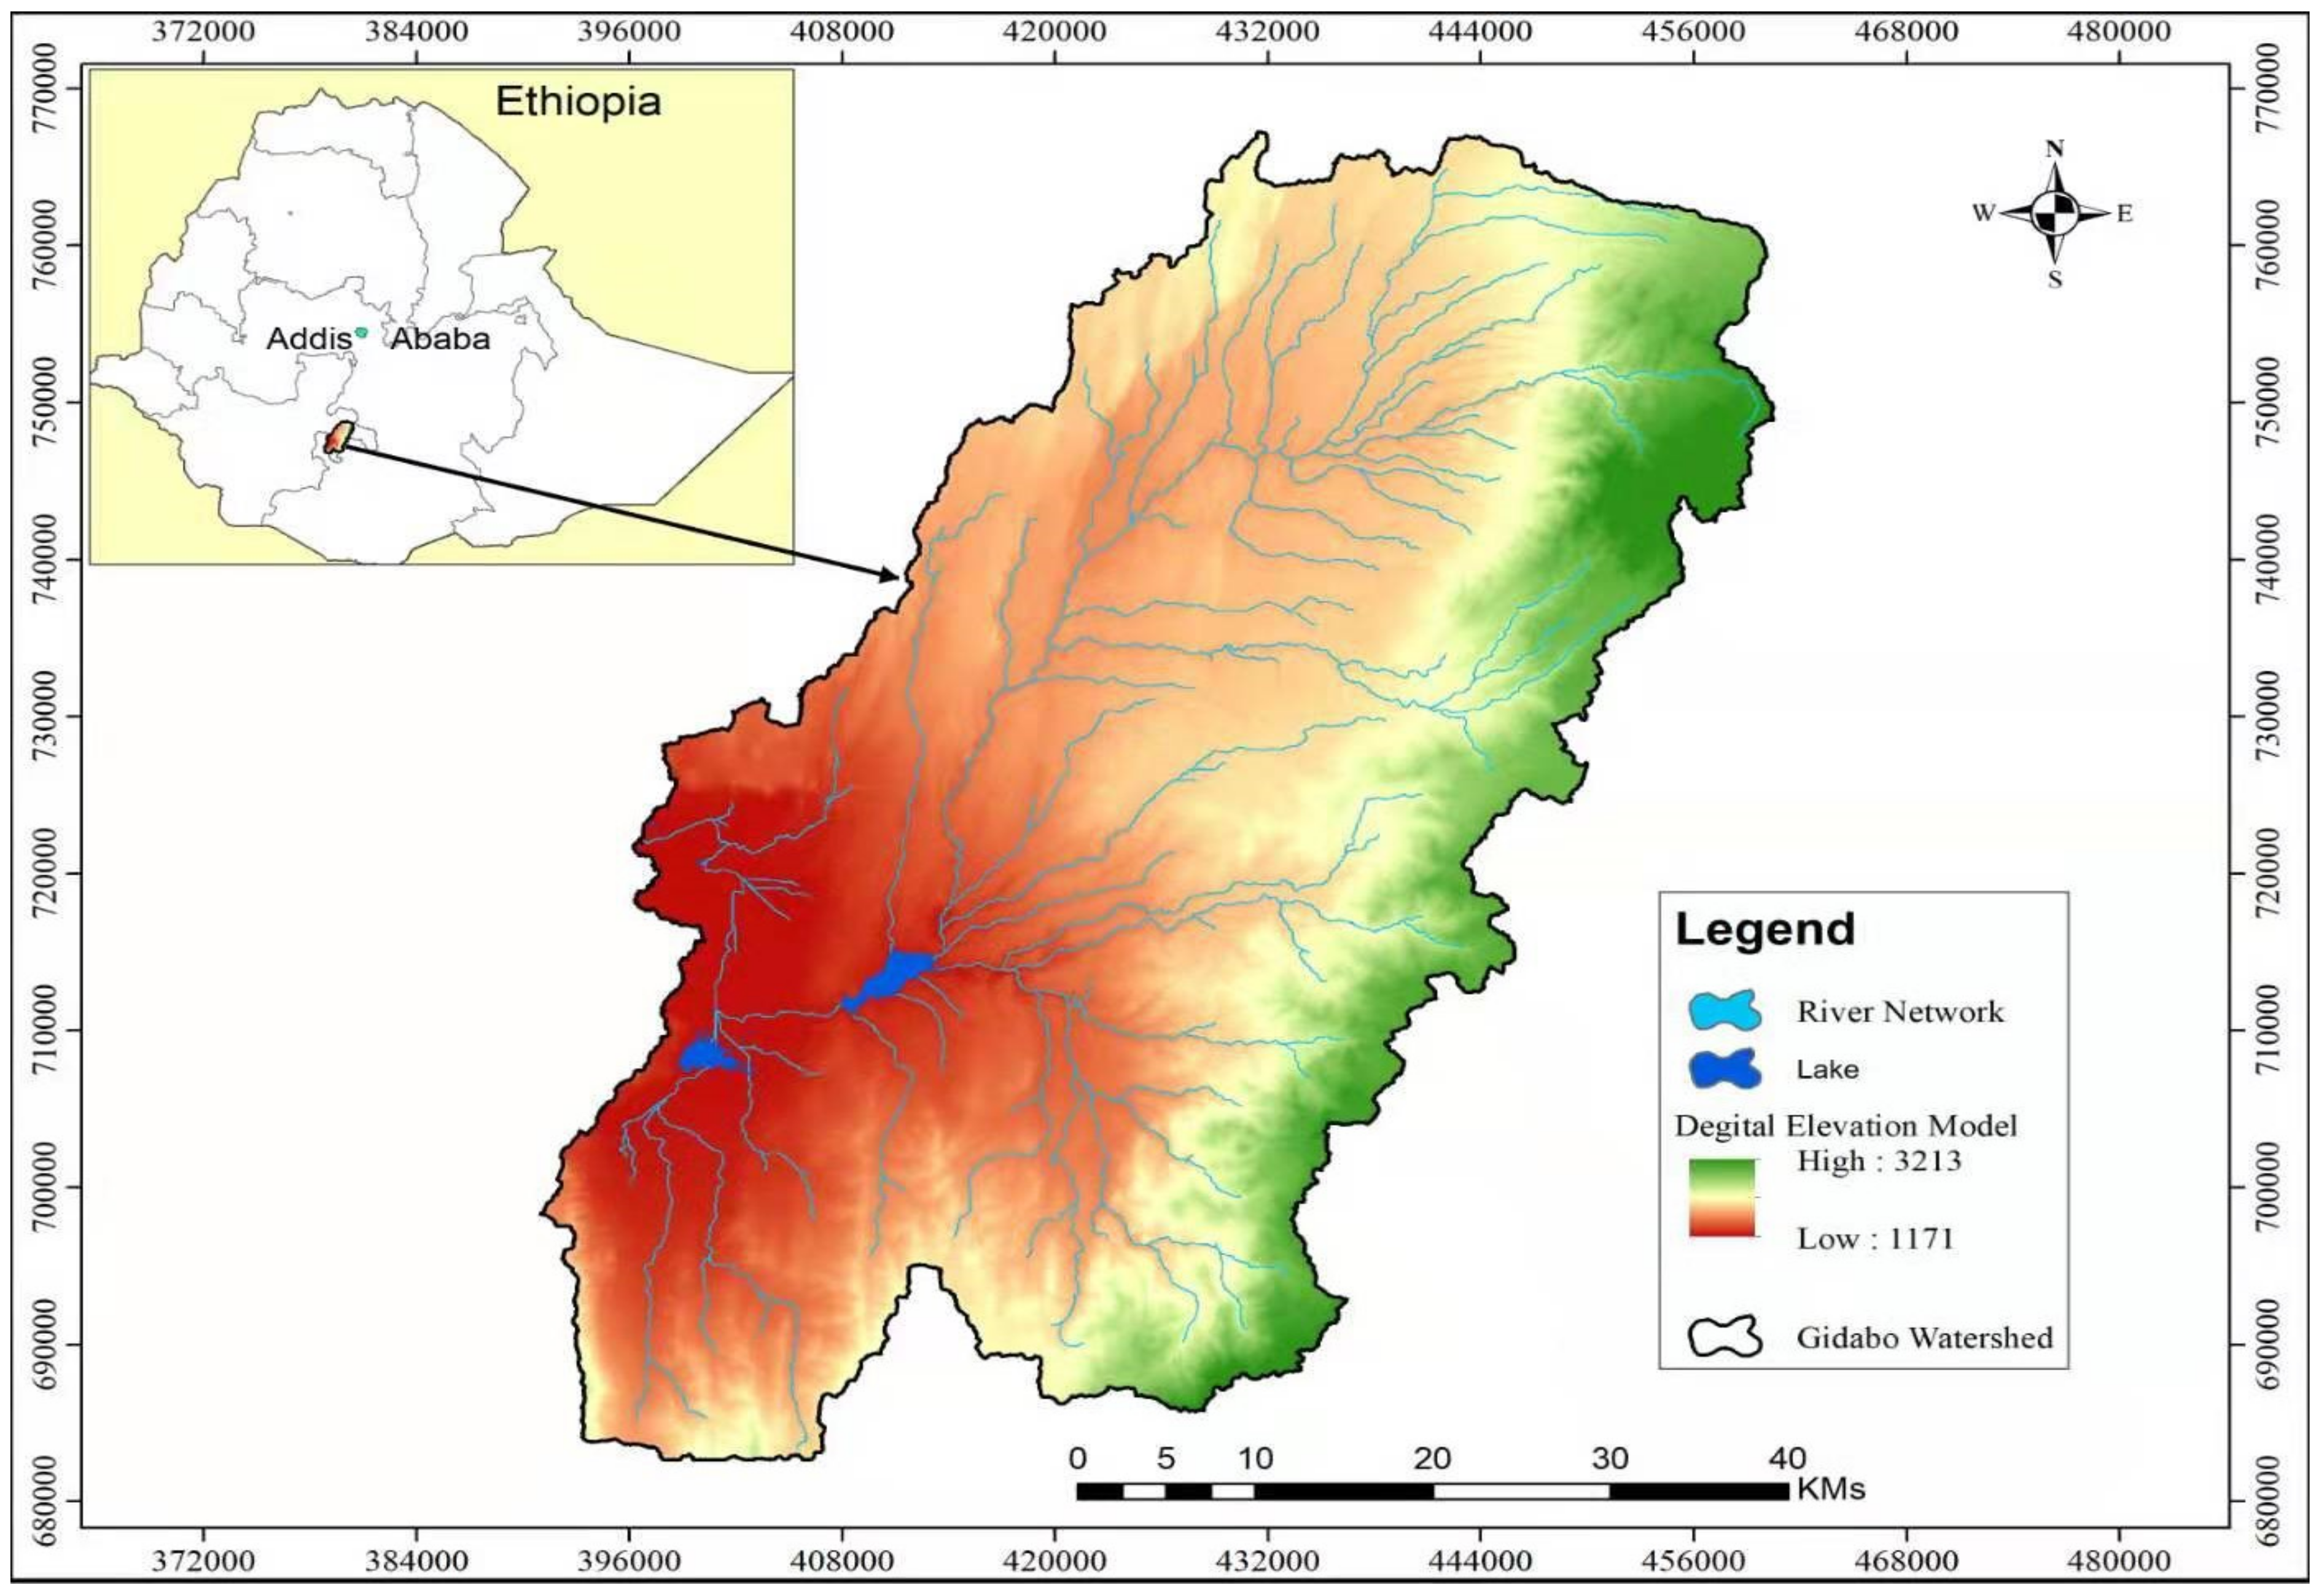
2.1. Description of Research Sites

The study was conducted in the Rift Valley Basin in Ethiopia. The Rift Valley Basin, which passes the southern part of the Main Ethiopian Rift, covers an area of about 0.04% of the country and extends to the south from the upper catchments of the Awash Basin to the Kenyan border, to the extreme south of Chew Bahir. This basin lies in the Oromia and Southern Nation, Nationality and People Regional States. As outlined in the Integrated Development Master Plan Study (2010), the basin is characterized by under development, widespread poverty, and severe land degradation.
The Gidabo Watershed is part of Rift Valley Basin, and the so-called Ethiopian Rift runs through Ethiopia in the southwest direction from the Afar Triple Junction [25]. This area is characterized by wide topography and climatic variation ranging from humid in the highland to semi-arid [26]. It is situated between 6°9′4″ to 6°56′4″ N latitude and 37°55′ to 38°35″ E longitude, covering an area that is approximately 3549 km2 (Figure 1). The maximum and minimum altitudes are about 3213 m.a.s.l and 1171 m.a.s.l, respectively.
The unique characteristics of the watershed are associated mainly with the results of faulting and volcanism associated with rifting process [27]. As a result, the typical rift morphology is well developed clearly showing the upper and lower parts that drain to the common outlet (Figure 1).
The population in the watershed has nearly doubled over the last two decades from 593,157 to over 1.5 M [27]. Increased population in the basin and the socio-economic developments has put pressure on land that consequently led to a decline in water and food potential in the watershed [25].
Land, water, energy and food nexus resources are all crucial contributors to food security. As a result of growing resource scarcity, the inter-connectedness of these sectors has become more apparent, as evidenced by growing tradeoffs. Proactive analysis of the current consumption, use and management of LWEF nexus resources are required to holistically assess and promote the best management option that co-balance benefits across LWEF nexus resources as highlighted by WoldeYohannes, et al. [28].

2.2. Methodology

AHP is a widely used pairwise comparison method for determining the relative priorities of the alternatives with respect to easy understandable criteria or indicator linked with the scaling system method. The scaling method scores the alternatives by using numbers obtained from LWEF nexus resources indicators, while the pairwise comparison method determines the relative priorities of the alternatives via the pairwise comparison. The scaling method is simple and easy to be operated; however, it cannot assure the overall consistency among all the relative priorities of the alternatives with respect to each of the indicator which is corrected by standardization of indicators. In order to attain this identification of criteria and the sampling techniques to standardize, the criteria are discussed below. Since there are no specific rules on expert participation in AHP, twenty-five experts were chosen to build the criteria and to calculate their weight, while other techniques were used to evaluate alternatives. Additionally, nine steps were used to organize overall steps for the methodology used in this study (Figure 2).

2.2.1. Establishment of LWEF Nexus Indicator and Sub-Indicators

Indicators are becoming increasingly important for communicating information to policy makers and stakeholders, and assessing the environmental performance and progress in general [16]. Nowadays, it is believed that composite indicators have been used for quality of life and environment through providing information on the status of the economic, social and environmental components to reduce the number of measurements necessary to give descriptions of an indicator [29,30].
It is known that clear indicators are the basis of any effective monitoring, evaluation system and resulting data system [29]. Since this study is based on local cases, one of the challenges in performing this study is obtaining sufficient data and information relevant to our study. In order to track the way in which LWEF nexus and livelihood are linked and its progress towards reaching certain goals, a researcher needs to measure this change using the literature and key informants having enough knowledge in the area to select and develop indicators.
In order to develop indicators in Table 1, the following four stepwise procedures were used to define the indicator variable: (1) collecting ideas, to perform all ideas from key informants compiled without judging them; then, we organized the ideas into groups to categorize as relating to specific individual objectives and analytical questions. (2) Structure and refine ideas; in these steps, the ideas were further structured and consolidated to sort out the relevant ones by referring the work of other researchers/organizations or using previously developed sets of indicators. Additionally, these steps helped remove unnecessary indicators and merge those having similarities. (3) Formulating indicators to make sure that selected indicators are both meaningful and measurable. We consider specific measurable attainable realistic and timely (SMART) techniques to formulate the indicators that showed what results were likely to be reached within what target group, and in what time frame. (4) Selection of indicators, the assembled indicators through steps 1–3 which were many; however, this step focuses on indicator quality which is more important than their number. Therefore, priorities were given to have a small but meaningful set of indicators.
Following the above methods, criteria were prioritized to set indicators for LWEF nexus resources (Table 1). Table 1 indicates the most important LWEF nexus indicators identified from the literature. After designing those indicators, the study used the approach of the Analytic Hierarchy Process.
(AHP); moreover, the pairwise comparison matrix (PCM) provides weight for individual indicators, normalizes the indicators, and establishes composite indicator index.
The AHP is a structured technique, which is helpful in solving indicators selection problems involving multi-criteria and multi-alternatives [44]. Furthermore, the hierarchical structure used in formulating the AHP model can enable all evaluation team members to visualize the problems systematically in terms of relevant criteria [44,45]. In a sense, the AHP method may be useful for selecting indicators because of the characteristics of the indicator selection process.
The PCM is a technique which has been widely used to tackle the subjective and objective judgments about qualitative or quantitative criteria in multi-criteria decision making, especially in the Analytical Hierarchical Process [45]. The preference relations in the PCMs are filled in by the decision maker’s judgments, and presented using different measurement scales such as ratio scale. The importance of criteria and the ranking of alternatives are often judged through the priority weights derived from a PCM; thus, many prioritization approaches have been proposed to derive the priority weights from PCM.
The AHP supports the creation of weights based on expert judgments structured in a pairwise comparison matrix by applying Saaty’s scale of intensities importance [45]. The tool for data collection for AHP was presented in Microsoft excels sheets, and respondents were asked to rank the 12 comparison matrices. Then, through further calculation, weightings for criteria and indicators within each criterion were computed (Table 2). Mabhaudhi, et al. [46], explained that the full description of how the AHP and PCM normalization works.
AHP was chosen because it is one of the best-known methods of multi-criteria decision making which provides a convenient and versatile framework for modeling multi criteria decision problems, evaluating alternatives, and deriving final priorities.
The computation of each weight, indices, consistence ratio (CR) and consistence index (CI) were computed as follows; before calculating CR, CI was computed using the formula
C I = ω n n 1 ,
where n represents the number of indicators, in our case 12, and ω represents the eigenvalue obtained from the weight value of the indicator using stata 14, in our case ω = 1.176. Therefore,
C I = ω n n 1 , 1.176 12 12 1 = 1.176 1.09 = 0.086
According to Meixner, et al. [47], Random Index (RI) is calculated for criteria from n = 1–15, given their RI value; hence, we have 12 criteria (indicators). Therefore, it corresponds to RI = 1.54.
C R = C I R I = 0.086 1.54 = 0.0556 , e q u a l t o   0.056
Compared with the study conducted by Mabhaudhi et al. [46], land was considered as an additional nexus resource which can be explained by the fact that land suitability, capability and productivity were considered as identified indicators. The identified indicators were normalized by applying the indicator weight normalization, and used to compute the LWEF index by adding the weighted normalized indicators.

2.2.2. Sustainable Livelihoods Indicators

It is crucial to consider nexus resource security for various livelihood indicators through computing indices to evaluate their role in Sustainable Livelihoods (SL).The Sustainable livelihood Framework (SLF) has been considered and it has been found that the good indicators provide a complete picture of all the relevant aspects of sustainable livelihoods in a transparent and easily understandable way [48].
Sustainability is an important qualifier to the Department for International Development (DFID) view of livelihoods because it implies that progress in poverty reduction is lasting, rather than fleeting [49]. For details on the sustainable livelihoods approach, the five main livelihoods components are adopted and explained from DFID livelihood component [50].
Therefore, the current study adopted the DFID SLF to characterize the livelihood indicators [51]. The five basic components of livelihood show the variation in people’s access to assets. A single physical livelihood component can generate multiple benefits. For example, if someone has secured access to land (natural capital), they may also be well-endowed with financial capital, as they are able to use the land not only for direct productive activities but also as collateral for loans. This helps develop different sub-livelihood indicators. Table 3 depicts the basic component of sustainable livelihood indicators for the current study which were categorized under five main and 23 sub-livelihood categories.
The importance of evaluating livelihoods from basic human aspects (i.e., land, water, energy, and food) enhances local community understanding towards the management and use of limited nexus resources and is better linked with their livelihoods [52].
Most researchers have proposed various methods and evaluation of an index system to assess the sustainability of the WEF nexus in global, national and regional basis [54]. Combining the livelihood indicators helps measure the interaction between five main livelihood indicators [52]. The following equation was used to standardize the sub-indicators;
K i = x i x ¯ s
where K i is the sub-indicator, x i corresponds to the i th measurement of the sustainable livelihood indicator variable, x ¯ is the average value of x i and s is the standard deviation. As a result, we write the livelihood component (Lc)
L c = w i K i
where L c is the estimated value of the livelihood indicators ( 0 i 4 ) in relation to the LWEF nexus, w i indicates the weight for the ith observation and K i represents the normalized value of the indicator for the ith observation.
In this paper, the weighting model (WM) concept was used to combine the weight of the LWEF nexus and livelihood indicator indices selected from the literature as explained in Table 1 and Table 2. This model helps determine an index system that could evaluate the LWEF system to associate with sustainable livelihoods using weights of individual indicators which help develop a composite indicator value and the resulting ranking [52]. There are studies conducted on exploring the WEF nexus sustainability [2,46]. However, our study tries to link sustainability of nexus resources and livelihoods which have not been studied so far in small geographical units in Ethiopia, particularly in the Gidabo watershed. This provides some degree of novelty to the current work.

2.2.3. Sample Size Determination and Sampling Technique

The data on LWEF nexus resources and livelihood indicators for the study were sourced from both secondary and primary sources. The primary sources involved the combination of structured interviews with local community and key informants. The survey was conducted within a four-month period from July 2019 to October 2019 following two approaches. First, an expert interview (n = 50) was made and focus group discussions with experienced experts from natural resources, agriculture, water and energy sector were organized to characterize the sub-indicators for LWEF and livelihood listed in Table 1 and Table 2. Particularly, the identification of indicators helps households to easily categorize which livelihood indicators are linked with LWEF nexus resources. Second, a structured questionnaire was administered to 434 farmer household heads (n = 434). The structured questionnaire mainly focused on assessing the importance of the proposed LWEF nexus indicators for sustainable livelihood indicators (SLI) using a Likert scale (0–4, where 0 = Not Important; 1 = Slightly Important, 2 = Moderately Important, 3 = Important, 4 = Very Important).
Based on the weight of indicators, logistic regression was further used to describe the causal relationship between LWEF nexus indicators (i.e., independent variable n) and livelihoods indicators (i.e., dependent variable δ). When using the logistic regression, we need to make an algebraic explanation to arrive at our usual linear regression equation. The logistic regression is given by:
δ = β 0 + i = 0 n β i   N i
where δ is the probability, β o is a constant, and β i   i = 1 ,   2 ,   ,   n are the regression coefficients. In our case, the dependent variable (δ) is not continuous, and converted to the probability ratio (ω) of livelihood indicators and computed as
ln ( ω ) = ln ( δ 1 δ )
where ln = natural logarithm, and ω is called logit (δ). This leads to the following equation
L o g i t δ = β o + i = 1 n β i   N i
where β o   + i = 1 n β i N i is the familiar equation for the regression line. Knowing the regression equation helps calculate the expected probability from given values of N i theoretically. From this, Equation (5) is changed to:
ω = δ 1 δ = exp β o + i = 1 n β i   N i
To rearrange the equation, the opposite of the natural logarithm(exp) is considered, since it needs to estimate the probability of livelihood indicators. This can be explained with the change in the unit value of N i . Finally, the elasticity of probability was determined from the derivatives of Equation (6), as can be seen from Equation (7)
ω = exp β j + β o   + i = 1   n β i   N i = ω exp β j  
where exp( β j ) is the elasticity probability; it changes with unit increases and decreases in nexus resources ( N i ). It shows how main livelihood indicators are sensitive with respect to land, water, and energy and food nexus indicators. In this analysis, sensitivity measures the effect of changes in nexus resources in the livelihood indicators. This means that the probability of LWEF nexus resources increases by exp( β j ) or decreases the livelihoods by one unit change based on the regression coefficient. From the regression coefficient computed, the student t-test was applied to test which nexus resources are comparably influential by using the mathematical equation
N O = β i δ 2 + C n n
where N o denotes the nexus resources with k m l degrees of freedom, with k being the total number of samples and m the number of terms in the model, β i are the regression coefficients, the term C n n is the nth diagonal element of the data matrix, and δ 2 = S S E m k . All statistical analyses were performed in Stata 14 (StataCorp LP, 4905 Lakeway Drive, College Station, TX 77845, USA).

3. Result and Discussion

3.1. Pairwise Comparison Matrix for Land-Water-Energy and Food Nexus Indicators

Human wellbeing, poverty reduction and sustainable development are largely dependent on land, water, energy and food resources. These vital resources are projected to have demand exceeding supply in the nearest future, due to population growth and migration, economic development, international trade, urbanization, diversifying diets, cultural and technological changes, as well as climate variability and change [55]. These necessitate sustainability of basic nexus resources, which can be assessed by performing the LWEF nexus indicator using PCM.
Table 4 presents the result of PCM of the four nexus resources indicators. The comparison of indicators with itself is one. The symmetrical characteristics of the matrix are explained by considering the lower half the triangle, since the remaining cells are the reciprocals of the lower triangle. According to Saaty [44] the relationships are established using a scale ranging from 1 to 9 and their reciprocals. The result shows that the indicators with the highest weights are the food utilization, water affordability, food stability and access to food (Table 2). This indicates how the percentage of food and water nexus component predicts the livelihood dependences compared with others. Table 4 indicates the CR for the LWEF nexus is 0.056, a value lower than 0.10 which shows the weights calculated are consistent enough to construct an index as reported by Mabhaudhi et al. [46].

3.2. Land-Water-Energy-Food (LWEF) Nexus Composite Indices

AHP is a widely used method for indicator performance evaluation [54], presumably because it elucidates preference information from the decision makers in a manner which they find easy to understand [45]. The basic step was undertaken by the pairwise comparison to determine the relationship among WEF nexus components in the study area.
It shows AHP helps formulate and analyze sustainability indicators [55]. Our study utilizes the LWEF nexus indicators outlined in Table 1 and overlay the transparent and clearly defined weighted criteria which are used in the importance index scenario. The idea behind the composite LWEF nexus index is to aggregate indicators about the sustainability aspects and then provides an easy-to-understand scoring system to determine sustainability.
The LWEF nexus Sustainability Composite Index is a measure of overall progress towards environmental sustainability. As the composite index is far from 1, it implies that the sustainability of the nexus resources is becoming questionable. In the current study, the composite index of LWEF nexus is 0.083, which implies the focus on the use, consumption and management of those resources in the study area is around 8.3%. This implies very low concern which triggers unsustainable management of LWEF nexus resources. The index provides a composite profile of national natural resources stewardship based on a compilation of indicators derived from underlying datasets. The LWEF nexus composite index for the study region is 0.083 (Table 4), which implies a low index. This study agrees with studies conducted in other regions [56]. For example, a study conducted by Mabhaudhi et al. [46], on the WEF nexus integrated index for South Africa, showed that it was 0.145 and they categorized it as a low index revealing unsustainable performance of resources utilization and management, which is consistent with our finding. It is known that agriculture-based livelihoods are more likely to dominate the case study area, but the expansion of non-agriculture-based industries demanding for more land, water and energy are managed friendly in an environmentally sustainable way to the extent that natural resource levels are improving rather than deteriorating.
The sustainability index is used to simplify the complex decision making process that will help the stakeholders to find a more sustainable solution [57]. Identifying these indices are crucial since the LWEF nexus index computed from indicators is strongly linked with the livelihoods of the local community?
The regional performance of natural resources index is not yet designed, which could lead to nexus resources trade-off. However, there has been wide ranging support for individual and sectorial-based management of nexus resources. Lack of managing those interlinked resources in a joint way creates a tension in sustaining and supplying sufficient basic resources for human well-being.
The result of a low composite index for LWEF shows lack of management of nexus resources in the integrated approach, while food production is merely considered as core element, as also reported by Mabhaudhi et al. [46]. This is also evidenced by the highest normalized weight of food indicators (Table 2), which shows that land has been overlooked to be part of nexus resources component, while it affects overall performance of nexus resources. For example, Ethiopia has the potential for arable land and water sources [58], however, millions of people still suffer from food and water insecurity, and inadequate supply of modern energy.
Ethiopia depends on hydropower as the main source of energy, in which food production and energy compete for the same water resources. Similarly, agriculture is the source of economy for over 80% of the population; major means of livelihood for over 80% of the population. This indicates strong dependence of livelihoods on land, water and energy for food production with a varied level of consumption. However, agriculture is seriously challenged by human-induced factors, which pose pressure in the transformation of rural livelihoods, which need sustainable natural resource management. Nevertheless, the current unsustainability of LWEF nexus resources shows that the sectorial- based nexus resource management and practices indeed significantly impacts both resources and the livelihoods.

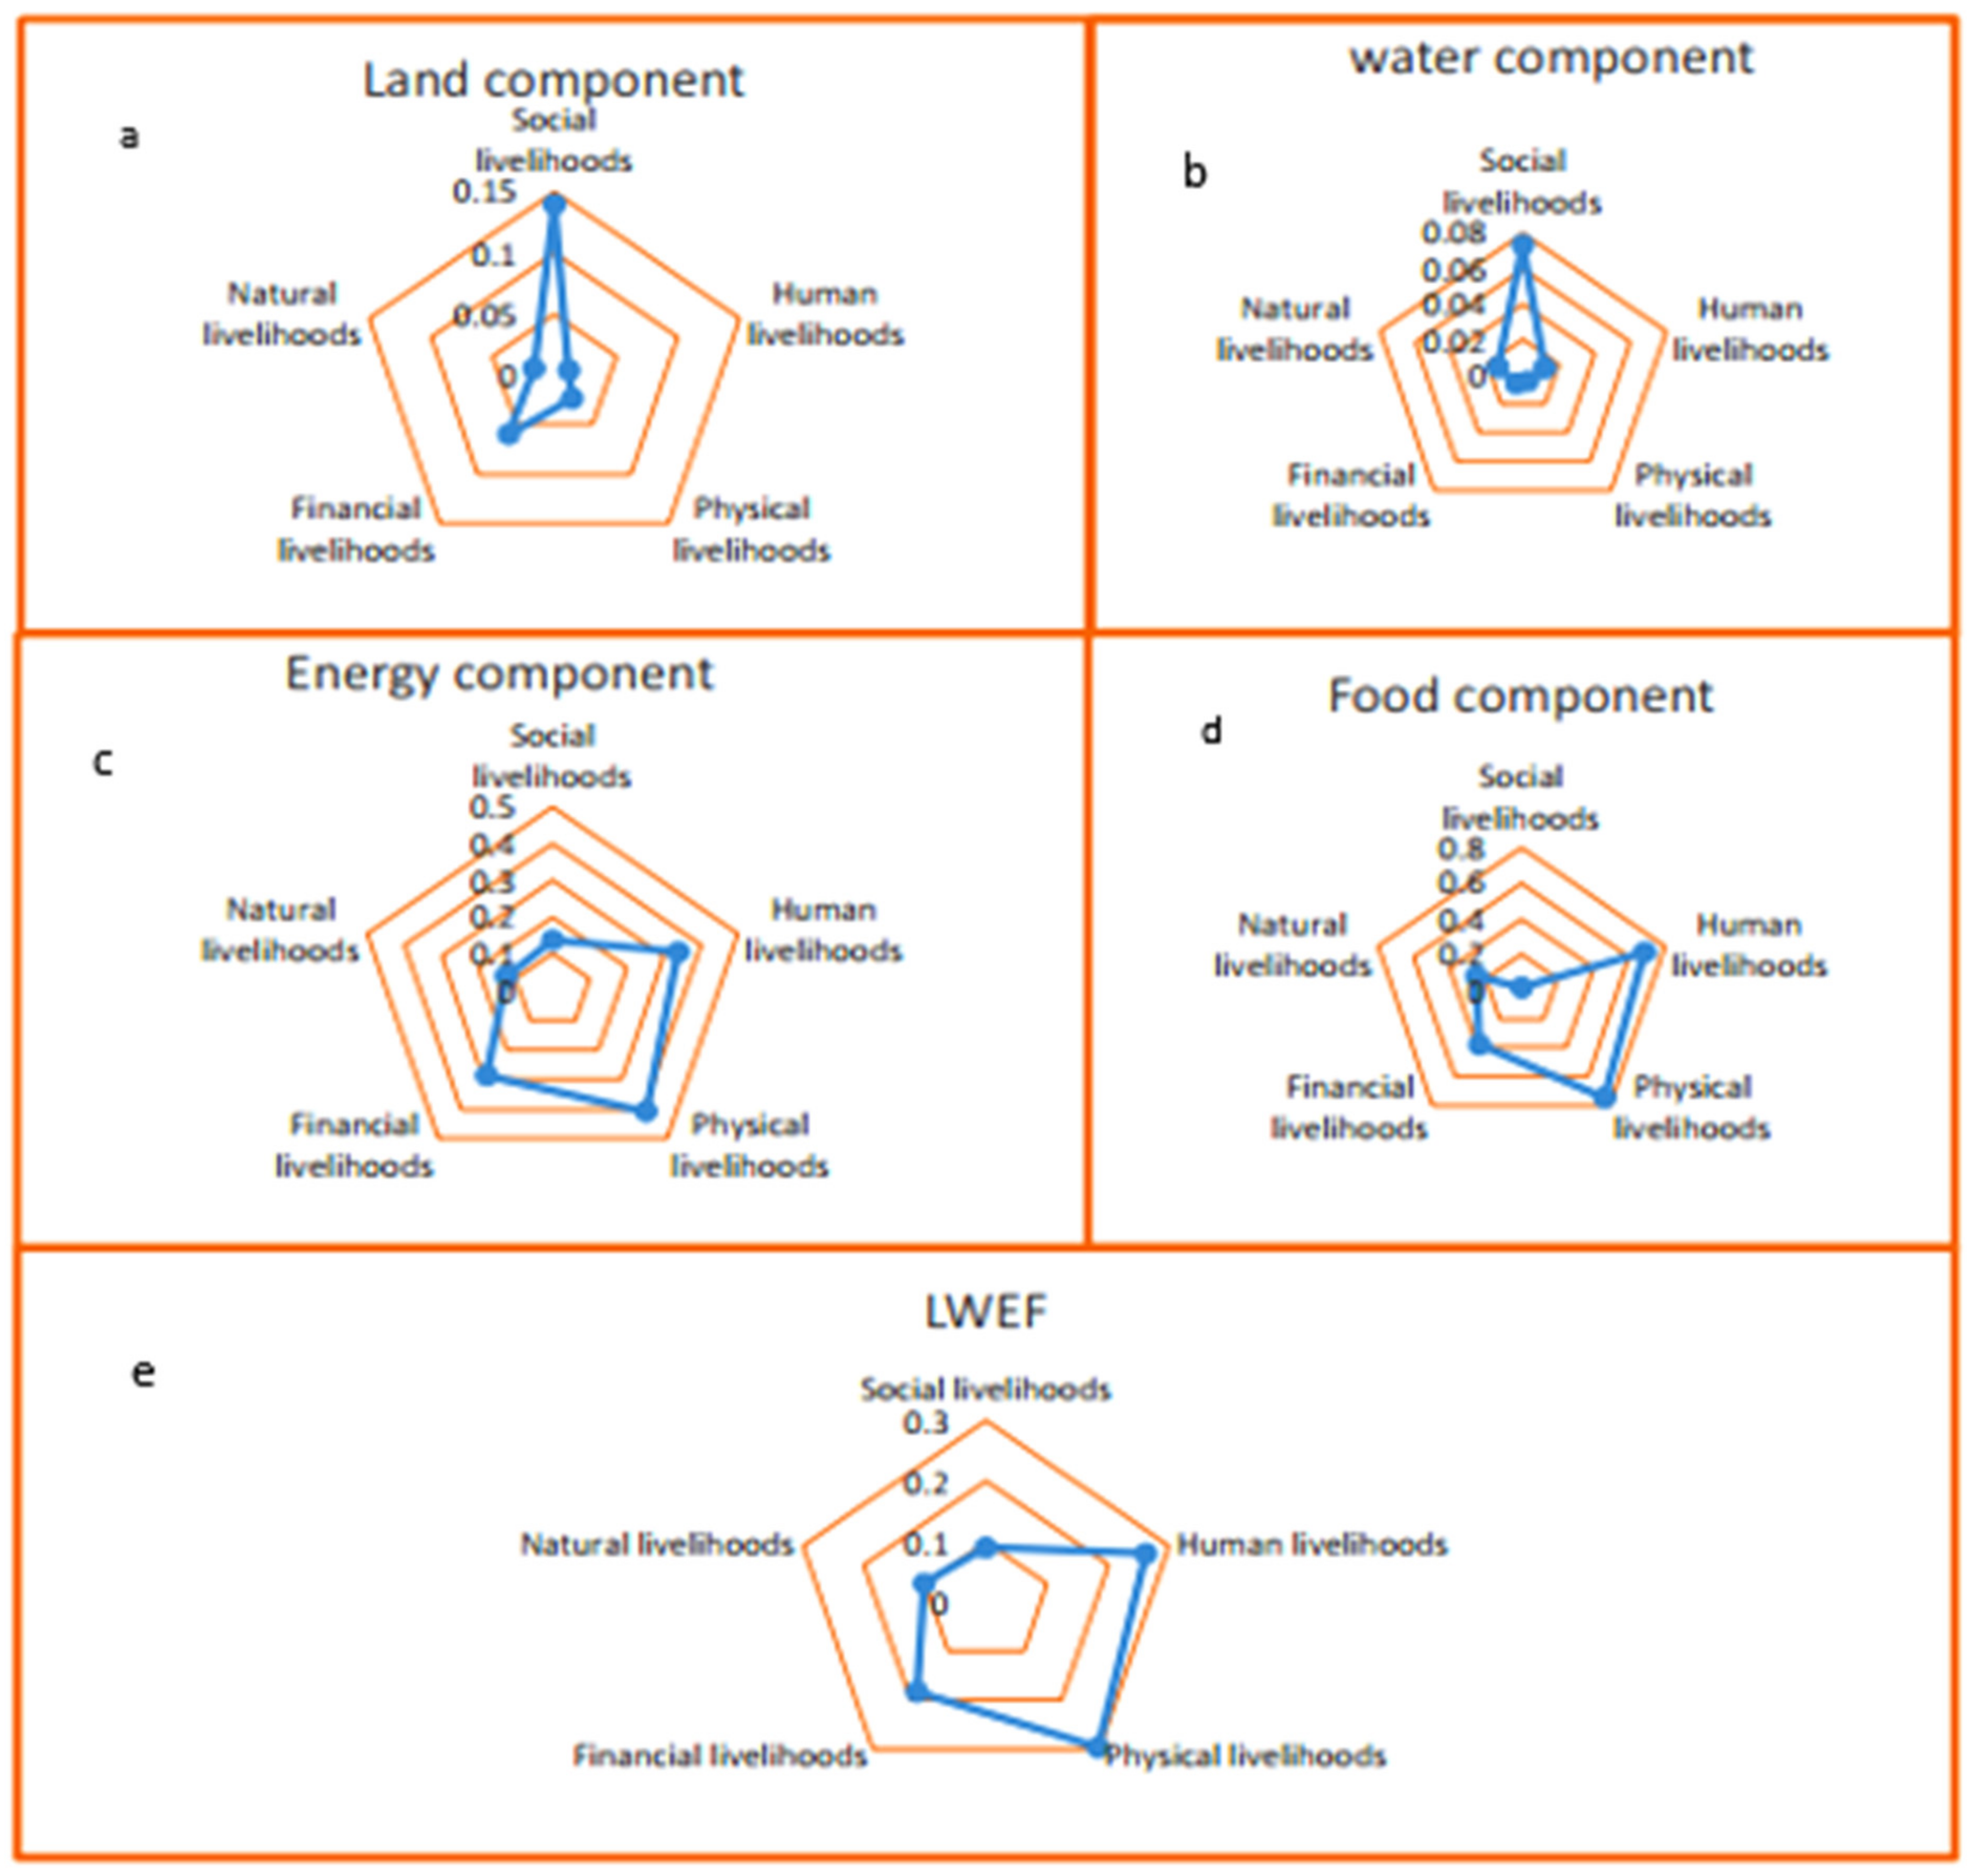
3.3. Land-Water-Energy-Food Nexus Analytical Livelihoods Framework

Local communities, especially the rural poor in the developing world, depend directly on all or a part of nexus resources for their livelihood [59]. Therefore, understanding and consensus building are necessary to identify, create and utilize the nexus approach in order to reduce trade-off. The current study identified twenty-three sustainable livelihood indicators which are linked with land, water, energy and food nexus resources (Table 3).
Table 5 shows that the community acceptances ranked as the most critical indicators compared with others from the social livelihood indicators. This indicates that the community acceptance of LWEF nexus resources as a source of livelihoods can be considered from multipurpose utilization of nexus resources for multiple sources of their livelihoods.
Unsustainability of the LWEF nexus, in this study (0.083), shows vulnerability of local community for social livelihood insecurity. To address these challenges, a shift from individual nexus resources management is the natural stage for the sustainable LWEF nexus in relation to local community.
From the human livelihood component, health is ranked as the most important indicator linked with sustainable LWEF (Table 5). The demand for food production steadily increases with population growth and all of this happens in the light of changing livelihoods, while millions of people do not have access to nutritious food that guarantees a healthy and active life. This is strongly linked with lack of productive land, water and energy sources. depicted that rising food prices and the recurrence of extreme weather events are pushing more people into poverty and hunger, compromising human health and wellbeing. Likely, other indicators, such as labor productivity, level of education, and knowledge sharing through information also depend on distribution and use of nexus resources.
The physical component of livelihood indicators includes four indicators (Table 5). The community well-being and ecosystem conservation ranked the first and the second, respectively. This implies that community-based nexus resources management has been widely taken as a strategy that aims to conserve LWEF, while simultaneously enhancing livelihoods of local community.
Decentralizing management of nexus resources to local communities improves household’s access to and management of nexus resources [23]. Thus, LWEF nexus upkeep as a tool to enhance nexus resources insecurity and resilience for sustainable livelihoods and ecosystem conservation is important. Therefore, the concept of nexus resources management should be viewed as longsighted and includes humankinds’ harmonious and gradual modification of all ecosystems. LWEF nexus is a complex multifunctional system, which needs a mosaic of four nexus resources to be properly utilized to increase social, physical, human, financial and natural livelihoods.

3.4. Comparison and Validation of LWEF Nexus and Livelihoods

To compare and validate the impact of LWEF nexus on livelihoods, the nexus resources indices were evaluated using regression analysis. Before the regression analysis, the association between the composite weight of both LWEF nexus and livelihood indicators are computed by correlation analysis (Table 6).
The correlation coefficients between livelihoods and LWEF nexus indicator indicates that the social livelihood indicators (SLI) have strong significant positive correlation (r ≥ 0.80, p < 0.01) with the land indicator (Table 6). This implies that land is a social resource upon which people draw in pursuit of their livelihood objectives and has a significant contribution for sustainable livelihood. In addition, it has significant positive correlation with LWEF nexus indicators (r ≥ 0.30, p > 0.05). This result suggests that the social livelihood indicators directly depend on land as a source of the WEF nexus (Table 6).
This result is in relation with the finding of Laspidou, Mellios and Kofinas [14], who reported that livelihoods and natural resources have direct correlation with social livelihood indicators. The natural livelihood indicators had positive correlation (r ≥ 0.30, p < 0.05) with water and energy indicators (Table 6). This result shows natural capital is very important to those who derive all or a part of their livelihoods from resource-based activities (farming, fishing, gathering in forests, irrigation water-dependent and others).
Likewise, physical livelihood indicators have strong significant positive correlation with energy (r > 0.60, p < 0.01), pinpointing that infrastructure consists of changes to the physical environment that help people to meet their basic needs and to be more productive. In general, the relationships between LWEF nexus and livelihood indicators play an important role in the overall performance of livelihoods of a local community.
The regression coefficients of land (β = 0.82 **, p < 0.01) and food (β = 0.01 *, p < 0.05) indices imply that land and food have a significant positive effect on the composite social livelihood indicators (Table 7). Comparably, the effect of land is slightly stronger than that of food indicators. This ensures that sustainable land use management enhances food security and also promotes biodiversity conservation, in agreement with the finding of Hurni, et al. [60]. However, the current study reveals the low sustainable composite index of LWEF (0.083) (Table 4), it is an indication of unsustainable land use, which leads to the vulnerability of livelihood of the local community.
The composite water index significantly affects human livelihood indicators (β = −0.09, p < 0.05). Human capital is required to make good uses of limited water resources which helps achieve positive livelihood outcome. The negative coefficient value of the water index indicates a single unit change in water management has a negative impact on the livelihood performance. stated that water is the critical resource which underpins all social and economic activity.
Table 7 shows, land (β = 0.14, p < 0.01) and food (β = −0.60, p < 0.05) nexus indicators have significant effects on the physical livelihood indicators. This implies that land indicators significantly improve the community well-being and ecosystem conservation (Table 5), but the food indicators reduce physical indicators performance. This shows that the performance of land capability, suitability and productivity and food production has increased or decreased through the method of adjusting the physical livelihoods indicators, such as physical economic infrastructure that enable the household to pursue its livelihoods.
Table 7 shows that food as nexus component indicators (β = 0.5534, p < 0.05), which significantly affects the health, labor productivity and education, indeed major indicators of human livelihoods with maximum weight and rank.
Table 7 shows, land (β = 0.1391, p < 0.01) and food (β = −0.6042, p < 0.05) nexus indicators have significant effects on the physical livelihood indicators. This implies that land indicators significantly improve the community wellbeing and ecosystem conservation, while the food indicators reduce physical indicators performance. This shows that the performance of land capability, suitability and productivity and food production has increased or decreased through the method of adjusting the physical livelihoods indicators, such as physical economic infrastructure that enable the household to pursue its livelihoods.
The coefficients of the land (β = 0.35, p < 0.01) and water (β = 0.10, p < 0.01), indicates that both nexus resources have positive influence on the natural livelihood indicators (Table 7). This implies land and water are key environmental services in which food is produced from as a natural capital. Thus, the livelihoods of local community are strongly linked with the nexus resources components. Therefore, to overcome the current unsustainability of nexus resources, there is a need for paradigm shift from business as usual to nexus resource management approach which needs to start from grass root level.
With the exception of all nexus resources, understanding energy as part of nexus resources is very critical. This is because energy availability and access would have a wide range of positive externalities on various dimensions of human welfare. However, the impact of modern energy on sustainable livelihoods is less known. Therefore, due to the potential dependences of local community on traditional energy sources, they fail to consider energy as nexus component. This poses unintended pressure on the environment.
This shows the need of sustainable management of the LWEF nexus as an important analytical tool for transforming livelihoods. With this, the idea of nexus resources’ sustainability has received wider attention; however, weighting, ranking and linking with the livelihoods will be most important to predict the range of acceptable nexus resource impacts and community coping strategies.

3.5. Analysis of Overall LWEF Nexus Performance in Livelihoods

Sensitivity analysis of nexus resources in resource-scarce areas has helped local communities to achieve their goal of improved livelihoods. The sensitivity analysis computed using additional regression is used to analyze the influence of each composite nexus resources indicator on livelihoods.
Table 8 indicates the sensitivity analysis for LWEF nexus and five main livelihood indicators, the sensitivity judgment scale was adopted from Hosmer and Lemeshow [61]. The result shows that the probability of livelihoods, particularly the social component increases by 89.1% if nexus resources, i.e., food increased by 1.00% (Table 8).
This implies increased food production could enhance the social livelihood indicator. In addition, human, financial and physical livelihood components show the same trends. This indicates that all the livelihood indicators have the probability to be influenced by food availability, access, utilization and stability. Likely, the probability of natural livelihoods increases by 69.20% if food increases by one unit. This suggests that the ability of households to undertake the production of food is strongly associated with their access to natural livelihood component, i.e., farmland.
The probability of a unit increase in water as one nexus resource increases the social, human and financial component of livelihoods by 79.90, 69.60 and 69.10%, respectively (Table 8). This pinpoints that water is the critical nexus resource which underpins all social and economic activity since clean, healthy and sustainable water supply is strongly linked with the livelihoods of local communities.
In general, the overall sensitivity analysis indicates that the probability of livelihood dependences in the four nexus resources is greater than 50% in the study area. This indicates the current unsustainable condition of nexus resources. It is 0.083 and will have more than 50% of livelihood vulnerability and needs serious stakeholder intervention in the area.
In order to measure the extent of nexus resources sustainability indicators and their impact on the livelihoods of a local community, the spider web analysis was performed. Figure 3a shows the proximity between land and livelihood indicator. It depicts that social and financial livelihood indicators are closer to land nexus components than physical, human or natural indicators. This indicates that land is a social capital in which a household can invest with the expectation of future flow of benefits, and acts as a financial source, since it has predictable value when liquidated and exchanged.
Water sustainability indicators are a basic condition for obtaining good social indicators (Figure 3b). Plummer and Slaymaker [62] suggested that water supply and sanitation links with sustainability and prevailing conditions of pro-poor economic growth. In addition, high availability, supply and access to water allow the population to cope with livelihood shocks and stress to achieve basic social indicators.
Regarding food and livelihood indicators, the food nexus component is most linked with human, physical and financial livelihoods (Figure 3d). This reveals that the livelihoods of a local community are the most vulnerable to the adverse effect of food security.
After understanding the individual nexus resources effects on livelihoods, the weighted average of nexus resources impact on livelihood was evaluated (Figure 3e). It shows that human, physical and financial livelihoods are highly sensitive to sustainability of LWEF nexus resources.
Pimentel, et al. [63] reported that evidence on benefits of LWEF system management will reduce costs and increase benefits for both human and nature; however, a deeper understanding of the complex dynamics of these systems, and their feedback mechanism are yet to be developed by scholars. This made a significant contribution to nexus resources degradation which leads to vulnerability of a local community.
Under such consequences, the rural poor community is vulnerable to the effect of uncoordinated management of nexus resources. This is due to lack of nexus concept emphasis on natural resources, and integrated management of sectors to be demand-driven. Therefore, there is a need for a paradigm shift from rigid and sectorial-based nexus resources management to economic development and livelihood improvement.

4. Food First versus Sustainable Livelihood Approach

Rapid population’s growth, land degradation and climatic variability affect increasingly the demand of water, energy and food for smallholders. This makes food production slow, thereby declining productivity.
Food production without keeping the causal impact of land use, water and energy significantly affects the total amounts of food produced, and related ecosystem disturbances. All the nexus resources are linked with the livelihoods of local community to a varying extent (Figure 3). This indicates a lack of understanding and a trade-off among nexus resources and continues to have undesirable impacts on the livelihoods.
Approaches that focus narrowly on one component of the LWEF nexus without paying attention to its synergies risks major unintended consequences [46]. For example, lack of energy in a rural area makes the local community depend on forest trees, shrub wood and crop biomasses sources of fire wood, which is becoming a silent degradation factor [28].
Therefore, the singular approach, i.e., food-centered approach, cannot sustain livelihoods of a local community because cascading failures in one system may occur in others [48]. This is because failures in land use management lead to an increased risk of failures in food productions and hydrological variability. This study discovered that the livelihoods of a local community in the study area have been decreasing due to over-dependence on fragmented land and rain-fed agriculture. This demonstrates that agricultural productivity yet depends on rain-based water sources, which ignores the interlinkage between land use by irrigation water supported by energy supply for pumping. This condition necessarily reduces food production.
Apparently, there is no effective identification of LWEF nexus resources sustainability to inform a local community on resource variability events so that they can plan for coping and adapting to events. As shown in Table 4, the composite nexus resources index of 0.083 conveyed to have adequate impacts on social, human, physical, financial and natural livelihood indicators. The result shows the need for site-specific planning, coordination and monitoring of nexus resources. This is vitally important, particularly for developing country such as Ethiopia. Because in the last four decades the country has undergone dynamic land use change, this remarkably affects water, energy and food systems. Individual focus on food production may have impact on individual areas of land, water and energy. However, the close relationships, interaction, and interdependences among these resources are usually not taken into consideration. Yet, solving one challenge in managing one resource, often creates a challenge for other resources; therefore, the better solution is managing nexus resources collectively using the nexus approach which needs policy attention.
Understanding the LWEF nexus sustainability necessitates a readily accessible institutional structure and make-up to build integrated policies. Issues on how to promote potential synergies and trade-off exists among nexus resources. This poses great challenges to natural resource management. Studies on LWEF nexus have found some useful measure to deal with nexus resources trade-off [62,63]. As an example, land use change in expense of food production results in a conflict between irrigation water and hydropower [5]. They seek a policy that sustainably intensifies food production and poverty reduction, which has profound implications for unique environmental management.
Policy is the main driving force for sustainable natural resources. In fact, food security and growing demand of nexus resources results in unsustainable use and management of nexus resources, which needs critical policy intervention. In order to address such issues, a range of policy measures could be investigated to safeguard and enhance the LWEF nexus. These could involve regulations of land use change, reduction of inefficient use of water, expansion of alternative energy sources, reduction of biomass energy sources and use of the technology-based approach. These efficiently resonate with sustainable livelihoods. Indeed, applying integrated management of nexus resources in line with livelihoods ensures environmental security. These above findings highlight the implication for the sustainability of LWEF nexus resources in the context of food security.
Lastly, sustainability of LWEF nexus resources needs synergies in policy formulation when considering food security links with livelihood strategy. Local communities are often vulnerable to the social, human, physical, financial and natural component of livelihoods to develop a sustainable livelihood strategy. The nexus approach has become a useful tool for selecting and adopting site-specific policy measures to enhance the human-environment relation. These provide a strong evidence base for decision makers to ensure sustainable use of land, water, energy and food security for livelihoods.

5. Conclusions

Sustainability of LWEF nexus resources is becoming a critical topic at global, national, and regional scale. It is also important from a local perspective. In this paper, quantification and linkage analysis was presented to explore the sustainable LWEF nexus resources and livelihoods. With this, it was aimed to investigate the link between sustainable LWEF nexus and livelihoods. Qualitative data were generated through focus groups and interviews with households and key informants representing a broad cross-section of actors, including participant from land use, agriculture, water and energy sector.
It was found that LWEF nexus composite index for the study region is 0.083 indicating a low index. Moreover, this composite index implies that the use and management of LWEF nexus resources in the study area is very low. As the composite index approaches 1, the use and management of nexus resources are in a good condition which characterized by sustainability. This could be linked with nexus resources consumption, use, and management. This implies there is unsustainable consumption, use and management of nexus resources in the study area in which exploitation levels came to exceed resources’ natural regeneration. Such overexploitation ultimately threatens the livelihoods and wellbeing of people who depend on these resources, and jeopardizes the health of overall environment.
LWEF nexus resources had positive correlation with social (r ≥ 0.8, p < 0.01), natural (r ≥ 0.3, p < 0.05) and physical (r ≥ 0.6, p < 0.01) livelihoods. This necessitates strong understanding between LWEF nexus and livelihood. However, it was understood that in the study area focusing on one nexus component have been encouraging in the majority of sector, i.e., food production, this might create trade-off between livelihood and LWEF nexus. The AHP methodology could identify the suitable alternative based on the scores. With respect to the illustrative results, composite LWEF nexus index with score of 0.083 was selected to show sustainability or unsustainability of nexus resources which need further justification. Future research can consider other various indicators to test the composite LWEF nexus. Another suggestion is to consider other methods related with AHP. Furthermore, focus on other alternatives for omitting or reducing unsustainability can be tested in a more completed network.
In summary, the findings in this study imply that sustainable nexus resources can enhance livelihood sustainability. Thus, government and non-governmental organization need to adopt collaborative resource management measures to improve the current nexus resources insecurity. This could be attained by strong evidence-based policy to ensure sustainable use of nexus resources. In addition, the results provided by this study would serve as the foundation for future study, policy formulation, and implementation.

Author Contributions

Conceptualization, Z.W. and W.W.; methodology, Z.W.; software, Z.W.; validation, Z.W., W.W. and H.K.; formal analysis, Z.W.; investigation, Z.W.; resources, Z.W.; data curation, Z.W. and H.K.; writing—original draft preparation, B.K.; writing—review and editing, Z.W. and B.K.; visualization, Z.W.; supervision, W.W.; project administration, W.W.; funding acquisition, W.W.; editing and reviewing, H.K.; editng, finding acquisition, X.L. All authors have read and agreed to the published version of the manuscript.

Funding

International Expert Project supported by the Ministry of Science and Technology of China (Fund number: DL2021145002L, G20200010086) are projects which made this research possible.

Institutional Review Board Statement

Not applicable.

Informed Consent Statement

Not applicable.

Data Availability Statement

Not applicable.

Acknowledgments

We are grateful to the Chinese Government Scholarship Council (CSC) for giving the first author a chance to pursue his Ph.D. study in China.

Conflicts of Interest

The authors declare no conflict of interests.

References

  1. Lee, S.-H.; Taniguchi, M.; Mohtar, R.; Choi, J.-Y.; Yoo, S.-H. An Analysis of the Water-Energy-Food-Land Requirements and CO2 Emissions for Food Security of Rice in Japan. Sustainability 2018, 10, 3354. [Google Scholar] [CrossRef] [Green Version]
  2. Rasul, G.; Sharma, B. The nexus approach to water-energy-food security: An option for adaptation to climate change. Clim. Policy 2016, 16, 682–702. [Google Scholar] [CrossRef] [Green Version]
  3. Ringler, C.; Bhaduri, A.; Lawford, R. The nexus across water, energy, land and food (WELF): Potential for improved resource use efficiency? Curr. Opin. Environ. Sustain. 2013, 5, 617–624. [Google Scholar] [CrossRef]
  4. Terrapon-Pfaff, J.; Ortiz, W.; Dienst, C.; Gröne, M.-C. Energising the WEF nexus to enhance sustainable develop-ment at local level. J. Environ. Manag. 2018, 223, 409–416. [Google Scholar] [CrossRef]
  5. Spera, S.A.; Galford, G.L.; Coe, M.T.; Macedo, M.N.; Mustard, J.F. Land-use change affects water recycling in Brazil’s last agricultural frontier. Glob. Change Biol. 2016, 22, 3405–3413. [Google Scholar] [CrossRef]
  6. Waughray, D. Water Securitythe Water-Food-Energy-Climate Nexus: The World Economic Forum Water Initiative; Island Press: Washington, DC, USA, 2011. [Google Scholar]
  7. Avtar, R.; Tripathi, S.; Aggarwal, A.K.; Kumar, P. Population-urbanization-energy Nexus: A review. Resources 2019, 8, 136. [Google Scholar] [CrossRef] [Green Version]
  8. De Amorim, W.S.; Valduga, I.B.; Ribeiro, J.M.P.; Williamson, V.G.; Krauser, G.E.; Magtoto, M.K.; de Andrade, J.B.S.O. The nexus between water, energy, and food in the context of the global risks: An analysis of the interactions between food, water, and energy security. Environ. Impact Assess. Rev. 2018, 72, 1–11. [Google Scholar] [CrossRef]
  9. Leck, H.; Conway, D.; Bradshaw, M.; Rees, J. Tracing the water-energy-food nexus: Description, theory and practice. Geogr. Compass 2015, 9, 445–460. [Google Scholar] [CrossRef] [Green Version]
  10. Ringler, C.; Willenbockel, D.; Perez, N.; Rosegrant, M.; Zhu, T.; Matthews, N. Global linkages among energy, food and water: An economic assessment. J. Environ. Stud. Sci. 2016, 6, 161–171. [Google Scholar] [CrossRef] [Green Version]
  11. Tosun, J.; Leininger, J. Governing the interlinkages between the sustainable development goals: Approaches to attain policy integration. Glob. Chall. 2017, 1, 1700036. [Google Scholar] [CrossRef]
  12. Wang, Q.; Li, S.; He, G.; Li, R.; Wang, X. Evaluating sustainability of water-energy-food (WEF) nexus using an improved matter-element extension model: A case study of China. J. Clean. Prod. 2018, 202, 1097–1106. [Google Scholar] [CrossRef]
  13. Kurian, M. The water-energy-food nexus: Trade-offs, thresholds and transdisciplinary approaches to sustainable development. Environ. Sci. Policy 2017, 68, 97–106. [Google Scholar] [CrossRef]
  14. Laspidou, C.S.; Mellios, N.; Kofinas, D. Towards Ranking the Water-Energy-Food-Land Use-Climate Nexus In-terlinkages for Building a Nexus Conceptual Model with a Heuristic Algorithm. Water 2019, 11, 306. [Google Scholar] [CrossRef] [Green Version]
  15. Gulati, M.; Jacobs, I.; Jooste, A.; Naidoo, D.; Fakir, S. The water-energy-food security nexus: Challenges and opportunities for food security in South Africa. Aquat. Procedia 2013, 1, 150–164. [Google Scholar] [CrossRef]
  16. Pahl-Wostl, C. Governance of the water-energy-food security nexus: A multi-level coordination challenge. Environ. Sci. Policy 2019, 92, 356–367. [Google Scholar] [CrossRef]
  17. Stein, C.; Barron, J.; Moss, T. Governance of the nexus: From buzz words to a strategic action perspective. Nexus Netw. Think Piece Ser. Pap. 2014, 3, 1–23. [Google Scholar]
  18. Wakeford, J.J. The Water-Energy-Food Nexus in a Climate-Vulnerable, Frontier Economy: The Case of Kenya; Report Prepared for the United Kingdom department for international development by the Sustainability Institute South Africa; Quantum Global Research Lab: Cape Town, South Africa, 2017. [Google Scholar]
  19. Weitz, N.; Nilsson, M.; Davis, M. A nexus approach to the post-2015 agenda: Formulating integrated water, energy, and food SDGs. SAIS Rev. Int. Aff. 2014, 34, 37–50. [Google Scholar] [CrossRef]
  20. Biggs, E.M.; Bruce, E.; Boruff, B.; Duncan, J.M.; Horsley, J.; Pauli, N.; McNeill, K.; Neef, A.; Van Ogtrop, F.; Curnow, J. Sustainable development and the water-energy-food nexus: A perspective on livelihoods. Environ. Sci. Policy 2015, 54, 389–397. [Google Scholar] [CrossRef] [Green Version]
  21. Amenu, B.T. Assessments of the Effects of Land Degradation on Freshwater and Local Communities Participation in Essera District, Dawro Zone, South Western Ethiopia. Am. J. Nat. Sci. 2017, 1, 1–20. [Google Scholar]
  22. Chen, B.; Han, M.; Peng, K.; Zhou, S.; Shao, L.; Wu, X.; Wei, W.; Liu, S.; Li, Z.; Li, J. Global land-water nexus: Agricultural land and freshwater use embodied in worldwide supply chains. Sci. Total Environ. 2018, 613, 931–943. [Google Scholar] [CrossRef]
  23. Chartres, C.J.; Noble, A. Sustainable intensification: Overcoming land and water constraints on food production. Food Secur. 2015, 7, 235–245. [Google Scholar] [CrossRef]
  24. Bodin, Ö.; Crona, B.I. The role of social networks in natural resource governance: What relational patterns make a difference? Glob. Environ. Change 2009, 19, 366–374. [Google Scholar] [CrossRef]
  25. Yisehak, B.; Adhena, K.; Shiferaw, H.; Hagos, H.; Abrha, H.; Bezabh, T. Characteristics of hydrological extremes in Kulfo River of southern Ethiopian Rift Valley basin. SN Appl. Sci. 2020, 2, 1–12. [Google Scholar] [CrossRef]
  26. Musie, M.; Momblanch, A.; Sen, S. Exploring future global change-induced water imbalances in the Central Rift Valley Basin, Ethiopia. Clim. Change 2021, 164, 1–19. [Google Scholar] [CrossRef]
  27. Ademe, F.; Kibret, K.; Beyene, S.; Getinet, M.; Mitike, G. Rainfall analysis for rain-fed farming in the Great Rift Valley Basins of Ethiopia. J. Water Clim. Change 2020, 11, 812–828. [Google Scholar] [CrossRef] [Green Version]
  28. WoldeYohannes, A.; Cotter, M.; Kelboro, G.; Dessalegn, W. Land use and land cover changes and their effects on the landscape of Abaya-Chamo Basin, Southern Ethiopia. Land 2018, 7, 2. [Google Scholar] [CrossRef] [Green Version]
  29. Ciegis, R.; Ramanauskiene, J.; Startiene, G. Theoretical reasoning of the use of indicators and indices for sustainable development assessment. Eng. Econ. 2009, 63, 3. [Google Scholar]
  30. Abubakar, I.R. Understanding the socioeconomic and environmental indicators of household water treatment in Nigeria. Util. Policy 2021, 70, 101209. [Google Scholar] [CrossRef]
  31. Klingebiel, A.A.; Montgomery, P.H. Land-Capability Classification; Soil Conservation Service, US Department of Agriculture: Washington, DC, USA, 1961.
  32. McMorrow, J.; Talip, M.A. Decline of forest area in Sabah, Malaysia: Relationship to state policies, land code and land capability. Glob. Environ. Change 2001, 11, 217–230. [Google Scholar] [CrossRef]
  33. Aymen, A.-T.; Al-husban, Y.; Farhan, I. Land suitability evaluation for agricultural use using GIS and remote sensing techniques: The case study of Ma’an Governorate, Jordan. Egypt. J. Remote Sens. Space Sci. 2021, 24, 109–117. [Google Scholar]
  34. Han, B.; Jin, X.; Xiang, X.; Rui, S.; Zhang, X.; Jin, Z.; Zhou, Y. An integrated evaluation framework for Land-Space ecological restoration planning strategy making in rapidly developing area. Ecol. Indic. 2021, 124, 107374. [Google Scholar] [CrossRef]
  35. Bekker, A.; Van Dijk, M.; Niebuhr, C.M.; Hansen, C. Framework development for the evaluation of conduit hydropower within water distribution systems: A South African case study. J. Clean. Prod. 2021, 283, 125326. [Google Scholar] [CrossRef]
  36. Ren, L.; Gao, J.; Song, S.; Li, Z.; Ni, J. Evaluation of Water Resources Carrying Capacity in Guiyang City. Water 2021, 13, 2155. [Google Scholar] [CrossRef]
  37. Aiyetan, A.O.; Das, D.K. Evaluation of the factors and strategies for water infrastructure project delivery in South Africa. Infrastructures 2021, 6, 65. [Google Scholar] [CrossRef]
  38. Bose, D.; Saini, D.K.; Yadav, M.; Shrivastava, S.; Parashar, N. Review of sustainable grid-independent renewable energy access in remote communities of India. Integr. Environ. Assess. Manag. 2021, 17, 364–375. [Google Scholar] [CrossRef]
  39. Jing, R.; Wang, X.; Zhao, Y.; Zhou, Y.; Wu, J.; Lin, J. Planning urban energy systems adapting to extreme weather. Adv. Appl. Energy 2021, 3, 100053. [Google Scholar] [CrossRef]
  40. Axon, C.; Darton, R. Sustainability and risk—A review of energy security. Sustain. Prod. Consum. 2021, 27, 1195–1204. [Google Scholar] [CrossRef]
  41. Mehta, V.K.; Haden, V.R.; Joyce, B.A.; Purkey, D.R.; Jackson, L.E. Irrigation demand and supply, given projections of climate and land-use change, in Yolo County, California. Agric. Water Manag. 2013, 117, 70–82. [Google Scholar] [CrossRef]
  42. Rasul, G. Food, water, and energy security in South Asia: A nexus perspective from the Hindu Kush Himalayan region. Environ. Sci. Policy 2014, 39, 35–48. [Google Scholar] [CrossRef] [Green Version]
  43. Searchinger, T.; Heimlich, R. Avoiding bioenergy competition for food crops and land. In Creating a Sustainable Food Future; World Resources Institute: Washington, DC, USA, 2015; pp. 1–44. [Google Scholar]
  44. Saaty, T.L. The analytic hierarchy and analytic network processes for the measurement of intangible criteria and for decision-making. In Multiple Criteria Decision Analysis; Springer: Berlin/Heidelberg, Germany, 2016; pp. 363–419. [Google Scholar]
  45. Chen, P.; Gao, C.; Zhang, A.Y. Optimal full ranking from pairwise comparisons. arXiv 2021, arXiv:2101.08421. [Google Scholar]
  46. Mabhaudhi, T.; Nhamo, L.; Mpandeli, S.; Nhemachena, C.; Senzanje, A.; Sobratee, N.; Chivenge, P.P.; Slotow, R.; Naidoo, D.; Liphadzi, S.; et al. The Water-Energy-Food Nexus as a Tool to Transform Rural Livelihoods and Well-Being in Southern Africa. Int. J. Environ. Res. Public Health 2019, 16, 62970. [Google Scholar] [CrossRef] [Green Version]
  47. Meixner, O.; Haas, R.; Pöchtrager, S. AHP group decision making and clustering. In Proceedings of the International Symposium on the Analytic Hierarchy Process (ISAHP), London, UK, 4–8 August 2016; p. 2016. Available online: https://www.isahp.org/uploads/paper_mo_hr_isahp2016rev-2.pdf (accessed on 5 September 2016).
  48. Newland, K.; Patrick, E. Beyond remittances: The Role of Diaspora in Poverty Reduction in Their Countries of Origin, a Scoping Study by the Migration Policy Institute for the Department of International Development; Migration Policy Institute: Washington, DC, USA, 2004. [Google Scholar]
  49. Ilyichev, V.; Kolchunov, V.; Emelyanov, S.; Bakaeva, N.V. About the dynamic model formation of the urban livelihood system compatible with the biosphere. In Applied Mechanics and Materials; Trans Tech Publications Ltd.: Bäch, Switzerland, 2015; pp. 1224–1230. [Google Scholar]
  50. Shreevastav, B.B.; Tiwari, K.R.; Mandal, R.A.; Nepal, A. Assessing flood vulnerability on livelihood of the local community: A case from southern Bagmati corridor of Nepal. Prog. Disaster Sci. 2021, 12, 100199. [Google Scholar] [CrossRef]
  51. Pandey, R.; Jha, S.K.; Alatalo, J.M.; Archie, K.M.; Gupta, A.K. Sustainable livelihood framework-based indicators for assessing climate change vulnerability and adaptation for Himalayan communities. Ecol. Indic. 2017, 79, 338–346. [Google Scholar] [CrossRef]
  52. Mihiretu, A.; Okoyo, E.N.; Lemma, T. Causes, indicators and impacts of climate change: Understanding the public discourse in Goat based agro-pastoral livelihood zone, Ethiopia. Heliyon 2021, 7, e06529. [Google Scholar] [CrossRef]
  53. Patra, S.; Sahoo, S.; Mishra, P.; Mahapatra, S.C. Impacts of urbanization on land use/cover changes and its probable implications on local climate and groundwater level. J. Urban Manag. 2018, 7, 70–84. [Google Scholar] [CrossRef]
  54. Karczmarek, P.; Pedrycz, W.; Kiersztyn, A. Fuzzy analytic hierarchy process in a graphical approach. Group Decis. Negot. 2021, 30, 463–481. [Google Scholar] [CrossRef]
  55. Saaty, T.L.; Zoffer, H.; Vargas, L.G.; Guiora, A. The Analytic Hierarchy Process: Beyond “Getting to Yes” in Conflict Resolution. In Overcoming the Retributive Nature of the Israeli-Palestinian Conflict; Springer: Berlin/Heidelberg, Germany, 2022; pp. 17–29. [Google Scholar]
  56. Biswas, J.K.; Mondal, B.; Priyadarshini, P.; Abhilash, P.C.; Biswas, S.; Bhatnagar, A. Formulation of Water Sustainability Index for India as a performance gauge for realizing the United Nations Sustainable Development Goal 6. Ambio 2021, 51, 1569–1587. [Google Scholar] [CrossRef]
  57. Karamouz, M.; Rahimi, R.; Ebrahimi, E. Uncertain water balance-based sustainability index of supply and demand. J. Water Resour. Plan. Manag. 2021, 147, 04021015. [Google Scholar] [CrossRef]
  58. Abebe, T.; Wiersum, K.; Bongers, F.; Sterck, F. Diversity and dynamics in homegardens of southern Ethiopia. In Tropical Homegardens; Springer: Berlin/Heidelberg, Germany, 2006; pp. 123–142. [Google Scholar]
  59. Krittasudthacheewa, C.; Lebel, L.; Daniel, R. Chindwin Futures: Natural Resources, Livelihoods, Institutions and Climate Change in Myanmar’s Chindwin River Basin; Strategic Information and Research Development Centre: Petaling Jaya, Malaysia, 2021. [Google Scholar]
  60. Molotoks, A.; Smith, P.; Dawson, T.P. Impacts of land use, population, and climate change on global food security. Food Energy Secur. 2021, 10, e261. [Google Scholar] [CrossRef]
  61. Hosmer, D.W.; Lemeshow, S. Applied Logistic Regression; John Wiley & Sons: New York, NY, USA, 2020. [Google Scholar]
  62. Plummer, J.; Slaymaker, T. Rethinking Governance in Water Services; Overseas Development Institute: London, UK, 2007. [Google Scholar]
  63. Pimentel, D.; Whitecraft, M.; Scott, Z.R.; Zhao, L.; Satkiewicz, P.; Scott, T.J.; Phillips, J.; Szimak, D.; Singh, G.; Gonzalez, D.O. Will limited land, water, and energy control human population numbers in the future? Hum. Ecol. 2010, 38, 599–611. [Google Scholar] [CrossRef]
Figure 1. Map of the case study area.
Atmosphere 13 00638 g001
Figure 2. Steps to attain the present methodology.
Atmosphere 13 00638 g002
Figure 3. The spider web showing the weight of change of LWEF nexus resources indicators on livelihood indicators.
Atmosphere 13 00638 g003
Table 1. Overview of the LWEF nexus indicators from the existing literature.
Nexus Component IndicatorsDescriptionsSources
LandLand capability (LI1)Land capability is the ability of land to support a given land use without causing damage.Its assessment considers the specific requirements of the land use and the risks of degradation associated with the land use.[31,32,33,34]
Land suitability (LI2)Land capability assessments are a first step in assessing land suitability for a given use. Suitability considers other factors, such as economics, infrastructure requirements, labor access, water and energy access, conflicting and complementary land uses, and the policy framework.
Land productivity (LI3)The productivity of land is determined by its natural qualities and fertility. This indicates all lands are not equally fertile, which means that some locations are very fertile and have very good agricultural productivity, whereas some patches are non-productive.
WaterAccess (WI1)Global water resources are facing increasing pressure from rapidly growing demands and climate change, which affect access to water. Thus, sustainable water management is a key global concern intricately linked to many livelihoods worldwide.[35,36,37]
Safety (WI2)Unsafe water is one of the world’s largest health and environmental problems, particularly for the poorest in the world. It also exacerbates malnutrition.
Affordability (WI3)The physical availability of water is becoming a serious challenge, and its absence generates commensurate impacts on the livelihoods and human wellbeing.
EnergyAdequate Supply to demand (EI1)About 40% of the global population relies on traditional use of biomass for cooking and heating their houses. This is both directly and indirectly linked with environmental disturbances.[15,38,39,40]
Physical Availability (EI2)Today’s lack of physical availability of energy, simultaneously affects environmental quality and growth of socio-economic activity.
FoodAvailability (FI1)Refers to the physical existence of food, whether from the household’s own farm, garden production, and/or from domestic and international markets.[41,42,43]
Access (FI2)Refers to the resources an individual has at hand to obtain appropriate foods for a nutritious diet.
Utilization(FI3)Refers to the actual food that is consumed by individuals; how it is stored, prepared, and consumed.In addition, what nutritional benefits the individual drives from consumption.
Stability(FI4)Refers to the temporal dimension, or time-frame of food security.
Table 2. PCM and weight for the LWEF nexus indicators.
IndicatorsLI1LI2LI3WI1WI2WI3EI1EI2FI1FI2FI3FI4Weight
LI11 0.042
LI231 0.050
LI3321 0.066
WI12221 0.069
WI2111/21/21 0.041
WI3443361 0.149
EI1221141/21 0.069
EI2212141/321 0.075
FI11111/231/3111 0.058
FI22211311221 0.096
FI32133222331/31 0.150
FI4131211/23121510.135
Table 3. Component of Sustainable livelihood indicators.
Nexus Component IndicatorsDescriptionsSources
LandLand capability (LI1)Land capability is the ability of land to support a given land use without causing damage.Its assessment considers the specific requirements of the land use and the risks of degradation associated with the land use.[34,35,36,37,38]
Land suitability (LI2)Land capability assessments are a first step in assessing land suitability for a given use. Suitability considers other factors, such as economics, infrastructure requirements, labor access, water and energy access, conflicting and complementary land uses, and the policy framework.
Land productivity (LI3)The productivity of land is determined by its natural qualities and fertility. This indicates all lands are not equally fertile, which means that some locations are very fertile and have very good agricultural productivity, whereas some patches are non-productive.
WaterAccess (WI1)Global water resources are facing increasing pressure from rapidly growing demands and climate change, which affect access to water. Thus, sustainable water management is a key global concern intricately linked to many livelihoods worldwide.[39,40,41,42,43]
Safety (WI2)Unsafe water is one of the world’s largest health and environmental problems, particularly for the poorest in the world. It also exacerbates malnutrition.
Affordability (WI3)The physical availability of water is becoming a serious challenge, and its absence generates commensurate impacts on the livelihoods and human wellbeing.
EnergyAdequate Supply to demand (EI1)About 40% of the global population relies on traditional use of biomass for cooking and heating their houses. This is both directly and indirectly linked with environmental disturbances. [39,44,45,46,47,48,49,50]
Physical Availability (EI2)Today’s lack of physical availability of energy, simultaneously affects environmental quality and growth of socio-economic activity.
Food Availability (FI1)Refers to the physical existence of food, whether from the household’s own farm, garden production, and/or from domestic and international markets.[52,53,54]
Access (FI2)Refers to the resources an individual has at hand to obtain appropriate foods for a nutritious diet.
Utilization(FI3)Refers to the actual food that is consumed by individuals; how it is stored, prepared, and consumed.In addition, what nutritional benefits the individual drives from consumption.
Stability(FI4)Refers to the temporal dimension, or time-frame of food security.
Table 4. Normalized pairwise comparison, Consistence ratio and composite index for LWEF nexus resources in the study area.
Indicators LI1LI2LI3WI1WI2WI3EI1EI2FI1FI2FI3FI4Indices
LI10.040.020.020.030.060.050.030.040.030.080.050.060.042
LI20.130.050.030.030.060.040.030.040.030.080.050.040.050
LI30.130.100.060.030.060.050.130.040.030.080.030.060.066
WI10.080.100.120.070.060.050.030.020.130.080.030.060.069
WI20.040.050.030.030.030.020.020.020.020.050.050.130.041
WI30.170.200.180.210.190.140.130.220.190.080.050.040.149
EI10.080.100.060.070.130.070.060.040.030.080.050.060.069
EI20.080.050.120.070.130.050.130.070.030.080.030.060.075
FI10.040.050.060.030.090.050.060.070.060.080.030.060.058
FI20.080.100.060.070.090.140.060.150.130.150.090.030.096
FI30.080.050.180.210.060.280.130.220.190.050.090.250.150
FI40.040.150.060.140.030.070.190.070.130.150.460.130.135
∑ = 1
CR = 0.056
Composite LWEF nexus index = 0.083
Table 5. Community-based livelihood indicators weight and rank in relation to LWEF nexus.
Main Livelihoods ComponentSub-IndicatorsAverage Weight of IndicatorsRank
SocialSocial interaction 0.1763
Knowledge sharing0.1224
Community wellbeing0.2442
Income generation0.1305
Perceived benefits0.0796
Community acceptances0.2501
HumanHealth0.3001
Labor productivity0.2452
Level of education0.2143
Access to information0.1314
Use of traditional knowledge0.1095
PhysicalNatural resources mg’t0.1703
Ecosystem conservation0.2232
Community wellbeing 0.4521
Human intervention on Env’t0.1554
FinancialOrganization & institutions0.2552
Market availability0.2303
Infrastructure0.2871
Financial services0.2284
NaturalHuman intervention on Env’t0.0674
Area of crop production 0.3072
Water and aquatic resource0.3191
Tree and forest products0.3063
Table 6. Correlation matrix for the composite weight of LWEF nexus and Livelihood indicators.
SLILIFLIFINLIWIPLIHLIEI
SLI1
LI0.8418 **1
FLI0.06250.1457 *1
FI0.3200 *0.3880 *0.1427 *1
NLI0.6522 *0.6185 **0.05140.3935 *1
WI0.3346 *0.3454 *0.03630.4384 **0.3961 *1
PLI0.3018 *0.4399 **0.1261 *0.7026 **0.3364 *0.3802 *1
HLI0.0952 *0.1740 *0.1915 *0.2971 *0.07550.934 **0.1801 *1
EI0.3081 *0.3744 *0.1362 *0.9840 *0.3834 *0.4403 *0.6950 **0.4321
SLI = social livelihood indicator, LI = land indicator, FLI = financial livelihood indicator, FI = food indicator, NLI = natural livelihood indicators, WI = water indicator, PLI = physical livelihood indicators, HLI = human livelihood indicator, EI = energy indicator. ** and *, significant at 0.01 and 0.05 respectively.
Table 7. Statistical analysis and testing of livelihood indicators with respect to LWEF nexus.
Main
Livelihoods
Indicators
Nexus Resources
LandWaterEnergy Food
Social0.8175 **
(0.2834)
0.5463
(0.02676)
−0.0635
(0.02549)
0.0114 *
(0.2538)
Human0.06873
(0.03604)
−0.0909 *
(0.03405)
−0.1572
(0.3243)
0.5534 *
(0.3223)
Physical0.1391 **
(0.02718)
0.0317
(0.0325)
0.1896
(0.2445)
−0.6042 *
(0.2430)
Financial0.0969 *
(0.0436)
−0.0433
(0.0411)
−0.1335
(0.3923)
0.3073
(0.3899)
Natural0.3523 **
(0.0277)
0.1047 **
(0.0262)
−0.0579
(0.2497)
0.2028
(0.2482)
Constants6.3296 *
(2.7217)
12.939 **
(3.4625)
−0.9016
(2.6109)
13.369 **
(4.1992)
** and *, implies significant at 0.01 and 0.05.
Table 8. Sensitivity estimation of LWEF nexus to livelihood components.
LivelihoodsNexus Resources
LandWaterFoodEnergy
Social component0.7050.7990.8910.794
Human component0.7780.6960.7810.698
Financial component0.6730.6910.7760.683
Physical component0.6780.6960.7510.688
Natural component0.6370.6560.6920.648
Publisher’s Note: MDPI stays neutral with regard to jurisdictional claims in published maps and institutional affiliations.

