Article

The Diffusion Behavior of CO2 Adsorption from a CO2/N2 Gas Mixture on Zeolite 5A in a Fixed-Bed Column

by
Arunaporn Boonchuay
1 and
Patcharin Worathanakul
1,2,*
1
Department of Chemical Engineering, Faculty of Engineering, King Mongkut’s University of Technology North Bangkok, 1518 Pracharat I Road, Wongsawang, Bangsue, Bangkok 10800, Thailand
2
Center of Eco-Materials and Cleaner Technology (CECT), Science and Technology Research Institute, King Mongkut’s University of Technology North Bangkok, 1518 Pracharat I Road, Wongsawang, Bangsue, Bangkok 10800, Thailand
*
Author to whom correspondence should be addressed.
Atmosphere 2022, 13(4), 513; https://doi.org/10.3390/atmos13040513
Submission received: 2 March 2022 / Revised: 20 March 2022 / Accepted: 21 March 2022 / Published: 23 March 2022
(This article belongs to the Special Issue Advanced Functional Materials for Air Quality Management)

Abstract

:
The objective of this research was to investigate the behavior and conditions for CO2 adsorption using a mixture of CO2/N2 over a fixed-bed column of zeolite 5A. The study was performed with a variation in gas composition of CO2/N2 as a 20/80, 50/50, and 80/20 volume %, the adsorption temperatures as 298, 333, and 373 K and the total feed flow rates as 1, 2, and 4 L/h under 100 kPa pressure. The Bohart–Adams, Yoon–Nelson, and Thomas models were used to predict the breakthrough behavior of CO2 adsorption in a fixed column. Furthermore, the adsorption mechanism has been investigated using the kinetics adsorption of pseudo-first-order, pseudo-second-order, Boyd model, and intraparticle model. Increasing the CO2 composition of a gas mixture resulted in a high CO2 adsorption capacity because of the high partial pressure of CO2. The capacity of CO2 adsorption was decreased with increasing temperature because of physical adsorption with an exothermic reaction. The CO2 adsorption capacity was also decreased with increasing feed flow rates with inadequate time for CO2 adsorbates diffusion into the pores of the adsorbent before exiting the packed bed. The CO2 adsorption by zeolite 5A confirmed that the physical adsorption with intraparticle diffusion was the rate-controlling step of the whole process.

1. Introduction

Environmental pollution is the addition of substances, such as solids, liquids, and gases, to the environment in a hazardous form. The three major types of pollution classified by the environment are air pollution, water pollution, and land pollution. Currently, disposal and air pollution are significant issues in all areas of the world because of the effect of rapid technological change, as well as emissions from industry and power plants that burn fossil fuels [1,2]. The emitted air pollution is known as greenhouse gases including carbon dioxide (CO2), methane (CH4), nitrous oxide (N2O), chlorofluorocarbon (CFCs), hydrofluorocarbons (HFCs), perfluorocarbons (PFCs) and sulfur hexafluoride (SF6). Among all of them, CO2 is regarded as the major greenhouse gas, contributing more than 87 percent of greenhouse gas emissions, and rapidly increasing global warming and climate change [3,4,5]. There are many significant CO2 sources with high CO2 contributions that need to reduce CO2 from their processes, such as landfill gas (LFG), biogas, natural gas, syngas as pre-combustion, and flue gas [6,7].
Flue gas is the gas released from a combustion plant, which usually has a composition consisting mostly of N2, CO, and CO2 [8,9]. To capture the CO2 from flue gas, the composition of gases in flue gas and the characteristic for each gas in a gaseous mixture was identified to find the method for separation. In 2020, CO2 was likely to decrease since most people have lived through lockdowns, whereby many made the abrupt shift to working from home and barely used transportation, and the production capacity was disrupted due to the COVID-19 pandemic. Nevertheless, when the situation is over the economy would be expected to be completely recovered. Despite CO2 decreasing due to COVID-19 pandemic, the global surface temperature and climate change are likely to rise steadily. Nowadays, CO2 removal could be achieved by applying a variety of technologies of physical and chemical processes, for instance, cryogenic distillation and membrane separation, to reduce CO2 emissions [10,11,12]. However, the cryogenic membranes and solvent adsorption still have disadvantages such as corrosion, high costs, and high energy consumption [5]. Therefore, adsorption using solids is regarded as one of the most promising processes for CO2 reduction. It has been widely used in CO2 reduction technologies due to low-cost processes, low energy consumption, and being able to regenerate [13].
Porous adsorbents are the group of materials that support solid adsorption processes because of the small porosity within the structure, high surface area, and high pore volume [14]. There are many types of solid adsorbents used in the adsorption process, depending on the gas type that needs to be adsorbed or separated. Zeolite 5A is one of the solid adsorbents with a cubic lattice of sodalite form which has been used in various adsorption and separation processes. The 0.42 nm free aperture of the pores allows passage of molecules of gas adsorbates, which have a kinetic diameter less than 0.49 nm [15,16]. Zeolite 5A has a high potential to adsorb CO2 molecular gas due to the interaction between cations positioned in zeolite 5A and the quadrupole moment of CO2. In previous research, many adsorption and separation processes of pure and binary gas adsorption were studied on zeolite 5A. Mofarahi and Gholipour [13] used zeolite 5A to increase the efficiency of CO2/CH4 separation using a volumetric method with the conditions of 273–343 K and 1000 kPa. Zeolite 5A was successfully applied in CO2/CH4 separation. Nam et al. [17] studied the equilibrium isotherm of CH4, C2H6, C2H4, N2, and H2 on zeolite 5A at 293–313 K with the pressure ranging from 0 to 2000 kPa using Pressure Swing Adsorption (PSA). Zeolite 5A could adsorb the maximum CO2 at 293 K with a low isosteric heat of adsorption.
Furthermore, several previous studies have reported the use of zeolite 5A to investigate the conditions for CO2/N2 adsorption. Mendes and his co-researchers used pressure swing adsorption (PSA) to separate CO2/N2 on binderless zeolite 5A at temperatures ranging from 305 to 368 K and pressures up to 50 kPa at a pilot scale [18]. The binderless zeolite 5A could separate CO2 from N2 using the PSA process with good purity, recovery, and productivity parameters. Lui and his co-researchers investigated the conditions for CO2/N2 adsorption and desorption via the PSA process using zeolite 5A as an adsorbent [19]. Zeolite 5A was significantly more selective for CO2 loading than N2 at 303 K, with a CO2 recovery of 91.0 percent, and a purity of 53.9 percent. Although many studies have investigated the use of zeolite 5A for CO2/N2 adsorption, they only evaluated the pressure and temperature factors to enhance CO2 adsorption capacities. The effect of other factors on CO2/N2 adsorption, such as the effect of CO2/N2 composition and feed flow rate have not previously been studied. Moreover, there are still not enough reports on CO2 adsorption behavior with a solid adsorbent to provide the efficiency of adsorbent and adsorption column. The design of adsorption is useful for high efficiency of the adsorption process in large-scale processes.
Therefore, this research aimed to study the factors that affect CO2 adsorption from a CO2/N2 gas mixture including the CO2/N2 composition, temperature, and total feed flow rate. The breakthrough curve and kinetic models were also carried out to investigate the CO2 adsorption behavior in a fixed-bed column.

2. Materials and Methods

2.1. Materials

In this study, a CO2/N2 gas mixture was obtained by combining CO2 (99.99%) and N2 (99.95%) in three different ratios, as 20/80, 50/50, and 80/20 %vol of a CO2/N2 gas mixture, as shown in Figure 1. The commercial molecular sieve zeolite 5A (CaA) powder was used in this work to investigate the efficiency of gas adsorption. The zeolite 5A was heated at 378 K for an hour to remove moisture.

2.2. Experimental Methods

The CO2/N2 Gas Mixture Adsorption Measurements

The amount of CO2 inlet was measured by feeding a mixture of CO2 and N2 gas into the reactor at various ratios of 20/80, 50/50, and 80/20 %vol of a CO2/N2 gas mixture. Without adsorbent, the total flow rate was adjusted to 2 L/h at 298 K under 100 kPa of pressure, as shown in Figure 1. The renewable zeolite 5A was packed into the reactor tube at the same weight among all adsorption conditions. Following that, a CO2/N2 gas mixture in various ratios was fed into the reactor. The amount of CO2 concentration was measured every 15 s for 1 h, and the amount of CO2 adsorption was calculated using Equation (1) [20].
q t = C 0 C W × 1 M w
where C0 is initial concentration of CO2 (mg/L), C is outlet concentration of CO2 (mg/L), qt is CO2 adsorption capacity (mmol/g), w is amount of adsorbent (g) and Mw is molar mass of CO2.
The ratio of CO2/N2 at 20/80 %vol was firstly carried out to investigate the effects of temperature and flow rate on CO2 adsorption. The temperatures used were 298, 333, and 373 K, and the total feed flow rates were 1, 2, and 4 L/h. Each experiment condition was labeled with a symbol of CO2 %vol as C, N2 %vol as N, temperature as T, and total feed flow rate as F, as shown in Table 1.

2.3. Characterization

The surface area, pore volume, pore size, and N2 adsorption–desorption isotherms of zeolite 5A were measured before and after adsorption using the Brunauer, Emmett, and Teller (BET) method at 77 K. (BET, Micromeritics, 3Flex Surface characterization, Norcross, GA, USA). The micropore volume and external surface area were calculated using the t-plot method. The external surface area was evaluated using the BET surface area method. In addition, the micropore surface area was calculated by subtracting the external surface area from the BET surface area.

2.4. Theoretical Model

2.4.1. Fixed-Bed Experiment and Mathematical Models

Several gas flow phenomena appear in the fixed-bed adsorption column, which are based on the assumptions of axial dispersion, external resistance of film, intraparticle diffusion, and nonlinear isotherm [21]. To evaluate the performance of a fixed-bed column and the efficiency of adsorbent, it is necessary to investigate the optimization of mathematical models for designing the CO2 adsorption process in a large-scale column. In this study, the model of Bohart–Adams, Yoon–Nelson, and Thomas were used to investigate the CO2 breakthrough curve under the assumptions of (i) ideal gas, (ii) isothermal condition across the bed, and (iii) negligible N2 adsorption compared to CO2.
The Bohart–Adams model [22] is used to predict the parameters of the fixed-bed column. This model is commonly used to describe the first part of the breakthrough curve, which is based on the adsorption and depends upon the concentration of adsorbate species and the residual capacity of adsorption. The linear equation of Bohart–Adams is expressed in Equation (2).
l n C t C 0 = k B A C 0 t k B A N 0 Z F
where C0 is the influent adsorbate concentration (mg/L), Ct is the adsorbate concentration at time (mg/L), kBA is the kinetic rate constant of the Bohart–Adams model (L/mg. min), t is time (min), N0 is the saturate concentration (mg/L), Z is the bed height of column (cm), and F is the linear velocity calculated by dividing flow rate by the column section area (cm2/min).
The Yoon–Nelson model [23] is generally used to describe the breakthrough curve, which can predict the entire adsorption process in a fixed- bed column. This model assumes that a decreasing adsorption rate is proportional to adsorbate adsorption and breakthrough of the adsorbent. The linear equation of the Yoon–Nelson model is expressed in Equation (3).
l n C t C 0 C t = k Y N t τ k Y N
where C0 is the influent adsorbate concentration (mg/L), Ct is the adsorbate concentration at time (mg/L), kYN is the kinetic rate constant of the Yoon–Nelson model (min−1), t is time (min), τ is the time required for 50% adsorbate breakthrough (min).
The Thomas model [24] is the most widely used to describe the fixed-bed adsorption column. This model is based on Langmuir kinetics assumptions, which are described by a pseudo-second-order reaction, and the external resistance during the mass transfer process is negligible. The linear equation for the Thomas model is expressed in Equation (4).
l n C 0 C t 1 = k T H q T H m Q k T H C 0 t
where C0 is the influent adsorbate concentration (mg/L), Ct is the adsorbate concentration at time (mg/L), kTH is the Thomas rate constant (L/min.mg), qTH is the equilibrium adsorbate uptake in the adsorbent (mg/g), Q is the flow rate (mL/min), t is time (min), and m is the mass of adsorbent (g).

2.4.2. Adsorption Kinetics

The adsorption kinetics in this work were determined by pseudo-first-order (PFO) and pseudo-second-order (PSO) models. The PFO model was used to describe the adsorption kinetics of physical adsorption in which the adsorbate attaches to the surface of the adsorbent through diffusion. It refers to the adsorption rate as determined by diffusion. It is expressed in Equation (5) by the Lagergren [25].
l n   q e q t = l n   q e k 1 t
where qe and qt are the amount of CO2 adsorbed (mmol/g) at equilibrium and at any time, respectively, and k1 is the ratio constant of the PFO model.
The chemical adsorption between adsorbate and adsorbent was described using the PSO model. It could be expressed using the equation of Ho and Mackey [26], as shown in Equation (6).
t q t = 1 k 2 q e 2 + t q e
where k2 is the ratio constant of the PSO model.

2.4.3. Diffusional Mass Transfer Models

CO2 adsorption on a solid adsorbent is typically affected by external film diffusion, intraparticle diffusion, or both, which acts as the rate-limiting step throughout the entire CO2 adsorption process [27,28]. In general, gas adsorption on solid adsorbents involves four major steps: bulk diffusion, external film diffusion, intraparticle diffusion, and surface adsorption [28,29]. The previous studies have only considered the external film diffusion and intraparticle diffusion. Because of the rapid adsorption kinetics of bulk diffusion and surface adsorption, steps are always negligible compared to both external film diffusion and intraparticle diffusion, which are slower [26,29,30,31]. The adsorption rate adsorbed on a solid adsorbent is mainly controlled by external film diffusion and intraparticle diffusion. These two processes are described by the intraparticle diffusion model and the Boyd model as shown in Equations (7) and (8), respectively.
q = k i t 0.5
l n 1 F = k f t
where F is the ratio of CO2 adsorbed at equilibrium and at time ( q t q e ). ki and kf are the kinetic constant of the intraparticle diffusion model and the Boyd model, respectively.

3. Results

3.1. Effect of CO2 Composition in a CO2/N2 Gas Mixture for CO2 Adsorption

The effect of CO2 composition on the CO2 adsorption breakthrough curve, which was studied by changing the N2 composition in the feed flow rate based on a constant total feed flow rate of 2 L/h at 298 K under 100 kPa of pressure. By changing the N2 flow rate, the CO2 composition was increased from 20 %vol to 80 %vol as shown, with gas ratios of 20/80, 50/50, and 80/20 %vol of the CO2/N2 gas mixture. The CO2 adsorption breakthrough curves were shown in Figure 2a; the breakthrough times decrease and reach saturation quickly when the CO2 composition of gas mixture was increased from 20 to 80 %vol. In addition, Figure 2b indicated that the CO2 adsorption capacity increases from 6.42 to 7.24 mmol/g when the compositions of CO2 in the gas mixture increased from 20 to 80 %vol.

3.2. Effect of Temperature on CO2 Adsorption

In the flue gas industry, the partial pressure of CO2 is typically quite low, with a composition of approximately 20 %vol. Therefore, a CO2/N2 gas mixture composition with 20/80 %vol was used to further investigate the effect of temperature on CO2 adsorption.
The effect of temperatures on the breakthrough curve of CO2 adsorption were studied at a constant CO2/N2 composition of 20/80 %vol onto zeolite 5A with a feed flow rate of 2 L/h. Increasing the temperature of adsorption, the breakthrough time of CO2 adsorption significantly decreased and became steeper, as shown in Figure 3a. These results exhibited the highest CO2 adsorption capacity of 6.43 mmol/g at the lowest temperature of 298 K, as presented in Figure 3b.

3.3. Effect of Feed Flow Rate on CO2 Adsorption

The constant composition of the CO2/N2 gas mixture at 20/80%vol and constant temperature at 298 K was used to study the effect of feed flow rates as 1, 2, and 4 L/h.
Figure 4a represents the effect of feed flow rates (1, 2, and 4 L/h) on the CO2 adsorption breakthrough curve. As the feed flow rate increases, the breakthrough time and exhaust time becomes significantly shorter and the breakthrough curve profile steeper. The highest CO2 adsorption capacity of 7.42 mmol/g was found at 1 L/h, which was the lowest feed flow rate, as shown in Figure 4b.
Furthermore, when the total feed flow rate was increased from 1 to 4 L/h, the BET surface area and micropore surface area of zeolite 5A decreased, as listed in Table 2. This is due to the fact that the performance of CO2 diffusion into the micropore surface area of zeolite 5A is poor at a high total feed flow rate.

3.4. Adsorption Breakthrough Curve Models Study for a Fixed-Bed Column

The breakthrough curve models of Bohart–Adams, Yoon–Nelson, and Thomas were obtained to study the fixed-bed adsorption column and predict the dynamic nature of the column. Figure 5 indicates the experimental data models of CO2 adsorption at 20/80 %vol of CO2/N2 gas mixture under the different operating conditions. The breakthrough profiles of the Yoon–Nelson model fits the experimental data better than the other models, with high correlation coefficients close to 1, as shown in Table 3. The poor regression coefficients of the Bohart–Adams and Thomas models indicates that neither model is adequate for studying the CO2 adsorption process in a fixed-bed column. According to the good experimental data, fitting with the Yoon–Nelson model, the value of the Yoon–Nelson kinetic rate constant increases with increasing temperature and feed flow rate, affected by decreasing the adsorption capacity.

3.5. Adsorption Kinetics Study

The adsorption kinetics study was analyzed using PFO and PSO models of Equations (5) and (6), respectively. The CO2 adsorption experimental data with the PFO and PSO models, with a constant CO2/N2 composition at 20/80 %vol at different temperatures and feed flow rates, are shown in Figure 6. The PFO model perfectly fits the experimental data of CO2 adsorption from a CO2/N2 gas mixture with zeolite 5A better than PSO model with high correlation coefficient (R2 > 0.97), as listed in Table 4. The high correlation coefficient (R2 > 0.97) of the PFO model indicates that it could describe the worthy reaction mechanism of CO2 adsorption from a CO2/N2 gas mixture. In all cases of adsorption conditions (Table 4), the calculated CO2 adsorption capacities decreased when temperature and feed flow rate were increased. This is typical of exothermic adsorption which happens to the physical adsorption process [13]. Corresponding to the hypothesis of the PFO model, physical adsorption is the process in which adsorbate attaches to the surface of an adsorbent and is controlled by diffusion [25].

3.6. Adsorption Diffusion Study

In general, the adsorption kinetic models can describe only the rate retention or release of solute from an adsorbates bulk-phase to the solid adsorbent interface. This means the PFO and PSO models could not provide the contribution of the rate-controlling steps associated with adsorption kinetics on the adsorbent. Therefore, it is necessary to investigate the diffusion steps of adsorption.
According to the diffusion-controlled physical adsorption, the intraparticle diffusion model from Equation (7) was used to investigate the diffusion steps of 20/80 %vol of a CO2/N2 gas mixture at different temperatures and different feed flow rates, as shown in Figure 7. It depicts that the CO2 adsorption from a CO2/N2 gas mixture is multilinear, influenced by more than one diffusion processes, which is represented by three multilinear sections. The three multilinear sections indicate three main diffusion steps of external film diffusion, intraparticle diffusion, and the surface adsorption at equilibrium.
Normally, external film diffusion and intraparticle diffusion can occur concurrently in the initial step of adsorption. As a result, the initial step of adsorption was examined to determine the controlling step using the Boyd model from Equation (8), as shown in Figure 8. The Boyd plots indicates that the plots are not linear at different temperatures and feed flow rates.
According to the several adsorption steps observed in the whole process of CO2 adsorption, it is necessary to investigate a diffusion-limiting step of the whole adsorption process. The kinetics constant of intraparticle diffusion (ki) is obtained from the slope of the multilinear plots of intraparticle diffusion, as shown in Table 5. The kinetics constant (ki,2) during the second step of adsorption is the highest value when compared to the other steps of diffusion. Therefore, there was a longer contact time between the adsorbate and adsorbent for diffusion than at the other step. Furthermore, the ratios of time required for three linear sections are listed in Table 6. They indicate that the ratio of time taken for film diffusion to intraparticle diffusion is less than 1 at all adsorption conditions.

4. Discussion

4.1. Effect of CO2 Composition in CO2/N2 Gas Mixture for CO2 Adsorption

The partial pressure of CO2 increased as the CO2 composition on the gas feed increased [32]. In fact, increasing the CO2 composition in a gas mixture results in a higher concentration gradient between the bulk phase and solid phase which affects the high mass transfer zone [33]. As a result, CO2 adsorption was improved and reached saturation quickly at high CO2 composition with high adsorption capacity.
Even though the CO2/N2 gas mixture contains N2 gas molecules which have the same adsorption properties as CO2 on zeolite 5A, it has no effect on CO2 adsorption. This correlates to CO2 having a greater quadrupole moment (4.30 × 1026 ESU/cm2) and polarizability, (26.5 × 1025 cm3) than N2 (1.52 × 1026 ESU/cm2 quadrupole moment and 17.6 × 1025 cm3 polarizability) [34]. This means that CO2 has a stronger interaction with the surface of zeolite 5A than N2 [19,35]. Therefore, increasing the CO2 composition in a gas mixture contributes to a stronger interaction between CO2 and the surface of zeolite 5A that results in a high CO2 adsorption capacity. Corresponding to the studies of Mofarahi et al. [13] and Mulgundmath et al. [36], CO2 could be adsorbed onto zeolite better than N2 and CH4 due to its greater quadrupole moment and polarizability.

4.2. Effect of Temperature on CO2 Adsorption

At a high adsorption temperature, the CO2 adsorption capacity decreased because of the exothermic reaction of a physical adsorption process [37,38,39]. The physical adsorption is caused by the attachment of adsorbate to adsorbent surface walls by Van der Waals forces, which is a well-known exothermic reaction with a low heat of adsorption and no reaction between adsorbate and adsorbent [13,37,40,41].
Furthermore, the molecular motion kinetics of gas adsorbates have become more dynamic, resulting in faster diffusion through the adsorbent surface at high temperatures [42]. The faster adsorbate diffusion as temperature rises has resulted in a weaker interaction between adsorbate and adsorbent, resulting in a low adsorption capacity. Corresponding to the studies of Mendes et al. [18] they compared physical and chemical adsorption of solid adsorbents to separate CO2 from a gas mixture using temperature swing adsorption. The low temperature had a significant effect on the high CO2 adsorption capacity of zeolite 5A.

4.3. Effect of Feed Flow Rate on CO2 Adsorption

A higher feed flow rate acts to increase the degree of gas turbulence flow, which contributes to the faster breakthrough time caused by the lower mass transfer zone in the fixed-bed column [41,43,44,45]. In contrast, lower feed flow rates result in a slower transport of CO2 gas adsorbate, which increases the breakthrough time and requires more adsorbate to satisfy the high adsorption capacity [42,46]. Moreover, the results of decreasing CO2 adsorption are due to the lack of diffusion time for adsorbates into the pores of adsorbent before leaving the packed bed. Corresponding to the studies of Tobarameekul and her colleagues [47] the diffusion time of CO2 with a flow rate of 1 L/h was longer than at 5 L/h which led to an enhanced CO2 adsorption capacity.

4.4. Adsorption Breakthrough Curve Models Study for Fixed-Bed Column

The studies of Bohart–Adams and Thomas models on CO2 adsorption over fixed-bed columns indicated that neither model was adequate for studying the CO2 adsorption process in a fixed-bed column. This is because the Bohart–Adams model can only represent the initial stage of adsorption and it is only applicable to irreversible adsorption processes. This reason corresponds to the assumption of the Thomas model, which is used to describe the chemical adsorption process, whereas CO2 adsorption on zeolite 5A is the physical adsorption that can reverse the process [48].
The value of the Yoon–Nelson kinetic rate constant increased with increasing temperature and feed flow rate was affected by decreasing the adsorption capacity. The results are consistent with the assumption of the Yoon–Nelson model, that describes the assumption monolayer, as decreasing the adsorption rate is proportional to increasing adsorbate on the adsorbent surface area [23]. Consequently, the Yoon–Nelson model is the suitable model for describing the behavior of CO2 adsorption in a fixed-bed column.

4.5. Adsorption Kinetics and Diffusion Models Study

The PFO model perfectly demonstrated that CO2 adsorption from a CO2/N2 gas mixture onto zeolite 5A was a physical adsorption process, in which the adsorbate attached to the surface of adsorbent and was controlled by diffusion [25]. The physical adsorption process is literally an exothermic reaction which has a low adsorption capacity at high temperatures and a high feed flow rate because of its weak interaction between adsorbate and adsorbent [37,38,39]. Corresponding to the studies of Gabruś et al. [49], the CO2 adsorption capacity, calculated using the PFO model, decreased when temperature increased.
According to the intraparticle diffusion model, it indicated that CO2 adsorption from a CO2/N2 gas mixture has three main steps of diffusion including the film diffusion, intraparticle diffusion, and the surface adsorption at equilibrium [50].
In part of the rate-controlling step, the kinetics constant (ki,2) during the second step of adsorption was the highest value and it represented that the second step of diffusion has significantly affected the high CO2 adsorption capacity. Moreover, the ratios of time required for the three linear sections indicated that intraparticle diffusion was the rate-limiting step for the overall CO2 adsorption process on zeolite 5A, since the ratio of time taken for film diffusion to intraparticle diffusion was less than 1 [51]. This is due to the large specific surface area of the adsorbent pores resulting in a longer contact time between adsorbate and adsorbent in the second step of diffusion, compared with the other steps [52,53,54]. Therefore, the intraparticle diffusion step is the adsorption limiting step of CO2 adsorption from a CO2/N2 gas mixture on 5A zeolite.
In terms of the results, the mechanism of CO2 adsorption for all processes from a CO2/N2 gas mixture onto zeolite 5A are illustrated by Figure 9. This indicates that the CO2/N2 gas mixture is fed into a packed bed reactor using zeolite 5A as an adsorbent. Then CO2 and N2 gases can diffuse through the zeolite 5A sorbent layer. The CO2 molecules could be adsorbed more than the N2 molecules due to the greater quadrupole moment of CO2 to interact with the cations in zeolite 5A. CO2 molecules can diffuse from the bulk phase to film diffusion and afterword go through intraparticle diffusion to the adsorbent pore before reaching the adsorption equilibrium.

5. Conclusions

Zeolite 5A has been used to study the conditions for CO2 adsorption from a CO2/N2 gas mixture and investigate the behavior of CO2 adsorption in a fixed-bed column. The following conclusions have been drawn:
(1)
At higher CO2 compositions, a CO2/N2 gas mixture resulted in an increase in CO2 adsorption capacities. Improving the partial pressure of CO2 and mass transfer played a significant role in the rapid adsorption of CO2 onto zeolite 5A.
(2)
The CO2 adsorption process onto zeolite 5A is an exothermic reaction based on the physical adsorption influenced by Van der Waals forces, because the adsorption capacities are low at high temperature, which results in greater gas kinetics.
(3)
The CO2 adsorption capacity decreased when the feed flow rates increased because the contact time between adsorbate and adsorbent in a fixed-bed column decreased, thereby improving mass transfer, which was greatly influenced by the shallower adsorption zone.
(4)
The Yoon–Nelson model is an excellent model to describe the behavior of CO2 adsorption in a fixed-bed column. The high temperature and high feed flow rate increase the value of the Yoon–Nelson kinetic rate constant, which results in low adsorption capacities.
(5)
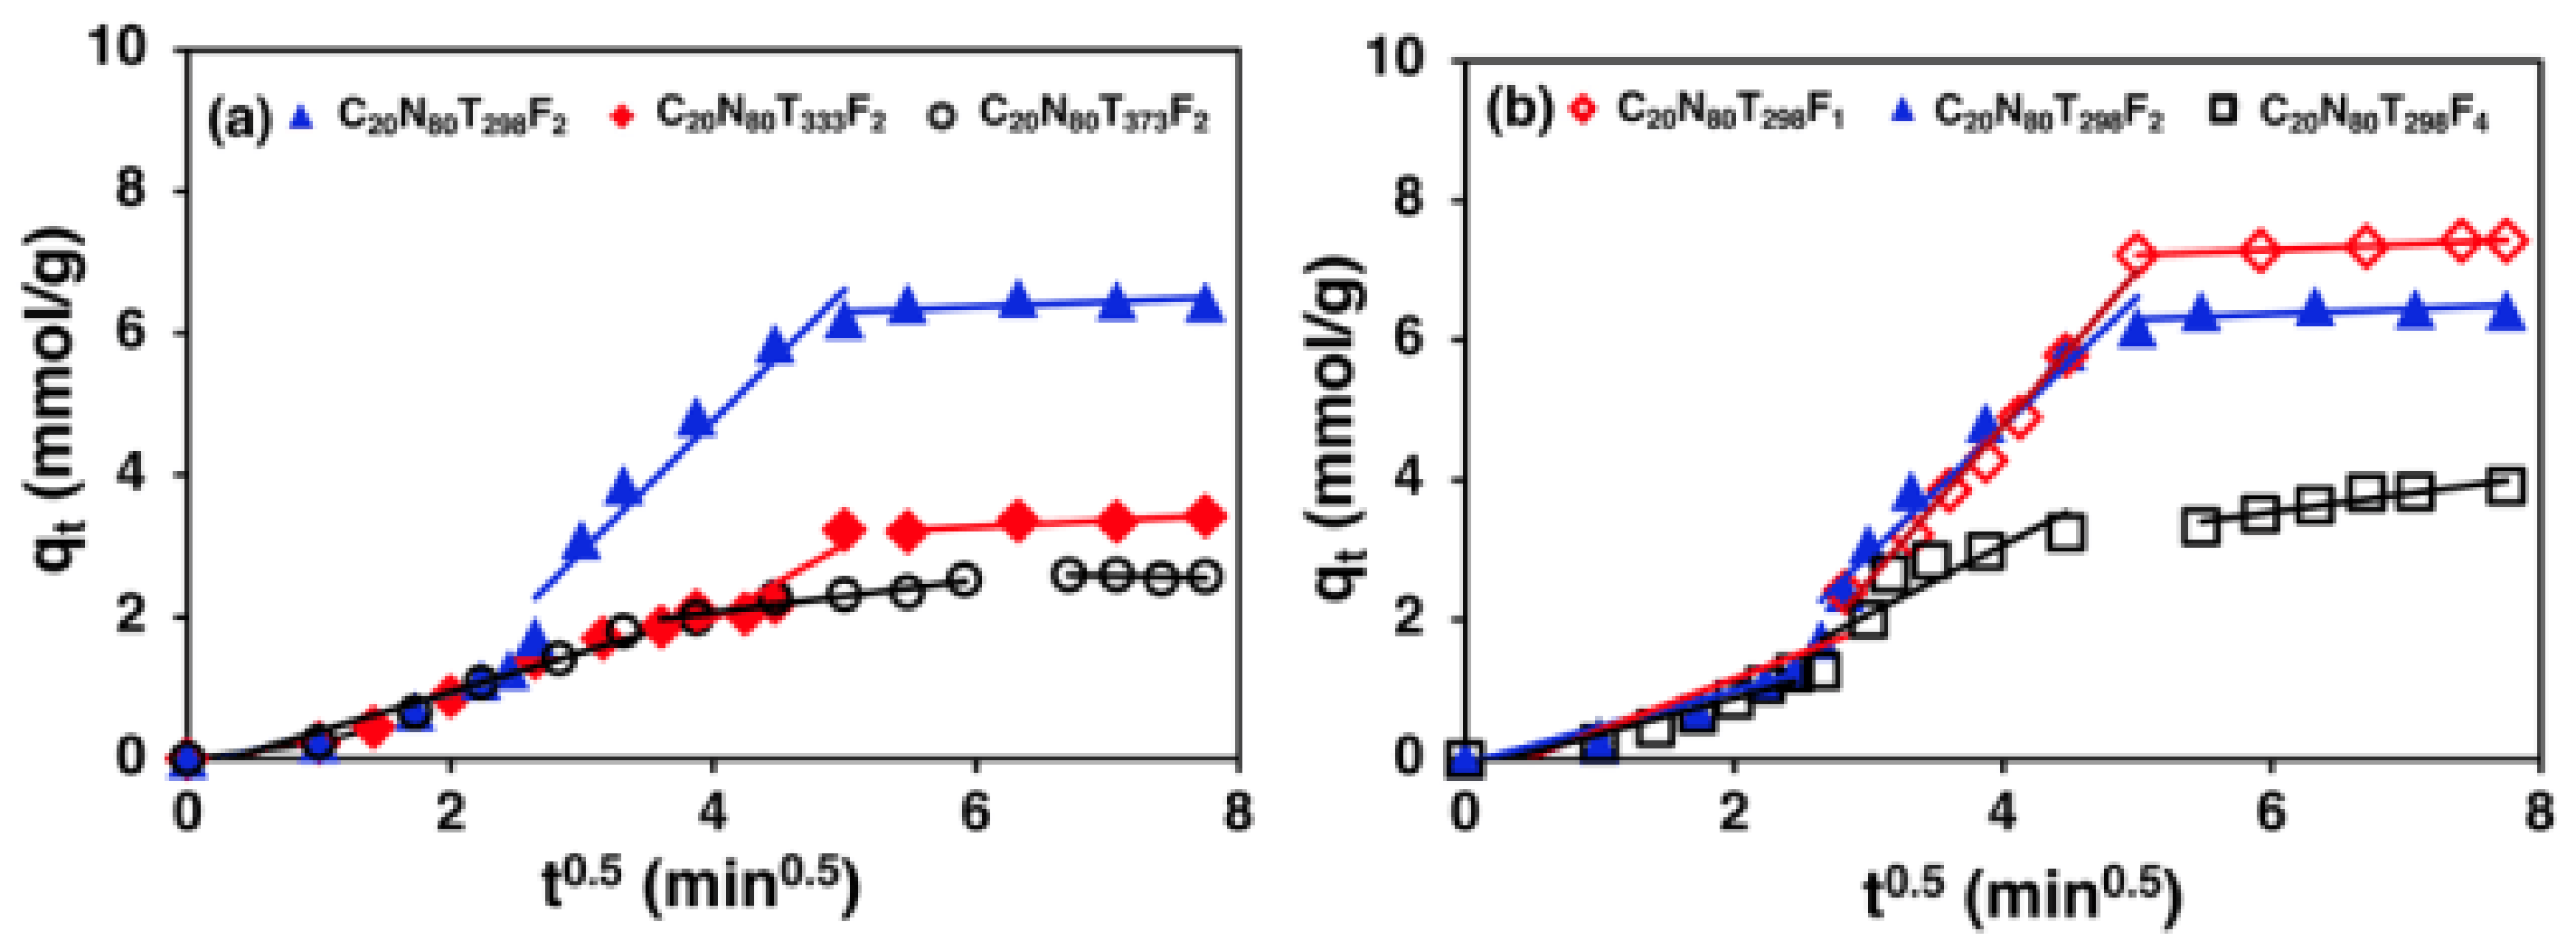
The CO2 adsorption from a CO2/N2 gas mixture using zeolite 5A over a fixed-bed column can be described using a PFO model because it is a physical adsorption process controlled by diffusion. In addition, the CO2 adsorption process in a fixed-bed column involves more than one diffusion step, including film diffusion, intraparticle diffusion and adsorption on adsorbent surface. The intraparticle diffusion was observed to be the rate-limiting step controlling the CO2 adsorption process on zeolite 5A in a fixed-bed column.

Author Contributions

Writing—Original draft preparation, A.B.; writing—Review and editing, P.W. All authors have read and agreed to the published version of the manuscript.

Funding

This research was funded by the Faculty of Engineering, King Mongkut’s University of Technology North Bangkok (KMUTNB), grant number ENG-62-62.

Institutional Review Board Statement

Not applicable.

Informed Consent Statement

Not applicable.

Data Availability Statement

This study did not report any data.

Acknowledgments

We would like to thank the Graduate College at King Mongkut’s University of Technology North Bangkok for supporting this research.

Conflicts of Interest

The authors declare no conflict of interest.

References

  1. Papaolias, G.; Mavroidis, I. Atmospheric emissions from oil and gas extraction and production in Greece. Atmosphere 2017, 9, 152. [Google Scholar] [CrossRef] [Green Version]
  2. Hu, Y.; Shi, Y. Estimating CO2 emission from large scale coal-fired power plants using OCO-2 observations and emission inventories. Atmosphere 2021, 12, 811. [Google Scholar] [CrossRef]
  3. Patiño, L.I.; Padilla, E.; Alcántara, V.; Raymond, J.L. The relationship of energy and CO2 emissions with GDP per capita in Colombia. Atmosphere 2020, 11, 778. [Google Scholar] [CrossRef]
  4. Zarifi, M.H.; Shariaty, P.; Hashisho, Z.; Daneshmand, M. A non-contract microwave sensor for monitoring the interaction of zeolite 13X with CO2 and CH4 in gaseous streams. Sens. Actuators B Chem. 2017, 71, 243–247. [Google Scholar]
  5. Abid, H.R.; Rada, Z.H.; Shang, J.; Wang, S. Synthesis, characterization, and CO2 adsorption of three metal-organic frameworks (MOFs): MIL-53, MIL-96, and amino-MIL-53. Polyhedron 2016, 120, 103–111. [Google Scholar] [CrossRef]
  6. Williams, T.C.; Shaddix, C.R.; Schefer, R.W. Effect of Syngas Composition and CO2-Diluted Oxygen on Performance of a Premixed Swirl-Stabilized Combustor. Combust. Sci. Technol. 2007, 180, 64–88. [Google Scholar] [CrossRef]
  7. Rostrup-Nielsen, J.R. Syngas in perspective. Catal. Today 2002, 71, 243–247. [Google Scholar] [CrossRef]
  8. Cavenati, S.; Grande, C.A.; Rodrigues, A.E. Layered Pressure Swing Adsorption for Methane Recovery from CH4/CO2/N2 Streams. Adsorption 2005, 11, 549–554. [Google Scholar] [CrossRef]
  9. Zevenhoven, R.; Kilpinen, P. Control of Pollutants in Flue Gases and Fuel Gases; Helsinki University of Technology: Espoo, Finland, 2001. [Google Scholar]
  10. Artioli, Y.; Jørgensen, S.E.; Fath, B.D. Encyclopedia of Ecology, 1st ed.; Academic Press: Oxford, UK, 2008; pp. 60–65. [Google Scholar]
  11. Bonenfant, D.; Kharoune, M.; Niquette, P.; Mimeault, M.; Hausler, R. Advances in principal factors influencing carbon dioxide adsorption on zeolites. Sci. Technol. Adv. Mater. 2008, 9, 013007. [Google Scholar] [CrossRef]
  12. Siriwardane, R.V.; Shen, M.S.; Fisher, E.P.; Losch, J. Adsorption of CO2 on Zeolites at Moderate Temperatures. Energy Fuels 2005, 19, 1153–1159. [Google Scholar] [CrossRef]
  13. Mofarahi, M.; Gholipour, F. Gas adsorption separation of CO2/CH4 system using zeolite 5A. Microporous Mesoporous Mater. 2014, 200, 1–10. [Google Scholar] [CrossRef]
  14. Lange, R.S.A.; Hekkink, J.H.A.; Keizer, K.; Burggraaf, A.J.; Ma, Y.H. Sorption studies of microporous sol-gel modified ceramic membranes. J. Porous Mater. 1995, 2, 141–149. [Google Scholar] [CrossRef]
  15. Songolzadeh, M.; Soleimani, M.; Ravanchi, M.T.; Songolzadeh, R. Carbon Dioxide Separation from Flue Gases: A Technological Review Emphasizing Reduction in Greenhouse Gas Emissions. Sci. World J. 2014, 2014, 828131. [Google Scholar] [CrossRef] [PubMed] [Green Version]
  16. Yang, H.; Xu, Z.; Fan, M.; Gupta, R.; Slimane, R.B.; Bland, A.E.; Wright, I. Progress in carbon dioxide separation and capture: A review. J. Environ. Sci. 2008, 20, 14–27. [Google Scholar] [CrossRef]
  17. Nam, G.M.; Jeong, B.M.; Kang, S.H.; Lee, B.K.; Choi, D.K. Equilibrium Isotherms of CH4, C2H6, C2H4, N2, and H2 on Zeolite 5A Using a Static Volumetric Method. J. Chem. Eng. Data 2005, 50, 72–76. [Google Scholar] [CrossRef]
  18. Mendes, P.A.P.; Ribeiro, A.M.; Gleichmann, K.; Ferreira, A.F.P.; Rodrigues, A.E. Separation of CO2/N2 on binderless 5A zeolite. J. CO2 Util. 2017, 20, 224–233. [Google Scholar] [CrossRef]
  19. Liu, Z.; Grande, C.A.; Li, P.; Yu, Y.; Rodrigues, A.E. Adsorption and Desorption of Carbon Dioxide and Nitrogen on Zeolite 5A. Sep. Sci. Technol. 2011, 46, 434–451. [Google Scholar] [CrossRef]
  20. Sudani, D.H.A.; Aigbe, U.O.; Ukhurebor, K.E.; Onyancha, R.B.; Kusuma, H.S.; Darmokoesoemo, H.; Osibote, O.A.; Balogun, V.A.; Widyaningrum, B.A. Malachite Green Removed by Activated Potassium Hydroxide Clove Leaf Agrowaste Biosorbent: Characterization, Kinetics, Isotherm, and Thermodynamics Studies. Adsorpt. Sci. Technol. 2021, 2021, 1145312. [Google Scholar]
  21. Patel, H. Fixed-bed column adsorption study: A comprehensive review. Appl. Water Sci. 2019, 9, 45. [Google Scholar] [CrossRef] [Green Version]
  22. Bohart, G.S.; Adams, E.Q. Some aspects of the behavior of charcoal with respect to chlorine. J. Am. Chem. Soc. 1920, 42, 523–544. [Google Scholar] [CrossRef] [Green Version]
  23. Vilvanathan, S.; Shanthakumar, S. Column adsorption studies on nickel and cobalt removal from aqueous solution using native and biochar form of Tectona grandis. Environ. Prog. Sustain. Energy 2017, 36, 1030–1038. [Google Scholar] [CrossRef]
  24. Thomas, H.C. Heterogeneous Ion Exchange in a Flowing System. J. Am. Chem. Soc. 1944, 66, 1664–1667. [Google Scholar] [CrossRef]
  25. Lagergren, S.K. About the Theory of So-called Adsorption of Soluble Substances. K. Sven. Vetensk. Handl. 1989, 24, 1–39. [Google Scholar]
  26. Ho, Y.S.; McKay, G.A. Comparison of Chemisorption Kinetic Models Applied to Pollutant Removal on Various Sorbents. Process Saf. Environ. Prot. 1998, 76, 332–400. [Google Scholar] [CrossRef] [Green Version]
  27. Choy, K.K.H.; Porter, J.F.; Mackey, G. Film-Pore Diffusion Models-Analytical and Numerical Solutions. Chem. Eng. Sci. 2014, 59, 501–512. [Google Scholar] [CrossRef] [Green Version]
  28. Kavand, M.; Asasian, N.; Soleimani, M.; Kaghazchi, T.; Bardestani, R. Film-Pore-[Concentration-Dependent] Surface Diffusion model for heavy metal ions adsorption: Single and multi-component systems. Process Saf. Environ. Prot. 2017, 107, 486–497. [Google Scholar] [CrossRef]
  29. Plazinski, W.; Dziuba, K.; Rudzinski, W. Modeling of Sorption Kinetics: The Pseudo-Second Order Equation and the Sorbate Intraparticle Diffusivity. Adsorption 2013, 19, 1055–1064. [Google Scholar] [CrossRef] [Green Version]
  30. Zhang, Q.; Crittenden, J.; Hristovski, K.; Hand, D.; Westerhoff, P. User-Oriented Batch Reactor Solutions to the Homogeneous Surface Diffusion Model for Different Activated Carbon Dosages. Water Res. 2009, 43, 1859–1866. [Google Scholar] [CrossRef]
  31. Malash, G.F.; El-Khaiary, M.I. Piecewise linear regression: A statistical method for the analysis of experimental adsorption data by the intraparticle-diffusion models. Chem. Eng. J. 2010, 163, 256–263. [Google Scholar] [CrossRef]
  32. Yang, B.; Lui, Y.; Li, M. Separation of CO2-N2 using zeolite NaKA with high selectivity. Chin. Chem. Lett. 2016, 27, 933–937. [Google Scholar] [CrossRef]
  33. Al-Junabi, N.; Vakiti, R.; Kalumpasut, P.; Gorgojo, P.; Siperstein, F.R.; Fan, X. Velocity Variation Effect in Fixed Bed Columns: A Case Study of CO2 Capture Using Porous Solid Adsorbents. AIChE J. 2018, 64, 2189–2197. [Google Scholar] [CrossRef] [Green Version]
  34. Golden, T.C.; Sircar, S. Gas Adsorption on Silicalite. J. Colloid Interface Sci. 1994, 162, 82–188. [Google Scholar] [CrossRef]
  35. Heymans, N.; Alban, B.; Moreau, S.; De Weireld, G. Experimental and theoretical study of the adsorption of pure molecules and binary systems containing methane, carbon monoxide, carbon dioxide and nitrogen: Application to the syngas generation. Chem. Eng. Sci. 2011, 66, 3850–3858. [Google Scholar] [CrossRef]
  36. Mulgundmath, V.P.; Tezel, F.H.; Saatcioglu, T.; Golden, T.C. Adsorption and separation of CO2/N2 and CO2/CH4 by 13X zeolite. Can. J. Chem. Eng. 2012, 90, 730–738. [Google Scholar] [CrossRef]
  37. Gregg, S.J.; Sing, K.S.W.; Salzberg, H.W. Adsorption Surface Area and Porosity. J. Electrochem. Soc. 1967, 114, 279C. [Google Scholar] [CrossRef]
  38. Rege, S.U.; Yang, R.T. A novel FTIR method for studying mixed gas adsorption at low concentrations: H2O and CO2 on NaX zeolite and γ-alumina. Chem. Eng. Sci. 2001, 56, 3781–3796. [Google Scholar] [CrossRef]
  39. Kongnoo, A.; Intharapat, P.; Worathanakul, P.; Phalakornkul, C. Diethanolamine impregnated palm shell activated carbon for CO2 adsorption at elevated temperatures. J. Environ. Chem. Eng. 2016, 4, 73–78. [Google Scholar] [CrossRef]
  40. Rouquerol, F.; Rouquerol, J.; Sing, K.S.W. Adsorption by Powders and Porous Solids, 2nd ed.; Academic Press: Oxford, UK, 2014; pp. 25–56. [Google Scholar]
  41. Yi, Y.J.; Wang, Z.; Zhang, K.; Yu, G.; Duan, X. Sediment pollution and its effect on fish through food chain in the Yangtze River. Int. J. Sediment Res. 2008, 23, 338–347. [Google Scholar] [CrossRef]
  42. Shafeeyan, M.S.; Daud, W.; Shamiri, A.; Aghamohammadi, N. Modeling of Carbon Dioxide Adsorption onto Ammonia-Modeified Activated Carbon: Kinetic Analysis and Breakthrough Behavior. Energy Fuels 2015, 29, 6565–6577. [Google Scholar] [CrossRef]
  43. Monazam, E.R.; Spenik, J.; Shadle, L.J. Fluid bed adsorption of carbon dioxide on immobilized polyethylenimine (PEI): Kinetic analysis and breakthrough behavior. Chem. Eng. J. 2013, 223, 795–805. [Google Scholar] [CrossRef]
  44. Lua, A.C.; Yang, T. Theoretical and experimental SO2 adsorption onto pistachio-nut-shell activated carbon for a fixed-bed column. Chem. Eng. J. 2009, 155, 175–183. [Google Scholar] [CrossRef]
  45. Mulgundmath, V.P.; Jones, R.A.; Tezel, F.H.; Thibault, J. Fixed bed adsorption for the removal of carbon dioxide from nitrogen: Breakthrough behavior and modeling for heat and mass transfer. Sep. Purif. Technol. 2012, 85, 17–27. [Google Scholar] [CrossRef]
  46. Zhang, W.; Bao, Y.; Bao, A. Preparation of nitrogen-doped hierarchical porous carbon materials by a template-free method and application to CO2 capture. J. Environ. Chem. Eng. 2020, 8, 103732. [Google Scholar] [CrossRef]
  47. Tobarameekul, P.; Sangsuradet, S.; Worathanakul, P. Comparative Study of Zn Loading on Advanced Functional Zeolite NaY from Bagasse Ash and Rice Husk Ash for Sustainable CO2 Adsorption with ANOVA Factorial Design. Atmosphere 2022, 13, 314. [Google Scholar] [CrossRef]
  48. Yoro, K.O.; Amosa, M.K.; Sekoai, P.T.; Mulopo, J.; Daramola, M.O. Diffusion mechanism and effect of mass transfer limitation during the adsorption of CO2 in a packed-bed column. Int. J. Sustain. Eng. 2020, 13, 54–67. [Google Scholar] [CrossRef]
  49. Gabruś, E.; Wojtacha-Rychter, K.; Aleksandrzak, T.; Smoliński, A.; Król, M. The feasibility of CO2 emission reduction by adsorptive storage on Polish hard coals in the Upper Silesia Coal Basin: An experimental and modeling study of equilibrium, kinetics and thermodynamics. Sci. Total Environ. 2021, 796, 149064. [Google Scholar] [CrossRef] [PubMed]
  50. Aguilar-Carrillo, J.; Garrido, F.; Barrios, L.; García-González, M.T. Sorption of As, Cd, and Tl as influenced by industrial by-products applied to an acidic soil: Equilibrium and kinetic experiments. Chemosphere 2006, 65, 2377–2387. [Google Scholar] [CrossRef] [PubMed]
  51. Singha, B.; Das, S.K. Biosorption of Cr (VI) ions from aqueous solutions: Kinetics, equilibrium, thermodynamics and desorption studies. Colloids Surf. B 2011, 84, 221–232. [Google Scholar] [CrossRef]
  52. Chouch, P.K.; Mishra, I.M.; Chand, S. Decolorization and removal of chemical oxygen demand (COD) with energy recovery, Treatment of biodigester effluent of a molasses based alcohol distillery using inorganic coagulants. Colloids Surf. A Physicochem. Eng. Asp. 2014, 296, 238–247. [Google Scholar]
  53. Kaosuah, F.; Kaouah, B.; Berrama, T.; Trai, M.; Bendjama, B. Preparation and characterization of activated carbon from wild olive cores (oleaster) by H3PO4 for the removal of basic Red 46. J. Clean. Prod. 2013, 54, 296–306. [Google Scholar] [CrossRef]
  54. Moyo, M.; Chikazaza, L.; Chomunorwa, B.; Guyo, U. Adsorption batch studies on the removal of Pb(II) using Maize Tassel based activated carbon. J. Chem. 2013, 2013, 508934. [Google Scholar] [CrossRef]
Figure 1. Process of CO2 adsorption from CO2/N2 gas mixture with fixed-bed reactor.
Atmosphere 13 00513 g001
Figure 2. Effect of CO2 composition on CO2 adsorption at 298 K and feed flow rate of 2 L/h, which listed as: (a) breakthrough curves; (b) adsorption capacity.
Atmosphere 13 00513 g002
Figure 3. Effect of temperature on CO2 adsorption at feed flow rate of 2 L/h, which represented as: (a) breakthrough curves; (b) adsorption capacity.
Atmosphere 13 00513 g003
Figure 4. Effect of feed flow rate on CO2 adsorption at 298 K, represented as: (a) breakthrough curves; (b) adsorption capacity.
Atmosphere 13 00513 g004
Figure 5. CO2 adsorption on zeolite 5A results with different breakthrough curve models under different operating conditions of: (a) 298 K with 2 L/h feed flow rate; (b) 373 K with 2 L/h feed flow rate; (c) 298 K with 4 L/h feed flow rate.
Atmosphere 13 00513 g005
Figure 6. Kinetic parameters models of CO2 adsorption using zeolite 5A: (a) PFO model at different temperatures; (b) PSO model at different temperatures; (c) PFO model at different feed flow rates; (d) PSO model at different feed flow rates.
Atmosphere 13 00513 g006
Figure 7. Intraparticle diffusion model plots of CO2 adsorption on zeolite 5A at (a) different temperatures; (b) different feed flow rates.
Atmosphere 13 00513 g007
Figure 8. Boyd model plots of CO2 adsorption on zeolite 5A at (a) different temperatures; (b) different feed flow rates.
Atmosphere 13 00513 g008
Figure 9. Adsorption mechanisms of CO2 adsorption from CO2/N2 gas mixture on zeolite 5A.
Atmosphere 13 00513 g009
Table 1. Information data for CO2 adsorption from CO2/N2 gas mixture on zeolite 5A.
ParameterValue
AdsorbentZeolite 5A
Reactor size0.07752 cm.id
stainless steel tube
Weight of adsorbent1 g
Length of bed5 cm
Pressure100 kPa
C20N80T298F2CO2 20 %vol, N2 80 %vol, 298 K and 2 L/h
C50N50T298F2CO2 50 %vol, N2 50 %vol, 298 K and 2 L/h
C80N20T298F2CO2 80 %vol, N2 20 %vol, 298 K and 2 L/h
C20N80T333F2CO2 20 %vol, N2 80 %vol, 333 K and 2 L/h
C20N80T373F2CO2 20 %vol, N2 80 %vol, 373 K and 2 L/h
C20N80T298F1CO2 20 %vol, N2 80 %vol, 298 K and 1 L/h
C20N80T298F4CO2 20 %vol, N2 80 %vol, 298 K and 4 L/h
Table 2. The surface properties of pure zeolite 5A and after adsorption.
SampleSurface Area (m2 g−1)Pore Volume (cm3 g−1)
BET Surface Area aExternal
Surface Area b
Micropore
Surface Area b
Micropore Volume bTotal Pore Volume c
Pure zeolite 5A517.4418.21499.230.2600.277
C20N80T298F1496.5121.80474.710.2540.274
C20N80T298F2498.1520.30477.850.2410.260
C20N80T298F4502.6419.67482.970.2560.277
a BET method b t-plot method c N2 adsorption isotherm at P/P0 ≈ 0.
Table 3. CO2 adsorption parameters in fixed-bed column.
ModelConditionsParameters
kBA (L mg−1 min−1)N0 (mg L−1)R2
Bohart–AdamsC20N80T298F22.959 × 10−61.419 × 10100.936
C20N80T373F26.024 × 10−60.669 × 10100.833
C20N80T298F43.730 × 10−61.854 × 10100.890
Yoon–NelsonConditionskYN (min−1) τ (min)R2
C20N80T298F20.16919.5690.990
C20N80T373F20.4297.1640.990
C20N80T298F40.2868.6050.992
ThomasConditionskTH (L mg−1 min−1)qTH (mg g−1)R2
C20N80T298F24.414 × 10−62.387 × 1070.987
C20N80T373F24.611 × 10−61.249 × 1070.811
C20N80T298F44.396 × 10−62.829 × 1070.905
Table 4. Kinetic parameters of CO2 adsorption from 20/80 %vol of a CO2/N2 gas mixture using zeolite 5A at different conditions.
ConditionsExperimentPseudo-First-Order (PFO)Pseudo-Second-Order (PSO)
qexp
(mmol g−1)
qcal
(mmol g−1)
k1
(min−1)
R2qcal
(mmol g−1)
k2
(g mmol−1min−1)
R2
C20N80T298F26.447.690.10340.99312.772.45 × 10−30.701
C20N80T333F23.424.090.08340.98647.851.92 × 10−30.910
C20N80T373F22.562.890.09960.9963.3527.20 × 10−30.989
C20N80T298F17.429.020.09940.99614.971.90 × 10−30.831
C20N80T298F43.834.770.06200.9884.8419.40 × 10−30.972
Table 5. The diffusion kinetics constant of CO2 adsorption from CO2/N2 gas mixture on zeolite 5A.
Conditionski,1
(mmol g−1min0.5)
ki,2
(mmol g−1min0.5)
ki,3
(mmol g−1min0.5)
C20N80T298F20.52121.84600.0717
C20N80T333F20.57111.05730.0894
C20N80T373F20.55890.22990.0395
C20N80T298F10.73632.22310.0767
C20N80T298F40.51480.99350.2587
Table 6. The time taken for three stages of CO2 adsorption from CO2/N2 gas mixture.
Adsorption ConditionsTime Taken for Film Diffusion
(min)
Time Taken for Intraparticle Diffusion
(min)
Time Taken for Adsorption Equilibrium
(min)
Ratio of Time For Film Diffusion to Intraparticle Diffusion
C20N80T298F2618200.33
C20N80T333F21112200.92
C20N80T373F21222150.50
C20N80T298F1617250.35
C20N80T298F4713300.54
Publisher’s Note: MDPI stays neutral with regard to jurisdictional claims in published maps and institutional affiliations.

