Article

Neutron Activation Analysis of PM10 for Air Quality of an Industrial Region in the Czech Republic: A Case Study

by
Barbora Niedobová
1,2,*,
Wael M. Badawy
1,3,*,
Andrey Yu. Dmitriev
1,
Petr Jančík
1,2,
Olica E. Chepurchenko
1,
Maksim V. Bulavin
1 and
Maria O. Belova
1
1
Frank Laboratory of Neutron Physics, Joint Institute for Nuclear Research, 141980 Dubna, Russia
2
Department of Environmental Protection in Industry, Faculty of Materials Science and Technology, VSB—The Technical University of Ostrava, Poruba, 708 00 Ostrava, Czech Republic
3
Radiation Protection & Civil Defense Department, Nuclear Research Center, Egyptian Atomic Energy Authority (EAEA), Nasr City, Cairo 13759, Egypt
*
Authors to whom correspondence should be addressed.
Atmosphere 2022, 13(3), 479; https://doi.org/10.3390/atmos13030479
Submission received: 3 February 2022 / Revised: 22 February 2022 / Accepted: 3 March 2022 / Published: 15 March 2022
(This article belongs to the Special Issue Air Quality in Poland)

Abstract

:
This work was conducted to focus on pollutant transmission between Poland and Czechia at the most polluted area in the Czech Republic, the Moravian Silesian region. Instrumental neutron activation analysis (INAA) and multivariate statistical analyses were used to determine the mass fractions of inorganic air pollutants accumulated on filters. Particle matters of sizes smaller than 10 µm (PM10) were collected using a high-volume sampler (SAM Hi 30 AUTO WIND). Pollutants PM10 were collected on Whatman QM-A Quartz Microfiber Filters of 150 mm in diameter based on various wind conditions. These filters were irradiated by neutron flux at the experimental reactor IBR-2 at the Joint Institute of Nuclear Research in Dubna, RF. Irradiated samples were measured by gamma spectrometry techniques using HPGe detectors. In total, results are shown for 49 samples (from March to July 2021) and five field blank filters. The mass fractions of 24 elements (Sc, Cr, Fe, Ni, Co, Zn, Se, As, Br, Rb, Mo, Sb, Ba, Cs, La, Ce, Sm, Eu, Tb, Yb, Hf, Au, Th, and U) were determined. The sources of pollution were specified using correlation and exploratory factor analyses and including meteorological conditions. A strong positive correlation was shown between the elements Cr, As, Br, Co, Fe, Sc, Se, Sm, Th, La, and Ce. Elemental exposure to PM10 can be divided based on the factor loadings of common chemical components into three main pollution sources. According to the wind rose, the pollution came from the southeast/west direction; therefore, we can assume that the pollution most likely originated from the metallurgic complex (steel and iron production in the southeast, and a coking plant, metal foundry, and generation plant in the west).

1. Introduction

The northeast transboundary Czech-Polish region is one of the most polluted areas in the Czech Republic (Figure 1). It is a part of the Upper Silesian Basin—a black coal basin that has always been a coal-mining region with heavy industry, with high agglomeration density, a local heating, and dense traffic infrastructure [1]. Air pollution concentrations in this area are strongly influenced by meteorological conditions, a long-range transmission of pollution, and geographical conditions [2]. Even though ambient air quality has improved vastly in the northeast of the Czech Republic, the levels for PM10, PM2.5, and benzo[a]pyrene pollutants are still not acceptable, especially under unfavorable meteorological conditions. Pollutant concentrations exceed the annual limit value for human health protection of 40 µg/m3, 20 µg/m3, 0.001 µg/m3 respectively, in the Czech Republic [3]. While there is not much that can be done about the cross-border emissions from Poland and the geomorphology of the Ostrava basin, the impacts of other influences are gradually being reduced by the Air Quality Improvement Program. It addresses actions taken at the international and national levels [4]. The improvement of air quality reflects both the development of the national economy, as well as the impact of introducing more efficient technology and production processes, reducing material and energy intensity, and the obligation to meet specific legislative requirements.
Suspended particles are considered to be a major air pollution problem in this area, similarly to elsewhere. PM is the most relevant pollutant linked to health problems. The chemical composition of particulate matter depends on many factors such as the location, topography and surface, and meteorological conditions, as well as the season or day of the week. The harmfulness of particles is directly linked to their size [6]. Atmospheric particles commonly occur in two distinct modes, the coarse mode (2.5–10 µm), which can penetrate and settle deep inside the lungs, and the fine or accumulation mode (<2.5 µm), a respiratory fraction which is even more health-damaging, as it can penetrate the pulmonary barrier and enter the bloodstream [7]. Fine mode particles coagulate quickly and grow due to the condensation of vapor species. These particles can include sulfate, nitrate, and ammonia, as well as combustion forms of carbon, organic aerosols, metals, and other combustion products. Coarse particles normally consist of finely divided minerals such as oxides of aluminum silicate, iron, calcium, and potassium [8]. Major anthropogenic sources of primary particles are industry, road traffic, power plants, combustion processes and domestic combustion, resuspension of road dust, and construction dust. Particles can be removed from the atmosphere by wet or dry deposition [9].
The aims of the study are to (a) analyze the data obtained by instrumental neutron activation analysis of PM10 collected on quartz filters, and (b) specify the pollution sources in the Czech-Polish border area.

2. Materials and Methods

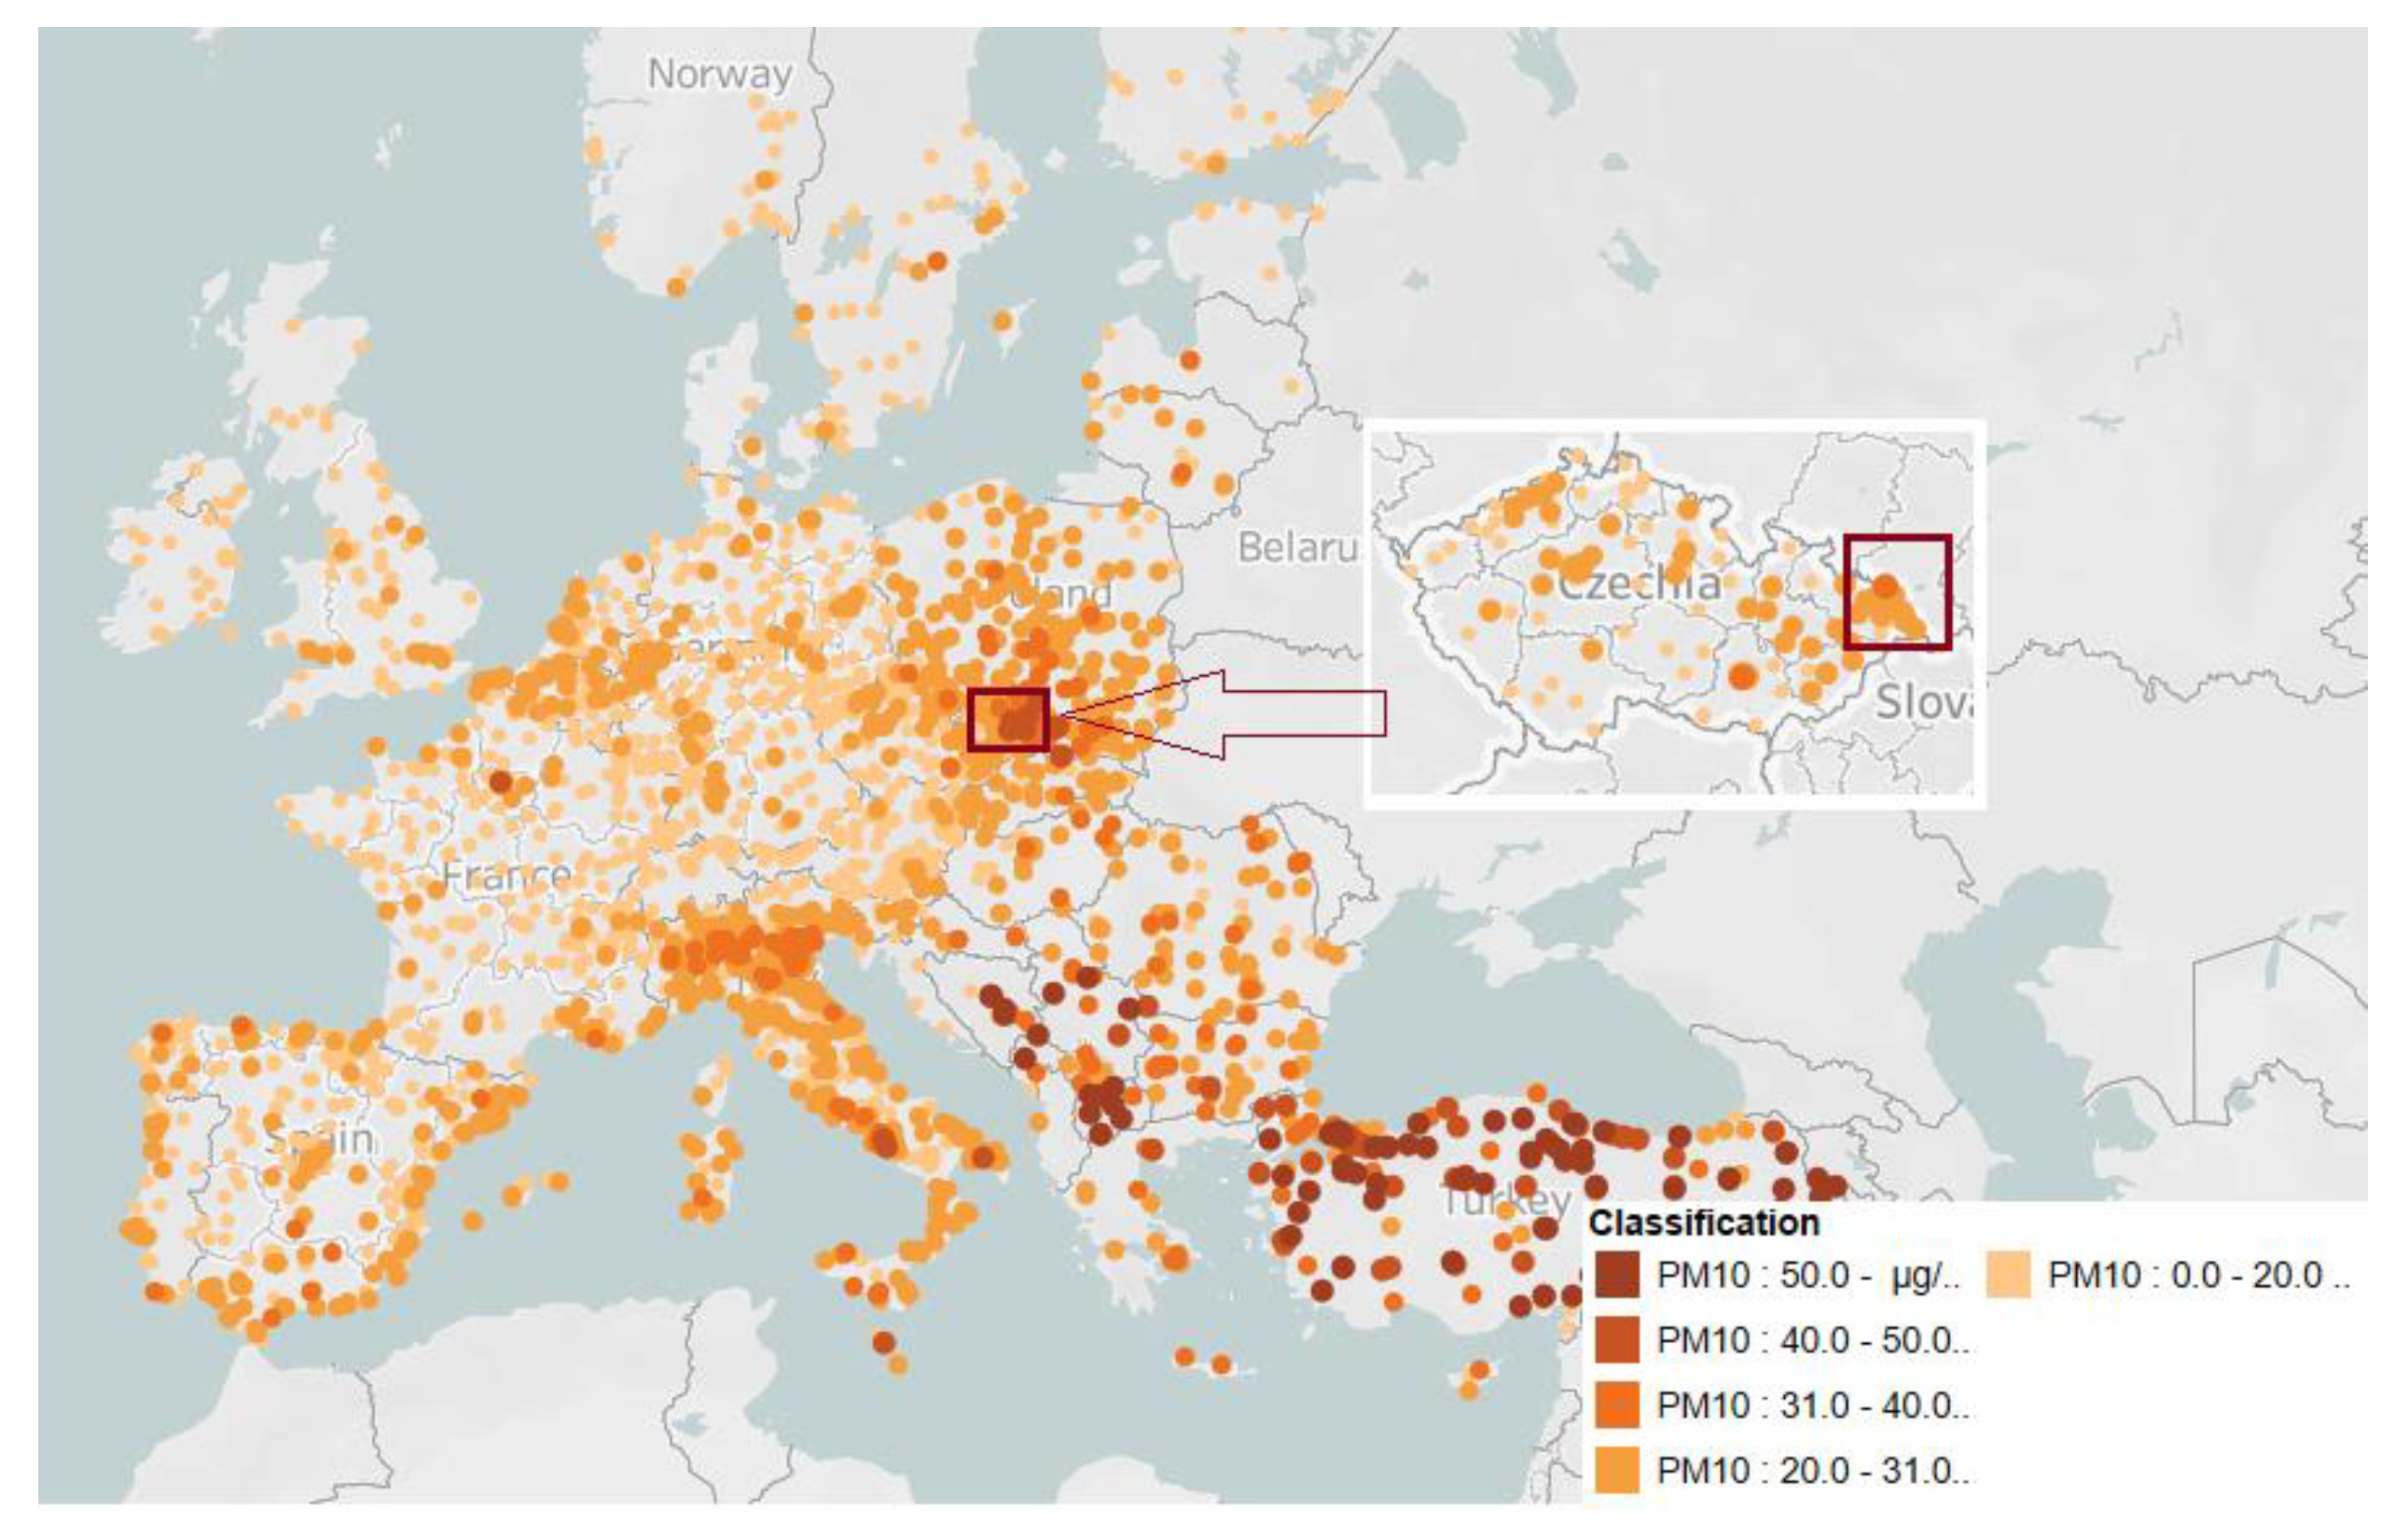
2.1. Features of the Studied Area

The sampling was performed at the industrial area located in the northeast transboundary area between the Czech and the Polish Republic, in the city of Horní Suchá [49.8051619° N, 18.4706889° E]. A predominant airflow from the southwest direction is typical there; it is related to the orographic influence of the Moravian Gate (the valley between the Beskydy and Jeseníky Mountains). The predominant steady southwest airflow is associated with the cyclonic (low pressure) weather type, with higher wind speeds accompanied by good dispersion conditions. During this airflow, relatively cleaner air from the Czech Republic is transported to the transboundary area of Czechia and Poland. Reversely, airflow from the northeast is more variable, reaches lower wind speeds, and is associated with anticyclonic situations (high-pressure), often accompanied by worsened dispersion conditions, especially during the cold season [10].

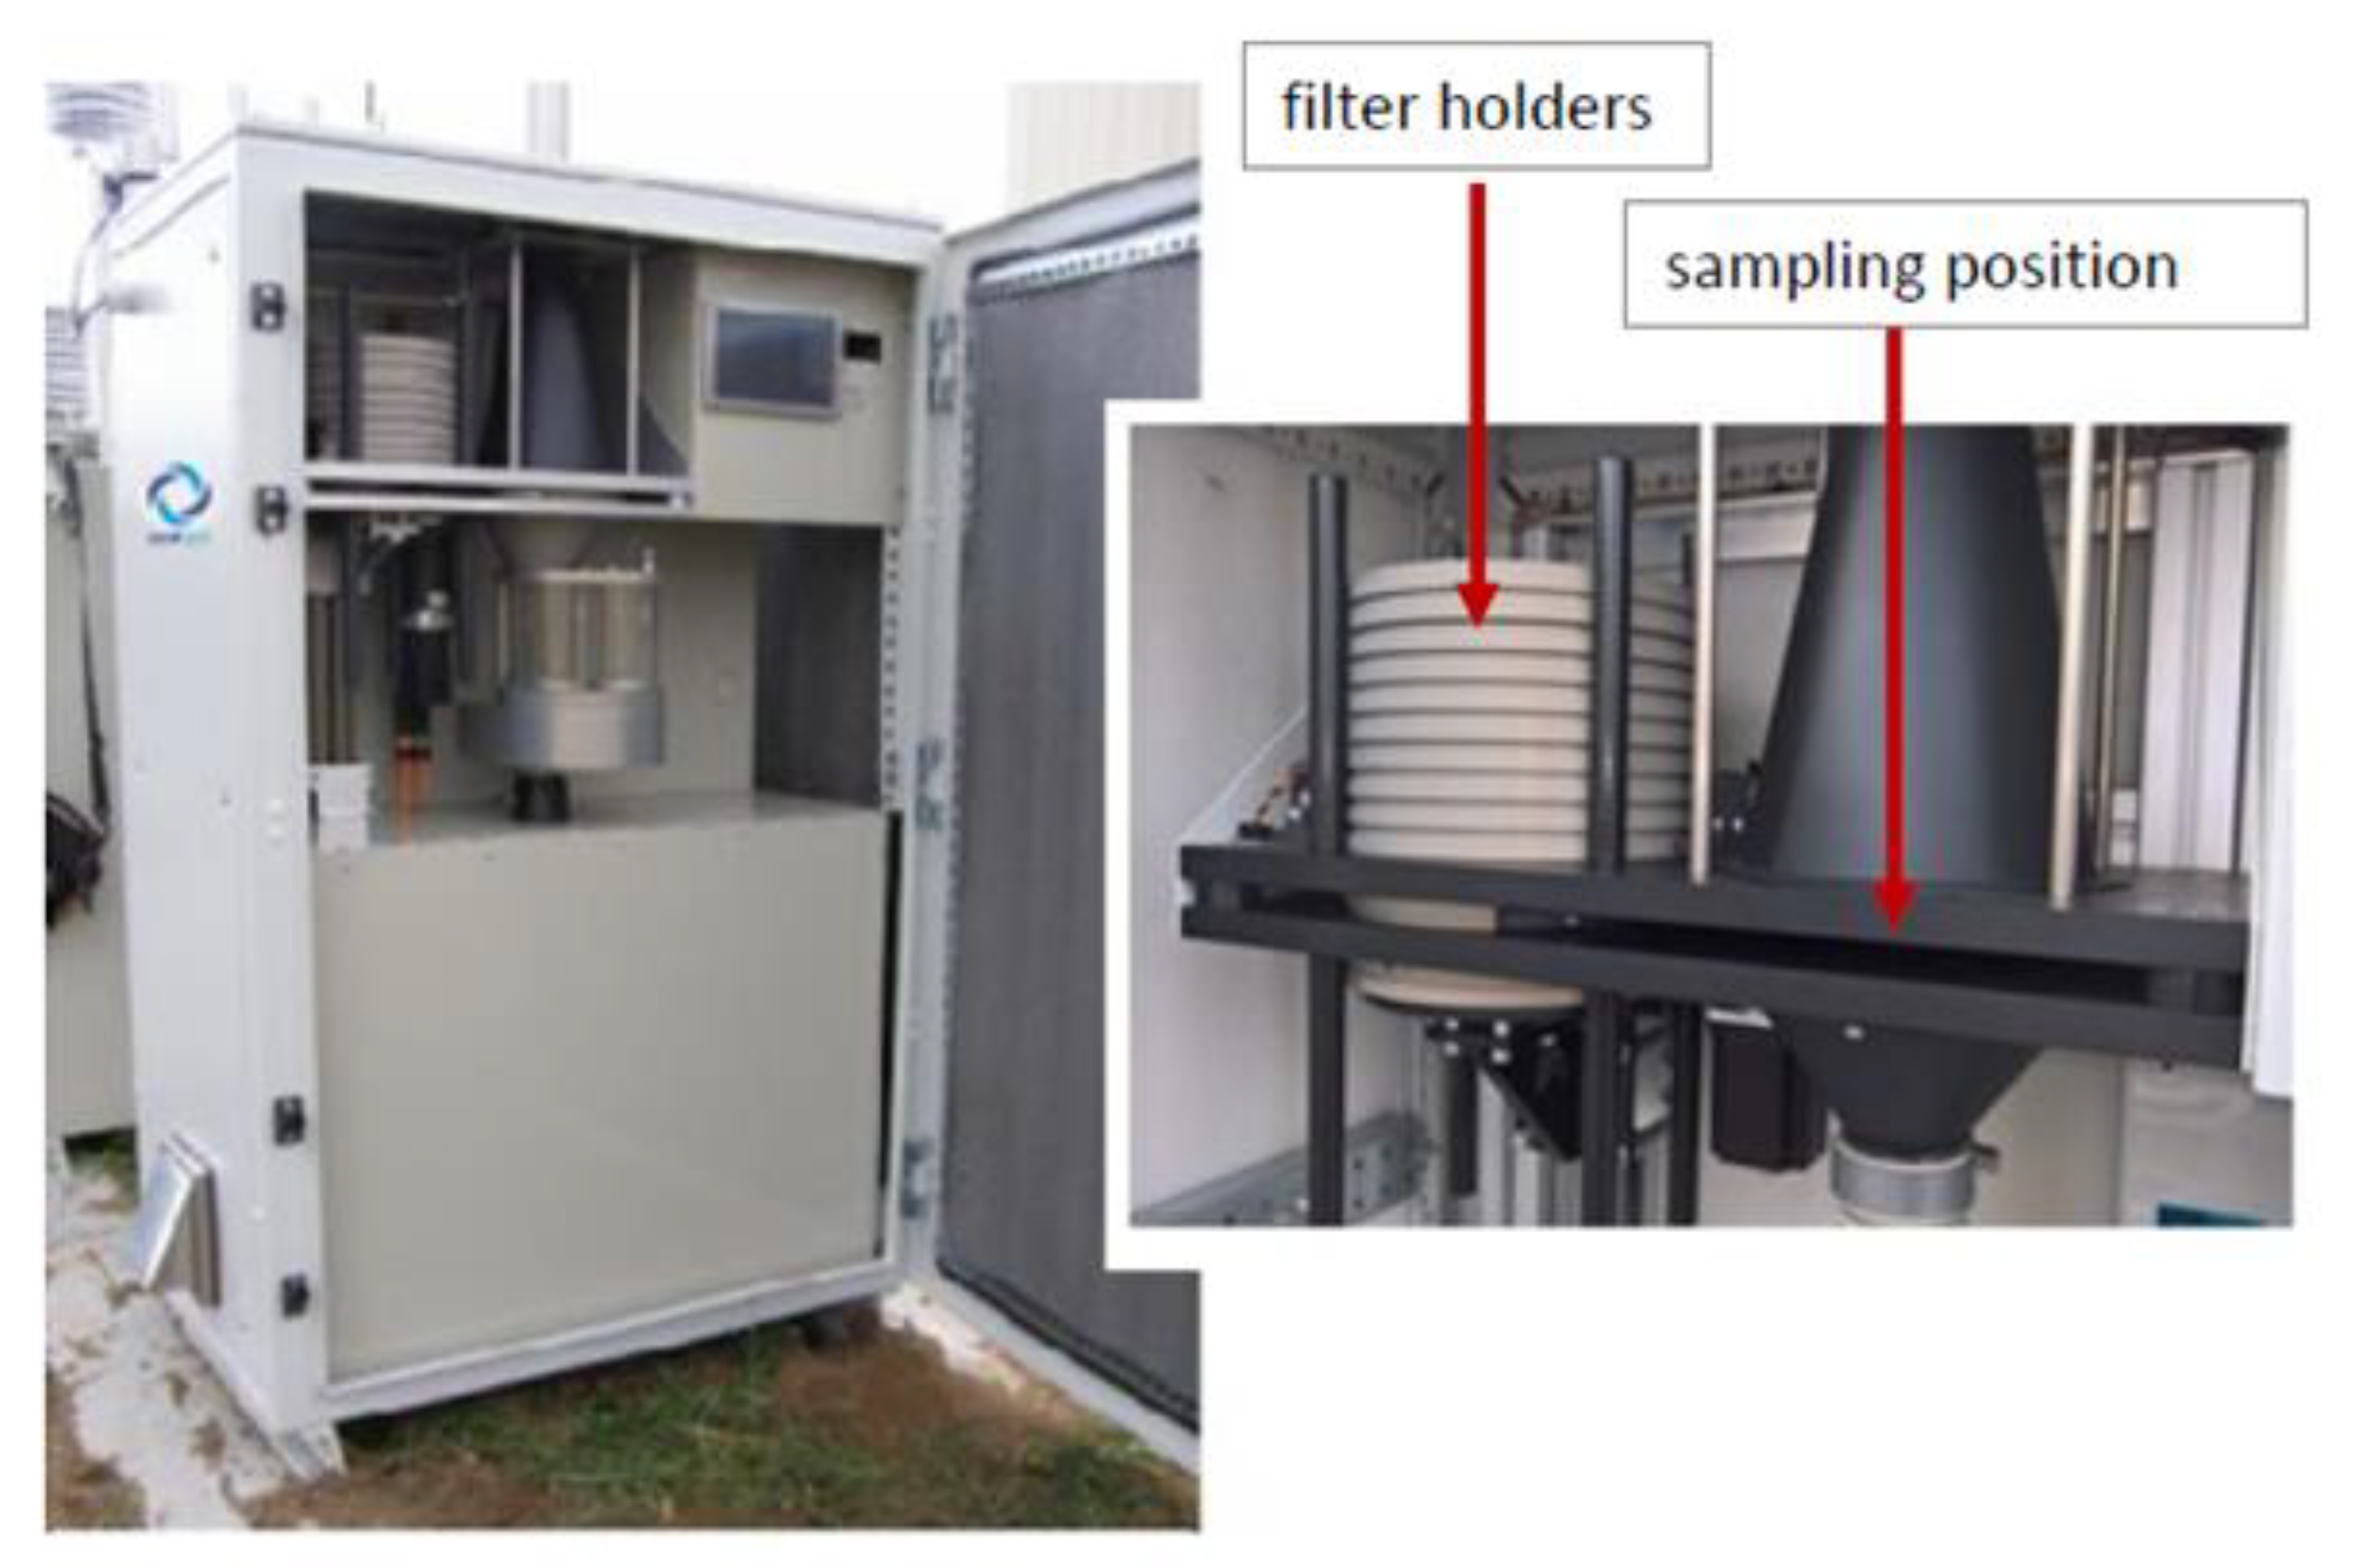
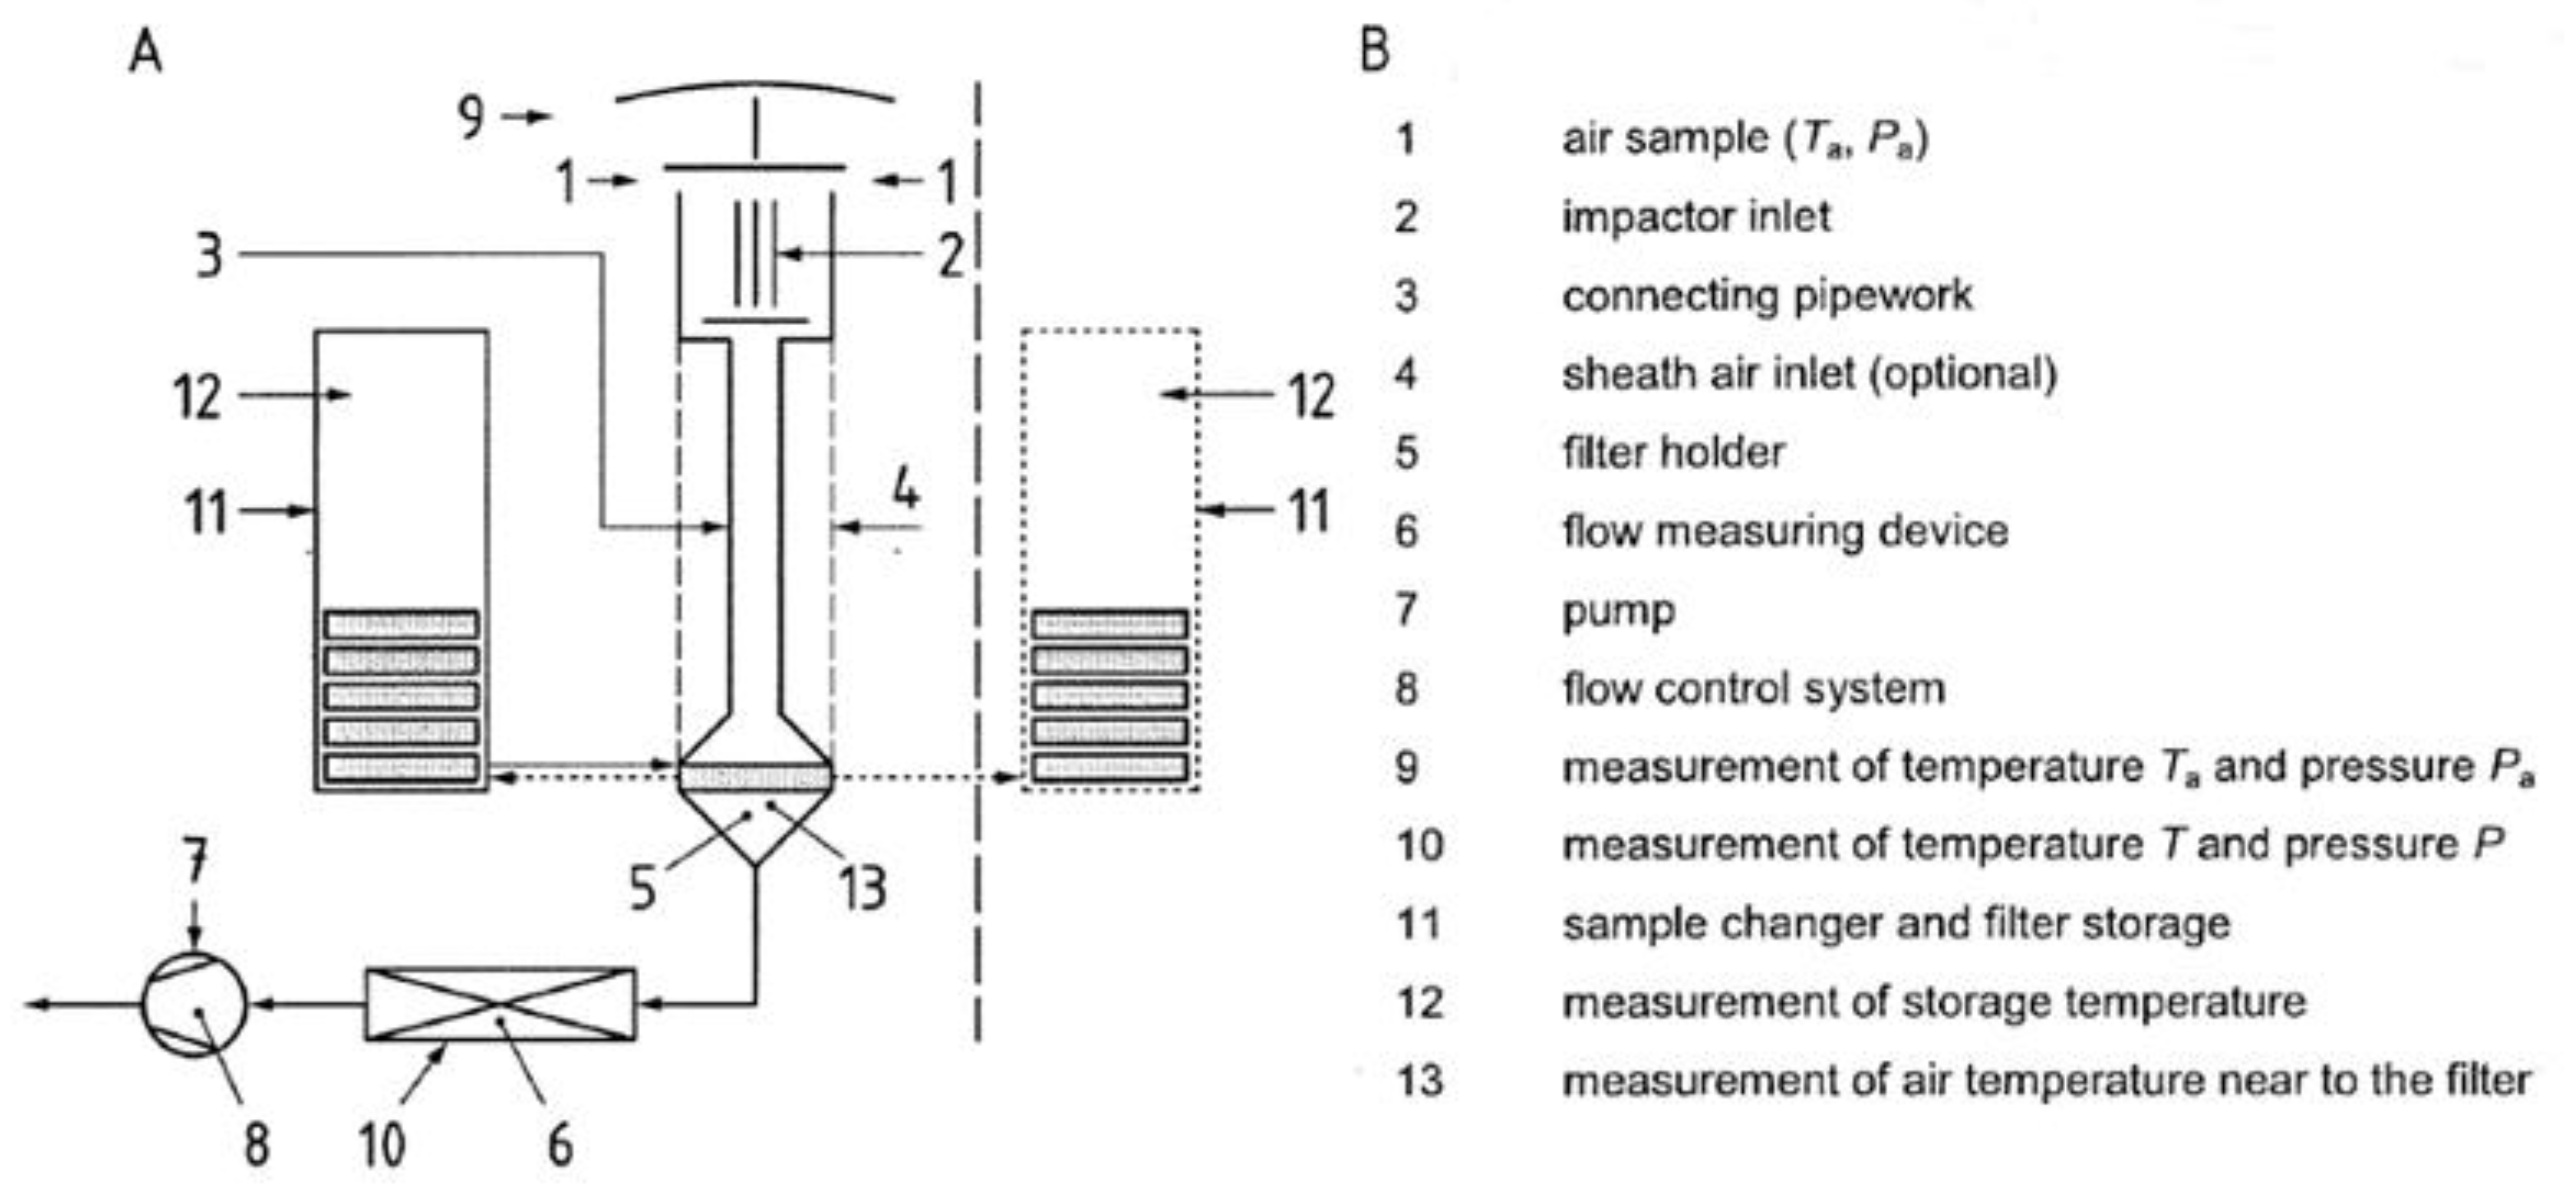
2.2. Sampling Strategy

The sampling device is located at the top of an inactive mining tower, 86 m above the ground level in the area of interest. A high-volume (hi-vol) sampler (SAM Hi 30 AUTO WIND) was used, which samples PM10 (particulate matter with a diameter < 10 µm), depending on wind conditions. In general, a high-volume sampler is the recommended instrument for sampling large volumes of air for suspended particulate matter according to the Compendium of Methods for the Determination of Inorganic Compounds in Ambient Air by the US EPA. The device uses a PM10 pre-separator (DIGITEL DPM10/30/00) for airflow of 30 m3/h. The device is equipped with a cassette that accommodates 15 quartz filters (Whatman QM-A, Ø 150 mm). Quartz filters may be used for air sampling where non-destructive organic or inorganic analyses are utilized [11]. Based on the results from the previous analysis, quartz filters are the most suitable for INAA (see Discussion). Among other filters commonly used for high-volume sampling are cellulose fiber, glass fiber, mixed fiber, and membrane filters [12]. Filter holders are automatically changed to the sampling position according to the actually evaluated wind conditions. Thus, the sampler was able to collect PM10 particles from eight basic wind directions (N, NE, E, SE, S, SW, W, NW), during CALM (wind speed is lower than 0.2 m/s) and during episodes with extreme air pollution, defined as three successive average hourly PM10 concentrations exceeding 100 g/m3, using 10 min data from continuous ground monitoring. Other filters are held in reserve in case a specific situation arises (the pressure loss on the filter is greater than 200 hPa, or it is not possible to reach a flow of 30 m3/h). All filters are changed manually once per month. Both wind speed and wind direction are measured via an anemometer (WindSonic™ SDI-12). The wind direction and wind speed for selecting a particular sampling filter from the cassette are determined according to one-hour moving averages calculated from 10 min. The sampling device and its scheme are shown in Figure 2 and Figure 3.
For this study, samples from March to July 2022 were used and processed by the NAA group of the IREN research facility of the Frank Laboratory of Neutron Physics, JINR, Russia.

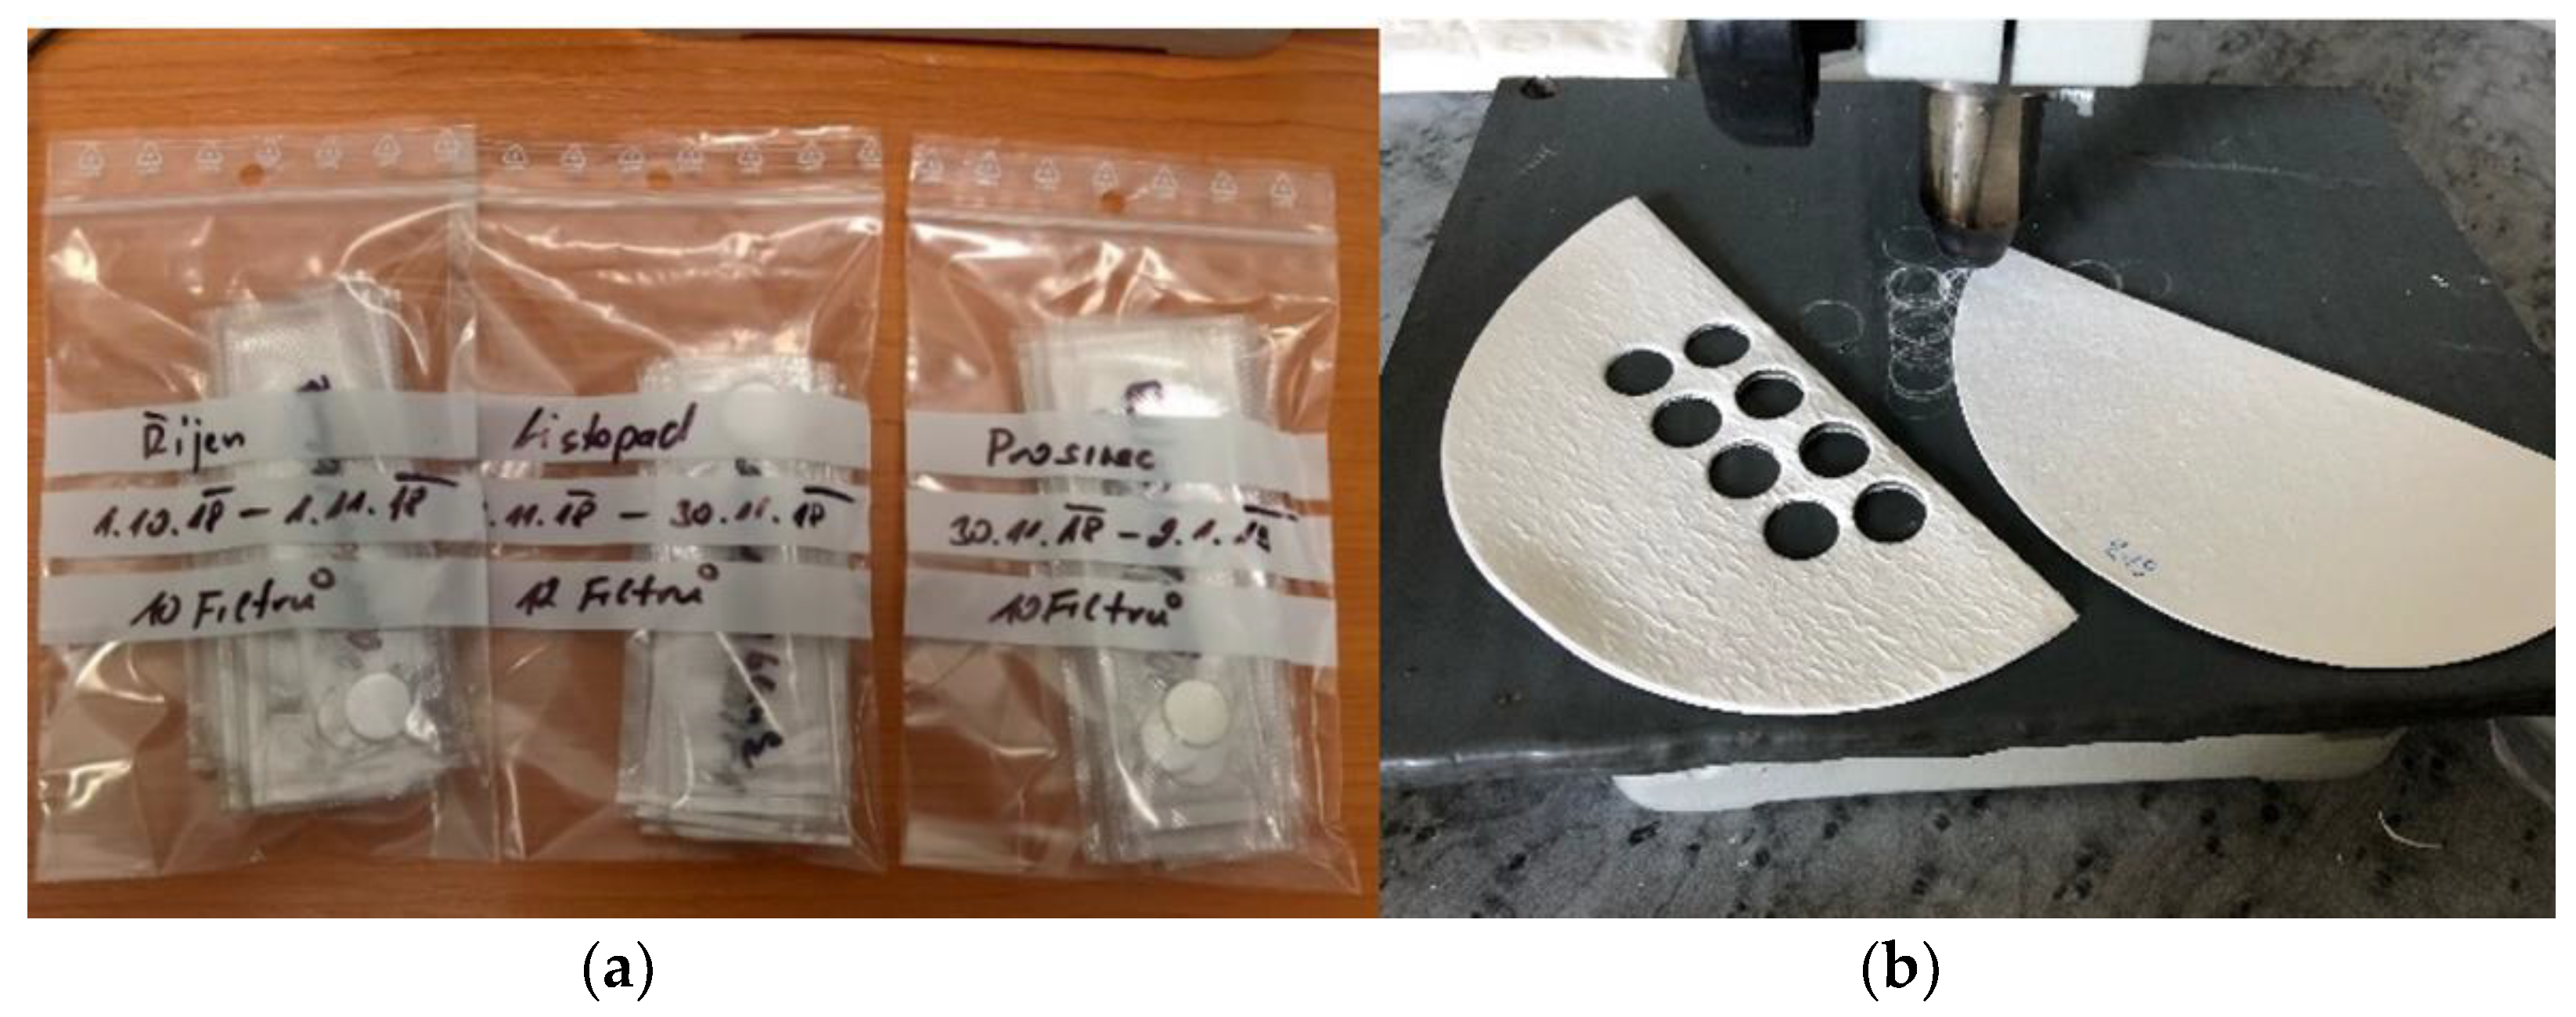
2.3. Sample Preparation for NAA

The gravimetric technique was used for the determination of the particulate matter in the atmosphere, according to the European standard 12341 [14]. All filters were visually checked before use for defects (pinholes, loose material, discoloration, nonuniformity). Unsampled filters were identified in the weighing room at the Czech Hydrometeorological Institute and stabilized at 20 °C ± 1 °C and 50% RH ± 5% RH for more than 48 h, followed by a first weighing. After additional conditioning for more than 12 h, filters were weighed for the second time. The required mass of the filter was calculated as the average of these two results; a mass of each filter was approximately 0.9 g. Those conditioned filters were then loaded into filter holders in a clean environment and were inserted into the filter cassette in the high-volume sampler. There, the filters were sampled for the required sampling period. Blank filters were treated the same way as regular samples. Sampled filters were conditioned in the weighing room for more than 48 h, followed by the first weighing and then weighed again after additional conditioning for 24 to 72 h. The mass was given by the average of these two results. The weight of the collected PM10 was given by the difference in the weight of the filter before and after sampling. After sampling, the filters were folded into halves and four 16 mm diameter circles were punched from each one. These circles were layered so that one sample consists of eight layers of the filter. For cutting, a special automatic punching head was used, made from stainless steel, Teflon, and synthetic rubber (finish surface). Blanks were prepared in the same way as the samples. These prepared samples and blanks were packed into a foil and sent to the Laboratory of Neutron Physics in JINR, as shown in Figure 4.
The mass of each unpacked sample was approximately 0.05 g. For subsequent irradiation, samples and standards (needed for the calculation of the mass fractions of the elements in the samples) were packed into aluminum capsules. Neutron activation analysis was used to investigate the inorganic composition of the air-deposited elements on the filters. This method is based on the conversion of stable nuclei into radioactive nuclei via nuclear reactions, followed by a measurement of the reaction products. The nuclear reactions are initiated by bombarding the samples with neutrons. The NAA is not matrix-dependent; therefore, there is a possibility of wide application for different types of samples. Each radionuclide is characterized by its probability for nuclear decay in unit time and the type and energy of the emitted radiation. Gamma-radiation offers the best characteristics for the selective and simultaneous detection of radionuclides and thus, of elements [15].
The samples were irradiated in channel No. 3 installed at the IBR-2 pulsed nuclear reactor. Immediately after irradiation, the samples and standards from the aluminum capsules were repacked into clean plastic containers, and the first measurements of the spectra of induced activity were carried out five days after the end of irradiation. The second measurement started 22 days after the end of the irradiation. For the measurement, a Canberra HPGe detector was used. Spectra were processed using the Canberra Genie-2000 software program, and mass fractions were calculated by the CalcCon program created at FLNP JINR [16].
The use of quartz fiber filters can provide accurate mass values that neither paper nor glass fiber filters can yield, although extra care must be taken in handling them because they tend to be fragile. A large standard deviation may be unacceptable if the element of environmental interest has concentrations in the same range as the blank element. Trace contaminants can also arise in the field blanks as a result of improper handling, unclean bags or containers used in transportation, and the condition of the sampling apparatus itself. Analytical problems may also arise from trace constituents in vials. Trace elements such as Al, Br, CI, Mn, Na, Se, V, and Zn are present in many types of irradiation containers [17,18].
The quality control of the NAA results was ensured by the following standard reference materials, made at the National Institute of Standards and Technology, Gaithersburg, MD, USA: 50c (Tungsten-Chromium-Vanadium Steel), 2709a (San Joaquin Soil Baseline Trace Element Concentrations), 1633c (Trace Elements in Coal Fly Ash), 2710a (Montana I Soil Highly Elevated Trace Element Concentrations), 1632c (Trace Elements in Coal (Bituminous)), 2782 (Industrial Sludge), and 1944 (New York/New Jersey Waterway Sediment).

2.4. Statistical Data Analysis

All the statistical analyses of data and graphs were performed using R-programming statistical software (RStudio). Data were handled using MS Office Excel. With 95% probability (p ≤ 0.05), the Shapiro–Wilk test of normality was calculated to investigate whether the concentrations of the elements are normally distributed. The relationships between the elements were tested by Pearson correlation analysis and exploratory factor analysis using minimum residuals. The varimax rotation was used to simplify and clarify the data structure. The default in most statistical software packages is to retain all factors with eigenvalues greater than one. The number of factors was determined by the scree test [19].

3. Results

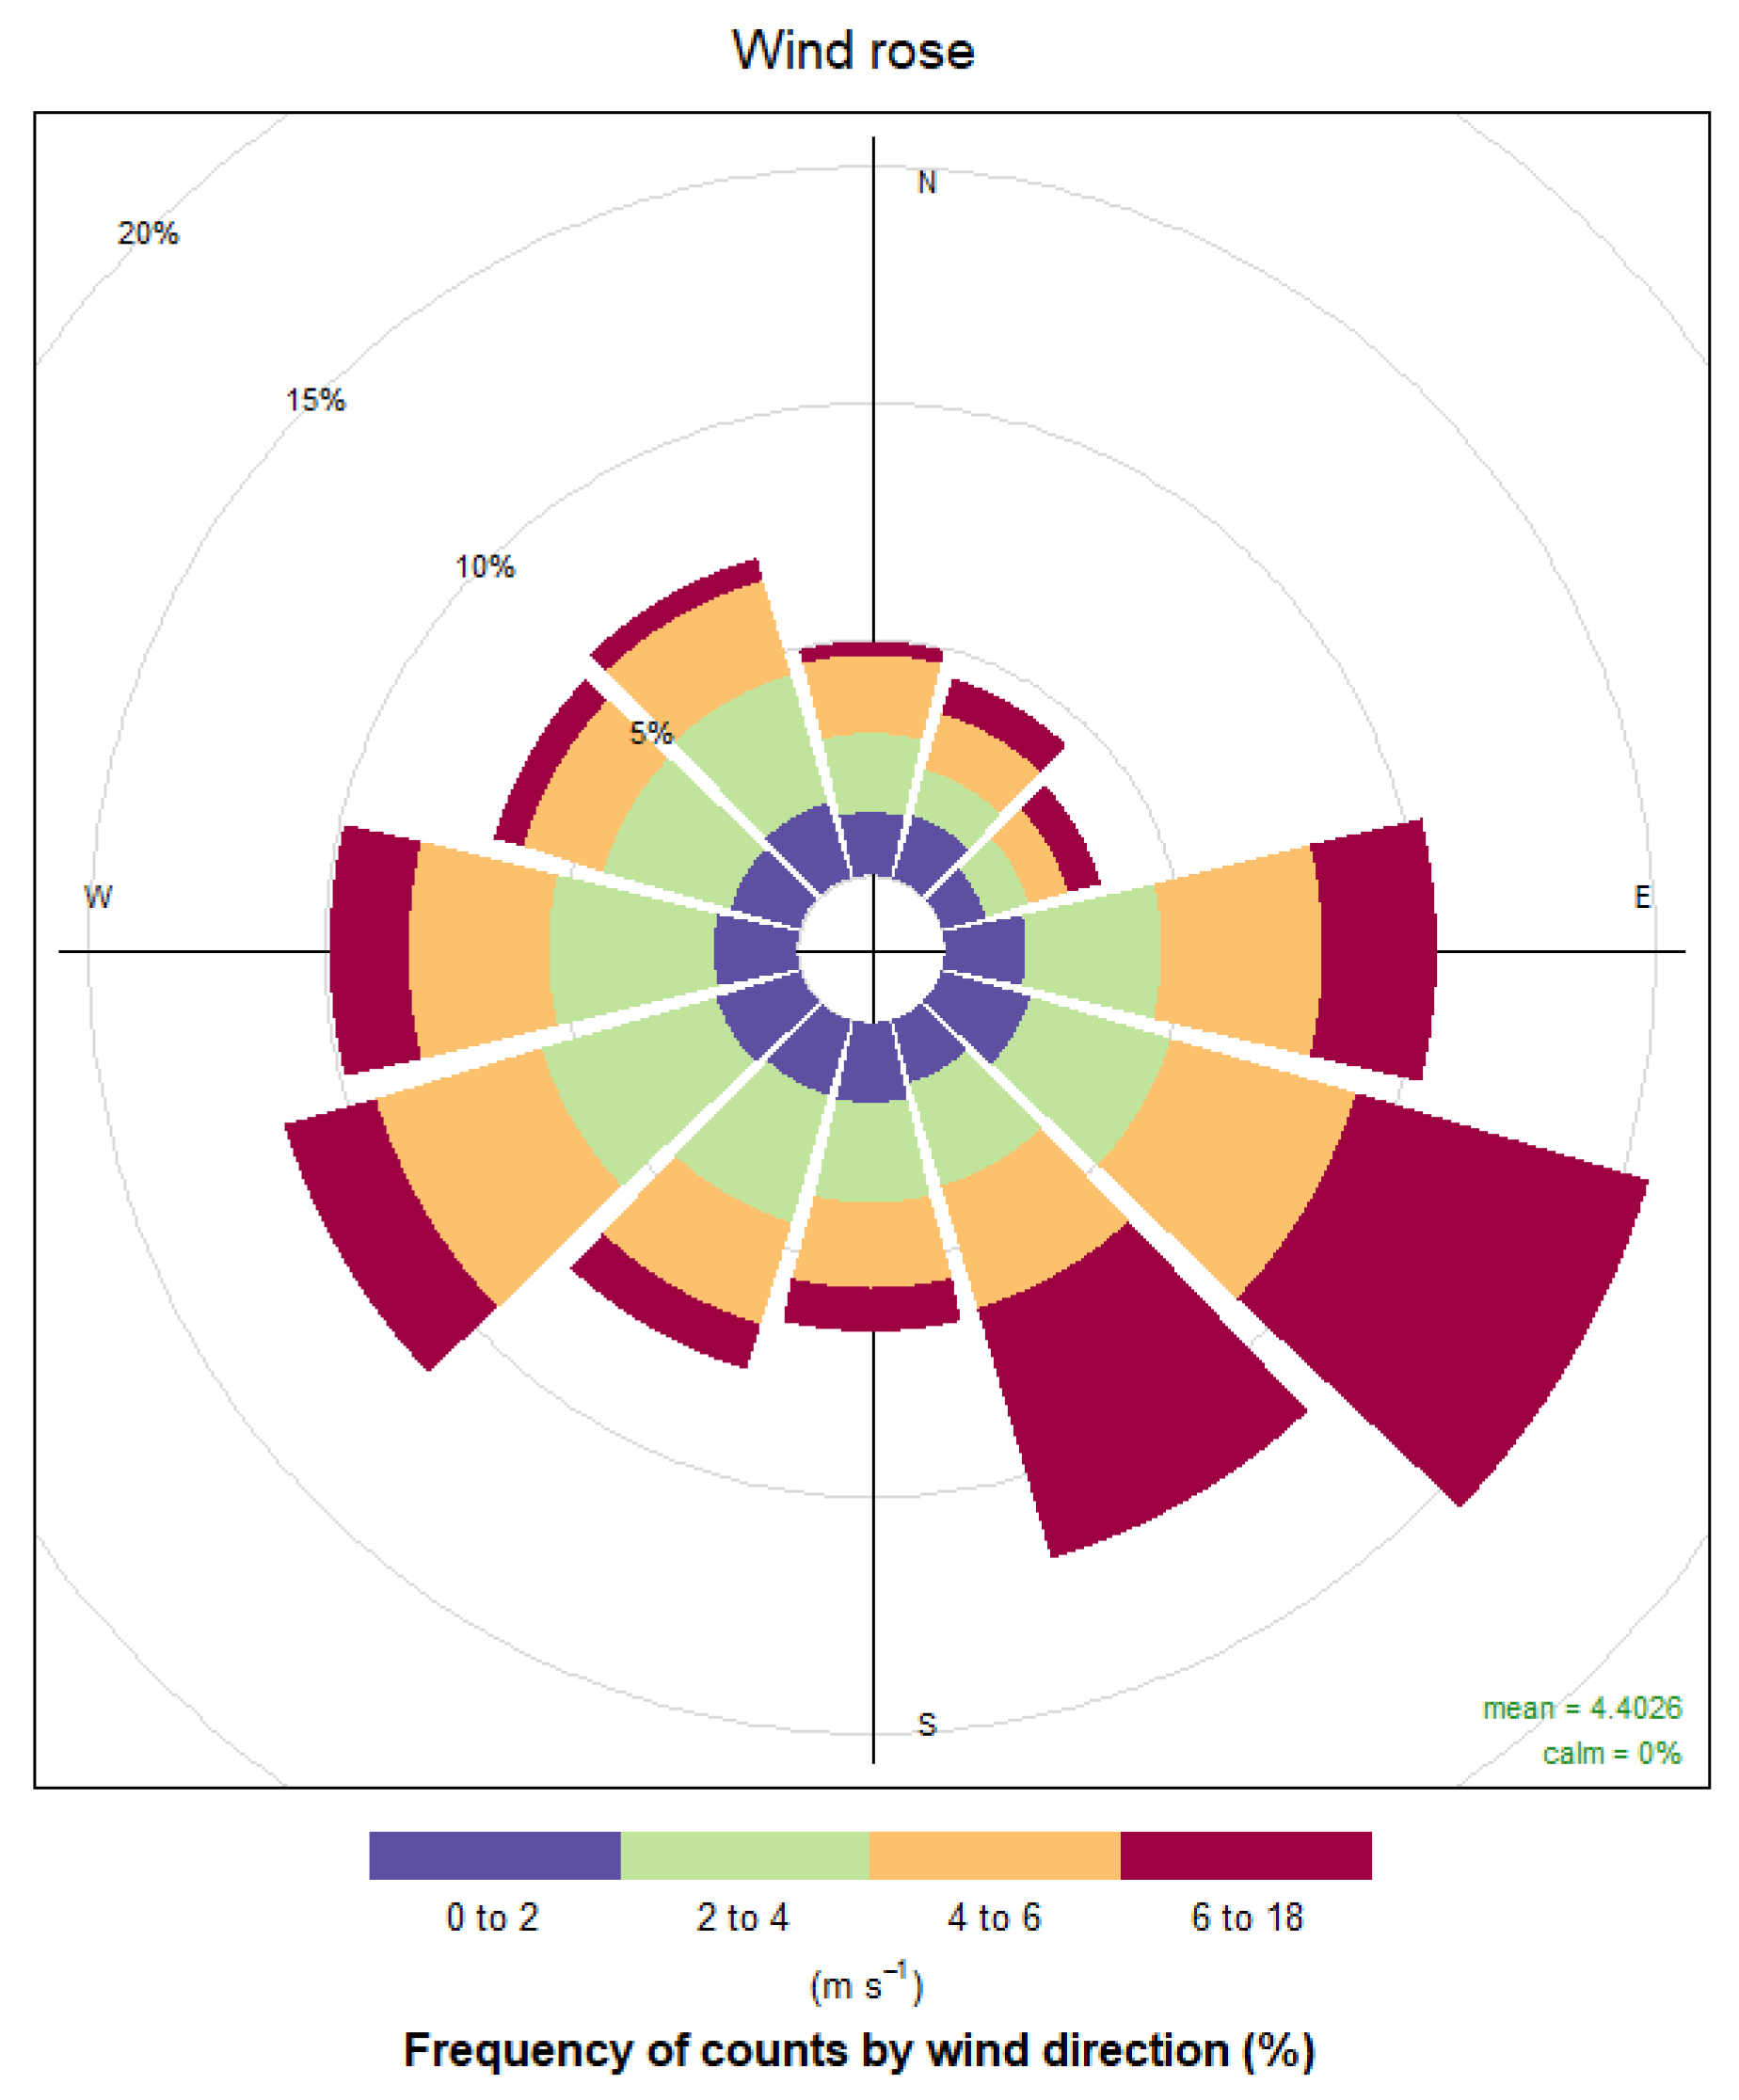
3.1. Meteorological Conditions

The basic statistics shown in Table 1 were calculated from the 10 min data measured by hi-vol (above-described device) 86 m above the ground level. The data of wind speed (WS) and temperature (T) were processed. The average temperature during the measured season (March to July) was 12.38 °C. Minus temperature values were measured during March, and the lowest was −4.2 °C; the highest temperature, 32.2 °C, was measured in the second half of June. The wind speed did not change significantly during the measuring period. The lowest value of 0.1 ms−1 was recorded in March, and the highest value of 18 ms−1 in April.
Meteorological conditions are an important factor affecting the transportation of particulate matter suspended in the atmosphere. The wind rose from March to July is plotted in Figure 5. The predominant airflow is from the southeast direction.

3.2. Elemental Abundances

Instrumental neutron activation analysis was used to determine the elemental composition of sampled PM10. A total of 42 samples (9 samples each for March, April, and June and 11 samples for May and July) and 5 field blank filters were analyzed, and a total of 24 elements were determined. A total of 6 (Ni, Mo, Ba, Tb, Yb, and U) elements out of 24 show negative values, as their mass fractions are lower than the corresponding values of the background. The results show that the mass fraction in [mg/kg] was calculated to be high for zinc, with a mean value of 1183.06 and a standard error of 8855.57 mg/kg, while the minimum values were measured for gold, with a mean value of 0.0001 and a standard error of 0.06.
The descending order of the elements in terms of mass fractions are as follows: Zn > > Rb > Cr > Fe > Br > Sb > As > Se > Ce > Co > Cs > La > Sc > Hf > Th > Sm > Eu > Au. The results show, based on its statistical significance level (p-value > 0.05), that the elements are not normally distributed, except for La, Ce, Sm, and Hf, as clearly shown in Table 2.

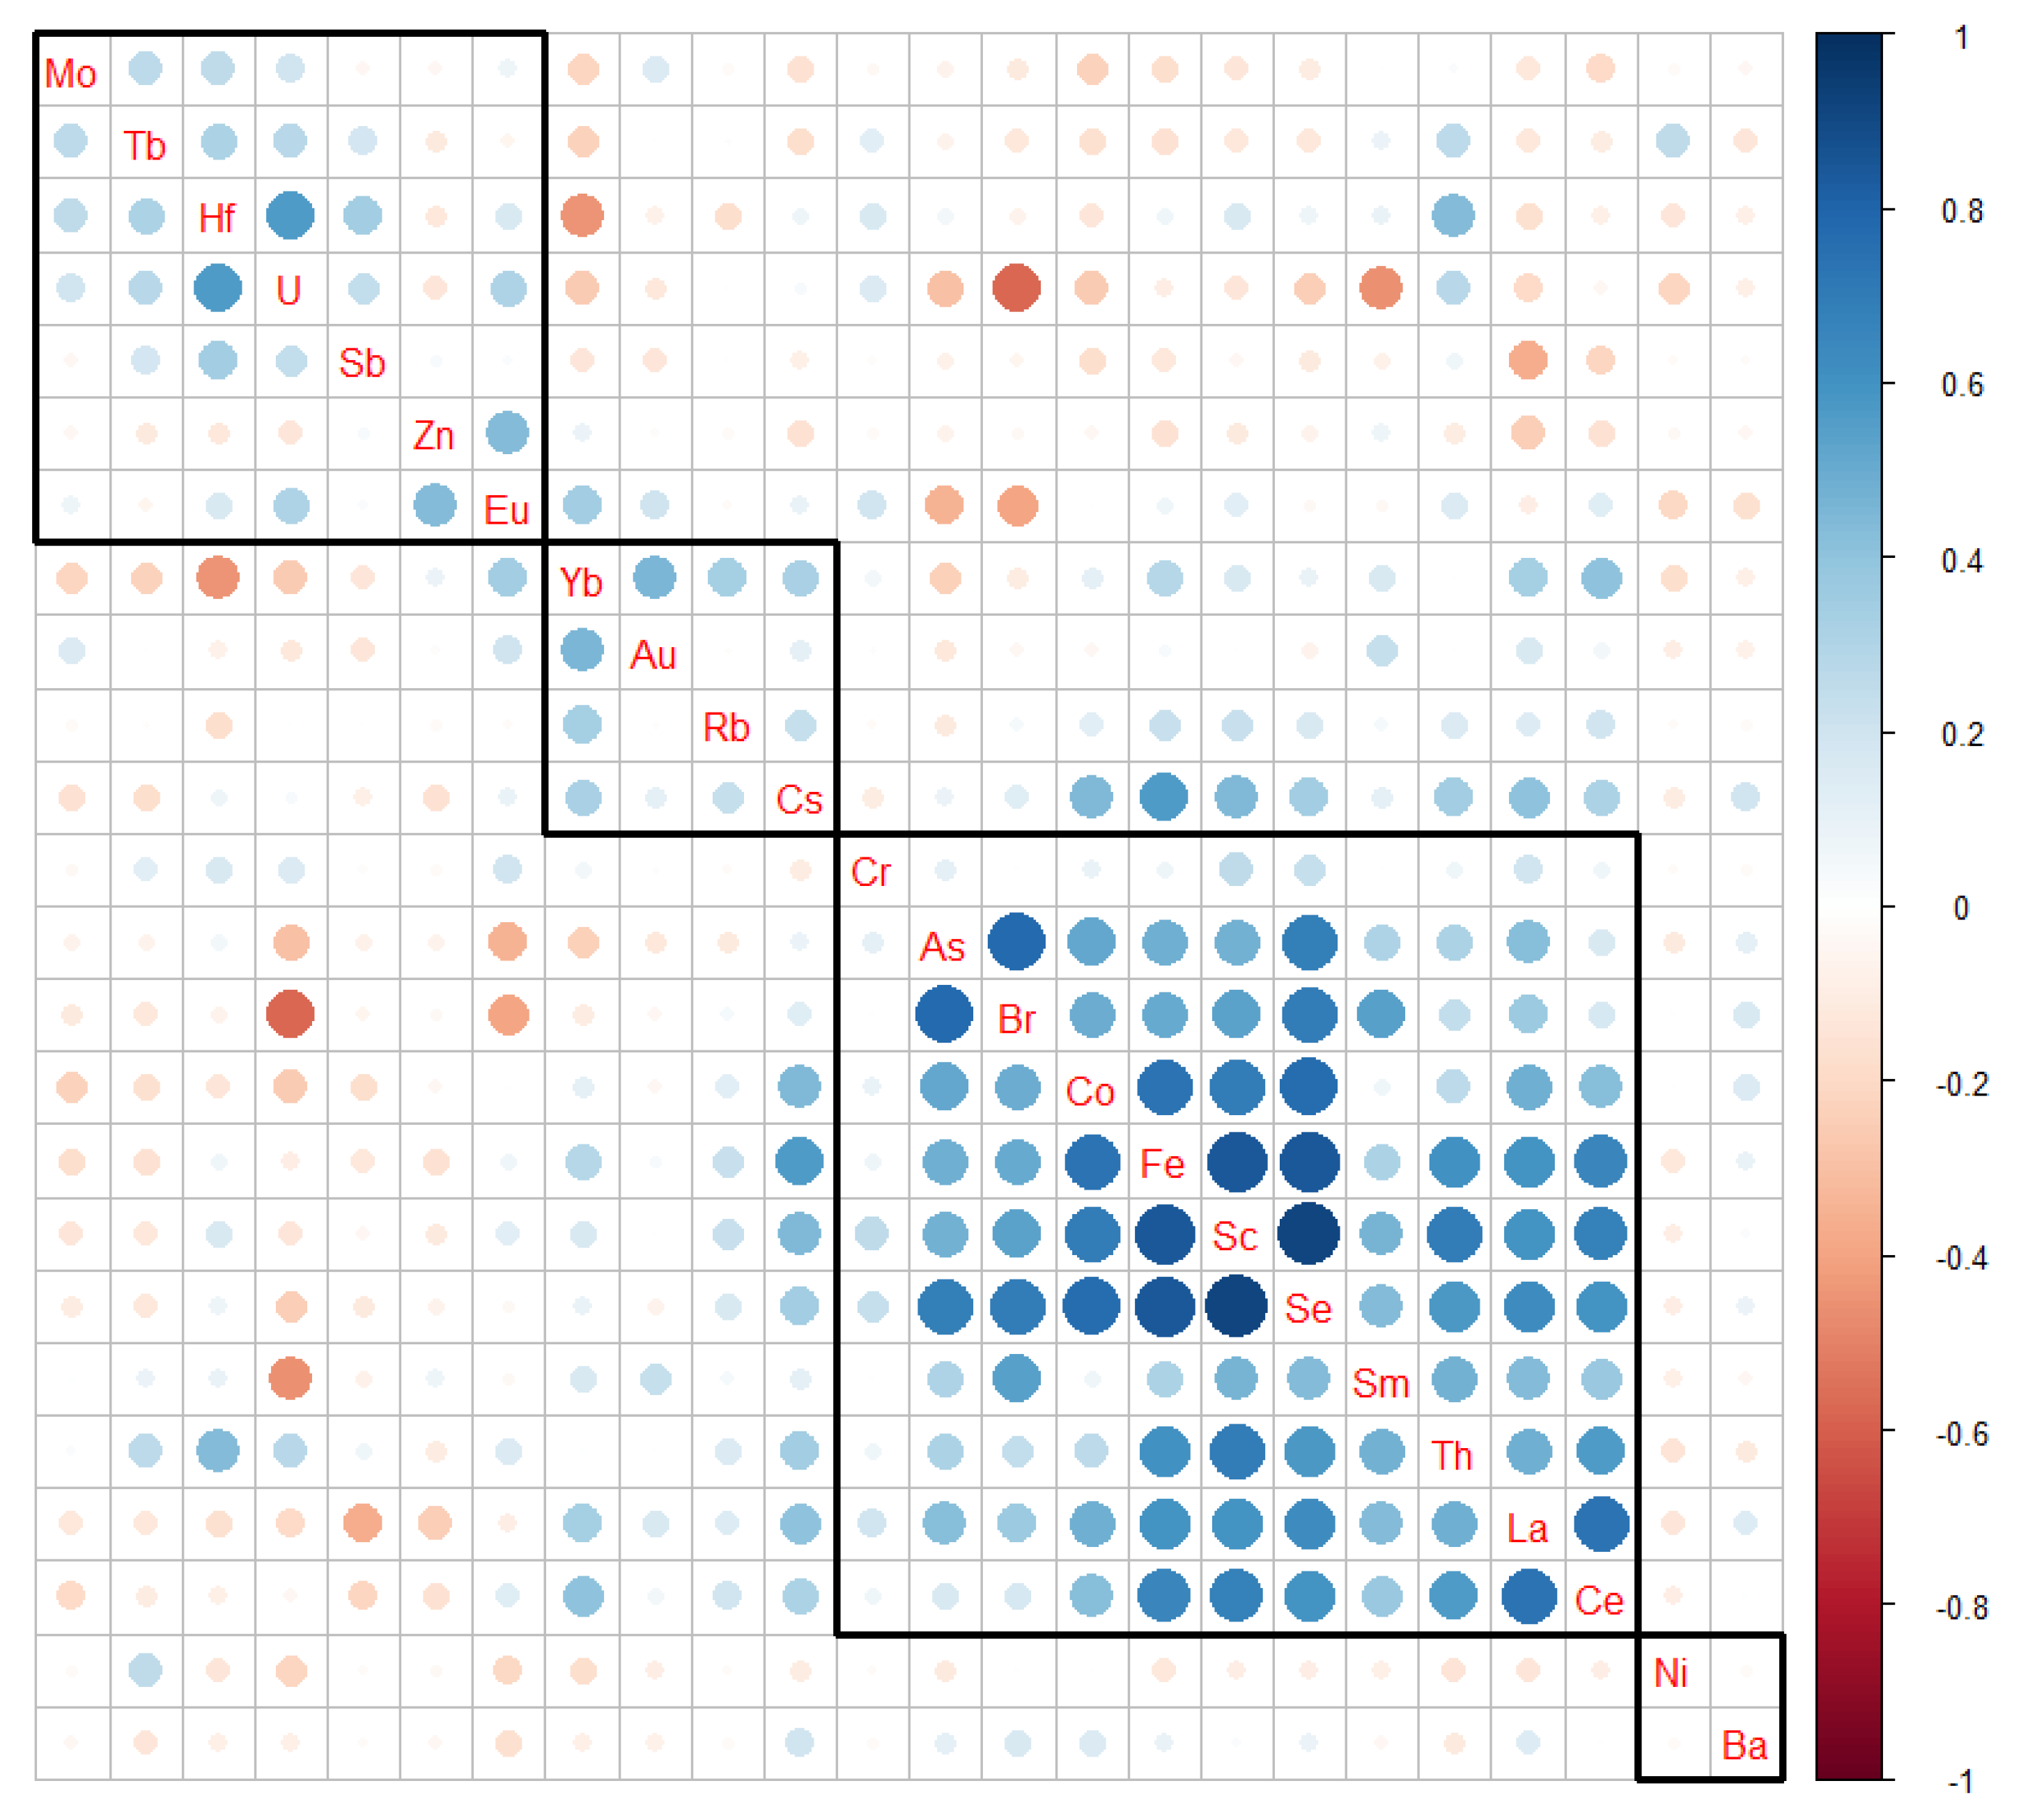
3.3. Correlation Analyses

The relationships between the elements in PM10 were tested by Pearson correlation analysis. Correlation matrices were created to assess the strength of the linear dependence between the concentrations of elements. Positive correlations are shown in blue and negative correlations in red. The color intensity and brand size are proportional to the correlation coefficients. The correlation matrix of elements (Figure 6) shows a strong positive correlation between the elements Br, As, Co, Fe, Se, Sc, Sm, Th, La, and Ce. A positive correlation indicates the similar behavior of elements or a similar source of origin. Correlations are ordered by hierarchical clustering with a cluster outline; therefore, similar variables are grouped together.

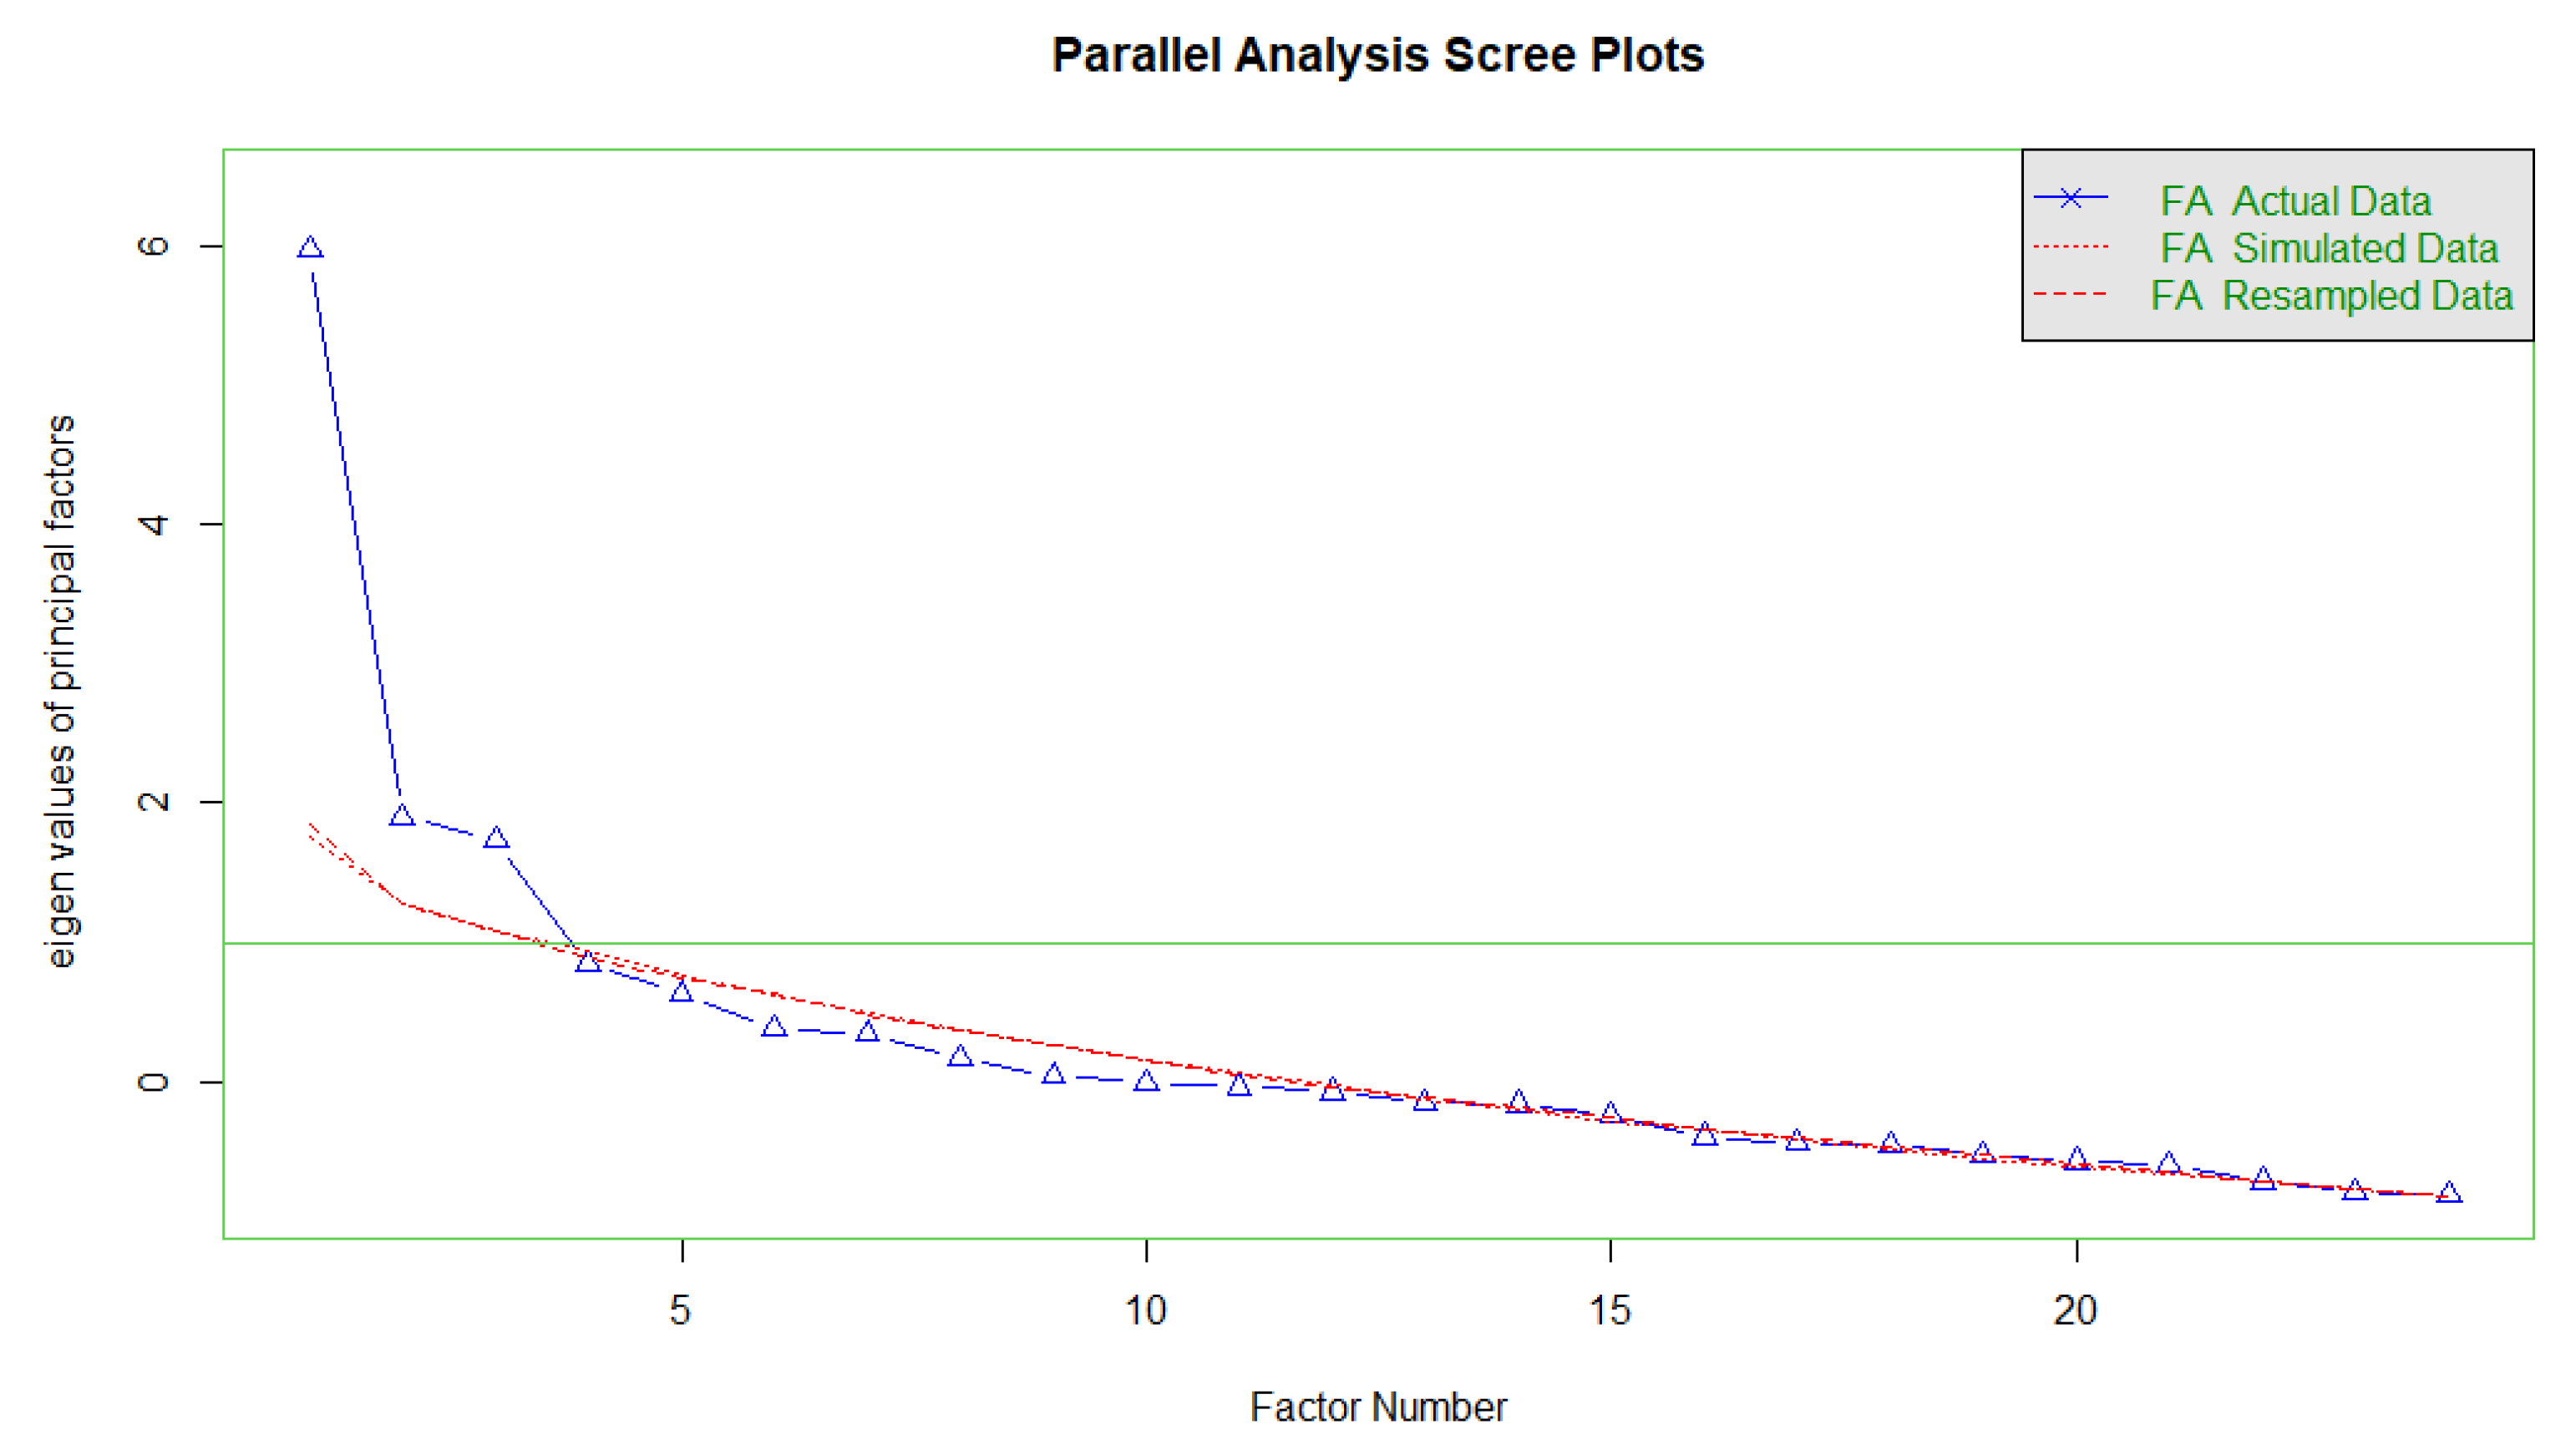
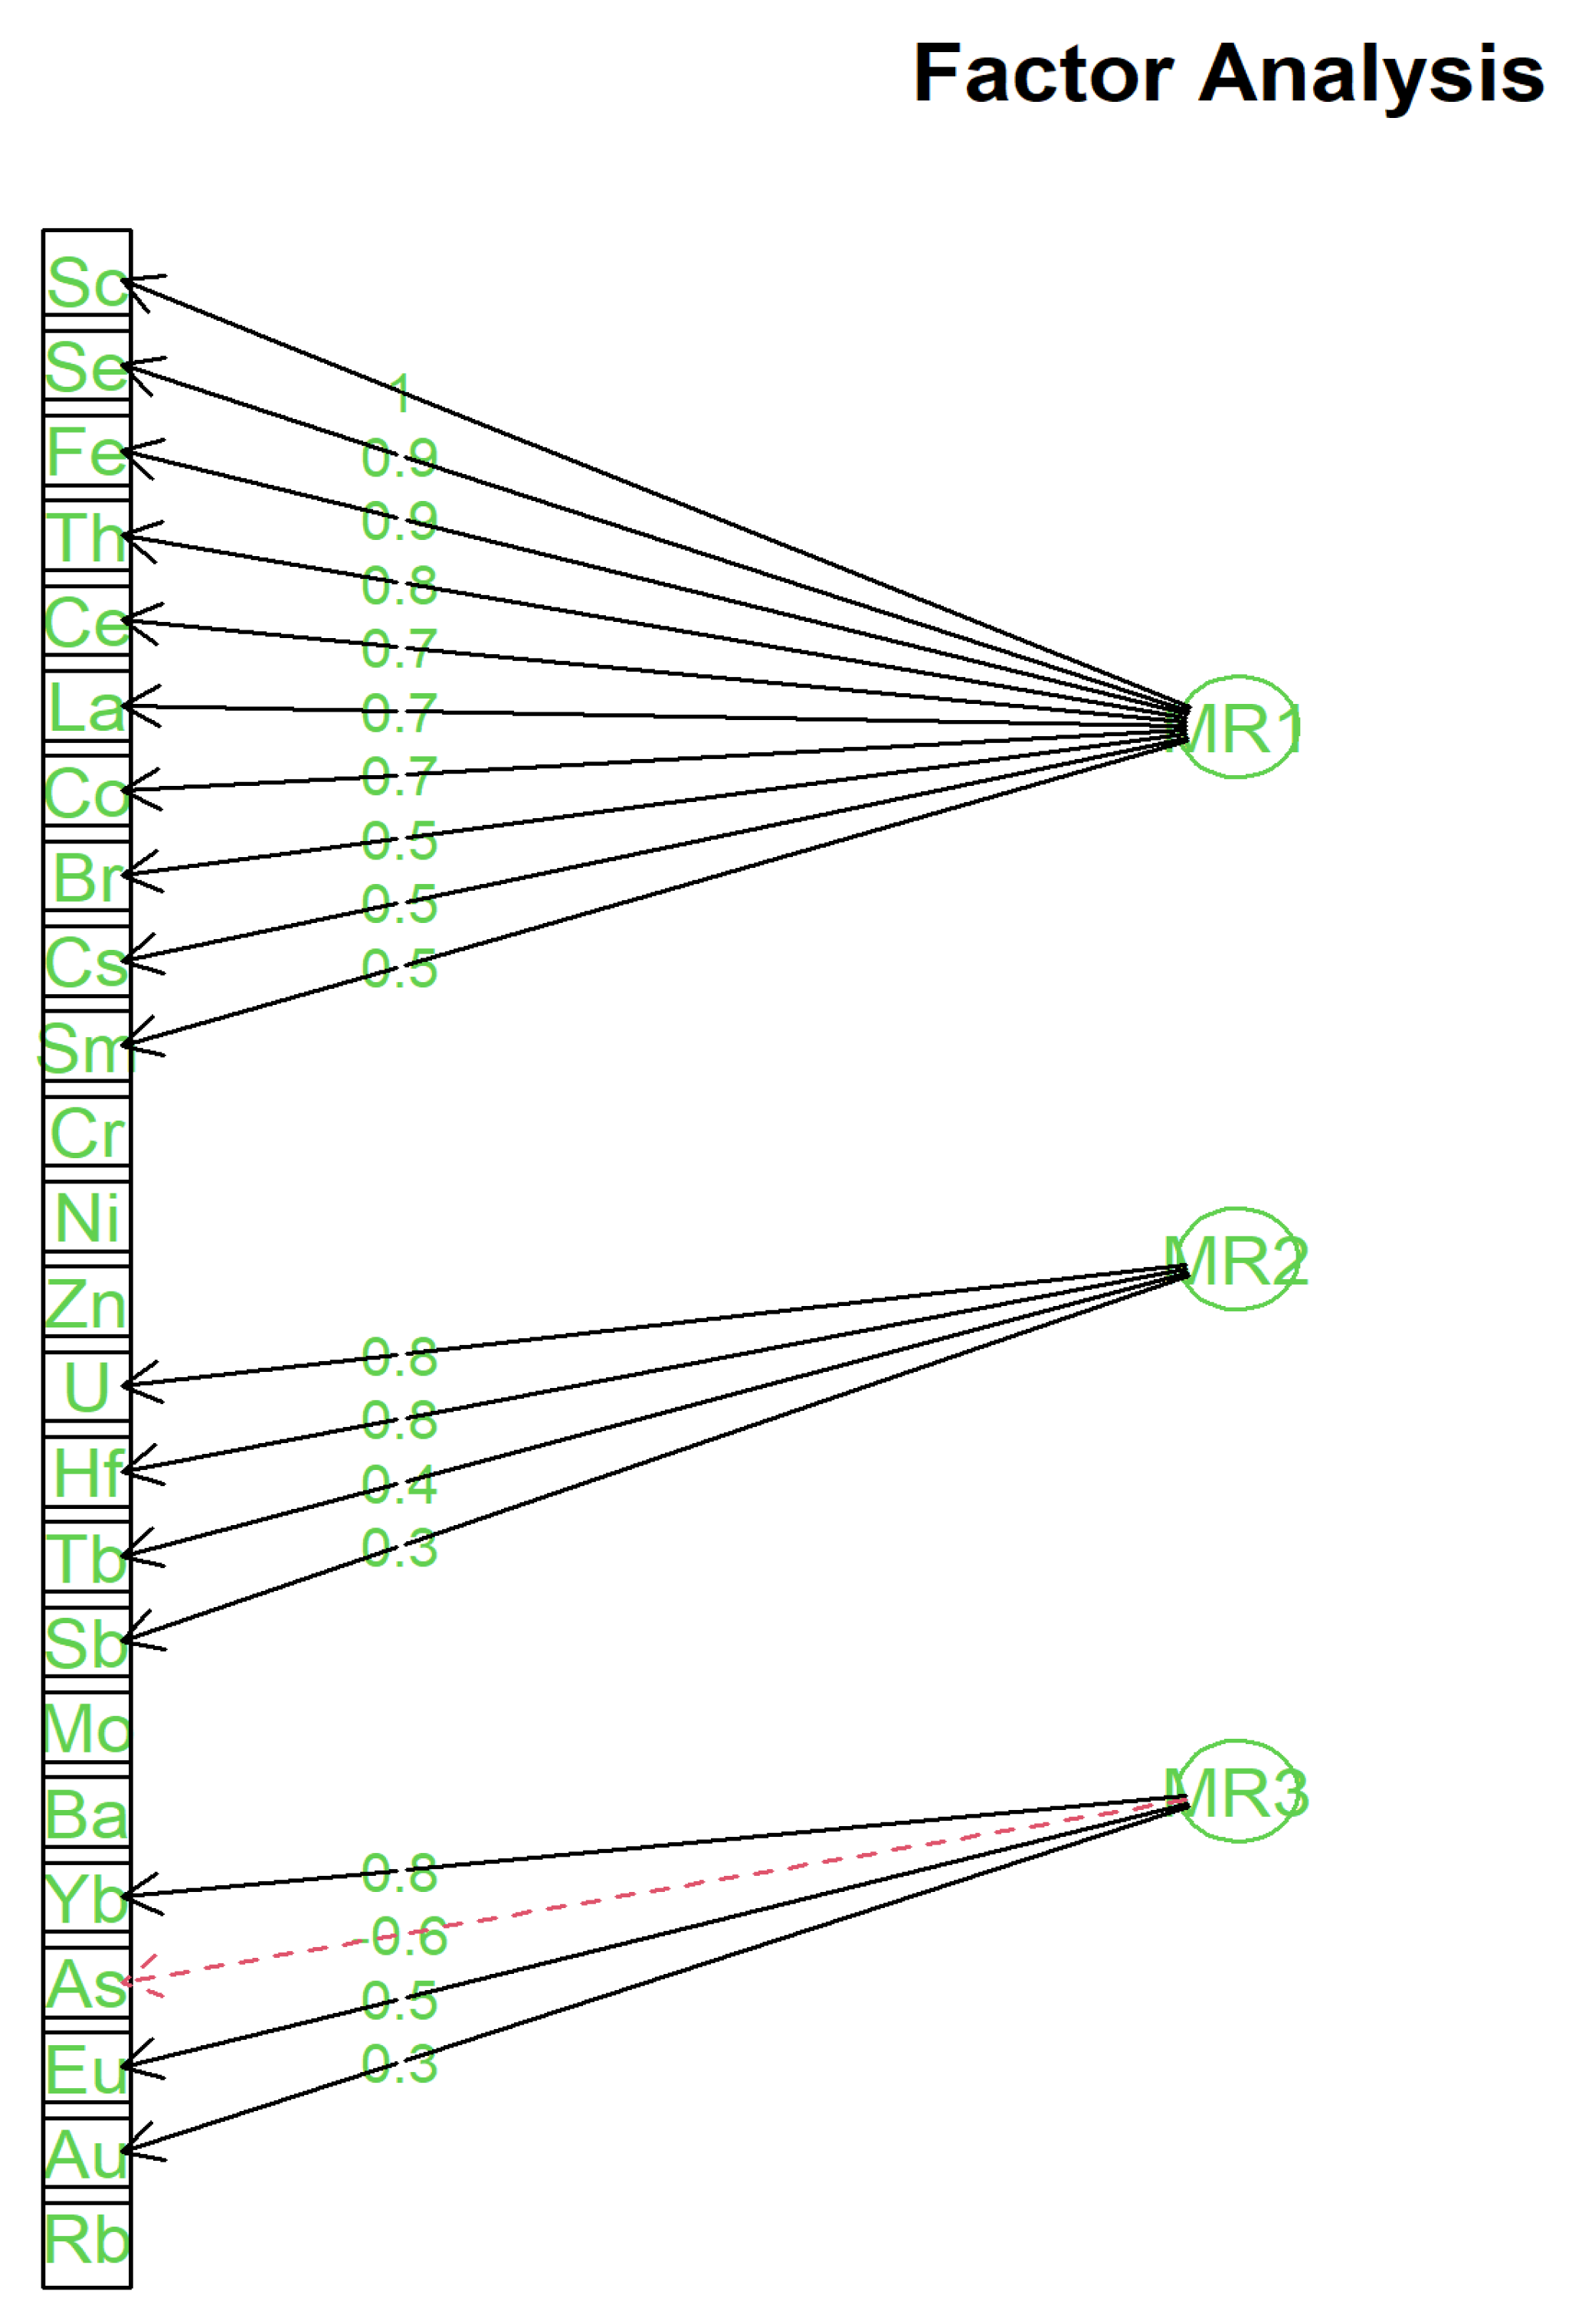
3.4. Exploratory Factor Analyses

Chemical elements in PM10 emitted from the same or similar sources are believed to be intrinsically correlated. Correlated elements were identified to represent the main source contributors to PM10 exposures using exploratory factor analysis. Factor analysis may explore the hidden multivariate structure of the data and may clarify the links between the elements that have similar origin or that subsequently develop similar associations of elements extracted from the correlation matrix. Prior factor analysis and the scree test of eigenvalues was used to extract main factors; three main factors were chosen for the factor analysis (Figure 7).
Exploratory factor analysis using MinRes (minimum residuals) with varimax rotation was used [20]. The factor diagram (Figure 8) shows three factors; the elements vary in how much they load (correlate) with each factor. The first factor is associated with concentrations of Se, Sc, Fe, La, Co, Ce, Br, Th, As, Sm, and Cs. The concentration values of these elements were higher during the low wind speed. Elements such as As, Br, or Se may indicate coal combustion; its concentrations were measured as higher during March, when the temperature is lower and the effects of the local heating plants are reflected in the total concentrations. On the other hand, this factor may also indicate the effects of iron and steelwork. The second factor was characterized by U, Hf, Tb, Sb, Th, and Mo. Concentrations of almost all elements were measured as higher in filters collecting particles from the southeast direction, except for Tb; its highest concentration was measured from the filter collecting particles from the north direction. This result may represent a mixture of the effects of metallurgy and power or heat plants. The third factor is represented by Yb, Eu, Au, Zn, Rb, Cs, Ce, and U. The concentration values of almost all elements were measured as the highest from the filter from the southeast direction, except for Zn, Rb, and Ce, which were measured as higher during low wind speed. This may represent a combination of the effects of iron and steelwork factories and power plants [21,22,23]. The results of the three factors are given in Table 3.

3.5. Discussion

The collection of PM10 on filters in the area of interest using a high-volume sampler began in 2017, and was previously carried out within the Air Border project, focused on cross-border pollution transport [24]. The fact that the facility is located at an altitude of 86 m above ground level allows for special monitoring to characterize the transfer of PM10 particles from different groups of air pollution sources specific to the region, excluding the influence of local sources of pollution, such as transport, construction, or residential emissions [25,26]. However, in the previous study, particles were collected on glass microfiber filters. Analysis showed that this filter selection was not appropriate; the glass fiber filters have high blank values, and for that reason, many elements cannot be used for further analyses. For future measurements, the material of the filters was changed from glass fiber to quartz, which provides more accurate mass values than those provided by either paper or glass fiber (Table 4). Trace contaminants can also arise in field blanks as a result of improper handling, unclean bags or containers used in transportation, and the condition of the sampling apparatus itself. Analytical problems may also arise from trace constituents in the vials.
The study confirmed that the region possesses pollution sources, including two metallurgical complexes (located west and southeast of the sampling site), which increase the pollution in the region, especially during the warmer part of the year, and contribute to the pollution transfer in the higher atmospheric levels. On the contrary, during the winter season, the other specific type of pollution occurring in the region is connected to the transboundary transfer from Poland, which has been confirmed by other studies [27,28,29].

4. Conclusions

The present study was designed to determine the relationship between emissions and pollution transport based on the elemental composition of PM10. Therefore, in the research industrial area, quartz filters were used to collect PM10 for a period of five months. The exposed filters were analyzed for inorganic metal content by subjecting the filters to neutron activation analysis. The mass fractions in mg/kg of 24 elements were determined. A total of 6 out of 24 elements had negative values, as their amounts were lower than the background. Significant values (mg/kg) were noticed for Zn (1843), Rb (932), Cr (929), and Fe (313). The results of the multivariate statistical analysis distinguished the obtained elements on the basis of common geochemical features and classified them among potential sources of pollution—metallurgy, power or heat plants, and coal combustion operations. Therefore, the pollution most likely originated from the metallurgic complex (steel and iron production located in the southeast, and a coking plant, metal foundry, and generation plant located west of the sampling point). These results significantly contribute to the understanding of the ecological situation and air quality in the studied area. This study can serve as a follow-up tool for possible monitoring of the dynamics of the content of metals in the air, which can pose a significant risk to humans and the environment.

Author Contributions

Conceptualization, B.N. and W.M.B.; methodology, O.E.C., M.V.B. and M.O.B.; software, B.N. and W.M.B.; validation, W.M.B. and P.J.; investigation, B.N.; resources, B.N.; data curation, B.N. and W.M.B.; writing—original draft preparation, B.N.; writing—review and editing, P.J. and W.M.B.; visualization, B.N. and W.M.B.; supervision, P.J. and A.Y.D. All authors have read and agreed to the published version of the manuscript.

Funding

This research received no external funding.

Data Availability Statement

Data set available on request to corresponding authors.

Acknowledgments

The authors acknowledge the NOAA Air Resources Laboratory (ARL) for the provision of the HYSPLIT transport and dispersion model used in this publication.

Conflicts of Interest

The authors declare no conflict of interest.

References

  1. Seibert, R.; Nikolova, I.; Volná, V.; Krejčí, B.; Hladký, D. Air Pollution Sources’ Contribution to PM2.5 Concentration in the Northeastern Part of the Czech Republic. Atmosphere 2020, 11, 522. [Google Scholar] [CrossRef]
  2. Hůnová, I. Ambient air quality in the Czech Republic: Past and present. Atmosphere 2020, 11, 214. [Google Scholar] [CrossRef] [Green Version]
  3. Czech Hydrometeorological Institute—Air Pollution Limit Values. Available online: https://www.chmi.cz/files/portal/docs/uoco/isko/info/limity_GB.html (accessed on 16 February 2022).
  4. Ministry of the Environment of the Czech Republic. Program Zlepšování Kvality Ovzduší; Aglomerace Ostrava/Karviná/Frýdek-Místek; Ministry of the Environment of the Czech Republic: Prague, Czech Republic, 2020; pp. 205–253. Available online: https://www.mzp.cz/cz/aktualizace_programu_zlepsovani_kvality_ovzdusi_2020 (accessed on 16 February 2022).
  5. European Environmental Agency. Air Quality Statistics. 2021. Available online: https://www.eea.europa.eu/data-and-maps/dashboards/air-quality-statistics (accessed on 5 October 2021).
  6. Degórska, A.; Juda-Rezler, K.; Toczko, B. Pyły Drobne w Atmosferze: Kompendium Wiedzy o Zanieczyszczeniu Powietrza Pyłem Zawieszonym w Polsce: Praca Zespołowa; Główny Inspektorat Ochrony Środowiska: Warszawa, Poland, 2016.
  7. Pinheiro, T.; Almeida, S.M.; Félix, P.M.; Franco, C.; Garcia, S.M.; Lopes, C.; Bugalho de Almeida, A. Air Quality in Metal Industries: Exhaled Breath Condensate, a Tool for Noninvasive Evaluation of Air Pollution Exposure. In Comprehensive Analytical Chemistry; Elsevier: Amsterdam, The Netherlands, 2016; pp. 731–764. [Google Scholar] [CrossRef]
  8. U.S. Environmental Protection Agency. Compendium of Methods for the Determination of Inorganic Compounds in Ambient Air—Determination of Metals in Ambient Particulate Matter Using Neutron Activation Analysis (NAA) Gamma Spectrometry, Method IO-3.7 Acknowledgments. 1999. Available online: https://www.epa.gov/amtic/compendium-methods-determination-inorganic-compounds-ambient-air (accessed on 15 February 2022).
  9. European Environmental Agency. Suspended Particulates (TSP/SPM). 2008. Available online: https://www.eea.europa.eu/publications/2-9167-057-X/page021.html (accessed on 15 February 2022).
  10. Černikovský, L.; Krejčí, B.; Blažek, Z.; Volná, V. Transboundary air-pollution transport in the Czech-Polish border region between the cities of Ostrava and Katowice. Cent. Eur. J. Public Health 2016, 24, S45–S50. [Google Scholar] [CrossRef] [PubMed] [Green Version]
  11. Jutze, G.A.; Foster, K.E. Recommended standard method for atmospheric sampling of fine particulate matter by filter media—High-volume sampler. J. Air Pollut. Control. Assoc. 1967, 17, 17–25. [Google Scholar] [CrossRef]
  12. Pavlíková, I.; Hladký, D.; Motyka, O.; Vergel, K.N.; Strelkova, L.P.; Shvetsova, M.S. Characterization of PM10 sampled on the top of a former mining tower by the high-volume wind direction-dependent sampler using INNA. Atmosphere 2021, 12, 29. [Google Scholar] [CrossRef]
  13. Environmental Protection Agency. Compendium of Methods for the Determination of Inorganic Compounds in Ambient Air—Selection, Preparation, and Extraction of Filter Material, Method IO-3.1 Acknowledgments. 1999. Available online: https://www.epa.gov/sites/default/files/2015-07/documents/epa-io-3.1.pdf (accessed on 15 February 2022).
  14. European Standard CSN EN 12341; Ambient Air—Standard Gravimetric Measurement Method for the Determination of the PM10 or PM2.5 Mass Concentration of Suspended Particulate Matter. European Standard: Pilsen, Czech Republic, 2014.
  15. Greenberg, R.R.; Bode, P.; Fernandes, A.D. Neutron activation analysis: A primary method of measurement. Spectrochem. Acta Part B 2011, 66, 193–241. [Google Scholar] [CrossRef]
  16. Dmitriev, A.Y.; Pavlov, S.S. Automation of the quantitative determination of elemental content in samples using neutron activation analysis on the IBR-2 reactor at the frank laboratory for neutron physics, joint institute for nuclear research. Phys. Part. Nucl. Lett. 2013, 10, 33–36. [Google Scholar] [CrossRef]
  17. U.S. Environmetal Protection Agency. Compendium of Methods for the Determination of Inorganic Compounds in Ambient Air—Samplimg of Ambient Air for Total Suspended Particulate Matter (SPM) and PM10 Using high Volume (HV) Sampler, Method IO-2.1 Acknowledgments. 1999. Available online: https://www.epa.gov/sites/default/files/2019-11/documents/mthd-2-1.pdf (accessed on 5 February 2022).
  18. International Atomic Energy Agency. Training Course Series No. 4; Sampling and Analytical Methodologies for Instrumental Neutron Activation Analysis of Airborne Particulate Matter; IAEA: Vienna, Austria, 1992; Available online: https://inis.iaea.org/collection/NCLCollectionStore/_Public/32/042/32042418.pdf (accessed on 15 February 2022).
  19. Costello, A.B.; Osborne, J.W. Best Practices in Exploratory Factor Analysis: Four Recommendations for Getting the Most from Your Analysis. Pract. Assess. Res. Eval. 2005, 10, 9. Available online: https://scholarworks.umass.edu/cgi/viewcontent.cgi?article=1156&context=pare (accessed on 1 February 2022).
  20. Revelle, W.; Procedures for Psychological, Psychometric, and Personality Research. 2021, p. 412. Available online: https://personality-project.org/r/psych-manual.pdf (accessed on 14 December 2021).
  21. Juda-Rezler, K.; Reizer, M.; Maciejewska, K.; Błaszczak, B.; Klejnowski, K. Characterization of atmospheric PM2.5 sources at a Central European urban background site. Sci. Total Environ. 2020, 713, 136729. Available online: https://www.sciencedirect.com/science/article/pii/S0048969720302394 (accessed on 15 February 2022). [CrossRef] [PubMed]
  22. Bozlaker, A.; Chellam, S. Measurement of the Trace Element Composition of Airborne Particulate Matter and its Use in Source Apportionment: Case studies of Lanthanoids and Platinum Group Metals from Houston, Texas. In Trace Materials in Air, Soil, and Water; ACS Symposium Series; American Chemical Society: Washington, DC, USA, 2015; pp. 1–34. [Google Scholar]
  23. Leoni, C.; Pokorná, P.; Hovorka, J.; Masiol, M.; Topinka, J.; Zhao, Y.; Cliff, S.; Ska, P.; Hopke, P.; Krumal, K. Source apportionment of aerosol particles at a European air pollution hot spot using particle number size distributions and chemical composition. Environ. Pollut. 2018, 234, 145–154. [Google Scholar] [CrossRef] [PubMed]
  24. Air Border—Společná Česko-Polská Měření Přeshraničního Přenosu Znečišťujících látek v Ovzduší. Available online: http://airborder.vsb.cz/cs/ (accessed on 10 December 2021).
  25. Pešek, J.; Bencko, V.; Sýkorová, I.; Vašíček, M.; Michna, O.; Martínek, K. Some trace elements in coal of the Czech Republic, environment and health protection implications. Cent. Eur. J. Public Health 2005, 13, 153–158. Available online: https://cejph.szu.cz/pdfs/cjp/2005/03/13.pdf (accessed on 20 December 2021). [PubMed]
  26. Colombi, C.; Gianelle, V.; Belis, C.; Larsen, B. Determination of Local Source Profile for Soil Dust, Brake Dust and Biomass Burning Sources. Chem. Eng. Trans. 2010, 22, 133–238. Available online: https://www.researchgate.net/publication/236952884_Determination_of_Local_Source_Profile_for_Soil_Dust_Brake_Dust_and_Biomass_Burning_Sources (accessed on 31 January 2022).
  27. Svozilík, V.; Svozilíková Krakovská, A.; Bitta, J.; Lacková, E.; Jančík, P. Characterization of Air Pollution in Moravia-Silesia Region. In Proceedings of the 16th International Multidisciplinary Scientific GeoConference, SGEM, Vienna, Austria, 2–5 November 2016. [Google Scholar]
  28. Krejčí, B.; Černikovský, L.; Blažek, Z.; Krajny, E.; Ośródka, L. Meteorological conditions and air pollution in the border area of Moravia and Silesia. In Proceedings of the IX Miedzynarodowa Konferencja Naukowa “Ochrona Powietrza w Teorii I Praktyce”, Zakopane, Poland, 22–25 October 2014. [Google Scholar]
  29. Volná, V.; Hladký, D. Detailed Assessment of the Effects of Meteorological Conditions on PM10 Concentrations in the Northeastern Part of the Czech Republic. Atmosphere 2020, 11, 497. [Google Scholar] [CrossRef]
Figure 1. The annual mean of particulate matter PM10 in 2019 in the area of interest (Northeast Czech Republic) [5].
Atmosphere 13 00479 g001
Figure 2. The high-volume sampler SAM Hi 30 AUTO WIND.
Atmosphere 13 00479 g002
Figure 3. Scheme of PM standard sampler [13].
Atmosphere 13 00479 g003
Figure 4. (a) A packed set of exposed filter samples, and (b) the preparation of samples using the special automatic punching head.
Atmosphere 13 00479 g004
Figure 5. Wind roses for September and December 2019; values were measured at 86 m above the ground level.
Atmosphere 13 00479 g005
Figure 6. The correlation matrix of elements measured from the September filters.
Atmosphere 13 00479 g006
Figure 7. Scree test of eigenvalues.
Atmosphere 13 00479 g007
Figure 8. The exploratory factor analysis of samples of elemental exposure to PM10 divided based on the factor loadings. All variables were analyzed as mass fractions (μg/kg).
Atmosphere 13 00479 g008
Table 1. Basic statistics for data (wind speed WS [ms−1] and temperature T [°C]) were measured by hi-vol during the period of time from March to July 2021.
VariablesWST
Min0.1−4.3
1st Qu.2.55.6
Median4.112.1
Mean4.412.38
3rd Qu.5.919.2
Max1832.2
Table 2. Descriptive statistics of the obtained mass fractions mg/kg, n = 49.
ElementMean ± SD *Median ± MadSkewKurtosisWp-Value
Sc0.028 ± 0.030.018 ± 0.011.672.620.80880.0000
Cr929.67 ± 6522.880.70 ± 3.476.5842.120.12780.0000
Fe313.3 ± 311.74251.20 ± 221.651.714.100.85830.00003
Co0.094 ± 0.150.084 ± 0.150.820.620.94570.02496
Zn1843.06 ± 8855.5730.80 ± 22.394.5018.630.20320.00000
Se0.557 ± 0.460.442 ± 0.401.332.080.88000.00013
As0.932 ± 1.200.553 ± 0.821.492.230.81420.000002
Br2.98 ± 2.722.018 ± 1.691.683.460.84530.00001
Rb932.29 ± 6522.500.49 ± 0.736.5842.120.12730.0000
Sb1.869 ± 6.650.832 ± 0.586.4240.740.20270.0000
Cs0.045 ± 0.060.000 ± 0.001.552.290.75940.0000
La0.042 ± 0.150.068 ± 0.17−0.570.430.96310.1275
Ce0.145 ± 0.420.082 ± 0.280.280.130.96890.2196
Sm0.015 ± 0.020.015 ± 0.01−0.08−0.530.97850.5058
Eu0.0023 ± 0.020.000 ± 0.001.575.140.75450.0000
Hf0.025 ± 0.030.021 ± 0.040.40−0.590.97080.2624
Au0.0001 ± 0.000.000 ± 0.001.782.460.71170.0000
Th0.018 ± 0.030.018 ± 0.021.243.420.92080.00284
* Ni, Mo, Ba, Tb, Yb, and U reveal negative values because their mass fractions are lower than the background values. These elements were eliminated from the table of results; however, they were statistically treated prior to the implementation of statistical analysis.
Table 3. The factor loadings based on the correlation matrix.
ElementFactor 1Factor 2Factor 3
Sc 0.96 0.110.02
Cr0.180.170.02
Fe0.910.010.10
Ni−0.16−0.13−0.16
Co 0.67 −0.21−0.04
Zn−0.13−0.080.11
Se 0.92 −0.06−0.18
As0.53−0.19−0.56
Br0.54−0.41−0.52
Rb0.21−0.040.25
Mo−0.130.25−0.10
Sb−0.120.30−0.15
Ba0.06−0.16−0.11
Cs0.500.030.25
La 0.73 −0.160.17
Ce 0.73 0.020.34
Sm0.46−0.09−0.06
Eu0.080.330.51
Tb−0.070.38−0.18
Yb0.25−0.31 0.82
Hf0.16 0.80 −0.29
Au0.06−0.080.33
Th 0.75 0.510.00
U−0.08 0.83 0.12
Table 4. The mass fractions [mg/kg] of elements determined from the filters made of quartz or glass fibers. The field blank, unlike the other filters, undergoes the entire process of a sample, except it is not exposed to the sampling position.
ElementsQuartz FiltersFiberglass FiltersField Blanks (Fiberglass Filters)
Na501.7115,066.777,550.0
K28.625,866.726,450.0
Sc0.010.150.31
Cr11.312.114.9
Fe51.2--
Ni3.9--
Co0.070.770.60
Zn7.224,900.034,850.0
As0.054.924.94
Br0.07--
Rb0.115.022.2
Sr-622.0913.0
Zr9.5154.7272.0
Mo27.6--
Sb0.060.870.60
Ba17.836,866.752,600.0
Cs-0.20.2
La0.21.31.3
Ce0.62.82.2
Nd0.2-72.5
Sm0.140.450.14
Eu0.010.130.29
Tb0.040.080.09
Yb0.070.400.55
Hf0.293.315.98
W0.12.76.1
Au0.0002--
Th0.260.230.40
U0.46-1.72
Hg--12.8
Publisher’s Note: MDPI stays neutral with regard to jurisdictional claims in published maps and institutional affiliations.

