Article

Indoor Radon Monitoring in Kindergarten and Primary Schools in South Italy

1
Advanced Biomedical Sciences Department, University of Naples Federico II, 80131 Naple, Italy
2
Advanced Metrological and Technological Services (CeSMA), University of Naples, 80138 Naples, Italy
3
National Nuclear Research Institute, Ghana Atomic Energy Commission, Accra GW-0373-819, Ghana
4
Analist Group SRL, 83100 Avellino, Italy
*
Author to whom correspondence should be addressed.
Atmosphere 2022, 13(3), 478; https://doi.org/10.3390/atmos13030478
Submission received: 7 February 2022 / Revised: 10 March 2022 / Accepted: 11 March 2022 / Published: 15 March 2022

Abstract

:
Humans are mostly exposed to ionizing radiation through radon and its decay products. The results of indoor radon measurements in 39 kindergartens and primary schools in the Campania region of southern Italy are presented in this paper. The survey was carried out with CR-39 solid-state nuclear track detectors (SSNTDs). Radon concentrations were measured and ranged from 11 to 1416 Bq/m3, with a geometric mean of 77 Bq/m3 and a geometric standard deviation of 2. The findings revealed that 70% of the measures were below the WHO recommended level of 100 Bq/m3 and that 97 percent of the measurements were below the 300 Bq/m3 level set by Italian law.

1. Introduction

Radon is a colorless, odorless, and chemically inert radioactive gas belonging to the radioactive chain of 238U. Radon is originated from the soil and other materials containing 226Ra; that is its predecessor. A fraction of the emanated radon escapes into the outdoor atmosphere where it is quickly diluted. On the contrary, in confined spaces, such as homes and office buildings, radon can accumulate to harmful levels. As a result, radon and its decay products are regarded as the primary source of ionizing radiation exposure for the general population [1,2].
Several epidemiological studies have found a statistically significant link between radon exposure and lung cancer risk [3,4,5,6,7]. The carcinogenic mechanism is mainly attributable to inhalation and deposition of short-lived radon decay products that emit alpha particles that irradiate the bronchial epithelium. Worldwide, many studies have been conducted to monitor the radon concentrations in homes, workplaces, and schools [2]. In Italy, only one national survey has been carried out that investigated radon concentrations in dwellings in the early 1990s [8], while other studies were performed but only at the local scale in homes and workplaces [9,10,11,12,13,14,15,16]. Unlike other European nations, such as Ireland [17], the Slovak Republic [18], and Belgium [19], no nationwide survey to quantify the radiological risk in schools has been conducted in Italy. For at least two reasons, the radon danger to children could be high. First, children are more sensitive to ionizing radiation than adults; second, children spend a significant amount of time in school. In July 2020, Italy issued the Legislative Decree 101/2020 [20] which transposes the European Directive 59/2013 [21] and establishes a reference level of 300 Bq/m3 for existing homes and workplaces, including schools such as kindergartens and primary schools.
The aim of the present study was to measure the radon concentration in 39 public kindergartens and primary schools in Campania, southern Italy. The association between the floor of the monitored room and concentration levels across rooms belonging to various buildings were investigated. The radon concentrations were also compared to the national and WHO reference levels.

2. Materials and Methods

The survey was coordinated by the Radioactivity laboratory lab.Rad –CeSMA of the University of Naples Federico II, Italy. The study area is located in the Campania region, southern Italy, in an urban area extending over approximately 43 km2 and with a population of approximately 80,000 inhabitants. This area is affected by frequent phenomena of bradyseism due to the volcanic activity in the subsoil. This phenomenon, in alternating ascending and descending phases, has affected the entire area since the 2nd century BC until today. A total of 39 kindergartens and primary schools participated in the measurements which took place from February 2020 to February 2021. The number of classrooms observed in each school was determined by the school’s size, with a total of 525 classrooms tracked. There were 13 classrooms in the basement, 492 on the ground floor, and 20 on the second floor that were monitored. The long-term measuring technique employed in this work was based on passive alpha detectors (SSNTDs) CR-39. Each CR-39 detector was placed in a closed holder that allowed to prevent the entry of particulates and decay products. The holder had a diameter of 50 mm and a height of 20 mm. The dimensions of the CR 39 were 25 × 25 mm2.
Two detectors in each classroom were exposed for two semesters in order to obtain a full year of exposure. The return rate of the CR-39 detectors was 98% for the first semester and 99% for the second semester. Radon measurements were conducted according to the UNI ISO 11665-4:2021 standard [22]. CR-39 detectors were positioned at approximately 2 m from the floor and at 30 cm from the internal wall in order not to record the contribution from thoron. After exposure, all CR-39 detectors were chemically etched using a solution of 6.25 M NaOH at 98 ± 1 °C for 60 min. The automatic counting of the tracks’ density was performed by a means Politrack system (mi.am s.r.l., Rivergaro, PC, Italy). It consisted of an automated microscopic image analyzer equipped with a control computer and track analysis software. The radon concentration was calculated using Equation (1):
C R n = N E × T
where N is the track density corrected by background track density, E is the calibration factor, and T is the exposure time. The background track density was estimated to be 10 tracks/cm2, and it was determined counting the tracks of a significant number of unexposed CR-39. The calibration factor was determined by exposing the detectors at a certified atmosphere in the range of exposure from 100 to 3000 kBq h m−3 at the National Metrological Institute (ENEA). The detection limit (LLD) of the method was estimated to be 4 Bq/m3 (with an exposure time of approximately 4000 h). To obtain the annual average radon concentration, the time-weighted average radon concentration from two consecutive six-month periods was calculated using exposure time as weights as in the following formula:
C R n T =   Δ t 1   × C R n 1 + Δ t 2   × C R n 2 Δ t 1 + Δ t 2
where Δt1 and Δt2 are the exposure time of two semesters, and CRn1 and CRn2 are the integrated measured radon concentrations in the two semesters.

3. Statistical Analysis

The geometric mean, geometric standard deviation, median, minimum, and maximum were determined as part of the descriptive analysis. Because the radon readings’ distribution was skewed, the geometric mean was utilized to describe their central tendency. The radon concentration values were not adjusted for the season. After data logarithmic transformation, the Shapiro–Wilk test was used to check for log-normality in the radon concentration distribution. Bartlett’s test was used to determine whether the variance was homogeneous. The Student’s t-test was used to compare two groups of data that had been log-transformed. The ANOVA test was used to compare the results of several groups. The Stata software was used to conduct all statistical analyses (Stata Corp., College Station, TX, USA).

4. Results and Discussion

The monitoring of radon in schools is generally complex, as it is not always possible to guarantee that the detectors are kept safely in the place of monitoring. In the present study, after exposure, the return rate of the CR-39 detectors was 98% for the first semester and 99% for the second semester. These excellent results were possible thanks to the involvement of teachers and the entire research group in the management of the CR-39 devices. In addition, the survey was conducted in a period in which public opinion was focused on the radon risk in Italy due to the introduction of the Legislative Decree 101/20 that acknowledges the references limit of Directive 59/2013.
The frequency distribution of the radon concentrations measured in 39 schools is shown in Figure 1. Although the experimental data appear to follow an approximately log-normal distribution, the Shapiro–Wilk test failed to assess normality (p-value < 0.001).
The radon concentrations in the schools ranged from 11 to 1416 Bq/m3, with a geometric mean of 77 Bq/m3, a geometric standard deviation of 2, and a median of 74 Bq/m3. The current investigation demonstrated lower indoor radon concentrations than earlier Italian studies in schools [23]. Instead, the mean radon concentration of 98 Bq/m3 recorded in this study was lower than in recent European studies conducted in Greece [24,25] and Croatia [26]. The results of the current investigation demonstrated a statistically significant difference (p < 0.001) between radon concentrations measured in two consecutive semesters. Unlike other studies conducted in schools and dwelling [27,28,29], our findings show radon concentrations measured in the spring–summer semester were higher than those measured in the autumn–winter semester. This result could be attributed to the fact that, in Italy, in the period March–September 2020, the schools were closed first for the COVID health emergency and then for the summer. This may have contributed to a build-up of radon in the monitored classrooms during this period.
Interpreting the results according the national Italian and according to the WHO criteria [30], they were divided in <100, 100–300, and >300 Bq/m3.
As shown in Table 1, 97% of the monitored classrooms had a radon concentration below the reference level imposed by national law, set at 300 Bq/m3. This result could be attributed to the fact that the monitored schools were built after 1980. The construction period affects the construction type (e.g., the ground connection, size of window openings, and choice of building materials), which may not facilitate the accumulation of radon in confined spaces.
Indoor radon concentrations are known to be altered by a variety of factors including the age of the home, floor level, and building materials. To investigate the impact of floor level, the observed classrooms were divided into three categories: underground, ground floor, and second floor. Figure 2 depicts the variation in radon concentrations as a function of floor level.
The statistical study revealed that radon concentrations underground were considerably greater than those at ground and higher levels (p < 0.01). Furthermore, the Bonferroni post hoc test revealed that the difference in mean radon concentrations on the ground floor and underground were not statistically significant at the 95% confidence level (p = 0.02). This result is consistent with the findings of other researchers [31,32]. The largest radon concentrations were found in the basement and ground level, which can be related to the fact that radon is primarily produced in the soil, and it accumulates in lower floors of structures. The distribution of the median radon concentrations observed on the ground level in the monitored schools is depicted in Figure 3. Only one school, as shown in the graph, had radon concentrations above the Italian legislation’s recommended reference level of 300 Bq/m3. The variation in radon levels within each school was also investigated using the floor factor. The coefficient of variation of radon concentrations (COV) was determined for each floor and school to examine the room-to-room radon variation on the same floor within each school. There were 38 classrooms on the ground floor, two in the basement, and one on the second floor of the schools monitored. For the basement, ground floor, and second floor, the mean COV was 11 percent, 9 percent, and 43 percent, respectively.
The differences in the radon concentrations observed in the classrooms on the same floor of each school could be attributable to varied lifestyles within them, such as the frequency with which windows are opened, which contributes to different radon accumulation in the environment. This is especially noticeable in the variation discovered across classrooms on the second floor (43 percent), which were further away from the ground. Although this conclusion is based on a COV derived for a school with 20 monitored classrooms, it shows that the contribution to radon concentration variability on higher floors than the bottom floor may be primarily influenced by variables other than proximity to the ground. The key drawback is that no information on the other parameters impacting indoor radon concentrations could be obtained to correlate them to the major characteristics of the structures such as construction age and building materials. The radon concentration measurements in this study were carried out using a quality assurance system according to the UNI EN ISO 9001:2015 standard, and the radon concentration data collected in this study could contribute to the creation of a radon map of Campania and the validation of new analysis methods on the correlation between radon concentrations and geology [33].

5. Conclusions

A total of 525 radon measurements were taken in 39 kindergartens and primary schools in the Campania region, which is plagued by frequent bradyseism due to the volcanic activity in the subsoil. Ninety-seven percent of radon concentrations examined were determined to be below the national law’s limit of 300 Bq/m3. A quality assurance system was used to conduct the radon concentration measurements. The results revealed substantial radon concentration variations from room to room.

Author Contributions

Conceptualization, M.Q. and F.L.; Formal analysis, M.Q.; Investigation, G.M.; Data curation F.L. and I.O.-N.; Writing—original draft preparation, M.Q.; Writing—review and editing M.Q., F.L. and I.O.-N.; Funding acquisition M.Q. and F.L. All authors have read and agreed to the published version of the manuscript.

Funding

This research received no external funding.

Institutional Review Board Statement

Not applicable.

Informed Consent Statement

Not applicable.

Data Availability Statement

The data presented in this study are available on request from the corresponding author.

Conflicts of Interest

The authors declare no conflict of interest.

References

  1. UNSCEAR (United Nations Scientific Committee on the Effects of Atomic Radiation). Sources and Effects of Ionizing Radiation. In Report to the General Assembly; United Nations: New York, NY, USA, 1993. [Google Scholar]
  2. UNSCEAR (United Nations Scientific Committee on the Effects of Atomic Radiation). Sources and Effects of Ionizing Radiation. In Report to the General Assembly; United Nations: New York, NY, USA, 2000. [Google Scholar]
  3. Lubin, J.H.; Wang, Z.Y.; Boice, J.D.J.; Zhao, Y.X.; Blot, W.J.; De Wang, L.; Kleinerman, R.A. Risk of lung cancer and residential radon in China: Pooled results of two studies. Int. J. Cancer 2004, 109, 132–137. [Google Scholar] [CrossRef] [PubMed]
  4. Bochicchio, F.; Forastiere, F.; Farchi, S.; Quarto, M.; Axelson, O. Residential radon exposure, diet and lung cancer: A case-control study in a Mediterranean region. Int. J. Cancer 2005, 114, 983–991. [Google Scholar] [CrossRef]
  5. Darby, S.; Hill, D.; Auvinen, A.; Barros-Dios, J.M.; Baysson, H.; Bochicchio, F.; Deo, H.; Falk, R.; Forastiere, F.; Hakama, M.; et al. Radon in homes and lung cancer risk: Collaborative analysis of individual data from 13 European case-control studies. Br. Med. J. 2005, 330, 223–226. [Google Scholar] [CrossRef] [Green Version]
  6. Krewski, D.; Lubin, J.H.; Zielinski, J.M.; Alavanja, M.; Catalan, V.S.; Field, R.W.; Klotz, J.B.; Le’ Tourneau, E.G.; Lynch, C.F.; Lyon, J.L.; et al. A combined analysis of North American case–control studies of residential radon and lung cancer. J. Toxicol. Environ. Health A 2006, 69, 7–8, 533–597. [Google Scholar] [CrossRef] [Green Version]
  7. Garzillo, C.; Pugliese, M.; Loffredo, F.; Quarto, M. Indoor radon exposure and lung cancer risk: A meta-analysis of case-control studies. Transl. Cancer Res. 2017, 6, S934–S943. [Google Scholar] [CrossRef]
  8. Bochicchio, F.; Campos Venuti, G.; Nucciatelli, C.; Piermattei, S.; Risica, S.; Tommasino, L.; Torri, G. Results of the representative Italian national survey on radon indoors. Health Phys. 1996, 71, 721–748. [Google Scholar] [CrossRef] [PubMed]
  9. Quarto, M.; Pugliese, M.; Loffredo, F.; Zambella, C.; Roca, V. Radon measurements and Effective Dose from Radon Inhalation estimation in the Neapolitan Catacombs. Radiat. Prot. Dosim. 2014, 158, 442–446. [Google Scholar] [CrossRef]
  10. Trevisi, R.; Orlando, C.; Orlando, P.; Amici, M.; Simeoni, C. Radon levels in underground workplaces-results of a nationwide survey in Italy. Rad. Meas. 2012, 47, 178–181. [Google Scholar] [CrossRef]
  11. Trevisi, R.; Caricato, A.; D’Alessandro, M.; Fernández, M.; Leonardi, F.; Luches, A.; Tonnarini, S.; Veschetti, M. A pilot study on natural radioactivity in schools of south-east Italy. Environ. Int. 2010, 36, 276–280. [Google Scholar] [CrossRef] [PubMed]
  12. Venoso, G.; De Cicco, F.; Flores, B.; Gialanella, L.; Pugliese, M.; Roca, V.; Sabbarese, C. Radon concentrations in schools of the Neapolitan area. Rad. Meas. 2009, 44, 127–130. [Google Scholar] [CrossRef]
  13. Catalano, R.; Immè, G.; Mangano, G.; Morelli, D.; Rosselli Tazzer, A. Indoor radon survey in Eastern Sicily. Rad. Meas. 2012, 47, 105–110. [Google Scholar] [CrossRef]
  14. Pugliese, M.; Quarto, M.; Roca, V. Radon concentrations in air and water in the thermal spas of Ischia Island. Indoor Built Environ. 2014, 23, 823–827. [Google Scholar] [CrossRef] [Green Version]
  15. Quarto, M.; Pugliese, M.; Loffredo, F.; La Verde, G.; Roca, V. Indoor radon activity concentration measurements in the great historical museums of University of Naples, Italy. Radiat. Prot. Dosim. 2016, 168, 116–123. [Google Scholar] [CrossRef] [PubMed]
  16. Quarto, M.; Pugliese, M.; Loffredo, F.; Roca, V. Indoor radon concentration and gamma dose rate in dwellings of the Province of Naples, South Italy, and estimation of the effective dose to the inhabitants. Radioprotection 2016, 51, 31–36. [Google Scholar] [CrossRef] [Green Version]
  17. Synnott, H.; Hanley, O.; Fenton, D.; Colgan, P. A Radon in Irish schools: The results of a national survey. J. Radiol. Prot. 2006, 26, 85–96. [Google Scholar] [CrossRef] [PubMed]
  18. Durcik, M.; Havlik, F.; Vicanova, M.; Nikodemova, D. Radon risk assessment in Slovak kindergartens and basic schools. Radiat. Prot. Dosim. 1997, 71, 201–206. [Google Scholar] [CrossRef]
  19. Poffijn, A.; Uyttenhove, J.; Drouget, B.; Tondeur, F. The radon problem in schools and public buildings in Belgium. Radiat. Prot. Dosim. 1992, 45, 499–501. [Google Scholar] [CrossRef]
  20. Decreto Legislativo 31 Luglio 2020, n. 101. (In Italian). Available online: https://www.gazzettaufficiale.it/eli/id/2020/08/12/20G00121/sg (accessed on 5 February 2022).
  21. European Directive 59/2013, European Commission 2013. Available online: https://eur-lex.europa.eu/eli/dir/2013/59/oj (accessed on 5 February 2022).
  22. UNI ISO 11665-4:2021. Available online: https://store.uni.com (accessed on 5 February 2022).
  23. Trevisi, R.; Leonardi, F.; Simeoni, C.; Tonnarini, S.; Veschetti, M. Indoor radon levels in schools of South-East Italy. J. Environ. Rad. 2012, 112, 160–164. [Google Scholar] [CrossRef]
  24. Papaefthymiou, C.; Georgiou, G. Indoor radon levels in primary schools of Patras, Greece. Radiat. Prot. Dosim. 2007, 124, 172–176. [Google Scholar] [CrossRef] [PubMed]
  25. Clouvas, A.; Takoudis, G.; Xanthos, S.; Potiriadis, C.; Kolovou, M. Inddor radon measurements in areas of Northern Greece with relatively high inddor radon concentrations. Radiat. Prot. Dosim. 2009, 136, 127–131. [Google Scholar] [CrossRef]
  26. Planinic, J.; Smit, G.; Faj, Z.; Suveljak, B.; Vukovic, B.; Radolic, V. Radon in schools and dwellings of Osijek. J. Rad. Nucl. Chem. 1995, 191, 45–51. [Google Scholar] [CrossRef]
  27. Műllerová, M.; Mazur, J.; Csordás, A.; Holý, K.; Grządziel, D.; Kovács, T.; Kozak, K.; Smetanová, I.; Danyłec, K.; Kureková, P.; et al. Radon survey in the kindergartens of three Visegrad countries (Hungary, Poland and Slovakia. J. Rad. Nucl. Chem. 2019, 319, 1045–1050. [Google Scholar] [CrossRef]
  28. Celebi, N.; Ataksor, B.; Taskın, H.; Albayrak Bingoldag, N. Indoor radon measurements in Turkey dwellings. Radiat. Prot. Dosim. 2014, 167, 626–632. [Google Scholar] [CrossRef]
  29. Baltrenas, P.; Grubliauskas, R.; Vaidotas, D. Seasonal Variation of Indoor Radon Concentration Levels in Different Premises of a University Building. Sustainability 2020, 12, 6174. [Google Scholar] [CrossRef]
  30. World Health Organization. WHO Handbook on Radon: A public Health Perspective; Hajo, Z., Ferid, S., Eds.; World Health Organization: Geneva, Switzerland, 2009; ISBN 9789241547673. [Google Scholar]
  31. Madureira, J.; Paciencia, I.; Rufo, J.; Moreira, A.; de Oliveira Fernandes, E.; Pereira, A. Radon in indoor air of primary schools: Determinant factors, their variability and effective dose. Environ. Geochem. Health 2016, 38, 23–533. [Google Scholar] [CrossRef] [PubMed]
  32. Ivanova, Z.; Stojanovska, Z.; Djunakova, D.; Djounova, J. Analysis of the spatial distribution of the indoor radon concentration in school’s buildings in Plovdiv province, Bulgaria. Build. Environ. 2021, 204, 108122. [Google Scholar] [CrossRef]
  33. Loffredo, F.; Scala, A.; Adinolfi, G.M.; Savino, F.; Quarto, M. A new geostatistical tool for the analysis of the geographical variability of the indoor radon activity. Nukleonika 2020, 65, 99–104. [Google Scholar] [CrossRef]
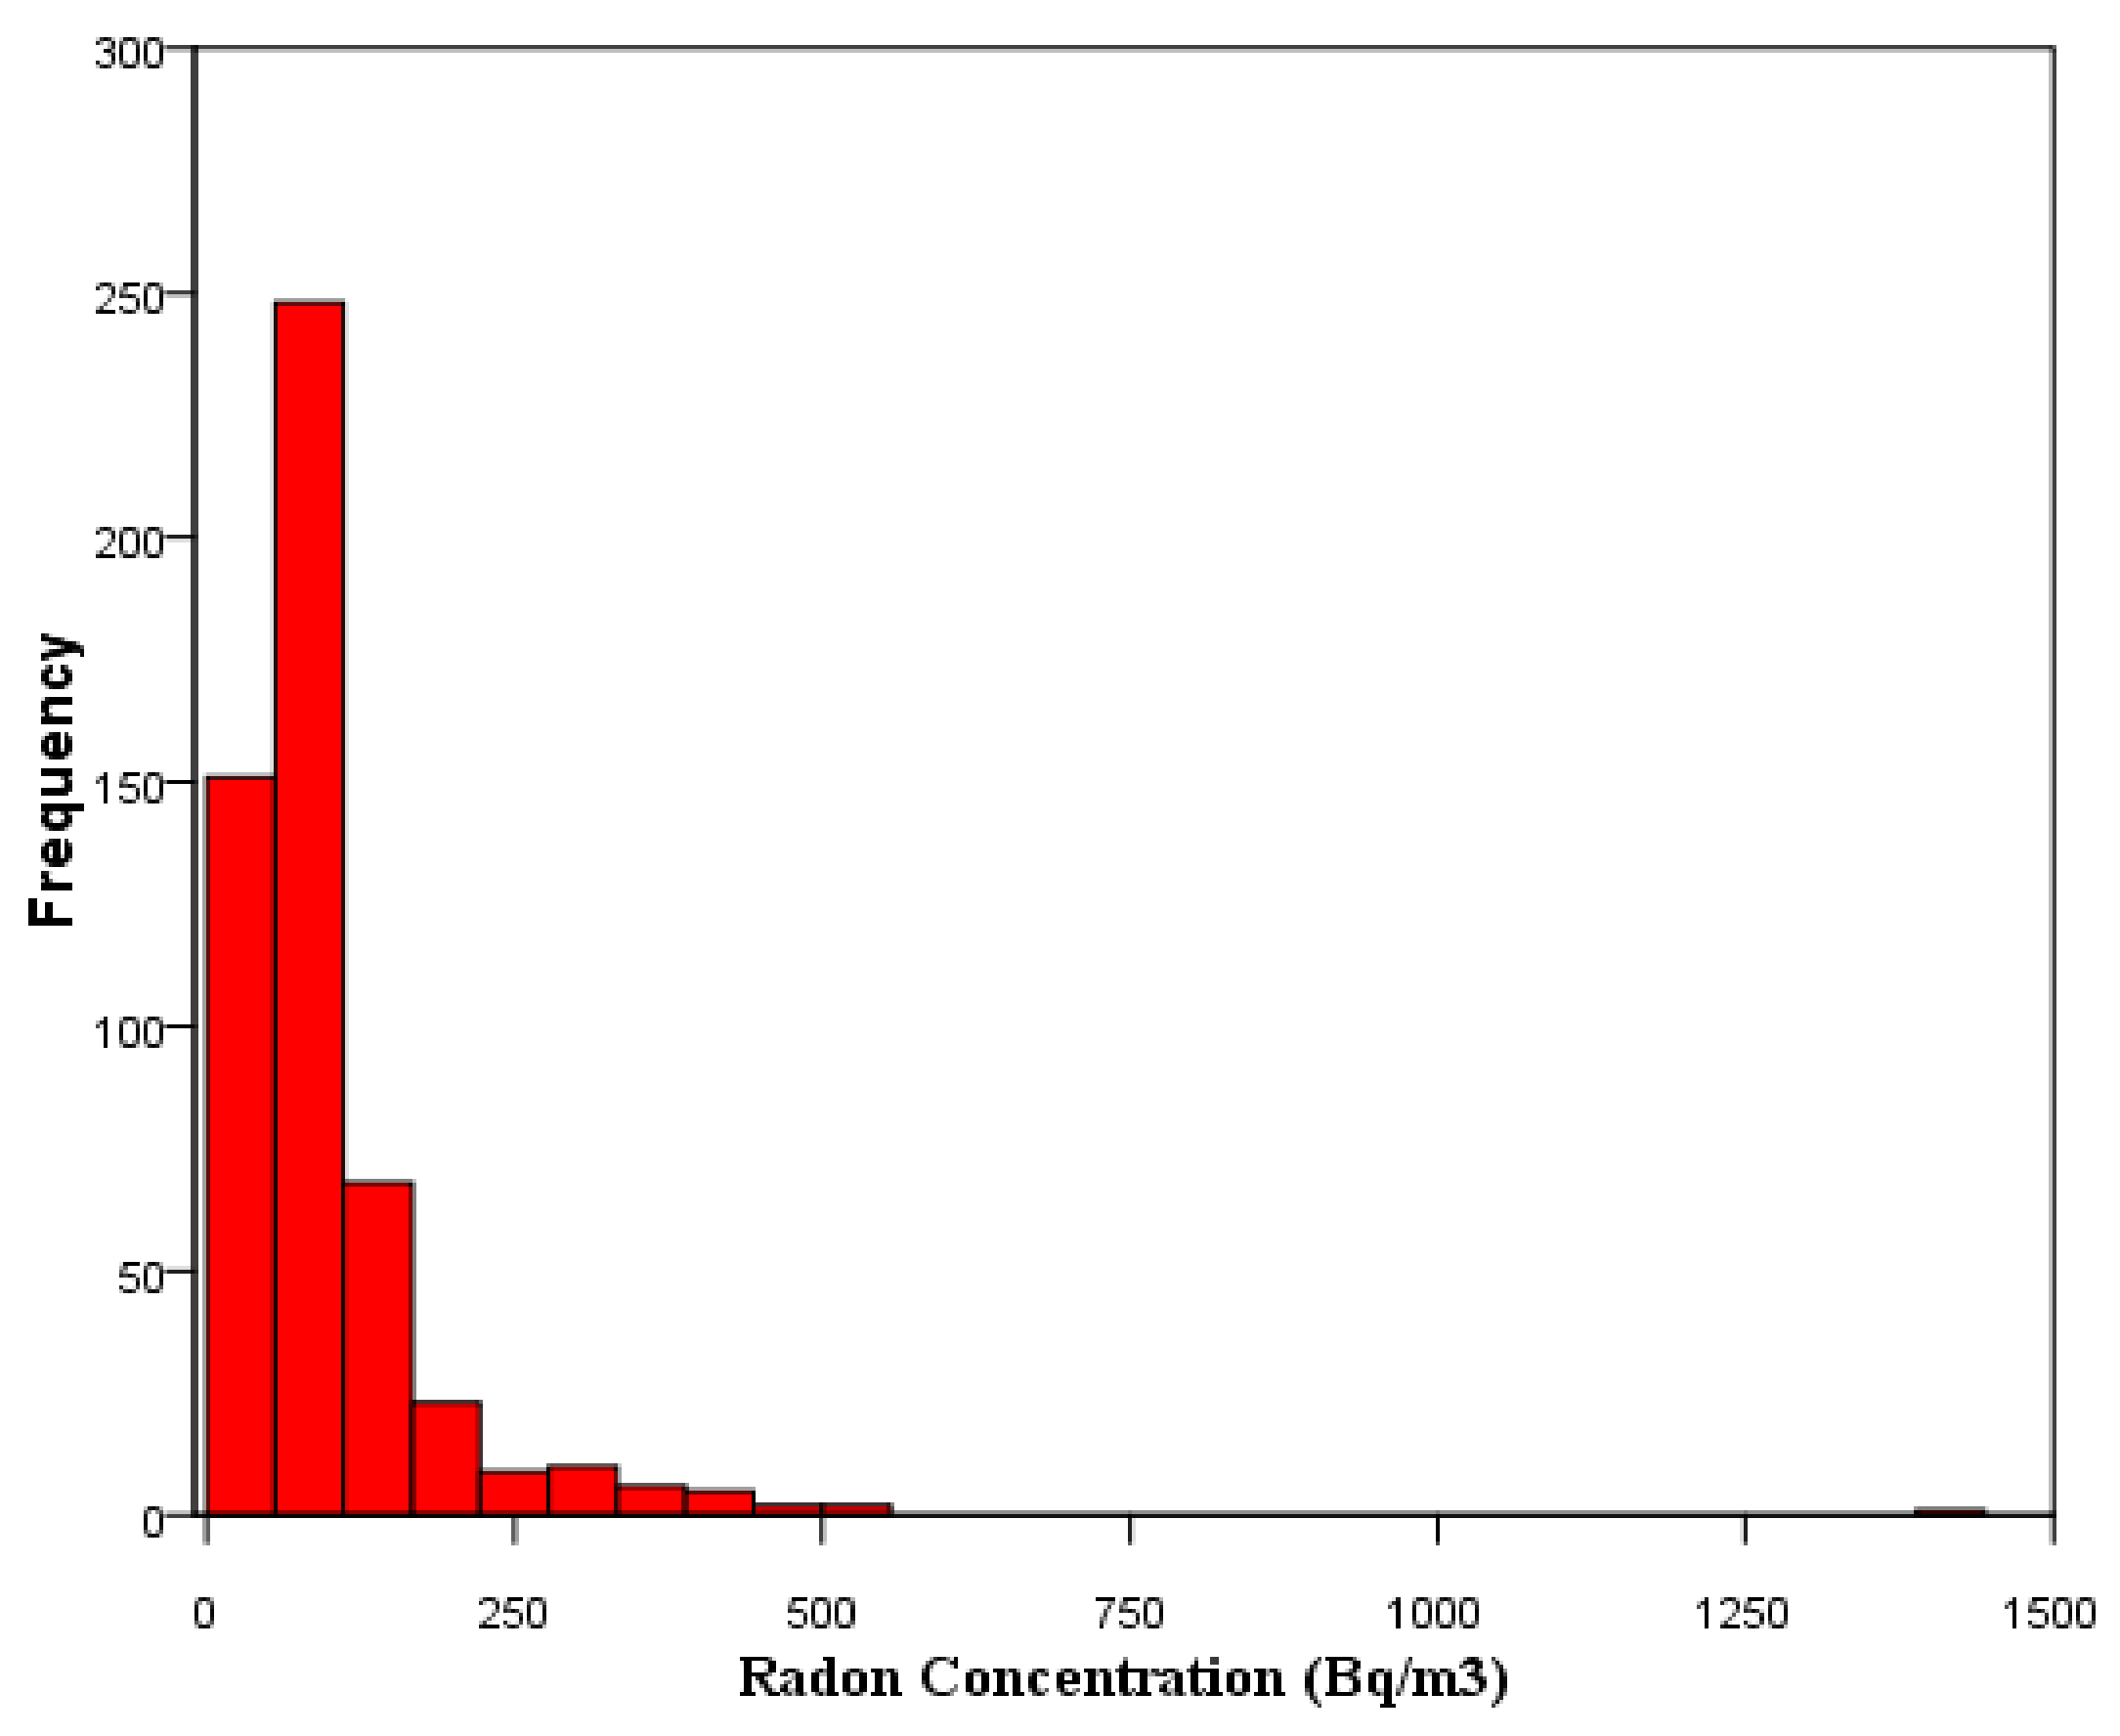
Figure 1. Frequency distribution of indoor radon concentrations measured in monitored schools.
Atmosphere 13 00478 g001
Figure 2. Relationship between radon concentrations and floor of the monitored classrooms. The graph reports the median and 25th and 75th percentiles; the outlier values are represented by dots.
Atmosphere 13 00478 g002
Figure 3. Median radon concentrations measured on the ground floors of the monitored schools.
Atmosphere 13 00478 g003
Table 1. Comparison between observed percentages of classrooms in which the radon concentration exceeded 100 and 300 Bq/m3.
Radon Concentration (Bq/m3)Number of Classrooms%
<100 36670
100–30014027
>300193
Publisher’s Note: MDPI stays neutral with regard to jurisdictional claims in published maps and institutional affiliations.

