
First Long-Time Airborne Fungal Spores Study in Dublin, Ireland (1978–1980)
by
 ,
,
Moisés Martínez-Bracero
1,* ,
,
Emma Markey
1,
Jerry Hourihane Clancy
1,
John Sodeau
2 and
David J. O’Connor
3 1
School of Chemical and Pharmaceutical Sciences, Technological University Dublin, D07 H6K8 Dublin, Ireland
2
School of Physical Chemistry, University College Cork, T12 YN60 Cork, Ireland
3
School of Chemical Sciences, Dublin City University, D09 E432 Dublin, Ireland
*
Author to whom correspondence should be addressed.
Atmosphere 2022, 13(2), 313; https://doi.org/10.3390/atmos13020313
Submission received: 30 December 2021
/
Revised: 8 February 2022
/
Accepted: 8 February 2022
/
Published: 13 February 2022
(This article belongs to the Special Issue Airborne Fungal and Pteridophyte Spores)
Abstract
:Ambient fungal spores within the atmosphere can contribute to a range of negative human, animal and plant health conditions and diseases. However, trends in fungal spore seasonality, species prevalence, and geographical origin have been significantly understudied in Ireland. Previously unpublished data from the late 1970s have recently been collected and analysed to establish historical fungal spore trends/characteristics for Dublin. Historical spore concentrations were largely dominated by Alternaria, Ascospores, Basidiospores, Botrytis, Cladosporium, Erysiphe and Rusts. The main fungal spore season for Dublin commenced in April with the fructification of Scopulariopsis and Ganoderma. However, the vast majority of other spore types did not reach peak spore release until late summer. The correlation between ambient spore concentration, and meteorological parameters was examined using Multivariable Regression Tree (MRT) analysis. The notable correlations found for fungal spore concentrations tended to involve temperature-based parameters. The use of a non-parametric wind regression was also employed to determine the potential geographical origin of ambient fungal spores. The impact of wind direction, and high windspeed on fungal spores was established, ultimately highlighting the importance of studying and monitoring fungal spores within Ireland, rather than attempting to rely on data from other regions, as most fungal spores collected in Dublin appeared to originate from within the island.
1. Introduction
Airborne fungal spores are endemic in the atmosphere throughout the entire year [1,2]. The importance of carrying out investigations into fungal spores and their impact upon the environment stems from their known negative impacts upon both flora and fauna. Regarding human impact, specific taxa are known to cause respiratory allergy symptoms [3,4], asthma attacks, and even acute respiratory failure. Recently, such symptoms have been misattributed to the SARS-CoV-2 (COVID-19) virus [5]. Such health concerns have been linked with impacting both occupational and residential environments, with the phrase “sick-building syndrome” being termed to describe the recent proliferation in the elevated incidence of respiratory diseases found among the occupants of human-constructed housing or work environments. Moreover, fungal spores are known for their pathogenic behaviours, resulting in diseases in crops [6] as well as in natural vegetation [7], leading to negative repercussions for both the economy and public health.
Interest in the allergenic impacts of fungal spores has been on the rise in recent decades. Research associated with fungal spores has been undertaken from a variety of different viewpoints and disciplines, with fungal spore research encompassing areas from environmental sciences to biochemical and applied microbiology. Two fungal spore genera in particular, Cladosporium and Alternaria, are routinely the most studied. This is due to a combination of factors: ease of analysis, relative spore abundance, and potential societal impacts. They have been consistently monitored in several European areas including the United Kingdom [8,9], Derby [10], Copenhagen [11], Poland [12], Portugal [13,14], Spain [15,16], Italy [17] and Turkey [18,19].
Of particular interest is a study completed in Ireland [20]. This was the only previous study carried out in Ireland during this period using the Hirst spore trap. This study aimed to explain the severe decrease in allergenic reactions reported by locals in the summer of 1978 and looked to see if common fungal spore types had similar seasonalities to known pollens, by monitoring their concentrations during this time. Varying meteorological conditions, which led to fungal spore concentration changes, were determined to be the major contributing factor to the change in adverse allergenic reactions.
While much research has been carried out on the creation of pollen seasonal calendars, the same cannot be said in relation to fungal spore annual distributions or release temporality. Studies that describe fungal spore calendars specifically tend to study just one spore genera or phylum, and compare seasonal variations of that spore type, rather than combining all spore types into a single unified calendar [15,21]. Research based on fungal seasonal distributions has been carried out over one or two sampling years in locations such as Australia [22], Austria [23], Poland [24,25], Slovakia [26] and Spain [27]. However, the European Aerobiological Society recommend at least 5 years of fungal spore data for the construction of a calendar, in order to reduce the impact of interannual discrepancies [28].
Airborne spore concentrations are determined by the inherent characteristics of the fungi, availability of substrates, temperature, moisture (from rain and humidity), and other environmental factors [29]. Humidity, among other factors, affects the discharge of each fungal spore type differently. While many species of Ascomycota and Basidiomycota are classified as “wet spores” due to their discharging methods, “dry spore” discharging fungi release spores via the flow of air, or by hygroscopic twisting movement, which occurs upon drying (mostly emitted when dry, warm and windy conditions prevail) [29,30]. Separately from the method of spore discharge, another differentiating characteristic of fungi is that they grow in multiple different but specific temperature ranges, and their fate usually depends on the wind, which is a blind vector [31,32]. Thus, given the influence of the wind dispersion on fungal distribution, understanding its strength and direction is useful in determining the geographical origin of spores.
The main goals of this study are to describe and define the fungal content of Dublin’s atmosphere through three analyses: (a) creation of a seasonal spore fructification chart for the most important spore types; (b) study of the relationship between fungal spores and meteorological parameters; (c) locating the main geographic sources of fungal spores that arrive in Dublin, and determine what proportion originate from within the country.
2. Materials and Methods
2.1. Study Location
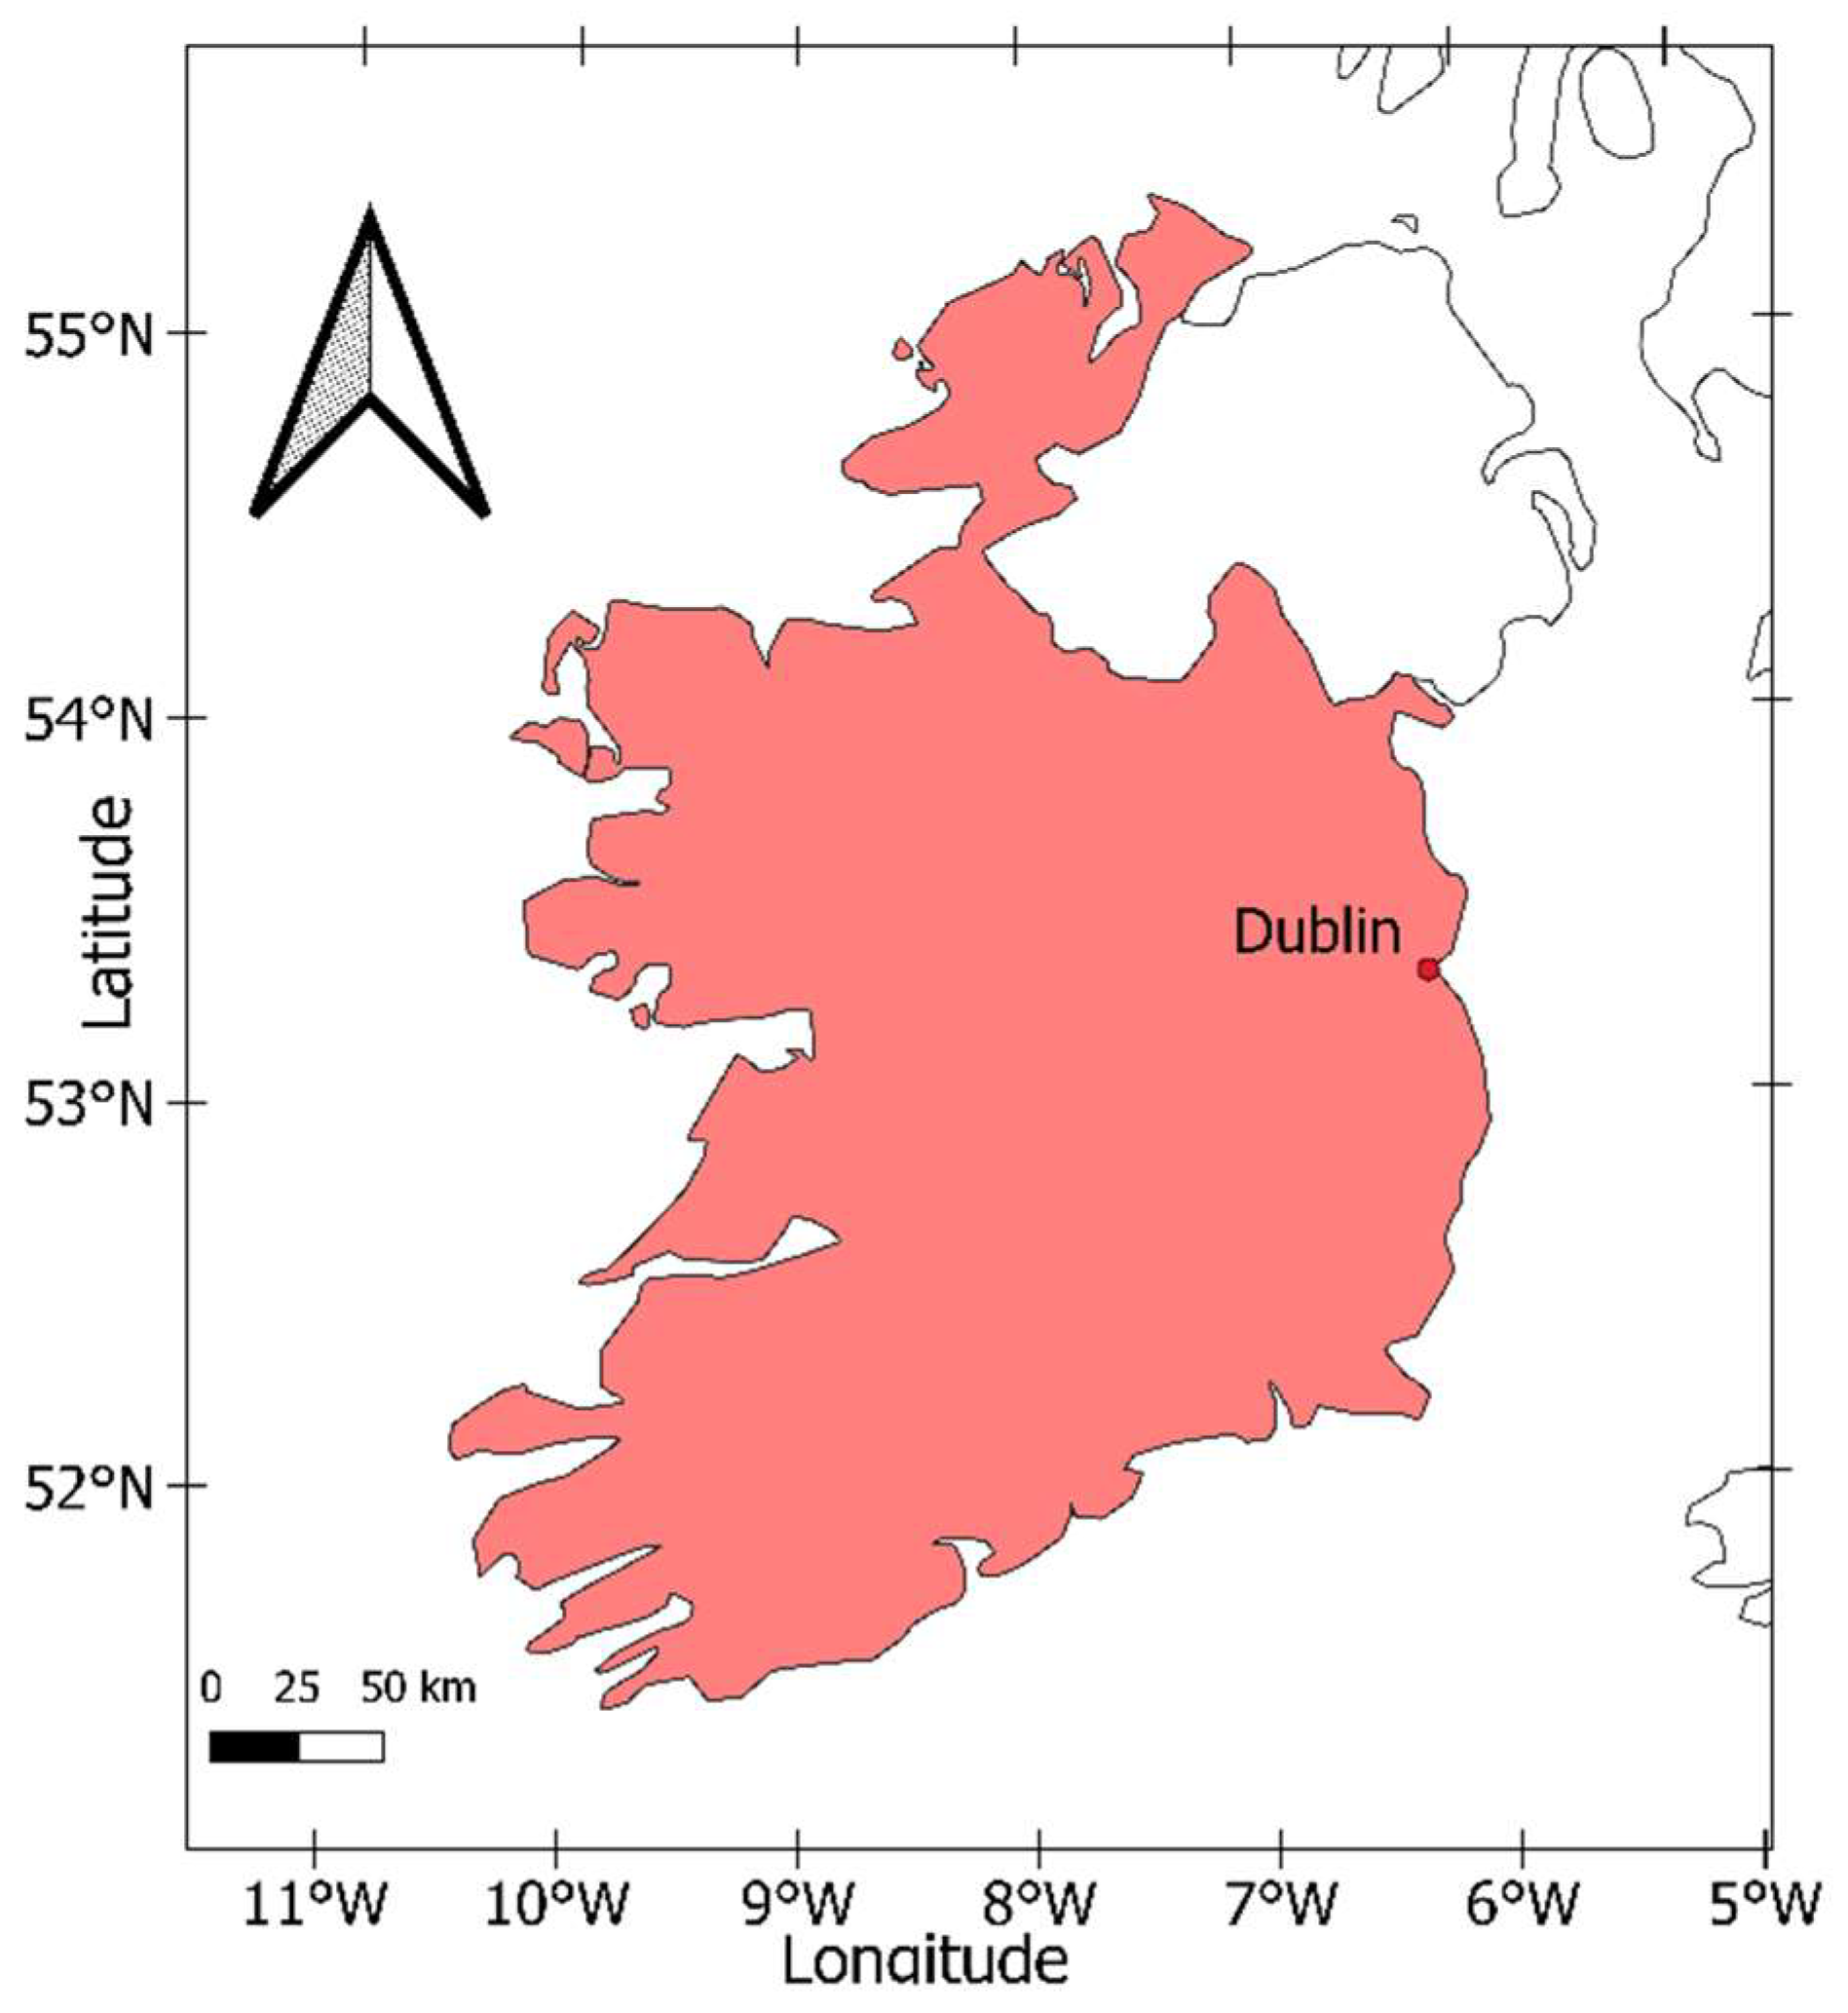
This study was carried out over the spring/summer months of 1978–1980, beginning from as early as the start of March, to as late as the end of September (year dependant). A 7-day Hirst volumetric spore sampler [33] was used for fungal spore collection. The sampler was placed within the grounds of Trinity College, Dublin (53.5° N, 6.5° W) (Figure 1).
This is the centre of a large urban area, located on the east coast of the island of Ireland, flanked by the Irish Sea to the east, and the Dublin/Wicklow mountains to the south. With the exception of the mountainous southern region, most of the city occupies a flat and low-lying basin (with Trinity College itself lying approximately 12 m above sea level) and is bisected by the River Liffey. It has an oceanic, or maritime-temperate climate, with mild summers and cool winters, and little temperature variation. The average annual temperatures range from 2.6 °C in winter, to 19.3 °C in summer [34]. The mean annual precipitation is 734.7 mm, with the driest month being February at 51.4 mm and December being the wettest at 76.7 mm.
2.2. Spore Monitoring Periods and Spore Identification
In 1978, fungal spore sampling took place from 27 April to 29 September. In 1979, sampling occurred between the dates of 7 March and 5 September. In 1980, sampling took place between the dates of 23 April and 31 July.
Sampling was carried out using a Hirst-type sampler on the roof of Trinity College. Airborne particles were drawn into the Hirst device at a rate of 10 L/min through a 2 mm slit in the device. These particles were then impacted onto a tape coated with an adhesive, with the tape attached to a drum that rotated at a speed of 2 mm/h; the drums circumference is 336 mm, allowing for 168 h, or exactly 7 days of sampling before the tape needs to be removed and replaced. This tape was then cut into 48 mm long daily samples and transferred onto glass slides and covered with a stained gelatine and cover slip, for both sample preservation and ease of identification via optical microscopy. Sample analysis was conducted using an optical microscope at 250× magnification, with one longitudinal transect counted along each slide. Daily fungal spore concentrations were calculated as the number of spores per m3 of air. The spore types identified were: Alternaria, Ascospores, Basidiospores, Botrytis, Cladosporium, Downy Mildew, Epicoccum, Erysiphe, Ganoderma, Polythrincium, Rusts Scopulariopsis, Tilletiopsis, Venturia and yeasts.
2.3. Meteorological Data
Meteorological data were obtained from the Met Éireann database [35]. The weather station in Dublin Airport (52°51′40″ N, 06°54′55″ W) (74 metres above sea level) provided daily datasets of major meteorological parameters. The available daily parameters were: mean, maximum and minimum temperatures (°C, Tmean, Tmax and Tmin), average mean temperature over the previous 10 days (°C, Tmean_10), grass minimum temperature (°C, Gmin), mean 10 cm soil temperature (°C, Soil), precipitation amount (mm, Rain), average precipitation amount over the previous 10 days (mm, Rain_10), mean CBL (Convective Boundary Layer) pressure (hpa, Pressure), mean wind speed (kt, Wind_s) and wind direction at max 10 min mean (deg, Wind_d), global radiation (J/cm2, G_rad), potential evapotranspiration (Pe, mm), evaporation (Evap, mm), and relative humidity (%, Rh).
2.4. Statistical Analyses
2.4.1. Meteorological Analysis
Statistical analyses were carried out using R software [36]. Pearson’s correlation coefficient tests for each year of study were performed to ascertain the relationship between spore concentration and weather-related parameters. Additionally, Multivariate Regression Trees (MRTs) were constructed. MRTs were developed to carry out relationship analyses between flora or fauna species, and various environmental parameters. They have been used many times previously, directly analysing the relationship between meteorological parameters and fungal spore types and concentrations [8,37].
The meteorological thresholds at which concentrations of common spore types increased significantly were determined. For this analysis, the fungal spores analysed include Alternaria, Ascospores, Basidiospores, Botrytis, Cladosporium, Erysiphe, and Rusts. For Spearman’s correlation, which is seen within the MRTs, significance was calculated for p < 0.001, p < 0.01, p < 0.05 and p < 0.1. The MRTs were constructed using the R Program [36] “party” package [38].
2.4.2. Fungal Spore Fructification Period Chart
To calculate the fungal spore fructification period chart, daily fungal spore values for all three years were aggregated together to create a set of daily mean values for each fungal spore type, over the entire study period. The main fructification period was calculated using the percentage method, which has been used previously for the description of pollen seasons [39]. In this case, the method selected was the 90% method, whereby the main fructification period commences on the day at which 10% of the years’ total fungal spores have been counted. Equally, it ends on the day at which 90% of the years’ total spores have been counted. Early and late fructification periods include times of year outside the main fructification period where, at least 0.5% of the years’ total fungal spore concentration has already been accounted (for the early period), and where, at most, 0.5% of the spores to be counted remain after this date (for the late period). Each month was divided into 6 periods of 5 days, with 31-day months having 6 days in their final period, and February having only 3 days for its final period. The five daily values were added together, and divided by 5, to give the arithmetic mean (or divided by 6 or 3 accordingly). Each segment was then categorised via a 3-digit code, as the month abbreviation and period number. For example, Ja1 to Ja6 represent the six periods of January, and Jn1 to Jn6 represent the periods of June.
This method of fungal spore fructification period chart construction has been used for the construction of historical bioaerosol calendars in numerous previous works, mainly relating to pollen calendars and their methodology [40,41,42,43]. It is important to note that, in general, a pollen or fungal spore calendar requires at least 5 years’ worth of data to reliably identify trends and normalise the impacts of major weather events, so this should be regarded as more of a historical fungal spore database rather than a calendar, as a sufficiently long, continuous monitoring programme was not in place at the time of this initial study.
2.4.3. Geographical Origin of Airborne Spores
The two-dimensional Non-parametric Wind Regression (NWR) method was used to assess the geographical origin of atmospheric spores using the software package ZeFir-v3.7 [44]. This method has been used in multiple studies for geographical wind origin analysis, as well as for air quality analysis [45,46,47].
3. Results
3.1. Distribution and Analysis of Airborne Fungal Spore Content
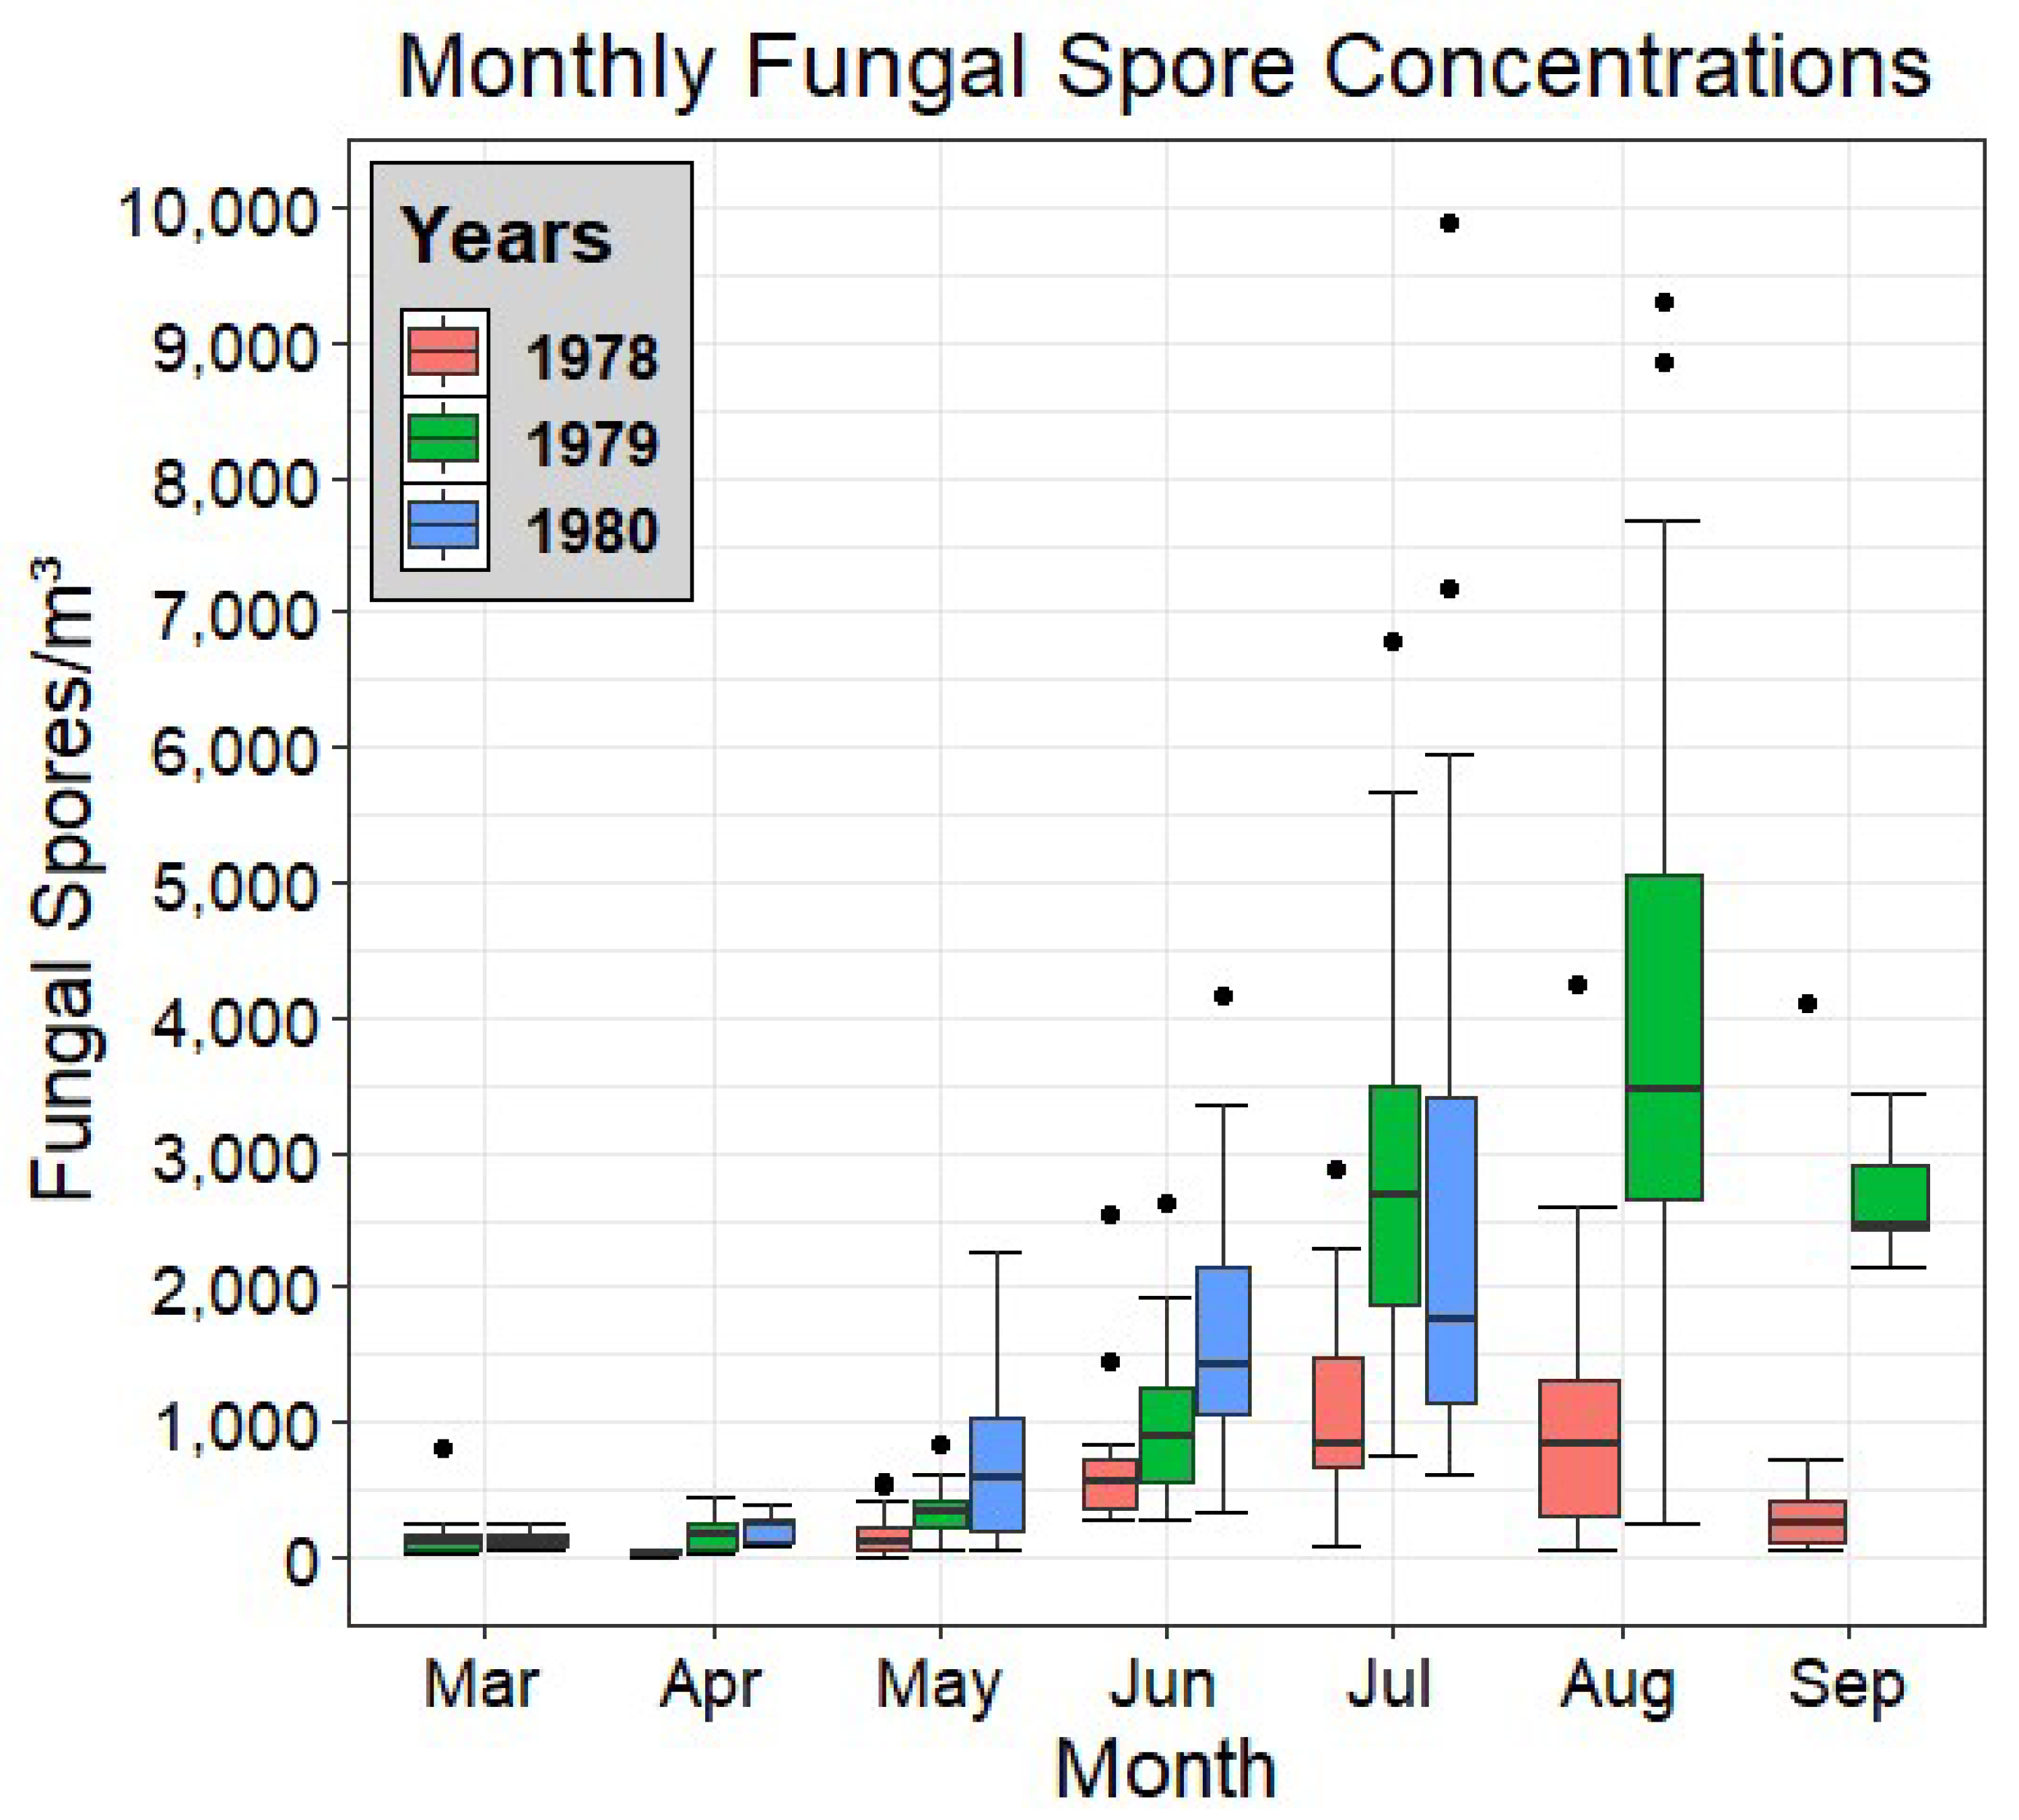
Figure 2 shows a set of box and whisker plots for each month of each year of the campaign period, allowing for direct comparison between the data of each year, as well as a view of the seasonal trend of total fungal spore concentrations.
It can be seen in Figure 2 that the highest mean monthly concentrations of fungal spores were exhibited in 1979, peaking in August. In contrast, 1978 displayed the lowest monthly concentrations across the entire study. Across all years, low spore values were observed in March and April, with the first increases seen in May, particularly in 1980, where its median value more than doubled compared with April, before continuing to rise (in all three years) in June. The 1979 data display a consistent rise, month on month, before its peak in August, while 1978 has relatively similar values for both July and August. September (in 1978 and 1979) shows the first sign of a marked decrease in concentrations, signifying the end of the peak fungal fructification period.
In general, the months of July and August were seen to comprise the peak fungal season over the three years. Of note is the apparent lack of a drop in fungal spore concentrations by the end of the study in 1979. This indicates that the main fructification periods may stretch further into the Autumn than was monitored as part of this campaign.
Encountering large differences between years studied is not unusual. In a daily survey of fungal spores in Morocco from 2009 to 2011, researchers found large interannual and seasonal variations in both fungal spore types, and overall annual fungal spore concentrations [49]. A five-year study of fungal spore concentrations and distributions in Saclay, France, found extremely strong levels of interannual variation, with a 45% decrease in total annual spore count observed between the first and second years of the study [50]. Studies that identify inter annual variations look to localized weather conditions or climactic changes. A study by Ajouray et al. [49] noted very differing weather conditions between years studied.
The mean peak date for Basidiospores during the three-year period was on the 30 July, when an average of 6650 spore/m3 of air was counted across all years of the study period. Cladosporium spores had three days with average peaks above this value, with the highest being an average value of 8931 spore/m3 of air, reached on 29 July. Ascospores appeared to diverge in the opposite direction to Basidiospores, with a less prominent growth in average fungal spore numbers in the lead up to the peak fructification period. Days in the very middle of the expected peak period for Ascospores had very low spore counts, such as 16 July, were the average of all years of the study period was only 269 spore/m3 of air for that day.
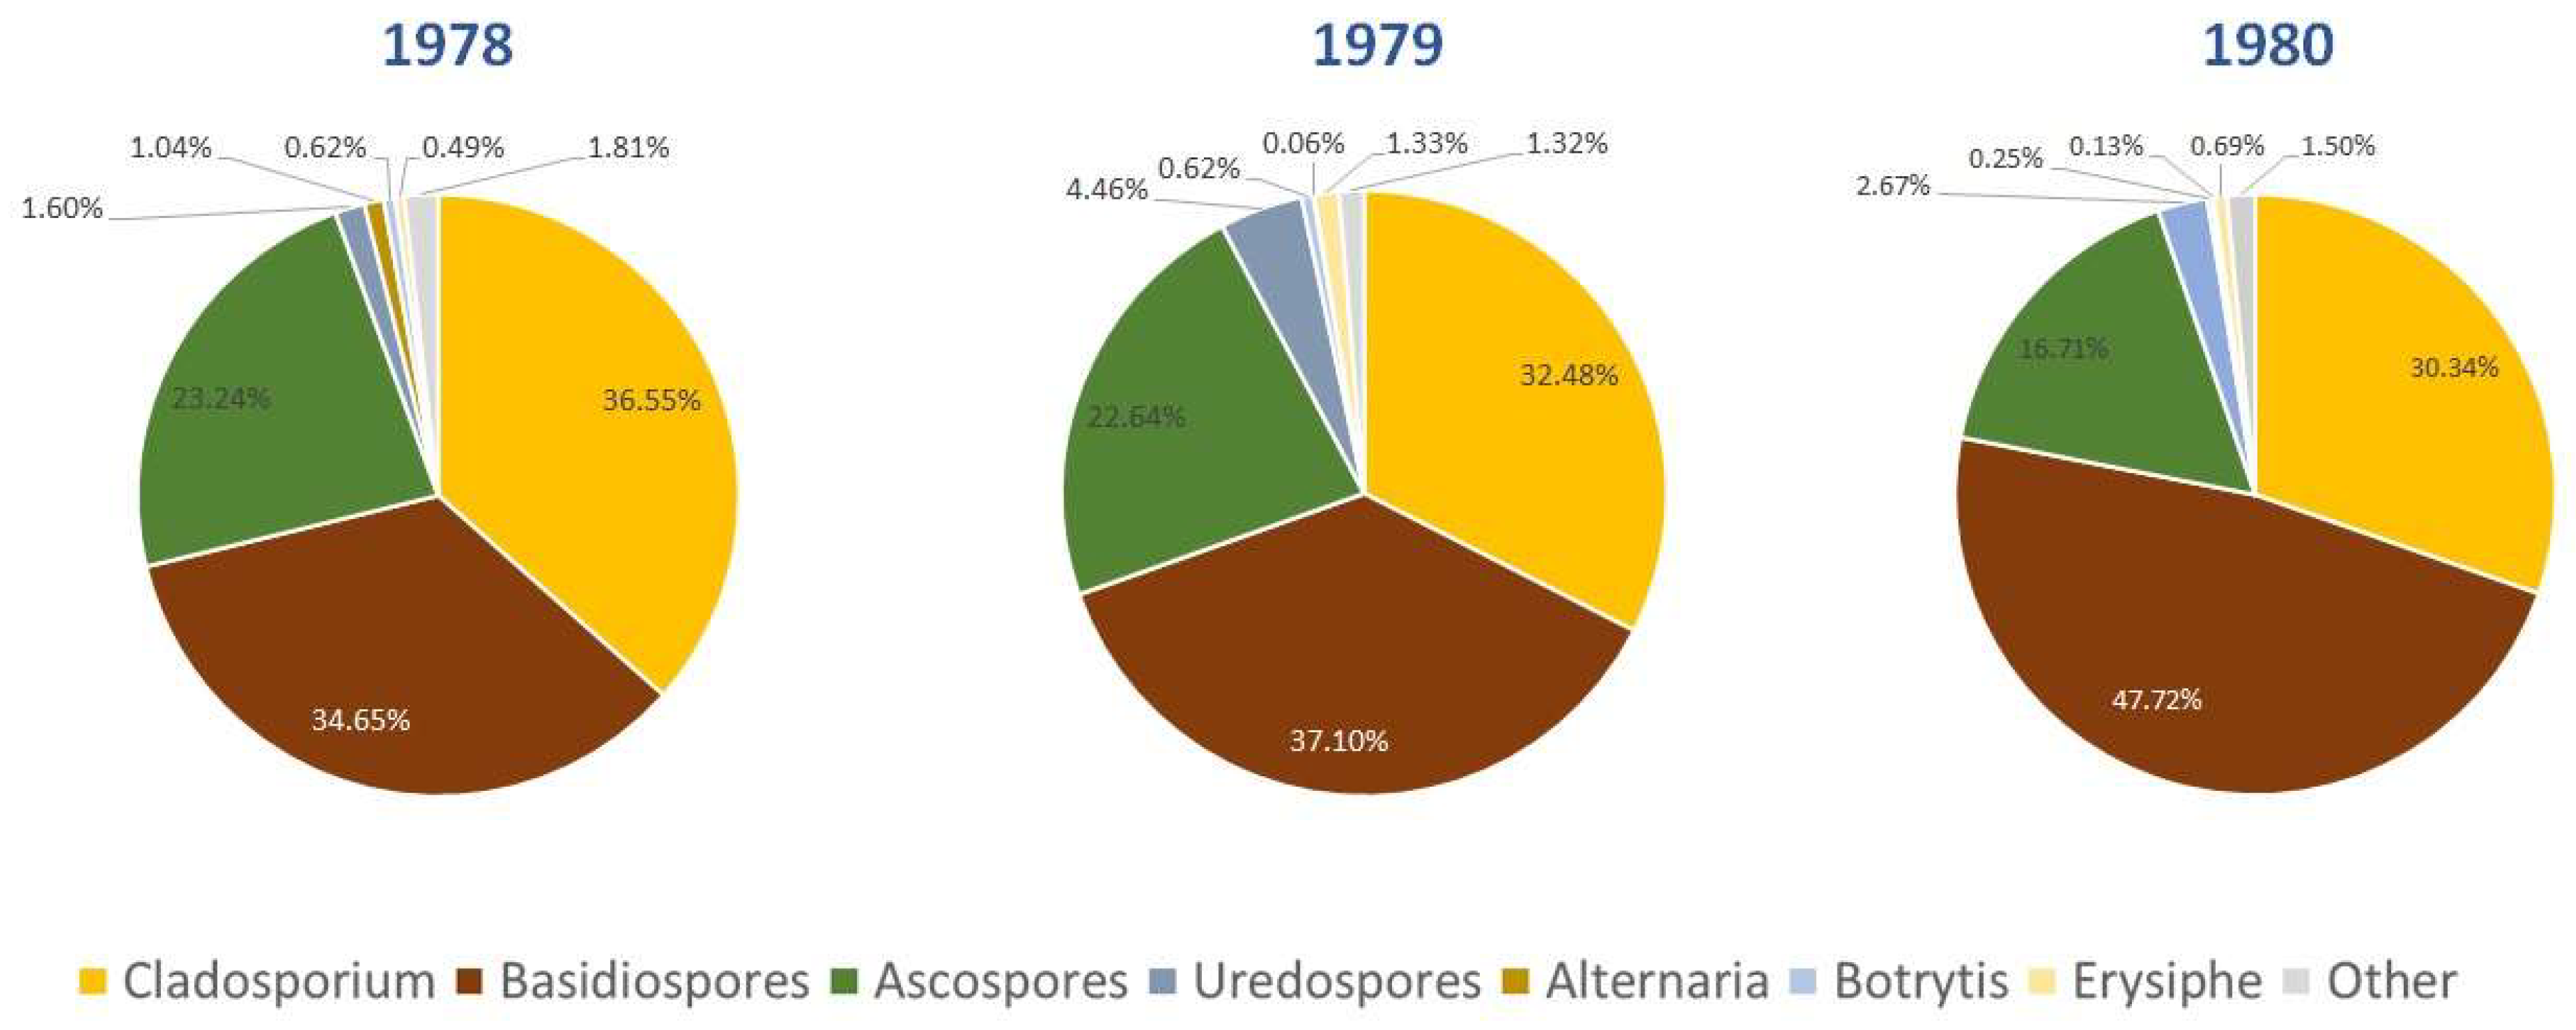
In Figure 3, the predominant fungal spore types in Dublin for each of the three years of the study are shown. These were identified as Alternaria, Ascospores, Basidiospores, Botrytis, Cladosporium, Erysiphe and Rusts, which together comprise more than 98% of the total spores identified. The total Seasonal Spore Integrals (SSIn) are composed primarily of Cladosporium and Basidiospores, which make up between 69 and 78% of all spores counted. Additionally, Ascospores contribute significantly towards total spore concentrations, accounting for between 17 and 24% of spores counted in each of the three years.
3.2. Meteorological Analysis
3.2.1. Correlation Coefficient Analysis
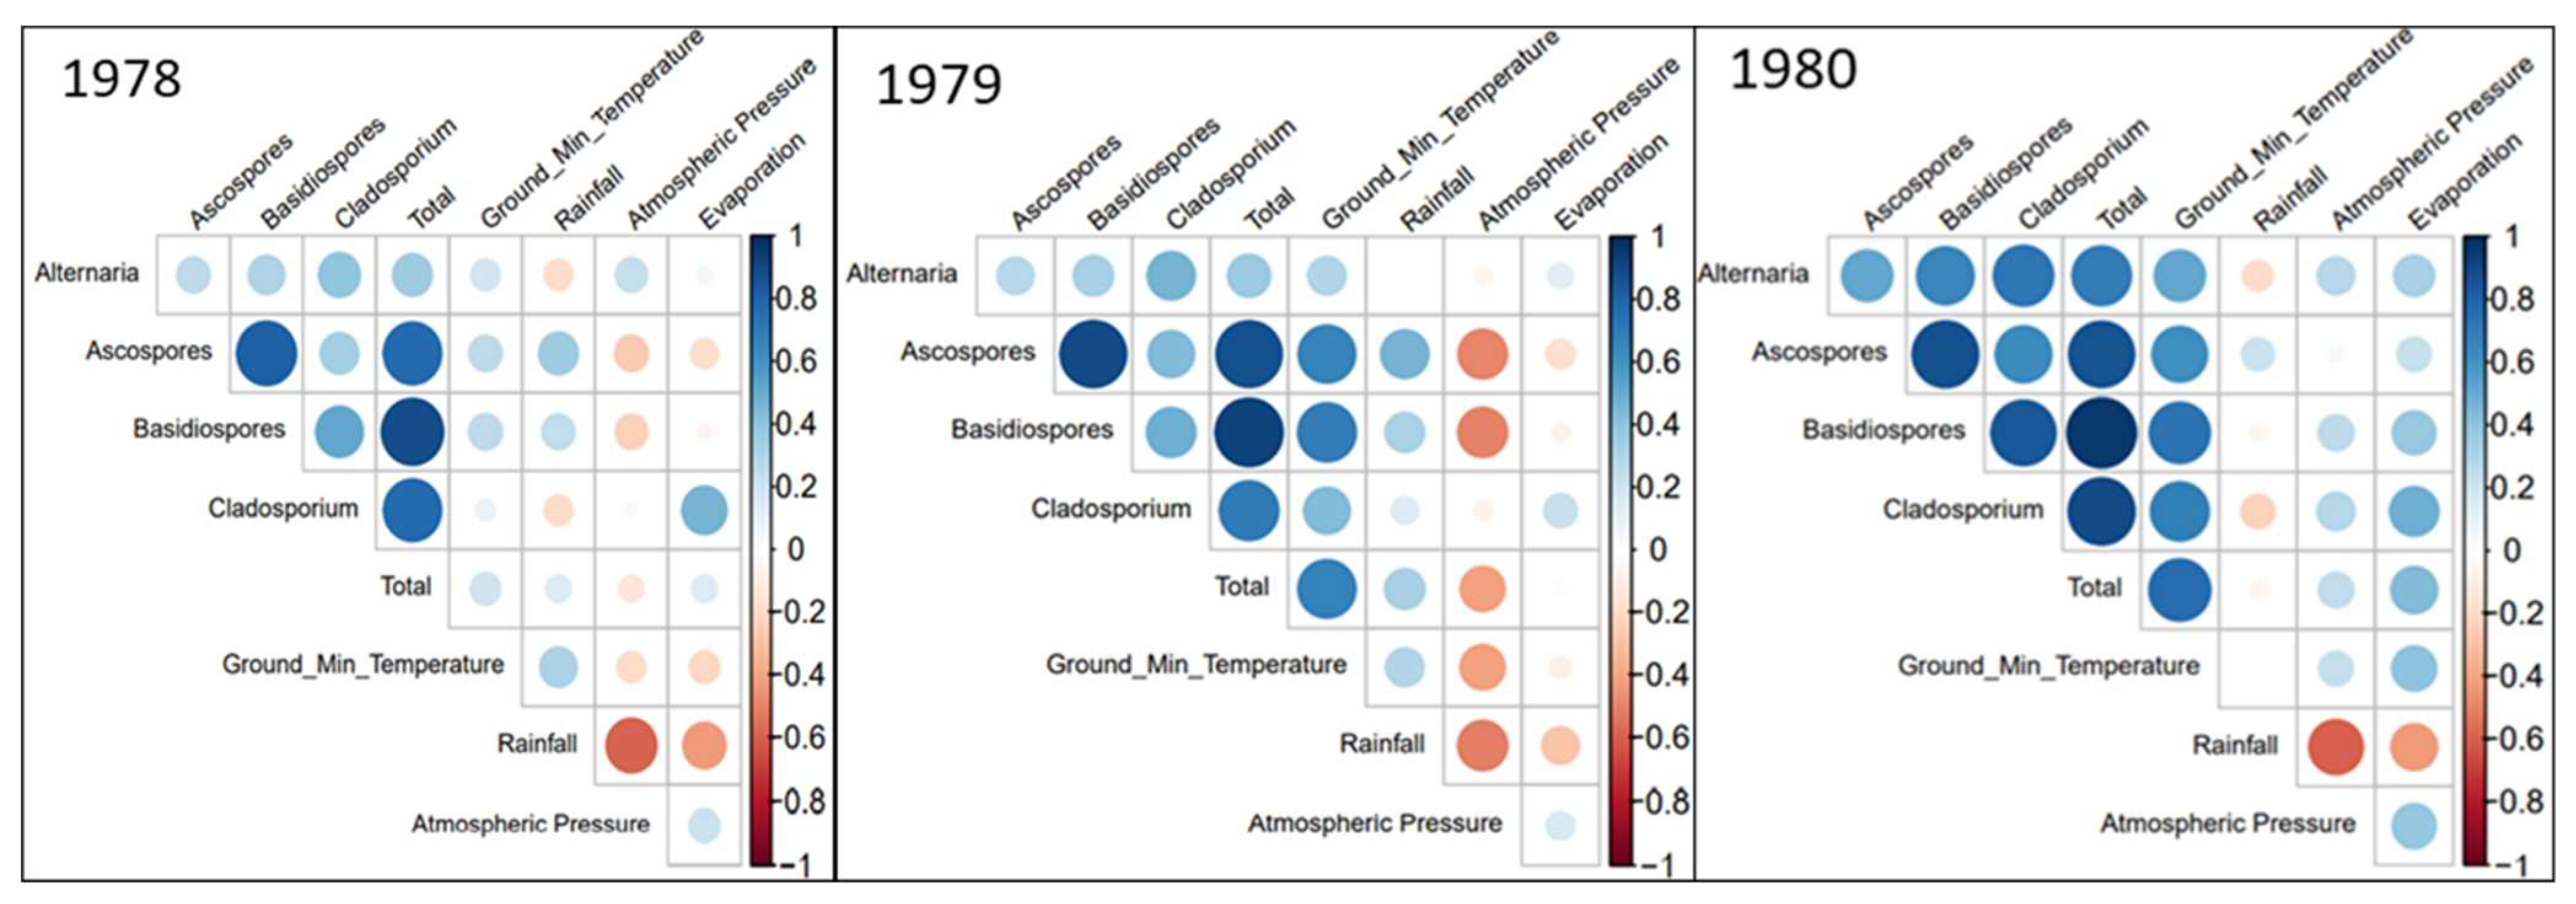
In Figure 4, a set of correlation plots are shown. These plots are used to express whether different variables and parameters correlate with each other, how strongly they correlate with each other, and whether the correlation found is positive or negative. The colour of each circle indicates whether a correlation is positive or negative, with blue circles representing a positive correlation, and red circles signifying a negative correlation between the two intersecting parameters.
The meteorological parameters that did not correlate as strongly were removed from the correlation plots to ensure the ease of analysis. The first observation of note from the correlation plots, is the correlation between multiple fungal spore types and ground minimum temperature. Each of the three years show some positive correlation, with strong correlations seen in 1979 and 1980 (Figure 4).
Ascospores and Basidiospores were the groups that possessed the highest positive correlation with ground minimum temperature. Similarly, rainfall is positively corelated with most Ascospores and Basidiospores in all the years studied. Alternaria and Cladosporium correlate negatively with rainfall and correlate positively with ground minimum temperature, but do not correlate as strongly as Ascospores and Basidiospores. Evapotranspiration correlated positively with Cladosporium, and in 1978 (Figure 4), it was the only parameter that Cladosporium shared a strong positive correlation with.
Some meteorological parameters, while correlating strongly, instead exhibited a negative correlation with some fungal spores. The most noteworthy example being that of atmospheric pressure. In both 1978 and 1980, significant negative correlations were seen between atmospheric pressure, and both Ascospores and Basidiospores. However, this apparent relationship completely reversed in 1979, where correlations were significantly positive. At the same time, the strength of correlation between these same spore types and rainfall was diminished, indicating that it was the difference in weather conditions that caused this apparent relationship change. This can be supported by the very strong negative correlation between rainfall and atmospheric pressure, with higher atmospheric pressure associated with lower rainfall levels. According to the historical Met Éireann weather event database, the summers of 1978 and 1980 had lower than average summer rainfall levels, while 1979 had higher than average levels. Additionally, of note was the presence of ground frost in July of 1979, further emphasising the unseasonal weather conditions of that summer [34].
In all instances, the best meteorological parameter for the prediction of total fungal spore values was the ground minimum temperature. To further investigate the relationships between meteorological parameters and fungal spores, a set of Multivariate Regression Trees (MRTs) were created via the use of R software [36].
3.2.2. Multivariate Regression Tree (MRT) Analysis
In the constructed MRTs the parameter that statistically most strongly influences a fungal spores’ concentration is listed in the “1” slot. The threshold level at which this fungal spores’ concentration is significantly different is noted on the connecting line between the listed meteorological parameter, and the box and whisker plot below. If there is more than one significant meteorological parameter threshold, the dataset will subdivide the data again under a “2” slot and repeat the process again, until all statistically significant threshold levels for all meteorological parameters have been satisfied. Meteorological variables selected for each spore type, the threshold, and p-value accumulative correlation of different variables on various fungal spore species/concentrations can be seen in the supplementary materials (Figure S1).
More than one significant meteorological parameter was determined for each fungal spore type for each subsequent year. The threshold for each selected meteorological variable following MRT analysis as well as the associated p-value are summarized in Table 1. Data number of data over and under each threshold were also included. When the meteorological variable exceeds the determined threshold, spore concentrations are higher. Separate MRTs were performed on each year in order to show the differences between studied years. Temperature as a factor was repeatedly found to correlate with a variety of fungal spores, and at multiple measurement levels. Mean soil temperature at 10 cm (soil) was an influencing parameter for Basidiospores, Botrytis and Cladosporium, with all three spores encountering a spore concentration threshold at around 15.7 °C. This same parameter saw concentration thresholds for Erysiphe and Rusts, at other temperatures. With Rusts, the MRT analysis identified a direct relationship to mean soil temperature, as no less than five distinct fungal spore concentration thresholds could be distinguished from each other, all dependent upon the mean soil temperature.
Changes in maximum temperature correlated with concentration thresholds for Alternaria and Botrytis, with temperatures of over 17 °C correlating with increased fungal spore concentrations. A second threshold for Alternaria was also identified, with decreased concentrations observed below 15 °C. Similarly, Cladosporium concentrations increased at the maximum temperature threshold of 21 °C.
Grass minimum temperature was also one of the variables seen to correlate with spore concentration. Basidiospores concentrations increased at temperatures over 10.7 °C. Ascospore concentrations were seen to be higher for grass minimum temperature over 5.2 °C.
Rainfall was seen to result in increased concentrations of Ascospores (Table 1) when rainfall was above both 0.9 mm and 4 mm, and Botrytis when rainfall was above 5.6 mm. Evapotranspiration was a correlating factor for Rusts, with an increase in fungal concentrations for evapotranspiration values over 4.2 mm. The mean cbl (convective boundary layer) pressure correlated with an increase in concentrations of Ascospores when exceeding 1000 hpa (1001 and 999), while pressures higher than 994 hpa resulted in a decrease in Rust concentrations. Finally, wind direction was seen to relate to an increase in the concentrations of Botrytis over 260°, and for Rust at values over 310°.
3.3. Fungal Spore Fructification Period Chart
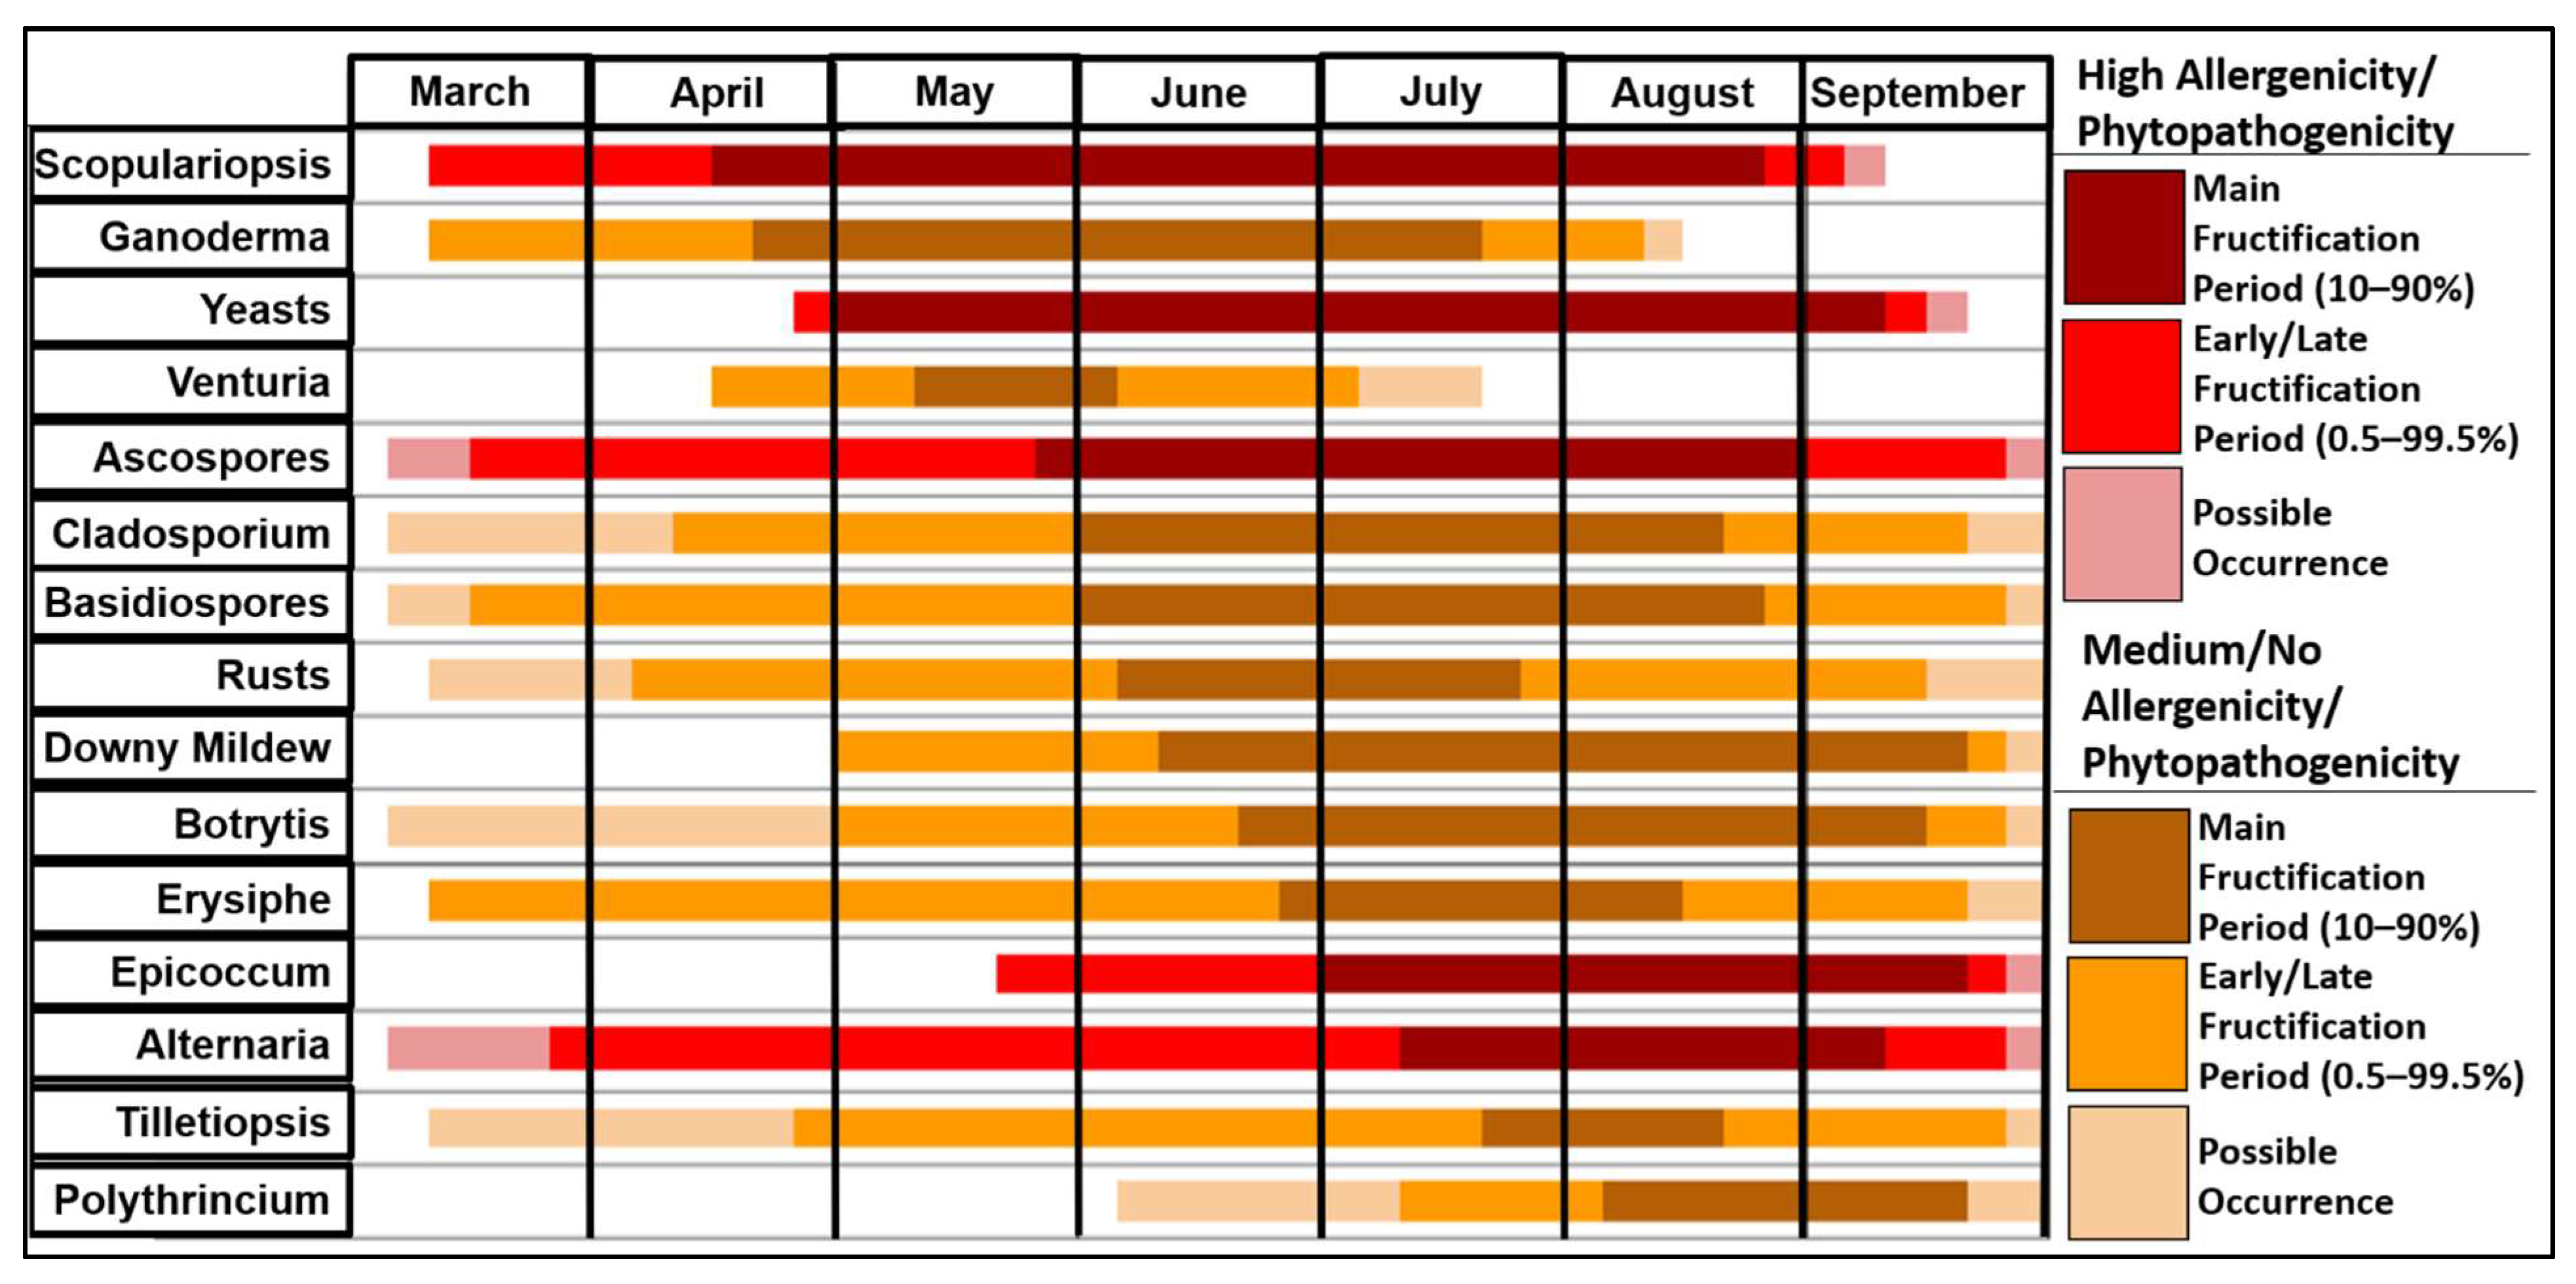
This chart (Figure 5) combines data from all years of the study. This chart is arranged by peak fructification period, with fungal spores that peak earliest in an average calendar year at the top of the chart. Each horizontal line starts with the first noted occurrence of that spore and ends with the last recorded occurrence. Spores that have their bars marked in shades of red have been noted to be highly allergenic or phytopathogenic, while orange bars indicate that spores have medium/low, or no noted allergenicity or phytopathogenicity [51,52]. The fungal season typically commences in April with the main fructification of Scopulariopsis and Ganoderma. However, several spore types such as Scopulariopsis, Ascospores, Basidiospores, Erysiphe and Alternaria can exhibit early fructification in March. On the other hand, several fungal species see peak releases later in the year, with Tilletiopsis and Polythrincium witnessed during July and August, respectively. Most spore types reach peak fructification during July and August. This period coincides with the release of Ascospores, Basidiospores and Cladosporium, which comprise the vast majority of all spores sampled.
The longest peak fructification periods were observed for Scopulariopsis and yeasts, both totalling more than four months, and both extending roughly from April to September. The shortest peak period belonged to Venturia, which lasted for less than four weeks in total, from May to the start of June. Scopulariopsis reached its peak the earliest, with Scopulariopsis and Ganoderma being the only spores to have released 10% of their annual totals before May. Conversely, Polythrincium did not reach peak fructification until August, meaning reduced sampling after September would have likely affected the total spore concentration. In addition, some spores such as Alternaria and Tilletiopsis were identified as early as March but remained relatively low in concentration until their peak periods commenced in July or August.
3.4. Geographical Origin of Airborne Spores
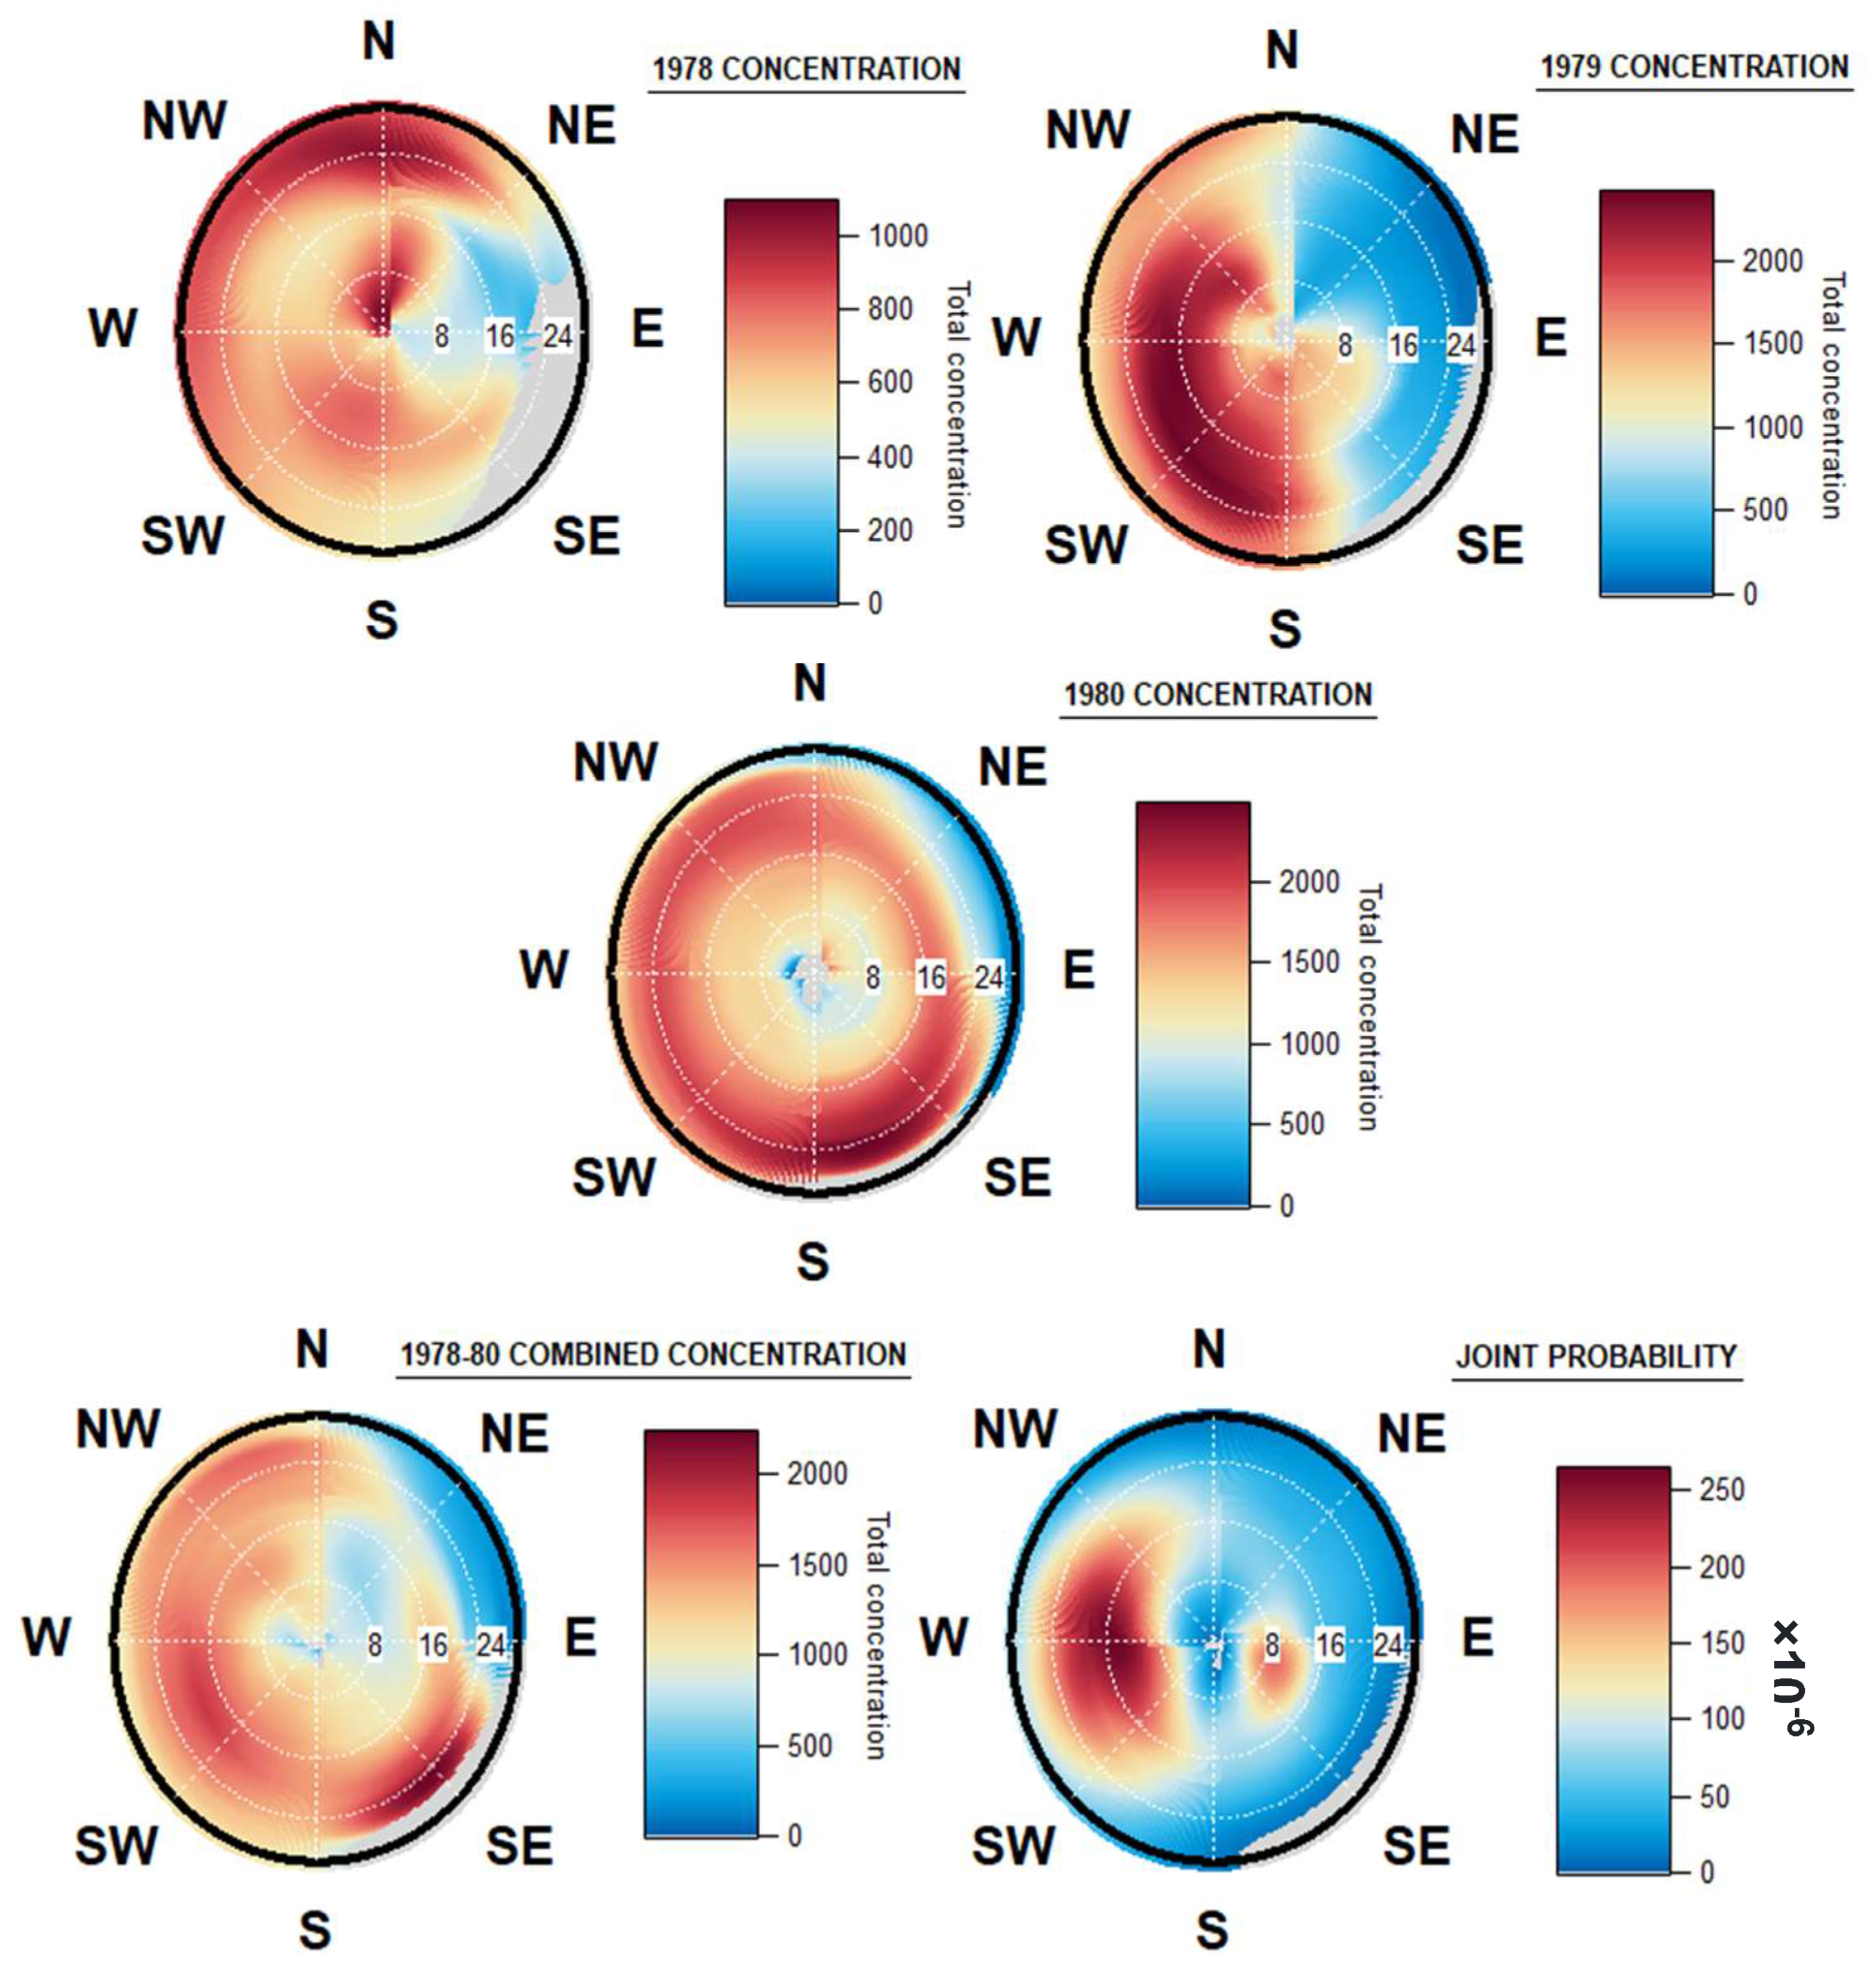
Figure 6 shows that in all years studied, a large proportion of fungal spore concentrations correlate with higher wind velocities and potentially from inland origins. The origins of the fungal spores sampled from this site are distinctly different for each of the three years. The highest concentrations in 1978 originate from northerly winds, generally at higher wind velocities of above 20 km/h. Another point of high concentration is also seen at lower wind speeds, below 8 km/h, again in the northerly direction, thus indicating a potential local source of fungal spores may be present.
During 1979, the highest fungal spore concentrations originated from winds originating in the west, south-west, and south, with higher concentrations observed at wind speeds of between 16 and 24 km/h. This is a completely different direction to the previous year, highlighting the possibility of interannual variation with regard to fungal spore dispersal and fructification.
During 1980, fungal spore concentrations were similarly high from all directions, with slightly higher concentrations observed from the south and south-east. The windspeeds that resulted in the highest concentrations ranged from 16 km/h from the east and northeast to speeds of above 24 km/h in the south. Once again, this is a completely distinct windrose pattern to those found in the two years previous, but the generally similar concentrations from all cardinal directions, over what is the smallest of the three datasets, means that one singular week of high fungal deposition could meaningfully change the windrose plot.
In all years combined (Figure 6), the high concentrations observed in 1980, originating from the south and south-east, can be seen. The spore concentrations for 1979 were spread evenly over a larger area originating in the west and southwest, and their impact is also seen, albeit less pronounced. The overall lower concentrations observed in 1978 mean that it too shows up as a less pronounced point of higher fungal spore concentration on the windrose.
The joint wind speed and direction plot chart shows the prevailing wind directions and speeds over the same 1978–1980 period. The prevailing direction was from the westerly direction, at wind speeds of between 8 and 24 km/h, and the majority of wind arriving at approximately 16 km/h. Another increased concentration of wind originated from the east, at much lower speeds of around 8 km/h. These results differ greatly from the fungal spore concentrations linked to wind over the same period. A similar contrast between prevailing wind speed and direction, with the highest bioaerosol concentration origins, was also seen in a study in Saclay, France [50]. The suggestion was proposed that this pattern can be a result of larger, main bioaerosol events advecting over the study area, and thus depositing some of the mass in the region studied, rather than the more expected pattern of fungal spore events, or other bioaerosol masses following the direction of the prevailing wind and depositing at the end of their aerosolization at and around the location of the Hirst sampling device.
4. Discussion
4.1. Airborne Fungal Spore Monitoring
A myriad of studies, covering various aspects of allergenicity and phytopathogenicity, have highlighted the importance of fungal spore monitoring [10,13,19,53]. Many pollen seasonal calendars have been constructed previously [54].
While different studies have assessed historical, seasonal fungal spore distribution [55] data are often limited to the late 1980s or early 1990s, further highlighting the importance of the present study. However, a study was published during this time in Ireland, providing a good point of comparison [20]. The seasonal fructification periods found in this study were concentrated in the spring and summer months, coinciding with results obtained in the historical studies [55], the most recent studies in similar latitudes [8,29,56], as well as around the Mediterranean area as well as in comparison with work undertaken in the same decade [57,58,59]. In Galway, the highest concentrations of fungal spores were observed during the months of July and August [20]. Cladosporium has been found to be the most abundant species in the atmosphere in previous studies, matching with the concentrations found in this study. However, the maximum Seasonal Spore Integral (SSIn) of Cladosporium was relatively high in this study when compared with other studies around Europe [15,57,60]. This trend is the opposite to that found in Denmark [55], where the SsIn has been stable since the 1990s with a decrease in the peak concentrations.
Ascospores and Basidiospores have been identified as important fungi, being grouped in numerous previous studies, and the total concentrations of these fungal spore types were found to be considerably lower in other studies than found in our survey [29,61]. Furthermore, in previous studies in Ireland, Cladosporium has been found as the most prevalent spore in the atmosphere in comparison to Basidiospores [20].
4.2. Meteorololy and Fungal Spore Concentrations
The strong relationship between spore concentrations and meteorological parameters has been well documented in a range of different locations across Europe. Throughout the literature, temperature has repeatedly been identified as the most important variable, consistently positively correlating with the majority of fungal spore types [13,14,29]. This is corroborated in our data analysis, with other correlation plots and MRT analyses finding (across all years and fungal spore types) that temperature was consistently the driving factor when accounting for changes in fungal spore concentration.
While most of the spore types identified and analysed in this study have not been extensively studied before, the “threshold” temperatures for conventionally studied spore types are comparable. Threshold temperatures are generally different for the release of each spore. In this study, threshold spore release temperatures ranged from the minimum of 10 °C to the max temperature of 21 °C, depending on the spore being released. These temperature ranges are lower than those previously recorded by Rodríguez-Rajo [14], in which maximum concentrations for Cladosporium and Alternaria were recorded when temperatures exceeded 23 and 27 °C. However, temperatures over 15 °C have been shown to increase spore concentrations compared to previous studies in Ireland [8]. The colder climate in Ireland contributes to a lack of available data for spore release above 21 °C.
Rainfall has previously correlated with a decrease in spore concentrations by rain-out and wash-out of the atmosphere [62]. Some fungal spores such as Cladosporium, Alternaria, Drechslera, Epicoccum, Pithomyces, Polythrincium and Torula have been described as “dry-weather spore types”, and do follow this expected relationship, having a negative relationship with humidity [9,29,63].
Other, more “wet weather” spore species, including numerous spores in the Phylum Ascomycota, such as Didimella, Leptosphaeria and Pleospora, have been seen to possess a positive correlation with rainfall [29]. Separately, Botrytis has previously shown a significantly high correlation with humidity, at values exceeding 90%, with storm events resulting in high proliferation of Botrytis infection [53,64,65]. These previous analyses assist in explaining the positive correlation of Ascospores and Botrytis with rainfall in this present study.
4.3. Geographical Origin of Airborne Spores
The geographical source of fungal spores arriving at the Dublin site, was seen to originate from inland areas (Figure 6). It should be noted, however, that this study only had access to one site, and the concentrations were averaged; thus, the possibility exists that peak daily concentrations could skew the results here. Nevertheless, it is an interest finding and gives prominence to the importance of inland sources. The majority of studies on airborne particle geographic and land-type origin have been pollen related [66,67,68]. In contrast to previous fungal calendars, the fungal fructification period chart presented in this investigation does not exclusively display the concentrations of each spore; it highlights the main fungal season, allergenicity and phytopathogenicity of each spore. Another point of distinction between this chart and others is the presence of yeasts, Venturia, Basidiospores and Downy mildew, which are often not presented in other calendars [23,25,27,28]. On the other hand, the extension of the presented fungal fructification periods in the present research comparisons would be inaccurate. Recent studies have stressed the importance of fungal spore origin [19,69]. In studies focusing on both fungal spores and pollen grains, grassland had been identified as the most important land type for all bioaerosol origination and is an important potential source of fungal spores. Due to the age of the data in this study, the land-type origin of the spores could not be evaluated, but the effect of the inland winds does correlate to higher fungal spore concentrations. Given the prevalence of grassland in Ireland, this is not an unexpected finding.
5. Conclusions
It is evident from the findings of this study that the ambient concentrations of fungal spores in Dublin are dominated by allergenic spore types, with Cladosporium and Alternaria being the two allergenic spores most commonly identified. However, their prevalence and allergenicity should not be considered permanent, and their characteristics should be reassessed in order to identify any changes in their allergenicity or ambient fungal spore concentrations for Dublin in contemporary studies. This study allows for an understanding of the historical influence of fungal spores within the Irish environment and can be used in the future to act as a reference for contemporary aerobiological studies. Of all spore types observed, the concentrations of spores of the phylum Basidiomycota were shown to be the most prevalent.
The most important meteorological factor found to affect spore concentrations was that of temperature. Spore growth was seen to increase, depending on the species, from a minimum of 10 °C to a maximum of 21 °C. This study of the behaviour and the effects of meteorological variables during 1978, 1979 and 1980 again provides useful information for future studies, and can be used as tool or reference point when looking at meteorological-fungal spore relationships in Ireland.
Data collected in the present study successfully determined that the majority of fungal spores that are found in Dublin originate from inland areas within Ireland, and not from across the Irish Sea in the United Kingdom or beyond. The identification that higher windspeeds are required for fungal spore transport within the island also indicates that the long-distance transport of fungal spores to Dublin from the continent is less likely.
An investigation into landcover and possible grassland sources around Dublin is a recommendation for future studies, as this would greatly assist in identifying sources of fungal spores in a more targeted manner than was possible during this campaign.
Supplementary Materials
The following supporting information can be downloaded at: https://www.mdpi.com/article/10.3390/atmos13020313/s1, Figure S1: Multivariate Regression Trees of (A) Alternaria, (B) Ascospores, (C) Basidiospores, (D) Botrytis, (E) Cladosporium, (F) Erysiphe, (G) Rust for the three studied years.
Author Contributions
Conceptualization, D.J.O., J.S. and M.M.-B.; writing—original draft preparation, E.M., J.H.C. and M.M.-B.; writing—review and editing, D.J.O.; supervision, D.J.O.; project administration, D.J.O.; funding acquisition, D.J.O. All authors have read and agreed to the published version of the manuscript.
Funding
This research was funded by Environmental Protection Agency, grant number 2018-CCRP-MS.53.f.
Institutional Review Board Statement
Not applicable.
Informed Consent Statement
Not applicable.
Acknowledgments
The authors are grateful to the following project for funding this work: 2018-CCRP-MS.53: Fungal mOnitoring NeTwork ANd Algorithm (FONTANA). Research Project of the Environmental Protection Agency (EPA).
Conflicts of Interest
The authors declare no conflict of interest.
References
- Troutt, C.; Levetin, E. Correlation of Spring Spore Concentrations and Meteorological Conditions in Tulsa, Oklahoma. Int. J. Biometeorol. 2001, 45, 64–74. [Google Scholar] [CrossRef] [PubMed]
- Burch, M.; Levetin, E. Effects of Meteorological Conditions on Spore Plumes. Int. J. Biometeorol. 2002, 46, 107–117. [Google Scholar] [PubMed]
- D’amato, G.; Chatzigeorgiou, G.; Corsico, R.; Gioulekas, D.; Jäger, L.; Jäger, S.; Kontou-Fili, K.; Kouridakis, S.; Liccardi, G.; Meriggi, A. Evaluation of the Prevalence of Skin Prick Test Positivity to Alternaria and Cladosporium in Patients with Suspected Respiratory Allergy: A European Multicenter Study Promoted by the Subcommittee on Aerobiology and Environmental Aspects of Inhalant Allergens of the European Academy of Allergology and Clinical Immunology. Allergy 1997, 52, 711–716. [Google Scholar] [PubMed]
- Rapiejko, P.; Lipiec, A.; Wojdas, A.; Jurkiewicz, D. Threshold Pollen Concentration Necessary to Evoke Allergic Symptoms. Int. Rev. Allergol. Clin. Immunol. 2004, 10, 91–94. [Google Scholar]
- Gostic, K.; Gomez, A.C.; Mummah, R.O.; Kucharski, A.J.; Lloyd-Smith, J.O. Estimated Effectiveness of Symptom and Risk Screening to Prevent the Spread of COVID-19. Elife 2020, 9, e55570. [Google Scholar] [CrossRef]
- Reich, J.; Chatterton, S.; Johnson, D. Temporal Dynamics of Botrytis Cinerea and Sclerotinia Sclerotiorum in Seed Alfalfa Fields of Southern Alberta, Canada. Plant Dis. 2017, 101, 331–343. [Google Scholar] [CrossRef] [Green Version]
- Coker, T.L.; Rozsypálek, J.; Edwards, A.; Harwood, T.P.; Butfoy, L.; Buggs, R.J. Estimating Mortality Rates of European Ash (Fraxinus Excelsior) under the Ash Dieback (Hymenoscyphus Fraxineus) Epidemic. Plants People Planet 2019, 1, 48–58. [Google Scholar] [CrossRef] [Green Version]
- O’Connor, D.J.; Sadyś, M.; Skjøth, C.A.; Healy, D.A.; Kennedy, R.; Sodeau, J.R. Atmospheric Concentrations of Alternaria, Cladosporium, Ganoderma and Didymella Spores Monitored in Cork (Ireland) and Worcester (England) during the Summer of 2010. Aerobiologia 2014, 30, 397–411. [Google Scholar] [CrossRef] [Green Version]
- Sadyś, M.; Strzelczak, A.; Grinn-Gofroń, A.; Kennedy, R. Application of Redundancy Analysis for Aerobiological Data. Int. J. Biometeorol. 2015, 59, 25–36. [Google Scholar] [CrossRef]
- Corden, J.M.; Millington, W.M. The Long-Term Trends and Seasonal Variation of the Aeroallergen Alternaria in Derby, UK. Aerobiologia 2001, 17, 127–136. [Google Scholar] [CrossRef]
- Skjøth, C.A.; Sommer, J.; Frederiksen, L.; Karlson, U.G. Crop Harvest in Denmark and Central Europe Contributes to the Local Load of Airborne Alternaria Spore Concentrations in Copenhagen. Atmos. Chem. Phys. 2012, 12, 11107–11123. [Google Scholar] [CrossRef] [Green Version]
- Stepalska, D.; Wolek, J. The Estimation of Fungal Spore Concentrations Using Two Counting Methods. Acta Agrobot. 2009, 62, 117–123. [Google Scholar] [CrossRef]
- Oliveira, M.; Guerner-Moreira, J.; Mesquita, M.M.; Abreu, I. Important Phytopathogenic Airborne Fungal Spores in a Rural Area: Incidence of Botrytis Cinerea and Oidium Spp. Ann. Agric. Environ. Med. 2009, 16, 197–204. [Google Scholar] [PubMed]
- Rodríguez-Rajo, F.J.; Iglesias, I.; Jato, V. Variation Assessment of Airborne Alternaria and Cladosporium Spores at Different Bioclimatical Conditions. Mycol. Res. 2005, 109, 497–507. [Google Scholar] [CrossRef]
- Antón, S.F.; de la Cruz, D.R.; Sánchez, J.S.; Sánchez Reyes, E. Analysis of the Airborne Fungal Spores Present in the Atmosphere of Salamanca (MW Spain): A Preliminary Survey. Aerobiologia 2019, 35, 447–462. [Google Scholar] [CrossRef]
- Jesús Aira, M.; Rodríguez-Rajo, F.-J.; Fernández-González, M.; Seijo, C.; Elvira-Rendueles, B.; Gutiérrez-Bustillo, M.; Abreu, I.; Pérez-Sánchez, E.; Oliveira, M.; Recio, M. Cladosporium Airborne Spore Incidence in the Environmental Quality of the Iberian Peninsula. Grana 2012, 51, 293–304. [Google Scholar] [CrossRef]
- Ricci, S.; Bruni, M.; Meriggi, A.; Corsico, R. Aerobiological Monitoring OfAlternaría Fungal Spores: A Comparison between Surveys in 1992 and 1993 and Local Meteorological Conditions. Aerobiologia 1995, 11, 195–199. [Google Scholar] [CrossRef]
- Şakiyan, N.; Inceoğlu, Ö. Atmospheric Concentrations of Cladosporium Link and Alternaria Nées Spores in Ankara and the Effects of Meteorological Factors. Turk. J. Bot. 2003, 27, 77–81. [Google Scholar]
- Grinn-Gofroń, A.; Çeter, T.; Pinar, N.M.; Bosiacka, B.; Çeter, S.; Keçeli, T.; Myśliwy, M.; Şahin, A.A.; Bogawski, P. Airborne Fungal Spore Load and Season Timing in the Central and Eastern Black Sea Region of Turkey Explained by Climate Conditions and Land Use. Agric. For. Meteorol. 2020, 295, 108191. [Google Scholar] [CrossRef]
- McDonald, M.; O’driscoll, B. Aerobiological Studies Based in Galway. A Comparison of Pollen and Spore Counts over Two Seasons of Widely Differing Weather Conditions. Clin. Exp. Allergy 1980, 10, 211–215. [Google Scholar] [CrossRef]
- Abu-Dieyeh, M.H.; Barham, R.; Abu-Elteen, K.; Al-Rashidi, R.; Shaheen, I. Seasonal Variation of Fungal Spore Populations in the Atmosphere of Zarqa Area, Jordan. Aerobiologia 2010, 26, 263–276. [Google Scholar] [CrossRef]
- Mitakakis, T.Z.; Guest, D.I. A Fungal Spore Calendar for the Atmosphere of Melbourne, Australia, for the Year 1993. Aerobiologia 2001, 17, 171–176. [Google Scholar] [CrossRef]
- Seasonal Fluctuations of Airborne Fungal Allergens. Elsevier Enhanced Reader. Available online: https://reader.elsevier.com/reader/sd/pii/S0953756289800085?token=EE4F79D91959E292735FF077411133F8DB14A9F6A1B1350246C69BC2A518D76A870ADD72BD1564FC26F160E97C6FA0C4&originRegion=eu-west-1&originCreation=20220116152956 (accessed on 16 January 2022).
- Bednarz, A.; Pawlowska, S. A Fungal Spore Calendar for the Atmosphere of Szczecin, Poland. Acta Agrobot. 2016, 69, 1669. [Google Scholar] [CrossRef] [Green Version]
- Kasprzyk, I.; Rzepowska, B.; Wasylów, M. Fungal Spores in the Atmosphere of Rzeszów (South-East Poland). Ann. Agric. Environ. Med. 2004, 11, 6. [Google Scholar]
- Ščevková, J.; Kováč, J. First Fungal Spore Calendar for the Atmosphere of Bratislava, Slovakia. Aerobiologia 2019, 35, 343–356. [Google Scholar] [CrossRef]
- Reyes, E.S.; de la Cruz, D.R.; Sánchez, J.S. First Fungal Spore Calendar of the Middle-West of the Iberian Peninsula. Aerobiologia 2016, 32, 529–539. [Google Scholar] [CrossRef]
- Galan, C.; Ariatti, A.; Bonini, M.; Clot, B.; Crouzy, B.; Dahl, A.; Fernandez-González, D.; Frenguelli, G.; Gehrig, R.; Isard, S.; et al. Recommended Terminology for Aerobiological Studies. Aerobiologia 2017, 33, 293–295. [Google Scholar] [CrossRef]
- Grinn-Gofroń, A.; Bosiacka, B.; Bednarz, A.; Wolski, T. A Comparative Study of Hourly and Daily Relationships between Selected Meteorological Parameters and Airborne Fungal Spore Composition. Aerobiologia 2018, 34, 45–54. [Google Scholar] [CrossRef]
- Lacey, J. Reproduction: Patterns of Spore Production, Liberation and Dispersal; Cambridge University Press: Cambridge, UK, 1986; p. 65. [Google Scholar]
- Edmonds, R.L. Aerobiology: The Ecological Systems Approach; Dowden, Hutchinson and Ross Inc.: Stroudsburg, PA, USA, 1979. [Google Scholar]
- Kasprzyk, I. Aeromycology—Main Research Fields of Interest during the Last 25 Years. Ann. Agric. Environ. Med. 2008, 15, 1–7. [Google Scholar]
- Hirst, J.M. An Automatic Volumetric Spore Trap. Ann. Appl. Biol. 1952, 39, 257–265. [Google Scholar] [CrossRef]
- Past Weather Statements—Met Éireann—The Irish Meteorological Service. Available online: https://www.met.ie/climate/past-weather-statements (accessed on 25 November 2021).
- The Irish National Meteorological Service. Available online: https://www.met.ie/climate/available-data/daily-data (accessed on 31 December 2021).
- R Core Team. R: A Language and Environment for Statistical Computing; Foundation for Statistical Computing; R Core Team: Vienna, Austria, 2021. [Google Scholar]
- Grinn-Gofroń, A.; Strzelczak, A. Changes in Concentration of Alternaria and Cladosporium Spores during Summer Storms. Int. J. Biometeorol. 2013, 57, 759–768. [Google Scholar] [CrossRef] [PubMed] [Green Version]
- Zeileis, A.; Hothorn, T.; Hornik, K. Party with the Mob: Model-Based Recursive Partitioning in R (Tech. Rep.). Retrieved Novemb. 2012, 19. [Google Scholar]
- Rasmussen, A. The Effects of Climate Change on the Birch Pollen Season in Denmark. Aerobiologia 2002, 18, 253–265. [Google Scholar] [CrossRef]
- Adams-Groom, B.; Skjøth, C.; Selby, K.; Pashley, C.; Satchwell, J.; Head, K.; Ramsay, G. Regional Calendars and Seasonal Statistics for the United Kingdom’s Main Pollen Allergens. Allergy Eur. J. Allergy Clin. Immunol. 2020, 75, 1492–1494. [Google Scholar] [CrossRef] [PubMed]
- Elvira-Rendueles, B.; Moreno, J.M.; Costa, I.; Bañón, D.; Martínez-García, M.J.; Moreno-Grau, S. Pollen Calendars of Cartagena, Lorca, and Murcia (Region of Murcia), Southeastern Iberian Peninsula: 2010–2017. Aerobiologia 2019, 35, 477–496. [Google Scholar] [CrossRef]
- Lo, F.; Bitz, C.M.; Battisti, D.S.; Hess, J.J. Pollen Calendars and Maps of Allergenic Pollen in North America. Aerobiologia 2019, 35, 613–633. [Google Scholar] [CrossRef] [PubMed] [Green Version]
- Martínez-Bracero, M.; Alcázar, P.; Díaz de la Guardia, C.; González-Minero, F.J.; Ruiz, L.; Trigo Pérez, M.M.; Galán, C. Pollen Calendars: A Guide to Common Airborne Pollen in Andalusia. Aerobiologia 2015, 31, 549–557. [Google Scholar] [CrossRef]
- Petit, J.E.; Favez, O.; Albinet, A.; Canonaco, F. A User-Friendly Tool for Comprehensive Evaluation of the Geographical Origins of Atmospheric Pollution: Wind and Trajectory Analyses. Environ. Model. Softw. 2017, 88, 183–187. [Google Scholar] [CrossRef] [Green Version]
- Donnelly, A.; Misstear, B.; Broderick, B. Real Time Air Quality Forecasting Using Integrated Parametric and Non-Parametric Regression Techniques. Atmos. Environ. 2015, 103, 53–65. [Google Scholar] [CrossRef]
- Han, Q.; Meng, F.; Hu, T.; Chu, F. Non-Parametric Hybrid Models for Wind Speed Forecasting. Energy Convers. Manag. 2017, 148, 554–568. [Google Scholar] [CrossRef]
- Wang, H.; Reponen, T.; Adhikari, A.; Grinshpun, S.A. Contribution of Fungal Spores to Organic Carbon Aerosol in Indoor and Outdoor Environments in the Greater Cincinnati Area. Aerosol Air Qual. Res. 2013, 13, 1348–1355. [Google Scholar] [CrossRef] [Green Version]
- Henry, R.; Norris, G.A.; Vedantham, R.; Turner, J.R. Source Region Identification Using Kernel Smoothing. Environ. Sci. Technol. 2009, 43, 4090–4097. [Google Scholar] [CrossRef] [PubMed]
- Ajouray, N.; Bouziane, H.; Trigo Pérez, M.M.; Kadiri, M. Variation interannuelle des spores fongiques de Tétouan (Nord-Ouest du Maroc) et calendrier sporal. J. Mycol. Méd. 2016, 26, 148–159. [Google Scholar] [CrossRef] [PubMed]
- Sarda-Estève, R.; Baisnée, D.; Guinot, B.; Sodeau, J.; O’Connor, D.; Belmonte, J.; Besancenot, J.-P.; Petit, J.-E.; Thibaudon, M.; Oliver, G.; et al. Variability and Geographical Origin of Five Years Airborne Fungal Spore Concentrations Measured at Saclay, France from 2014 to 2018. Remote Sens. 2019, 11, 1671. [Google Scholar] [CrossRef] [Green Version]
- Genera of Phytopathogenic Fungi: GOPHY 1—Science Direct. Available online: https://www.sciencedirect.com/science/article/pii/S0166061617300209 (accessed on 29 October 2021).
- Simon-Nobbe, B.; Denk, U.; Pöll, V.; Rid, R.; Breitenbach, M. The Spectrum of Fungal Allergy. Int. Arch. Allergy Immunol. 2008, 145, 58–86. [Google Scholar] [CrossRef] [Green Version]
- Martínez-Bracero, M.; González-Fernández, E.; Wójcik, M.; Alcázar, P.; Fernández-González, M.; Kasprzyk, I.; Rodríguez-Rajo, F.J.; Galán, C. Airborne Fungal Phytopathological Spore Assessment in Three European Vineyards from Different Bioclimatic Areas. Aerobiologia 2020, 36, 715–729. [Google Scholar] [CrossRef]
- Pecero-Casimiro, R.; Maya-Manzano, J.M.; Fernández-Rodríguez, S.; Tormo-Molina, R.; Silva-Palacios, I.; Monroy-Colín, A.; Gonzalo-Garijo, Á. Pollen Calendars and Regional Gradients as Information Tools in the Extremadura Pollen Monitoring Network (SW Spain). Aerobiologia 2020, 36, 731–748. [Google Scholar] [CrossRef]
- Olsen, Y.; Skjøth, C.A.; Hertel, O.; Rasmussen, K.; Sigsgaard, T.; Gosewinkel, U. Airborne Cladosporium and Alternaria Spore Concentrations through 26 Years in Copenhagen, Denmark. Aerobiologia 2020, 36, 141–157. [Google Scholar] [CrossRef]
- Apangu, G.P.; Frisk, C.A.; Adams-Groom, B.; Satchwell, J.; Pashley, C.H.; Skjøth, C.A. Air Mass Trajectories and Land Cover Map Reveal Cereals and Oilseed Rape as Major Local Sources of Alternaria Spores in the Midlands, UK. Atmos. Pollut. Res. 2020, 11, 1668–1679. [Google Scholar] [CrossRef]
- Reyes, E.S.; de la Cruz, D.R.; Merino, E.; Sánchez, J.S. Meteorological and Agricultural Effects on Airborne Alternaria and Cladosporium Spores and Clinical Aspects in Valladolid [Spain]. Ann. Agric. Environ. Med. 2009, 16, 53–61. [Google Scholar]
- Saari, S.; Mensah-Attipoe, J.; Reponen, T.; Veijalainen, A.M.; Salmela, A.; Pasanen, P.; Keskinen, J. Effects of Fungal Species, Cultivation Time, Growth Substrate, and Air Exposure Velocity on the Fluorescence Properties of Airborne Fungal Spores. Indoor Air 2015, 25, 653–661. [Google Scholar] [CrossRef] [PubMed]
- Vélez-Pereira, A.M.; De Linares, C.; Canela, M.-A.; Belmonte, J. Logistic Regression Models for Predicting Daily Airborne Alternaria and Cladosporium Concentration Levels in Catalonia (NE Spain). Int. J. Biometeorol. 2019, 63, 1541–1553. [Google Scholar] [CrossRef] [PubMed]
- Grinn-Gofroń, A.; Nowosad, J.; Bosiacka, B.; Camacho, I.; Pashley, C.; Belmonte, J.; De Linares, C.; Ianovici, N.; Manzano, J.M.M.; Sadyś, M. Airborne Alternaria and Cladosporium Fungal Spores in Europe: Forecasting Possibilities and Relationships with Meteorological Parameters. Sci. Total Environ. 2019, 653, 938–946. [Google Scholar] [CrossRef] [PubMed]
- Mallo, A.C.; Nitiu, D.S.; Gardella Sambeth, M.C. Airborne Fungal Spore Content in the Atmosphere of the City of La Plata, Argentina. Aerobiologia 2011, 27, 77–84. [Google Scholar] [CrossRef]
- Ingold, C. T Fungal Spores. Their Liberation and Dispersal; Oxford, Clarendon Press: Oxford, UK, 1971. [Google Scholar]
- Ianovici, N. Atmospheric Concentrations of Selected Allergenic Fungal Spores in Relation to Some Meteorological Factors, in Timişoara (Romania). Aerobiologia 2016, 32, 139–156. [Google Scholar] [CrossRef]
- Jarvis, W. Epidemiology. In The Biology of Botrytis; Coley-Smith, J.R., Verhoeff, K., Jarvis, W.R., Eds.; Academic Press Inc.: London, UK, 1980. [Google Scholar]
- Latorre, B.; Rioja, M. The Effect of Temperature and Relative Humidity on Conidial Germination of Botrytis Cinerea. Int. J. Agric. Nat. Resour. 2002, 29, 66–72. [Google Scholar] [CrossRef]
- Oteros, J.; García-Mozo, H.; Alcázar, P.; Belmonte, J.; Bermejo, D.; Boi, M.; Cariñanos, P.; de la Guardia, C.D.; Fernández-González, D.; González-Minero, F. A New Method for Determining the Sources of Airborne Particles. J. Environ. Manag. 2015, 155, 212–218. [Google Scholar] [CrossRef]
- Sarda-Estève, R.; Baisnée, D.; Guinot, B.; Petit, J.E.; Sodeau, J.; O’Connor, D.; Besancenot, J.P.; Thibaudon, M.; Gros, V. Temporal Variability and Geographical Origins of Airborne Pollen Grains Concentrations from 2015 to 2018 at Saclay, France. Remote Sens. 2018, 10, 1932. [Google Scholar] [CrossRef] [Green Version]
- Rojo, J.; Oteros, J.; Picornell, A.; Ruëff, F.; Werchan, B.; Werchan, M.; Bergmann, K.-C.; Schmidt-Weber, C.B.; Buters, J. Land-Use and Height of Pollen Sampling Affect Pollen Exposure in Munich, Germany. Atmosphere 2020, 11, 145. [Google Scholar] [CrossRef] [Green Version]
- Fernández-Rodríguez, S.; Sadyś, M.; Smith, M.; Tormo-Molina, R.; Skjøth, C.A.; Maya-Manzano, J.M.; Silva-Palacios, I.; Gonzalo-Garijo, Á. Potential Sources of Airborne Alternaria spp. Spores in South-West Spain. Sci. Total Environ. 2015, 533, 165–176. [Google Scholar] [CrossRef]
Figure 1.
Spore sampler location (Red).

Figure 2.
Box plot of the monthly fungal spore concentrations of each year of the study. The bottom and top borders of each box indicate the quartiles Q1 to Q3. The bold line bisecting each box indicates the median. Whiskers indicate 1.5 interquartile ranges from the median and dots represent outlier values.

Figure 3.
Predominantly identified fungal spores during the sampling period.

Figure 4.
Correlation plot between spore concentrations and meteorological variables for the 3 studied years. Colour and size of each circle indicate the correlation coefficient, meteorological parameters without any significant correlations are not shown.
Figure 4.
Correlation plot between spore concentrations and meteorological variables for the 3 studied years. Colour and size of each circle indicate the correlation coefficient, meteorological parameters without any significant correlations are not shown.

Figure 5.
Fungal spore fructification period chart for all the spores identified.

Figure 6.
Origin of fungal spores in Dublin, 1978, 1979 and 1980, combined origins of fungal spores, and windrose of joint wind direction and speed, in Dublin, 1978–1980.
Figure 6.
Origin of fungal spores in Dublin, 1978, 1979 and 1980, combined origins of fungal spores, and windrose of joint wind direction and speed, in Dublin, 1978–1980.


Table 1.
Multivariate regression trees threshold and p-values of every meteorological parameter with a significant influence on the fungal spore concentrations in this study. N1: number of data in which the parameter was higher than the threshold; N2: number of data in which the parameter was lower than the threshold.
| Year | Selected Parameter | Threshold | p-Value | N1 | N2 | |
|---|---|---|---|---|---|---|
| Alternaria | 1978 | |||||
| 1979 | Maximum temperature (°C) | 17.9 | 0.001 | 52 | 129 | |
| Maximum temperature (°C) | 15.4 | <0.001 | 44 | 85 | ||
| 1980 | Mean 10 cm soil temperature (°C) | 17.275 | 0.002 | 7 | 118 | |
| Maximum temperature (°C) | 15.3 | 0.006 | 79 | 39 | ||
| Ascospores | 1978 | Precipitation Amount (mm) | 0.9 | <0.001 | 35 | 105 |
| 1979 | 09utc Grass Minimum Temperature (°C) | 5.2 | <0.001 | 102 | 79 | |
| Mean 10 cm soil temperature (°C) | 10.550 | <0.001 | 21 | 58 | ||
| Precipitation Amount (mm) | 4 | <0.001 | 9 | 49 | ||
| Mean 10 cm soil temperature (°C) | 7.150 | 0.032 | 18 | 31 | ||
| Mean CBL pressure (hpa) | 1001.2 | <0.001 | 30 | 72 | ||
| 1980 | 09utc Grass Minimum Temperature (°C) | 4.5 | <0.001 | 62 | 33 | |
| Mean CBL pressure (hpa) | 999.2 | 0.041 | 26 | 7 | ||
| Basidiospores | 1978 | 09utc Grass Minimum Temperature (°C) | 10.7 | 0.002 | 31 | 109 |
| 1979 | Maximum temperature (°C) | 17 | <0.001 | 68 | 113 | |
| Mean 10 cm soil temperature (°C) | 17.775 | 0.029 | 12 | 101 | ||
| 1980 | 09utc Grass Minimum Temperature (°C) | 8.5 | <0.001 | 35 | 60 | |
| 09utc Grass Minimum Temperature (°C) | 3.9 | 0.033 | 33 | 27 | ||
| Botrytis | 1978 | |||||
| 1979 | Maximum temperature (°C) | 21.5 | <0.001 | 9 | 172 | |
| Mean 10 cm soil temperature (°C) | 15.700 | <0.001 | 59 | 113 | ||
| Mean 10 cm soil temperature (°C) | 13.625 | <0.001 | 32 | 81 | ||
| 1980 | Precipitation Amount (mm) | 5.6 | 0.04 | 8 | 87 | |
| wind direction (deg) | 260 | 0.005 | 35 | 52 | ||
| 09utc Grass Minimum Temperature (°C) | 4.4 | 0.01 | 30 | 22 | ||
| Cladosporium | 1978 | Potential evapotranspiration (mm) | 3.4 | <0.001 | 12 | 128 |
| Mean 10 cm soil temperature (°C) | 17.975 | 0.012 | 10 | 118 | ||
| 1979 | Maximum temperature (°C) | 21.5 | <0.001 | 9 | 172 | |
| Mean 10 cm soil temperature (°C) | 15.700 | <0.001 | 59 | 113 | ||
| Mean 10 cm soil temperature (°C) | 13.625 | <0.001 | 32 | 81 | ||
| 1980 | Mean 10 cm soil temperature (°C) | 17.275 | <0.001 | 7 | 88 | |
| Mean 10 cm soil temperature (°C) | 13.075 | 0.001 | 69 | 19 | ||
| Erysiphe | 1978 | Mean 10 cm soil temperature (°C) | ||||
| 1979 | 09utc Grass Minimum Temperature (°C) | 10.06 | 0.005 | 33 | 148 | |
| 1980 | Mean 10 cm soil temperature (°C) | 14.2 | <0.001 | 66 | 29 | |
| Tilletiopsis | 1978 | Mean CBL pressure (hpa) | 1012.2 | 0.012 | 30 | 110 |
| 1979 | Maximum temperature (°C) | 16.2 | 0.007 | 83 | 98 | |
| 1980 | ||||||
| Uredospores | 1978 | Mean CBL pressure (hpa) | 994.1 | 0.002 | 132 | 8 |
| 1979 | Mean 10 cm soil temperature (°C) | 19.750 | <0.001 | 7 | 174 | |
| Mean 10 cm soil temperature (°C) | 16.700 | <0.001 | 36 | 138 | ||
| Mean 10 cm soil temperature (°C) | 15.050 | <0.001 | 45 | 93 | ||
| Mean 10 cm soil temperature (°C) | 13.925 | 0.005 | 9 | 84 | ||
| 1980 | wind direction (deg) | 310 | <0.001 | 16 | ||
| Highest ten-minute mean wind speed (kt) | 21 | 0.003 | 7 | 72 |
Publisher’s Note: MDPI stays neutral with regard to jurisdictional claims in published maps and institutional affiliations. |
© 2022 by the authors. Licensee MDPI, Basel, Switzerland. This article is an open access article distributed under the terms and conditions of the Creative Commons Attribution (CC BY) license (https://creativecommons.org/licenses/by/4.0/).
Share and Cite
MDPI and ACS Style
Martínez-Bracero, M.; Markey, E.; Clancy, J.H.; Sodeau, J.; O’Connor, D.J. First Long-Time Airborne Fungal Spores Study in Dublin, Ireland (1978–1980). Atmosphere 2022, 13, 313. https://doi.org/10.3390/atmos13020313
AMA Style
Martínez-Bracero M, Markey E, Clancy JH, Sodeau J, O’Connor DJ. First Long-Time Airborne Fungal Spores Study in Dublin, Ireland (1978–1980). Atmosphere. 2022; 13(2):313. https://doi.org/10.3390/atmos13020313
Chicago/Turabian StyleMartínez-Bracero, Moisés, Emma Markey, Jerry Hourihane Clancy, John Sodeau, and David J. O’Connor. 2022. "First Long-Time Airborne Fungal Spores Study in Dublin, Ireland (1978–1980)" Atmosphere 13, no. 2: 313. https://doi.org/10.3390/atmos13020313
Note that from the first issue of 2016, this journal uses article numbers instead of page numbers. See further details here.