1. Introduction
Fungi and fungus-like groups (such as Oomycetes) are eukaryotic, non-chlorophyllous, and heterotrophic organisms that depend on external nutrients for survival. There are an estimated 1.5–5 million species of fungi encompassing a wide variety of life cycles, metabolisms, morphogenesis, and ecologies, including mutualism, parasitism, and commensalism with many live organisms [
1].
Fungi are well known for their detrimental effect on crops causing different agricultural diseases throughout history, causing significant economic damage and loss of life. Examples of this include
Phytophthora infestans (potato blight) which was the primary cause of the Irish famine [
2]. Molds such as
Alternaria,
Aspergillus,
Cladosporium,
Penicillium, among others [
3], are also frequently seen to contaminate food during storage.
Equally, fungal spores can directly affect the health of both human and animal populations. Specific taxa are often linked to respiratory allergy symptoms [
4] or related to asthma attacks or even acute respiratory failure. In more recent times this could be confused with the SARS-CoV-2 (COVID-19) [
5].
The main goal of this review is to summarise and compare the most recent knowledge regarding airborne fungal and fungus-like spores, as well as the sampling methods used for their analyses.
1.1. Airborne Fungal Spores
Air contains a large number of biological entities, ranging in size from viruses (nm) and bacteria (µm) to insect fragments (cm) [
6]. Of these primary biological aerosol particles (PBAPs) fungal spores are a major contributor and are found across a wide range of biogeographic regions, and over substantial periods of the year. The majority of fungal spores in the air originate from farms, forests, green spaces and decomposing plant material, [
6,
7].
The majority of spores are released into the air, where they will remain for some time before being transported different distances (short or long range). Spores can be aerosolised and splashed from the surfaces of their colonies by rainwater drops. Hence, such particles can be liberated over short distances (a few centimetres) or can be carried over longer distances (hundreds of kilometres, even between continents) by the wind as free spores, or as part of other aerosols [
8,
9].
Interest in fungal spores has been on the rise over the last few decades (
Figure 1), with the real-time determination of spore concentration being seen to be of increasing importance in recent years [
10,
11,
12]. Research associated with fungal spores has been undertaken by a variety of different viewpoints and disciplines, encompassing areas from environmental sciences to biochemistry and applied microbiology (
Figure 2).
1.2. Significant Fungal Species
The
Cladosporium and
Alternaria genera are the most studied fungal spores, and they have been monitored in several geographical regions including the United Kingdom [
13,
14,
15], Denmark [
16], Poland [
17], Portugal [
18], Spain [
19,
20], Italy [
21], Turkey [
22], China [
23], South Africa [
24], Nigeria [
25], and the United States [
26], among others. The importance of these genera lies in the economic and health losses they can both cause: both genera are known plant pathogens [
27,
28,
29], both have many phytotoxic metabolites which can also affect mammalian cells [
30,
31] and have aeroallergens linked to effects on health [
32]. Although allergy or pathogeny concentration thresholds have not been yet established for
Cladosporium and
Alternaria, different studies have proposed some. For
Cladosporium, several concentration thresholds between 2000–4000 spores/m
3 have been suggested [
33,
34], although more recent studies have narrowed the values to 500–1500 spores/m
3 [
35]. Generally, a threshold of 100 spores/m³ has taken as high daily concentration of
Alternaria [
36], although earlier studies suggest it should be as low as 50 spores/m
3 [
37], with different levels being adapted in each study (10–30 spores/m
3 in example [
35]).
Crop damage is an important focus in fungal spore studies. In the case of vineyards, the most important spores noted are
Botrytis cinerea Pers. and
Erysiphe necator [
38,
39,
40]. Several studies have focussed on these spores [
40,
41,
42,
43]; however, their concentrations in the air were relatively low when compared to concentrations of
Cladosporium [
7,
44] or other prevalent fungal spore types.
A number of other species have also been studied due to their morphological differences, allowing for identification. These include
Coprinus,
Didymella,
Epiccocum,
Erysiphe,
Ganoderma,
Nigrospora,
Pithomyces,
Polythrincium,
Torula and
Ustilago, among other genera [
6]. Nevertheless, the total number of spore species considered for any given study varies with the location and main objective of the work.
Table 1 highlights recently reported concentration ranges associated with the eight most abundant spores. Their relationship with meteorological parameters and the study zones are also noted. This table should not be considered exhaustive, papers included in
Table 1 represent only recent studies investigating the correlation between meteorological variables and spore concentration, categorised by species.
1.3. Indoor and Outdoor Fungal Spores (Occupational Exposure Fungal Spores)
The term “sick building syndrome”, was first coined in the 1970s, describing a situation in which the occupants of a building experienced acute health problems covering a variety of symptoms associated with time spent in a given building [
45,
46].
Described as a group of symptoms attributed to the physical environment of a specific building and linked to increased health problems for the workers of modern office buildings [
45,
46]. Within the biological causes, the presence of fungus and its spores has been cited as an explanation for some symptoms. Several studies have focussed on the comparison of indoor and outdoor fungal spores, highlighting the disparate environments that could be seen [
47,
48]. Thus, stressing the influence of fungal spores in such environments.
Table 1.
Parameters correlated with fungal spores by study region. Temp: Air temperature, Tmin: minimum temperature, Tmean: Average temperature, Tmax: maximum temperature, Tosc: Oscillation of temperature, RH: Relative Humidity, Rf: Rainfall, Rf(−3): rainfall of 3 days before, AP: air pressure, Wind: wind velocity, SR: Solar radiation, (−) negative correlations, (hourly): parameters compared via hourly data, %: percentage of the spore over the total amount of spores in the study.
| Fungal Spores | Meteorological Parameters Associated with Release | Season | Region | Concentration Range | Citation |
|---|
| Country | Biogeographic Region | Average | SD | % |
|---|
| Alternaria | Tmin Tmax Tmean | 2005–2007 | Portugal | Mediterranean (Urban) | 2161 | 405.00 | 1.14% | [18] |
| Tmin Tmax Tmean | 2005–2007 | Mediterranean (Rural) | 10460 | 288.00 | 1.03% |
| Tmin Tosc Rf (−3) | 2000–2012 | Spain | Fresh continental | 17016 | 15,022.75 | | [35] |
| Temp/(−) Rainfall | 2010 | Ireland | Cold temperate | 546 | | 0.41% | [14] |
| Temp | 2010 | UK | Cold temperate | 1180 | | 0.22% |
| Tmin Tmax Tmean | 2005–2007 | Spain | Mediterranean | 6443 | 2747.11 | 3.45% | [49] |
| Temp/(−) Wind Rf | 2013 | Poland | Continental | 8648 | | 1.59% | [7] |
| Cladosporium | Tmin Tmax Tmean/(−) Mean RH | 2005–2007 | Portugal | Mediterranean (Urban) | 112,769 | 13,710.62 | 59.54% | [18] |
| Tmin Tmax Tmean/(−) Mean RH | 2005–2007 | Portugal | Mediterranean (Rural) | 634,510 | 21,008.98 | 62.58% |
| Tmin Tosc | 2000–2012 | Spain | Fresh continental | 387,393 | 225,462.60 | | [35] |
| Temp SR/−Rf | 2010 | Ireland | Cold temperate | 127,367 | | 94.76% | [14] |
| Temp | 2010 | UK | Cold temperate | 536,977 | | 98.42% |
| Tmin Tmax Tmean/(−) SR | 2005–2007 | Spain | Mediterranean | 121,944 | 39,880.82 | 66.50% | [49] |
| Temp Wind | 2013 | Poland | Continental | 346,135 | | 63.49% | [7] |
| Coprinus | Tmin Tmax Tmean RH Rf | 2010–2012 | Cuba | Subtropical | 28,468 | | 7.7–17.08% | [50] |
| RH Rf/(−) Tmin Tmax Tmed | 2005–2007 | Portugal | Mediterranean (Urban) | 1272 | 840.95 | 0.67% | [18] |
| RH Rf/(−) Tmin Tmax Tmed | 2005–2007 | Portugal | Mediterranean (Rural) | 5999 | 1104.94 | 0.59% |
| Didimella | Temp RH Rf/−SR AP | 2010 | Ireland | Cold temperate | 2380 | | 1.77% | [14] |
| RH Rf/−SR AP | 2010 | UK | Cold temperate | 6669 | | 1.22% |
| Temp RH (hourly) | 2013 | Poland | Continental | 165,316 | | 32.16% | [7] |
| Epicoccum | Tmin Tmax Tmean | 2005–2007 | Portugal | Mediterranean (Urban) | 489 | 170.39 | 0.26% | [18] |
| Tmin Tmax Tmean | 2005–2007 | Portugal | Mediterranean (Rural) | 3196 | 317.91 | 0.32% |
| Temp Wind (hourly) | 2014 | Poland | Continental | 1413 | | 0.26% | [7] |
| Ganoderma | Tmin Tmax Tmean RH Rf | 2010–2012 | Cuba | Subtropical | 1921 | | 0.54–0.66% | [50] |
| Tmin Tmax Tmean | 2005–2007 | Portugal | Mediterranean (Urban) | 6457 | 1444.29 | 3.41% | [18] |
| Tmin Tmax Tmean | 2005–2007 | Portugal | Mediterranean (Rural) | 1556 | 134.82 | 0.15% |
| Temp/−Rf | 2010 | Ireland | Cold temperate | 4113 | | 3.06% | [14] |
| Temp | 2010 | UK | Cold temperate | 766 | | 0.14% |
| Temp RH/(−) Wind Rf | 2015 | Poland | Continental | 3586 | | 0.66% | [7] |
| Leptosphaeria | Rf | 2005–2007 | Portugal | Mediterranean (Urban) | 172 | 19.16 | 0.09% | [18] |
| Rf RH/(−) Tmax | 2005–2007 | Portugal | Mediterranean (Rural) | 2389 | 368.64 | 0.24% |
| Rf, Temp & RH (hourly) | 2016 | Poland | Continental | 7112 | | 1.31% | [7] |
| Pleospora | RH Rf | 2005–2007 | Portugal | Mediterranean (Urban) | 213 | 64.61 | 0.11% | [18] |
| RH Rf/(−) Tmax | 2005–2007 | Portugal | Mediterranean (Rural) | 657 | 38.94 | 0.06% |
| Temp Wind (hourly) | 2017 | Poland | Continental | 715 | | 0.13% | [7] |
2. Methods of Capture and Analysis
With such a wide array of research disciplines dedicated to understanding the role that fungal spores can play, there have been a plethora of sampling methods developed. Many traps have been designed for one specific experiment or set of conditions. Rockett, Kramer, and Collin, [
51] described several traps that were developed between the 1920s and 1960s that have been drastically revised, replaced, or made obsolete over time. While more comprehensive discussions of PBAP can be seen in the literature, by West & Kimber, for example [
52], in this study only the most common methods and most recently developed instrumentation are discussed and compared. However, this is not intended to act as an exhaustive list of methodologies.
For a better comparison of the particle samplers already used for fungal spores, comparison
Table 2 is provided. These samplers will be explained in more detail in the following sections, below.
2.1. Volumetric Samplers
The Hirst spore trap has been used as the basic tool for PBAPs analysis, with approximately 637 samplers of this type currently in operation around the world [
52]. While primarily used for pollen, more than 73% of Hirst samplers are utilised for fungal spores monitoring.
The Hirst-type sampler is an impaction-based volumetric sampler with a suction rate of 10 L per minute, powered by a vacuum pump. Its sampling protocols require at least one full day of operation before the sample drum can be changed and processed, although this period is often extended to 7-days for logistical and financial reasons. Analysis is a slow process (via optical identification) and, as a result, only a small sub-sample of individual samples are examined. The overall count is hence calculated via extrapolation [
53,
54]. The data also relies on the skill of the operator and so there have been concerted efforts of late to evaluate the data quality [
55,
56,
57] and to standardise such methods [
55,
58].
Another limitation of this sampler type is the electricity requirement, as a mains power supply is necessary for its operation. Thus, remote sampling can be difficult. Nevertheless, they are the most used samplers in the literature studies, particularly those focussed on fungal spores as allergenic particles or as crop disease producers [
7,
14,
40,
49].
Based on the Hirst-type sampler, other volumetric samplers have been developed, incorporating a smaller design, and allowing monitoring where electricity is not available via an integrated battery. One example of such a device is the Personal Volumetric Air Sampler, which is well suited to the sampling of spores in remote locations, allowing for sampling far from sources of electricity [
59]. These types of spore traps are also volumetric (10 L/min) and, in this case, one should use a clockwork mechanism to move a microscope slide coated with Vaseline at the same rate as the Hirst (2 mm/h) [
47,
60].
Finally, a Rotorod air sampler is another impaction instrument which has been used in ambient monitoring. This method is based on increasing the speed of airflow towards the trapping surface to impact particles. This is undertaken via the rotation of the rod at high speeds in a circular motion. The sampler is operated using a dry battery, making it well suited for use in the field, and is relatively independent of external wind speed [
61]. This has made this sampler useful for studies in remote areas. While there are several studies related to fungal spores using this sampler [
61], the standardisation of the results is still being undertaken [
62].
2.2. Non-Volumetric Samplers
The simplest samplers of this type are generally termed “Passive samplers” as they work by passive deposition or passive impaction. These types of samplers are the basis of many fungal spore studies in the USA [
52]. They have been shown to work relatively well in areas without access to electricity for monitoring coffee rust and sugarcane rust in Mexico [
40,
52]. These samplers have shown R2 values of up to 0.61 when compared with Hirst samplers. The dependence on wind speed has been noted, with lower volumes of spores captured at lower wind speeds [
40]. Due to this dependence, “Passive samplers” are useful for airborne fungal spore recognition and they have been recommended for qualitative analysis in remote areas, where volumetric samplers cannot be used [
40].
2.3. Culture Methods
Culture-based techniques have been used for the evaluation of ambient fungal content, with both passive and active methodologies used.
The most commonly used sampler utilising this method is the Andersen sampler. This sampler is a Multi-stage (cascade) impactor which collects spores onto agar plates. With this sampler, different sized spores can be cultured separately, and it has been used indoors and outdoors in recent studies [
48,
63].
Another example of a volumetric sampler using Petri dishes is the Burkard portable air sampler which makes use of agar plates (Burkard Manufacturing Co., Ltd., Rickmansworth, Hertfordshire, United Kingdom). This allows for the impaction of fungal spores directly onto the growing medium with a known suction volume.
The two methods explained above have been compared previously, with results showing that the Andersen Sampler has a higher collection efficiency for the most important fungal species.
Using this analysis method of culture-based analysis, species differentiation is much easier compared to microscopic differentiation, but the process of culturing samples is also time-consuming in of itself, and the overall fungal spore count tends to be underestimated due to the fact that not all fungal spores are cultivable [
14]. Furthermore, these methods require culture chambers to maintain the plate temperatures between 25 and 37 °C for a minimum of 48 h, causing a loss of time and energy in the process.
2.4. Real-Time Light Induced Fluorescence Instruments
2.4.1. Ultraviolet Aerodynamic Particle Sizer (UV-APS)
The UV-APS utilises both particle fluorescence and size data to designate ambient aerosol particles as being potentially biological in nature. It has been extensively used in previous studies for the identification and characterisation of fungal material and is based on a prototype developed by Hairston, Po, and Quant [
64]. The UV-APS is unusual in the field of real-time bioaerosol detection, in that it obtains the actual aerodynamic size (Da) of a particle. This is opposed to most devices, which calculate the optical size of particles using Mie scattering [
65,
66].
The UV-APS samples ambient air at a rate of 5 L/min. This airflow is then split, with 1 L min
−1 used as the analysed sample. The remaining 4 L/min of the air sample is used as a sheath flow, so that the 1 L/min particle stream can be moved to the centre flow. A 355 nm diode-pumped, frequency-tripled Neodymium: Yttrium Aluminium Garnet (Nd:YAG) laser measures the intensity and number of fluorescent particles. Through the use of an elliptical mirror, fluorescent emission (between 430–580 nm) is captured from particles, with emissions and scattered light differentiated from each other using filters at 410 nm and 630 nm. Particle fluorescence intensity, number of particles, and particle’s aerodynamic size are then recorded. In order to refine the instrument’s capabilities, the laser was changed from continuous wave to a pulsed excited laser. A 355 nm diode-pumped, frequency-tripled Nd:YAG UV laser was used to excite particles for fluorescence detection. An appropriate detector collected the scattered light in order to determine the particle size, and values were checked against a particle size database [
65,
66].
The UV-APS determines total and fluorescent particle concentrations summed over a set period of time, instead of outputting single-particle information which is different from some of the more modern Light-Induced Fluorescence (LIF) instrumentation [
67]. It has been proven that the UV-APS is able to differentiate between different species of fungal spores in a lab setting [
68]. However, this analysis was done under very controlled conditions and would be unlikely to allow for differentiation in real world environments. The UV-APS has been co-located with other real-time devices and traditional monitors. In one such study, the instrument was placed in a rural site with a Wideband Integrated Bioaerosol Sensor (WIBS) and a Hirst impactor. The UV-APS fluorescent concentration values were seen to correlate well with that of the fungal spore counts, noted in the Hirst (R2 = 0.71). Equally, total particle concentration from the UV-APS also associated remarkably well with that of the WIBS total particle (R2 = ~0.9). Similarly, the fluorescent UV-APS values had similar concurrent values with that of the WIBS FL2 and FL3 detection channels (R2 = 0.68 and 0.78) [
69]. This work was one of the first instances highlighting the correlation between the UV-APS and other ambient monitors.
The UV-APS has also seen use as a standard/control device for evaluation and interpretation of results from untested, newly developed, or mechanically or scientifically different apparatus. Such evaluations using a UV-APS system as a control device include the UV-LED continuous ambient air monitoring machine (the TAC-BIO
® bioaerosol detector, by research international, Monroe, WA, USA), and the SKC BioSampler [
70,
71].
Studies using the UV-APS in indoor environments have been undertaken; however, the reduced scope and number of these studies compared to those focussed on outdoor environments has limited the usefulness of the collected information [
72].
2.4.2. Wideband Integrated Bioaerosol Sensor (WIBS)
The WIBS is a three-fluorescence channel (namely FL1, FL2 and FL3) single particle monitor. The WIBS detects Fluorescent Aerosol Particles (FAP) in real-time using Light Induced Fluorescence (LIF). Given that bioaerosol have fluorescent properties, this signal is sometimes used as a proxy for bioaerosols.
All WIBS models operate slightly differently, but only with regard to the exact volumes of air used in the sampling of ambient environments. The operational breakdown of the commercially available WIB4A is as follows: The particles are passed into the main optical chamber at 2.5 L/min. Next, 0.3 L/min of this air is separated for use as the sample flow, which will be measured by the device. The rest of the air (2.2 L/min) is then filtered and used to form a sheath flow to confine the sample flow in a vertical column of air. This sheath flow, along with a small bleed flow, are used for the purging of irrelevant particulate matter from the optical chamber. A continuous wave diode laser of 635 nm detects particles as they pass though the optical chamber, while Mie scattering from the illuminated particle is used to get particle size and shape/asymmetry factor. The “shape” output is given as a value between 0 and 100 where a value of zero is a perfect sphere and a value closer to 100 is shaped like a rod [
65]. Two xenon flash lamps at 280 nm and 370 nm are used for particle fluorescence excitation. Detector wavelength bands of 310–400 nm and 420–650 are then used to detect the fluorescence emission that result from the interaction with the two flash lamps. Fluorescence signals are divided into three detector channels, namely FL1 (excitation at 280 nm detection between 310–400 nm), FL2, and FL3 (excitation at 280 and 370 nm, respectively, and detection between 420 and 650 nm) [
65,
66,
73].
The WIBS instrumentation has primarily been used in outdoor studies demonstrating its capacities as a total fungal spore monitor [
73]. While the total fungal spore count (from Hirst) and the total fluorescence (WIBS) have been seen to correlate with WIBS outputs, previously (R2 0.4–0.7) [
63,
67], discrepancies between the two instruments were noted at periods of very high
Cladosporium concentrations.
More recent outdoor studies have used WIBS for monitoring of numerous bioaerosols, including fungal spores [
74]. They characterised the fluorescent aerosol particles (FAPs) present in the city of Tianjin in summertime. The WIBS-4A identified likely fungal spores that made up a major proportion of the diurnal peaks observed at sunrise and in the evening. When relative humidity rose above 65%, FL1 channel concentration of FAPs was significantly (
p < 0.05) higher than when relative humidity (RH) was below 65%, showing that humidity possibly plays a role in aerosolisation of particles such as fungal spores. The RH also increases from midnight to sunrise, following the same diurnal pattern as the FAP levels, indicating that relative humidity is a possible driver of the diurnal trend.
Equally, several indoor studies have been carried out. These mainly consist of laboratory assessments of the WIBS testing capabilities and limitations [
75,
76].The majority of tests carried out with WIBS instrumentation occur in outdoor environments, including the testing of agricultural emissions sources, and the potential FBAP impact of different meteorological conditions [
77,
78]. Although, more recently the instrument has been used in indoor occupational settings [
79].
2.4.3. BioScout
The BioScout was created at the Tampere University of Technology and is an optical LIF real-time bioaerosol instrument, similar in design and function to the UV-APS. Data can be recorded at a time resolution of 1 ms, and the optimised particle size range or operation is between 0.3 and 5 μm.
Autofluorescence of individual biological particles within the BioScout is achieved by use of a 405 nm continuous wave laser diode running at 200 mW optical power. Similar to the UV-APS, scattered light and autofluorescence are captured from particles that have become excited, via use of an elliptical mirror. A beam splitter is then used to focus the two beams onto two photomultiplier tubes (PMTs). A 442 nm pass filter is used to isolate the autofluorescence, as the scattered light is used for optical particle size determination. The fluorescence intensity is divided between sixteen different intensity channels. Data can be recorded at a time resolution of 1 ms and the optimised particle size range or operation is between 0.3 and 5 μm. In previous work the UV-APS has been used as a reference instrument in the BioScout particle size calibration, as described below [
65,
80].
The UV-APS has been used as a reference instrument in the BioScout particle size calibration and testing [
65,
80]. Ambient fungal spore concentrations can be calculated with the BioScout, but only if the BioScout fluorescent particle fraction (FPF) values for local common fungal spores are known [
65,
81]. Another previous study found that fluorescence-based instruments might underestimate the amount of
Cladosporium spores, given that they output much lower FPF values compared to other fungal spore species [
81]. This is of particular interest given
Cladosporium spores are the most dominant fungal spore found in the ambient air.
The use of the BioScout in such studies highlight the versatility of the device to not only be used for ambient air measurement, but also for use in studies related to specific scenarios that result in aerosolisation of potentially harmful fungal spores and other FBAPs.
2.4.4. Instantaneous Bioaerosol Analysis and Collection (IBAC)
The IBAC (previously known as the FIDO B2, and the Instantaneous Biological Analyzer and Collector (IBAC)), is a LIF continuous air monitor initially developed by ICx Biodefense for the purpose of detecting potential threats related to biological aerosols and acting as an early warning system. It can potentially differentiate between biological and non-biological particles via particle fluorescence (utilising a 405 nm laser as an excitation source). If the integrated florescence emitted by a particle between 450–600 nm exceeds a pre-set threshold, it is determined to be fluorescent/biological. The device also divides particles into small (less than 1.5 µm), and large (greater than or equal to 1.5 µm). Thus, there are four different groups based on both size and fluorescence. IBAC is designed with bio-threat detection and warning in mind. Thus, the IBAC-2 has an additional filter sampler (secondary sampling system) which only commences sample collection upon detection of high concentration of fluorescent particles, allowing analysis of the most important desired air samples in great detail. As a result, less maintenance than a continuous gravimetric sampler is required. These dual sampling capabilities allow the IBAC to commence sample collection after detection of potential biological threats, while also continuously monitoring via its UV-LIF technology. The IBAC is capable of detecting particles ≥ 0.7 microns, has an airflow of 3.8 L/min, and possesses a response time of between 1 s and 1 min. Thus, the device can potentially detect spores, bacteria and other aerosol particles. It was designed to be modular so that extra functionality and capabilities such as aerosol impaction could later be integrated into the system. Primary customers of the first IBAC have been described as homeland security and defence customers [
82,
83,
84,
85].
To this end, a disadvantage that the IBAC possesses is that some anthropogenic particles can also fluoresce in the same region as bioaerosols (indeed this is problem for all LIF devices), thus acting as an interferent [
86].
2.5. Chemical Tracer Methods
The use of tracer molecules for the purpose of measuring or tracking aerosols and bioaerosols has been undertaken for many years [
87]. More recently, tracer molecules have been used as a mechanism for PBAP analysis and quantification. The most commonly used molecular tracers described in the literature, are arabitol, mannitol and ergosterol. Other substances such as (1→3)-β-d-glucan, potassium, and endotoxins have also been utilised as tracer molecules. Fungal spore studies have often involved (1→3)-β-d-glucan because it forms part of the fungal cell wall [
88].
A large portion of the dry weight of fungal spores is made up of the two tracer molecules arabitol and mannitol, and this is why they can be used for fungal spore quantification [
85]. However, the use of arabitol and mannitol as molecular tracers for fungal spores must be carefully considered, as some studies have found that the main sources of arabitol and mannitol were not fungal spores, but resulted from biomass burning and sea spray [
88,
89]. It has been found that ergosterol does not suffer from the same issue, and thus may be more reliable as a molecular tracer [
85].
The use of molecular tracers has been employed in tandem with other bioaerosol instrumentation. Previous studies compared the use of such tracers with both WIBS and the UV-APS [
90]. A higher-than-expected correlation was observed between the tracers of arabitol and mannitol, and the instrumentation for the determination fungal spore concentrations, especially when considering the disparity in the working principle behind both methods. Correlations between the fungal tracers and the WIBS device were around R2 = 0.8 for FL1 channel (excitation at 280 nm and emission between 310–400 nm) for arabitol under all conditions and for mannitol under dry conditions. This is due to mannitol originating from sources other than from fungal spores. Other WIBS fluorescence channels did not correlate as well as FL1. While the UV-APS correlated well with mannitol and arabitol in wet conditions (generally R2 > 0.7), the same was not true in drier conditions, resulting in poor correlation (around R2 = 0.15). The authors attributed this to the fact that the only fungal spores associated with arabitol and mannitol are emitted by wet discharge methods.
2.6. Molecular and DNA Methodologies for Spore Determination
Due to the variety of fungal spore sizes and morphological parameters, there can be some difficulty in fungal spore recognition. These difficulties have necessitated the creation of other identification methodologies for the direct measurements of airborne fungal spores. The determination of the concentration of allergenic proteins, and DNA, have been used previously as proxies for fungal concentration in the air.
One such technique is Enzyme-linked immunosorbent assay (ELISA) which detects the presence of a ligand (generally a protein) in a liquid sample using antibodies to label the protein to be measured. This technique has been used for fungus detection for over 40 years [
91], and more recent studies have used it to determine the allergens within fungal spores [
52,
92].
MicroTitre Immuno Spore Trap, or MTIST, works via the impaction of air directed through a series of trumpet-like passages opening into a well of a microtitre plate. This sampling format was intended for direct application of immunological diagnostic methods, particularly ELISA. As the total airflow is collected into 32 separate wells, it is possible to perform separate tests for different target organisms [
42,
52].
DNA analysis has also been used to discern airborne fungal spore concentration and, as previous studies have shown, many impactors have been adapted to utilise DNA-based diagnostics, such as Polymerase Chain Reaction (PCR) [
52,
93]. Most of the samplers adapted to this method are based on dry or wet-wall cyclones. The cyclone deposits particles on a surface, dry or wet, as a result of centrifugal force. Using this, airborne particles can be collected in different media. Cyclone samplers lend themselves well to extended collection times because they can collect relatively large amounts of material. Cyclone samplers have also been designed to be small enough to be used as personal samplers [
94]. With this material, DNA analysis can be performed [
95]. DNA fungal recognition can give great information about the diversity of particles, but the use of PCR is a process that requires good knowledge of fungal DNA and it needs a significant amount of time to prepare.
3. Fungal Spores and Climate
Fungal spores (and other PBAPs) have also been linked with potentially impacting the climate, either directly through the scattering and absorption of light, or indirectly by influencing cloud formation and precipitation development [
96]. Clouds can form via the condensation of water onto the surface of a suitable particle, providing there is sufficient relative humidity to supply saturation. These aerosols are termed cloud condensation nuclei (CCN) and occur at warmer temperatures than ice nuclei (IN). PBAPs can contain soluble coatings, allowing them to act as CCN, and possess insoluble components, allowing IN activity [
97]. Although the contribution of bioaerosols to IN and CCN has received increased attention in recent times, there remains a great deal of controversy surrounding the total contribution of PBAPs to cloud formation. Compared to the more prominent atmospheric aerosols, such as sulphates, organics, sea-salt, dust, and smoke particles, the area remains notably understudied [
98].
The first biological ice nuclei were discovered in the early 1970’s from composting vegetation, which was later attributed to the bacteria
Pseudomonas syringae [
99]. Since then many biological components have been identified as potentially important CCN and IN [
100,
101]. The importance of IN-PBAPs was accelerated by the fact that mineral dust and combustion aerosols, although more common, lose their IN ability at temperatures warmer than −15 °C and −20 °C, respectively, even though clouds above this temperature have been shown to contain ice crystals [
102]. Although the true extent to which these biological IN/CCN contribute has yet to be truly realised, several investigations indicate it to be considerable, particularly with regards to ice nucleation. The importance of IN-PBAPs in other regions has also been well documented, particularly the impact of aerosols on the Amazonian hydrological cycle [
66,
101,
103,
104]. This is predominantly due to the absence of local anthropogenic influences, allowing for the selective investigation of PBAPs. It has been determined that during periods of prominent rainfall, biogenic aerosols are almost entirely responsible for maintaining the hydrological cycle of the Amazon basin [
104]. The larger supermicron aerosols are dominated by PBAPs, contributing to up to 80% of the supermicron ambient concentrations [
103]. Whitehead et al. [
104] illustrated the prominence of fungal spores in this region through fluorescent detection of bioaerosols, with fungal spores contributing to 70% of the total fluorescent particle concentration.
These field studies, as well as initial small scale models [
97], illustrated the relative importance of PBAPs as IN, on a regional and seasonal scale. However, a significant contrast is observed for these finding when compared to larger global model studies. Previous studies [
105] have shown that the simulated contribution of PBAPs to IN is almost negligible when compared to the IN activity of mineral dust and soot which dominated the simulated IN composition (93%). Even with abnormally heightened freezing efficiency, the global contribution of PBAPs to IN was not greater than 1% [
105]. Other investigations have also corroborated this low global contribution [
106,
107]. These findings, however, do not negate the influence of PBAPs as IN on a regional and seasonal basis, particularly at lower altitudes where warmer temperatures inhibit the nucleation of other particles [
101,
108]. The majority of studies have often compared the IN capabilities of PBAPs to that of soot or dust particles, but some works have suggested that biological particles can enhance the impact of desert dust storms on the formation of cloud ice [
100]. As evident by the contrasting results, the true IN activity of PBAPs remains somewhat uncertain.
4. Modelling
Many aerobiological studies have largely focussed on forecasting airborne pollen concentrations [
109]; however, fungal spores are more abundant and could contribute a higher risk of initialising acute respiratory conditions [
110], resulting is a need for their forecasting. Although remaining comparatively less frequent (relative to pollen), the development of fungal spore models has become a topic of increased prominence in more recent times [
111]. Aerobiological forecasting studies generally centre on developing prediction models for selected fungal spores or pollen types. In the case of fungal spores, modelling studies have largely focussed on allergenic or potentially allergenic fungal spores, such as
Alternaria,
Cladosporium and
Ganoderma, or those that pose a risk to crops as plant pathogens, such as
Botrytis,
Uncinula and
Erysiphe, amongst others.
Thus, this section will focus on reviewing the variety of modelling methodologies that have been used in the creation of accurate fungal spore forecast models and briefly explore popular statistical techniques used for evaluating possible explanatory variables.
4.1. Meteorological Variables
A variety of forecasting techniques have been employed to predict fungal spore concentrations; those techniques differ greatly in principle, but one type of input variable remains consistent across the majority of studies—meteorological parameters. The release and dispersion of fungal spores is influenced by a range of different environmental conditions with release mechanisms varying from species to species [
112]. An important initial step in developing functional fungal spore models involves assessing the impact of meteorological variables on spore release and concentration.
The effects and correlation of various meteorological conditions on spore release has been covered well in numerous studies [
17,
109,
113,
114,
115,
116,
117,
118]. The complex relationship between the ambient fungal spore concentrations and meteorological parameters is often examined using statistical tests, such as correlation analysis and ordination techniques.
4.1.1. Spearman Correlation
One of the most popular methods for assessing the correlation between fungal spores and meteorological parameters is the Spearman’s rank correlation test. Owing to being a very simple descriptive statistical test, this method cannot be used as a forecasting tool. Improved modelling approaches can be developed by assessing the correlation between spores and meteorology. By investigating this relationship, rough approximations can be developed as to what conditions result in the release of certain spores. For example, several studies have classified several species, such as
Alternaria,
Cladosporium,
Eppicocum,
Aspergillus/Penicillium and
Ganoderma [
15,
116,
119,
120,
121], as “dry-weather spore types”, indicating dry weather as having a significant correlation with increased fungal spore concentrations. Similarly, other spores such as
Didymella,
Leptosphaeria,
Ganoderma and rusts [
115,
119,
121] have been described as “wet-weather spore types”, displaying strong correlations with relative humidity or rainfall.
4.1.2. Ordination Techniques
Ordination techniques such as canonical correspondence analysis (CCA) and redundancy analysis (RDA) has received increasing interest. They are often used in conjunction with the Spearman correlation and applied to aerobiological investigations. Ordination techniques have also shown merit in various other ecological and phenological studies [
15]. Ordination is a form of multivariate analysis and can group similar objects by their relationship with multiple variables. As such, several studies have investigated the use of ordination to identify the relationship between different fungal spore genera, such as
Alternaria,
Cladosporum,
Botrytis,
Ganoderma,
Didymella,
Leptoshpaeria, etc., and various environmental factors [
15,
122].
Ultimately, studies have shown that the release and transport of fungal spores are influenced by various meteorological factors depending on location, spore type and time of year. In turn, these factors also impact the predictive power of developed forecast models.
Following the initial analysis of potential model inputs, various mathematical models can be developed in efforts to mimic the behaviour that exists between fungal spores and these parameters.
4.2. Regression Models
Regression analysis remains a popular forecasting approach in aerobiology, and continues to be used for the prediction of ambient pollen [
109] and fungal spore concentrations [
111]. Regression analysis is a simple modelling approach that is used to predict the relationship that exists between a scalar output (i.e., fungal spore concentration) using one or more independent variables. When only one explanatory variable is used in the model, it is known as linear regression. However, in the case of complex systems such as aerobiological studies, a single dependent variable is often not completely explained from the analysis of just one independent variable. Multiple regression analyses, shown in equation 1, is a broader type of regression and refers to the relationship between two or more independent variables and one dependent variable (Y and more than two independent variables X
1…X
n).
To date, a range of regression techniques have been used to develop fungal spore forecasting models, including both linear regression [
123,
124] and multiple regression analysis [
38,
39,
125,
126]. Linear/multiple regression methods have been used regularly for the prediction of
Alternaria [
19,
113,
124,
125,
127,
128],
Cladosporium [
33,
123,
125,
128],
Ganoderma [
128,
129],
Aspergillus/Penicillium, and
Ascospore [
129] concentrations, amongst others [
126,
128,
129]. In addition, multiple regression techniques have long been employed to determine important meteorological parameters that influence the seasonal concentrations of specific fungal spore taxa [
114,
130]. These simplistic methods have also been applied to forecast concentrations of several phytopathogenic fungal spores, such as
Botrytis,
Erysiphe and
Plasmospora, which pose a considerable risk to vineyards. [
38]
Other multiple regression approaches have also been applied to fungal spore data. Step-wise multiple regression [
113,
127,
131] has been applied to a host of fungal types [
131] including
Alternaria [
113,
127,
132] and
Cladosporium [
127,
131]. Backwards elimination regression has also been applied to predict
Alternaria [
113,
117],
Cladosporium, Ascospore and Basidiospore concentrations [
117], with the addition of logistic regression being employed to predict
Alternaria [
35,
132] and
Cladosporium concentrations.
The outputs of each prediction model depends on the intended purpose of that model. To date, popular regression model outputs include predicted daily [
19,
38,
113,
123,
125,
127], weekly [
113], as well as annual [
132] concentrations. Aside from daily, weekly and annual predictions, more recent studies have employed regression models to suit specific agricultural purposes. In several separate investigations by Cortiñas-Rodríguez et al. [
38], González-Fernández et al. [
133], and Fernández-González et al. [
39], regression models were developed to predict the powdery mildew infection [
38,
39] and secondary infection periods in vineyards [
38,
133]. The prediction of infectious periods helps to limit and reduce the number of chemical treatments, the application of which could improve crop quality, costs, and environmental impacts.
Due to the relative ease of construction and application of regression models, they remain popular in the aerobiological studies. However, despite their convenience, regression models are generally based on assumptions of linearity and normality. As a result, these models are often unable to account for the seasonality of aerobiological data leading to poor model accuracy [
109,
134].
4.3. Time Series
4.3.1. ARIMA Time-Series Analysis
Time series analysis is a technique used to identify underlying trends in data by examining collected data over a period of time with the aim to forecast future results (Y
t) [
109]. The model itself is considered additive and is composed of different components, shown in the following equation:
These components include long term trends (T
t), variations in the time-series not exceeding one tear (E
t), variations exceeding one year in length (C
t), and random factors without a known pattern (I
t) [
43].
Time-series models have been used in numerous aerobiological studies for both pollen [
106] and fungal spore forecasting [
134,
135]. ARIMA (autoregressive integrated moving average), as originally proposed by [
136], is the most popular time-series approach used in aerobiological studies. A time-series model is considered to be autoregressive when the value of the current result (e.g., fungal spore concentration) is dependent on the summation of the past components and values (e.g., meteorological parameters) [
134].
ARIMA models have been developed for several allergenic fungal spore taxa. Stephen et al. developed one of the initial ARIMA models used for fungal spore forecasting in 1990 [
134]. This study developed a simple one-parameter time-series model for the short-term forecast of both
Cladosporium and Basidiospore concentrations [
134]. Since then, several other studies have also developed ARIMA models for the prediction of allergenic fungal spore concentrations [
137], including for
Alternaria [
110,
138], and
Cladosporium [
110]. However, several studies have also adapted ARIMA models for the prediction of phytopathogenic fungal spores, such as
Alternaria [
138],
Botrytis [
43,
139],
Erysiphe and
Plasmopara [
135]. These models were, again, designed to predict periods of disease risk.
Model outputs from the literature ARIAMA models varied less than for other model types. Typically, ARIMA models have been used to predict daily concentration of specific allergenic/pathogenic fungal spores [
43,
110,
135,
138,
139]. However, in a study by Damialis and Gioulekas, 2 types of time-series models were developed to forecast
Alternaria and
Cladosporium concentrations. The first was used for the prediction of daily spore counts, but a second ARIMA model was developed to also predict monthly concentrations [
110].
4.3.2. Probability Distribution Function Models
Probability distribution-based models are often related to graphical representations of seasonal fungal spore/pollen time-series. Often, these temporal trends can appear similar to normal distribution curves. Several literature studies have, therefore, proposed and employed models based on Gaussian functions to aerobiological data to predict seasonal parameters, such as season start dates, season lengths and season end dates [
140]. Models based on the Gaussian function have been previously applied to pollen data and have shown merit when fitted to both unimodal and multimodal seasonal data [
141,
142]. Later studies also progressed to include several fungal spore species. A study by Kasprzyk and Walanus [
140] applied Gamma, Gaussian and logistic distribution models to both airborne pollen grains and fungal spore trends in efforts to predict season dynamics. During this investigation,
Cladosporium,
Alternaria,
Ganoderma and
Botrytis spores were selected for analysis. The Gaussian distribution-based model was fitted to all spore types; however, goodness of fit differed depending on year and taxa examined. Both the gamma and Logistic distribution also exhibited some merit when applied to the different fungal spore seasons.
However, aerobiological data usually does not fit a normal distribution, as is evident from the limitations of several of the aforementioned observational methods. This deviation from normal Gaussian behaviour comes as a result of the complex seasonality of such data [
143]. A gamma probability density model was originally proposed by Comtois [
144] to account for these inconsistencies. In the same study by Kasprzyk and Walanus [
140], Gamma, distribution models were applied to both airborne pollen grains and fungal spore trends. It was shown that the gamma distribution performed relatively poorly for both data sets and could not be fitted to all the fungal spore taxa investigated. In this particular study, the Gaussian and logistics functions were found to be the most representative for both fungal spore and pollen trends. In a more recent study by Vélez-Pereira et al. [
108], a gamma probability density function was constructed from a 20 year dataset, encompassing 20 separate fungal spore taxa. The application of this allowed for the non-subjective classification of 5 separate groups (categorised by shape parameter) which could be applied to developing future prediction models.
4.4. Machine Learning Techniques
4.4.1. Artificial Neural Networks
Traditional observational methods discussed above often fail to truly depict the complex behaviour between fungal spores and influencing parameters. This represents a major obstacle in modelling biological systems. As a result, more sophisticated machine learning techniques have become popular in aerobiological studies, including for fungal spore forecasting. Unlike several of the previously discussed observational modelling methods, machine learning techniques are not limited to the same assumptions of linearity and normality. Artificial neural networks (ANNs) have become particularly popular as they can easily analyse high-order, non-linear interactions and discontinuous data [
145]. Machine learning methods such as ANNs are designed to mimic biological information processing systems in order to develop a data model [
146]. In fact, ANNs are the most popular fungal spore modelling technique used throughout the previous literature studies [
111].
The application of ANNs have been used extensively in the literature to successfully model a range of fungal spore types, including allergenic spores such as
Ganoderma [
115,
145,
146,
147],
Alternaria [
44,
148,
149,
150,
151,
152,
153] and
Cladosporium [
151,
152,
153], amongst others [
126]. The use of ANNs has also been used to predict phytopathogenic spores, such as
Pleospora [
149,
153,
154],
Leptosphaeria [
118] and
Pyricularia [
155]. Many of these particular studies have highlighted the dual aspect of fungal spore prediction models with regards to alerting the public to both periods of potential allergenic and crop-infection risk. This applies particularly to spores that are capable of causing both effects, such as
Alternaria and
Leptosphaeria, as well as studies that have included both spores that are allergenic and spores that are pathogenic within the same investigation [
149,
153,
154].
The suitability of such methods to forecast fungal spore concentrations for different time resolutions has also been assessed in the literature. The vast majority of ANN models have been developed to predict daily concentration values. In a study by [
153], daily concentrations of
Alternaria and
Pleospora spores were mapped, producing spatial predictions. In addition to variations in daily spore predictions, a handful of studies have also investigated the predictive capability of ANNs for hourly values. In a study by Grinn-Gofroń and Strzelczak [
44], hourly concentration of
Alternaria and
Cladosporium spores were predicted successful by ANNs. A similar investigation was also carried out for hourly
Ganoderma spore prediction [
147].
Although ANN models have been employed for a myriad of spore types and remains the most widely used fungal spore forecasting technique, a recent study by Jedryczka et al. [
145] showed that advanced modelling methods, such as ANNs, were less accurate at predicting the risk of exposure of people with allergies, highlighting the need for more focussed modelling studies, perhaps at a more representable sampling height (street level) and additional investigations into what further parameters could contribute to such exposure models.
4.4.2. Multiple Regression Trees
Although less popular, other advanced modelling techniques have also been employed in fungal spore modelling. Multiple regression trees (MRTs) have been developed for several fungal spore forecasting studies. MRTs form clusters by repeatedly splitting the data along axes of explanatory variables. The clusters and their dependence on said variables can then be presented graphically as a tree [
44,
156]. The MRT technique makes no assumptions about the relationship between dependent and explanatory variables, which makes it applicable to complex environmental data, such as an aerobiological dataset [
156]. MRTs have been applied to forecast several different allergenic and phytopathogenic fungal spores, such as
Ganoderma [
145,
147,
157],
Alternaria [
14,
44],
Cladosporium [
14,
44] and
Didymella [
14]. Many of these studies have also included the concurrent development of the ANNs models [
44,
147,
157]. Similar to ANN models, MRT models have tended to focus on either the prediction of daily [
145,
157] or hourly [
44,
147] spore concentrations.
4.4.3. Random Forest
Another tree-based approach that has been used to forecast ambient fungal spore concentrations is random forests (RF). RF models involve creating and combining multiple decision trees in efforts to determine a more accurate prediction. This technique has largely remained unexplored for fungal spore modelling. RF has only been used to model
Alternaria,
Cladosporium [
158] and
Ganoderma concentrations [
159]. Interestingly, Grinn-Gofroń et al. [
158], highlighted the possibility of accurately modelling fungal spore concentrations using one universal model across different sites and countries. More recently, Grinn-Gofroń et al. combined local
Ganoderma data, meteorological data, land cover data (tree host density) and backtrajectory analysis of possible
Ganoderma tranport sites into a single RF model [
159]. The computed model was capable of computing daily airborne
Ganoderma concentrations.
Overall, advanced modelling techniques are still in their early stages when it comes to fungal spore forecasting. There have been a number of other machine learning techniques that have been applied to other aerobiological data which could also benefit fungal spore modelling, such as Least Absolute Shrinkage and Selection Operator (LASSO) and support vector machine methods [
108]. Even so, these advanced models represent a highly promising technique for fungal spore forecasting and will likely see a large development in the coming years.
4.5. Process and Source-Based Modelling
4.5.1. Phenological and Land-Use Modelling
Phenology refers to the study of recurring seasonal events and is influenced by meteorological factors. This can be used to predict key phases in plant development, notably flowering periods for pollen prediction [
160]. These observations are then coupled with meteorological conditions, then, using various modelling techniques (such as regression and time-series analyses), can then be used to forecast the presence of the fungal pathogens [
39]. As such, many studies focussing on pest management have employed phenological observations to predict periods of high disease risk, the application of which allows for the development of effective and accurate chemical treatment plans, reducing both economic costs and the environmental impact. Phenological models have been used for the prediction of several well-known vineyard pathogens, such as
Uncinula neactor [
39,
40],
Botrytis cinerea [
40,
139],
Plasmopara viticola [
40] and
Erysiphe necator [
133]. Moreover, it can be concluded from these plant-based studies that the relationship between fungal spore concentration, meteorological parameters and plant behaviour can predict airborne fungal concentrations better than just considering meteorological parameters alone.
Due to plants and decaying organic matter being the primary sources of fungal spore emissions, land use has also been used as a prediction tool for airborne spore concentration. Previous studies have investigated the effects of land-use on the fungal spore release, for which the use of GIS tools has been employed [
161,
162,
163]. Generally, it can be concluded that variations in ambient fungal spore compositions are related to location with some vegetation types favouring certain fungal taxa. The first study of this kind for the prediction of spatiotemporal distributions of ambient fungal spores was conducted by Kallawicha et al. by using land regression models and GIS [
137]. In total, 12 separate classes of fungal spores were investigated, including total fungal spores, Ascospores, Basidiospores,
Cladosporium and
Botrytis. By utilising multi-site sampling, this method is capable of overcoming the limitations introduced when only using a small number of sites [
137]. A more recent Swedish study investigated the spore deposition at 4 separate forest-agricultural locations and found that deposited spore communities differed more based on vegetation type than by geographical distance [
164]. A similar investigation of the air mass trajectories and land cover of the English Midlands determined that cereal and oilseed-rape crops were major local sources of
Alternaria [
163]. These findings highlight the importance of land use in predicting airborne fungal spore concentrations and that local sources of spores are important aspects to consider in understanding aeroallergens and the dispersal of plant pathogens.
One major disadvantage of observational models (regression, time-series, etc.) is that a high level of training data is required to develop accurate predictions. Fortunately, land-use data can help in these scenarios. Recently a study based on fungal spore emission estimates from land-use, simulated spore distribution over the Indian region [
165]. This model combined the land-use estimated with a regional transport model to simulate fungal spore distribution.
4.5.2. Transport Models
Source-oriented and transport models can be used to predict the spatiotemporal distribution of fungal spores. As illustrated by Ansari et al. [
165], these models can overcome the data-heavy requirements of observational techniques. However, these methods do require an understanding of certain aerosol characteristics, such as diffusion, etc. These models are based on chemistry Transport Models that have later been adapted to account for the dispersal of bioaerosols, firstly with pollen and more recently with fungal spores. A great number of studies have been published with regard to the transport and distribution of pollen grains using these models [
109]. Unfortunately, fewer have examined the origin and transport of fungal spores.
Several transport models have been applied to fungal spore modelling, including COSMO-ART and WRF-Chem models [
165,
166]. In addition, Hybrid Single-Particle Lagrangian Integrated Trajectory (HYSPLIT) models have been used extensively in aerobiological studies to investigate the location of fungal spore sources, as well as to investigate the contribution of long-distance transport to regional fungal spore concentrations [
159,
162,
163,
167,
168]. Other transport models have also been used, albeit less often, such as the Zefir source-receptor model [
169].These models have focussed on simulating general fungal spore concentrations over specified regions [
162,
166,
167,
169] and determining points of origin for particular fungal spore genera. As a result of its agricultural and allergenic health effects,
Alternaria distribution is the most studied fungal type [
16,
163,
167,
169], although
Ganoderma [
159,
168,
169], as well as
Ascospores,
Basidiospores,
Cladosporium, and
Tilletiopsis [
169], have also been studied to some extent. These models have highlighted that for sites influenced by the long distance transport or fungal spores, solely depending on site specific meteorological data is insufficient for the development of high-performance models even when efficient and robust methods (such as RF) are used [
159].
Overall, although fungal spore modelling methods are less well documented than those for allergenic pollen, it is predicted that accelerated levels of fungal spore release will be observed in years to come as a result of climate change [
120]. Based on previous use of these techniques for forecasting, it’s likely that these advanced models represent a highly promising avenue for fungal spore forecasting and will see further development in the coming years.
5. Conclusions
The most important fungal spore types identified in this literature review were considered to be Cladosporium and Alternaria, as a result of their pathogenic, phytotoxic, and aeroallergenic properties, combined with their overwhelming abundance within the atmosphere. Several other fungal spores have also been identified as species of interest in one (or more) of the aforementioned categories, with their abundance, relationships with meteorological parameters, and biogeographic region all taken into account. Nevertheless, difficulties in spore recognition, and differences between biogeographic regions hinder ready comparison. Links between fungal spore concentrations indoors, and allergenic symptoms in occupants of buildings (sick building syndrome) were also noted, and further investigation into this phenomenon is of scientific and human health interest.
The different spore sampling methods identified firstly included standard volumetric (active) samplers, such as the Hirst and Rotorod samplers with electrically powered components, and non-volumetric (passive) sampling alternatives. Other methods of fungal spore sampling include culture-based techniques, such as the Burkard portable air sampler and the Andersen sampler, both of which are active samplers. Another method of spore sampling or quantification is the use of real-time light induced fluorescence instrumentation, such as the UV-APS, the BioScout, the IBAC, and the range of WIBS devices available currently on the market. These real-time devices detect fluorescent aerosol particles through different applications of the same technology via the excitation of a particle with a laser, or lasers, of a set wavelength, before the resulting florescence is captured by a photoreactor. The resulting output can then be correlated with known spore particle characteristics and concentrations. Other methods of spore sampling/quantification include indirect methods such as the measurement of chemical tracers, such as arabitol and mannitol, in place of direct spore measuring, and via the measurement of allergenic proteins and DNA in the atmosphere to act as fungal spore proxies. While traditional sampling will continue as a base and reference for data continuity, the use of real-time as well as chemical and genetic recognition is now gaining importance in the field of aerobiology. This relatively recent advancement in technology has resulted in several different instruments being used simultaneously within the aerobiological field, with the choice of device used depending upon the knowledge of the researchers using it, as well as the specific requirements of each zone. As said by Hirst [
170], “It is usually essential to consider the environment and purpose of an investigation before deciding which [spore] trap to use and where to locate it”.
Currently, the most used methods for fungal spore concentration prediction were generally based on different conventional modelling techniques, typically ones developed for meteorological forecasting purposes. The inclusion of meteorological variables within the majority of these models highlighted the already known and strong relationship between the weather, climate, and fungal spore concentrations. Spearman correlations, ordination techniques, forms of regression analysis, and time series analysis, are all used today for the forecasting and modelling of future fungal spore concentrations. Other more novel approaches to forecasting include various forms of machine learning techniques, such as the use of multiple regression trees, artificial neural networks, and the “random forest” technique. These methods are seen as promising, but are under researched as of yet. Process and source-based modelling approaches, such as land use and phenological modelling, and the use of transport models have also seen increased use in recent years, as modelling methods that have seen success in similar fields—such as the forecasting of allergenic pollens—are adapted and implemented for the field of fungal spore modelling. The relationships between spores and climate are complex, and the different methods used to measure this correlation also serve to bring the complexity of this relationship into focus. The main objective of fungal spore modelling is changing; from previously explaining the environmental causes and the effects of spore dispersal, to now attempting to predict said dispersal before it occurs. However, the complexity of the fungal kingdom becomes problematic when forecasting is performed. For this reason, long-term database maintenance is a principal foundation for the evolution of the field of airborne fungal spore research.
Author Contributions
Conceptualization, D.J.O. and M.M.-B.; writing—original draft preparation, E.M., J.H.C. and M.M.-B.; writing—review and editing, D.J.O., E.J.M. and G.S supervision, E.J.M. and G.S.; project administration, D.J.O.; funding acquisition, D.J.O. All authors have read and agreed to the published version of the manuscript.
Funding
This research was funded by the Environmental Protection Agency, grant number 2018-CCRP-MS.53.
Institutional Review Board Statement
Not applicable.
Informed Consent Statement
Not applicable.
Data Availability Statement
Not applicable.
Acknowledgments
The authors are grateful to the following project for funding this work: 2018-CCRP-MS.53: Fungal Monitoring Network and Algorithm (FONTANA). Research Project of the Environmental Protection Agency (EPA).
Conflicts of Interest
The authors declare no conflict of interest.
References
- McLaughlin, D.J. The Mycota. 7, Systematics and Evolution; McLaughlin, D.J., Ed.; Springer: Berlin/Heidelberg, Germany, 2014; ISBN 3-642-55317-6. [Google Scholar]
- Ristaino, J.B. Tracking Historic Migrations of the Irish Potato Famine Pathogen, Phytophthora Infestans. Microbes Infect. 2002, 4, 1369–1377. [Google Scholar] [CrossRef]
- Vagelas, I.; Gougoulias, N.; Nedesca, E.-D.; Liviu, G. Bread Contamination with Fungus. Carpathian J. Food Sci. Technol. 2011, 3, 1–6. [Google Scholar]
- Rapiejko, P.; Lipiec, A.; Wojdas, A.; Jurkiewicz, D. Threshold Pollen Concentration Necessary to Evoke Allergic Symptoms. Int. Rev. Allergol. Clin. Immunol. 2004, 10, 91–94. [Google Scholar]
- Gostic, K.; Gomez, A.C.; Mummah, R.O.; Kucharski, A.J.; Lloyd-Smith, J.O. Estimated Effectiveness of Symptom and Risk Screening to Prevent the Spread of COVID-19. eLife 2020, 9, e55570. [Google Scholar] [CrossRef] [PubMed]
- Kasprzyk, I. Aeromycology—Main Research Fields of Interest during the Last 25 Years. Ann. Agric. Environ. Med. 2008, 15, 1–7. [Google Scholar] [PubMed]
- Grinn-Gofroń, A.; Bosiacka, B.; Bednarz, A.; Wolski, T. A Comparative Study of Hourly and Daily Relationships between Selected Meteorological Parameters and Airborne Fungal Spore Composition. Aerobiologia 2018, 34, 45–54. [Google Scholar] [CrossRef] [PubMed]
- Ingold, C.T. Fungal Spores: Their Liberation and Dispersal; Clarendon Press: Oxford, UK, 1971. [Google Scholar]
- Carlile, M.; Watkinson, S.; Gooday, G. The Fungi, 2nd ed.; Academic Press: Cambridge, MA, USA, 2001. [Google Scholar]
- Feeney, P.; Rodríguez, S.F.; Molina, R.; McGillicuddy, E.; Hellebust, S.; Quirke, M.; Daly, S.; O’Connor, D.; Sodeau, J. A Comparison of On-Line and off-Line Bioaerosol Measurements at a Biowaste Site. Waste Manag. 2018, 76, 323–338. [Google Scholar] [CrossRef]
- Duflot, V.; Tulet, P.; Flores, O.; Barthe, C.; Colomb, A.; Deguillaume, L.; Vaïtilingom, M.; Perring, A.; Huffman, A.; Hernandez, M.T.; et al. Preliminary Results from the FARCE 2015 Campaign: Multidisciplinary Study of the Forest–Gas–Aerosol–Cloud System on the Tropical Island of La Réunion. Atmos. Chem. Phys. 2019, 19, 10591–10618. [Google Scholar] [CrossRef] [Green Version]
- Sodeau, J.; O’Connor, D. Bioaerosol Monitoring of the Atmosphere for Occupational and Environmental Purposes. In Comprehensive Analytical Chemistry; Elsevier: Amsterdam, The Netherlands, 2016; Volume 73, pp. 391–420. ISBN 0166-526X. [Google Scholar]
- Corden, J.M.; Millington, W.M. The Long-Term Trends and Seasonal Variation of the Aeroallergen Alternaria in Derby, UK. Aerobiologia 2001, 17, 127–136. [Google Scholar] [CrossRef]
- O’Connor, D.J.; Sadyś, M.; Skjøth, C.A.; Healy, D.A.; Kennedy, R.; Sodeau, J.R. Atmospheric Concentrations of Alternaria, Cladosporium, Ganoderma and Didymella Spores Monitored in Cork (Ireland) and Worcester (England) during the Summer of 2010. Aerobiologia 2014, 30, 397–411. [Google Scholar] [CrossRef] [Green Version]
- Sadyś, M.; Strzelczak, A.; Grinn-Gofroń, A.; Kennedy, R. Application of Redundancy Analysis for Aerobiological Data. Int. J. Biometeorol. 2015, 59, 25–36. [Google Scholar] [CrossRef] [PubMed]
- Skjøth, C.A.; Sommer, J.; Frederiksen, L.; Gosewinkel Karlson, U. Crop Harvest in Denmark and Central Europe Contributes to the Local Load of Airborne Alternaria Spore Concentrations in Copenhagen. Atmos. Chem. Phys. 2012, 12, 11107–11123. [Google Scholar] [CrossRef] [Green Version]
- Stepalska, D.; Wolek, J. The Estimation of Fungal Spore Concentrations Using Two Counting Methods. Acta Agrobot. 2009, 62, 117–123. [Google Scholar] [CrossRef]
- Oliveira, M.; Guerner-Moreira, J.; Mesquita, M.M.; Abreu, I. Important Phytopathogenic Airborne Fungal Spores in a Rural Area: Incidence of Botrytis Cinerea and Oidium spp. Ann. Agric. Environ. Med. 2009, 16, 197–204. [Google Scholar] [PubMed]
- Angulo-Romero, J.; Mediavilla-Molina, A.; Domínguez-Vilches, E. Conidia of Alternaria in the Atmosphere of the City of Cordoba, Spain in Relation to Meteorological Parameters. Int. J. Biometeorol. 1999, 43, 45–49. [Google Scholar] [CrossRef] [PubMed]
- Antón, S.F.; de la Cruz, D.R.; Sánchez, J.S.; Reyes, E.S. Analysis of the Airborne Fungal Spores Present in the Atmosphere of Salamanca (MW Spain): A Preliminary Survey. Aerobiologia 2019, 35, 447–462. [Google Scholar] [CrossRef]
- Ricci, S.; Bruni, M.; Meriggi, A.; Corsico, R. Aerobiological Monitoring OfAlternaría Fungal Spores: A Comparison between Surveys in 1992 and 1993 and Local Meteorological Conditions. Aerobiologia 1995, 11, 195–199. [Google Scholar] [CrossRef]
- Şakiyan, N.; Inceoğlu, Ö. Atmospheric Concentrations of Cladosporium Link and Alternaria Nées Spores in Ankara and the Effects of Meteorological Factors. Turk. J. Bot. 2003, 27, 77–81. [Google Scholar]
- Gao, L.; Zhang, Q.; Sun, X.; Jiang, L.; Zhang, R.; Sun, G.; Zha, Y.; Biggs, A.R. Etiology of Moldy Core, Core Browning, and Core Rot of Fuji Apple in China. Plant Dis. 2013, 97, 510–516. [Google Scholar] [CrossRef] [Green Version]
- Olaniyan, T.; Dalvie, M.A.; Röösli, M.; Naidoo, R.N.; Künzli, N.; de Hoogh, K.; Berman, D.; Parker, B.; Leaner, J.; Jeebhay, M.F. Short Term Seasonal Effects of Airborne Fungal Spores on Lung Function in a Panel Study of Schoolchildren Residing in Informal Settlements of the Western Cape of South Africa. Environ. Pollut. 2020, 260, 114023. [Google Scholar] [CrossRef]
- Odebode, A.; Adekunle, A.; Stajich, J. P II–3–1 Occurrence of Airborne Fungal Spores Diversity and Allergenicity in Two Southwestern States of Nigeria. Occup. Environ. Med. 2018, 75 (Suppl. 1), A43.3–A44. [Google Scholar]
- Dietzel, K.; Valle, D.; Fierer, N.; U’Ren, J.M.; Barberán, A. Geographical Distribution of Fungal Plant Pathogens in Dust Across the United States. Front. Ecol. Evol. 2019, 7, 304. [Google Scholar] [CrossRef] [Green Version]
- Chaerani, R.; Voorrips, R.E. Tomato Early Blight (Alternaria Solani): The Pathogen, Genetics, and Breeding for Resistance. J. Gen. Plant Pathol. 2006, 72, 335–347. [Google Scholar] [CrossRef]
- Nowicki, M.; Nowakowska, M.; Niezgoda, A.; Kozik, E. Alternaria Black Spot of Crucifers: Symptoms, Importance of Disease, and Perspectives of Resistance Breeding. Veg. Crop. Res. Bull. 2012, 76, 5–19. [Google Scholar] [CrossRef]
- Thomma, B.P.; Van Esse, H.P.; Crous, P.W.; de Wit, P.J. Cladosporium Fulvum (Syn. Passalora Fulva), a Highly Specialized Plant Pathogen as a Model for Functional Studies on Plant Pathogenic Mycosphaerellaceae. Mol. Plant Pathol. 2005, 6, 379–393. [Google Scholar] [CrossRef]
- Friesen, T.L.; Faris, J.D.; Solomon, P.S.; Oliver, R.P. Host-specific Toxins: Effectors of Necrotrophic Pathogenicity. Cell. Microbiol. 2008, 10, 1421–1428. [Google Scholar] [CrossRef]
- Mamgain, A.; Roychowdhury, R.; Tah, J. Alternaria Pathogenicity and Its Strategic Controls. Res. J. Biol. 2013, 1, 1–9. [Google Scholar]
- Krouse, J.H. Allergy and Immunology: An Otolaryngic Approach; Lippincott Williams & Wilkins: Philadelphia, PA, USA, 2002. [Google Scholar]
- Hollins, P.D.; Kettlewell, P.S.; Atkinson, M.D.; Stephenson, D.B.; Corden, J.M.; Millington, W.M.; Mullins, J. Relationships between Airborne Fungal Spore Concentration of Cladosporium and the Summer Climate at Two Sites in Britain. Int. J. Biometeorol. 2004, 48, 137–141. [Google Scholar] [CrossRef] [PubMed]
- Targonski, P.V.; Persky, V.W.; Ramekrishnan, V. Effect of Environmental Molds on Risk of Death from Asthma during the Pollen Season. J. Allergy Clin. Immunol. 1995, 95, 955–961. [Google Scholar] [CrossRef]
- Vélez-Pereira, A.M.; De Linares, C.; Canela, M.-A.; Belmonte, J. Logistic Regression Models for Predicting Daily Airborne Alternaria and Cladosporium Concentration Levels in Catalonia (NE Spain). Int. J. Biometeorol. 2019, 63, 1541–1553. [Google Scholar] [CrossRef]
- Gravesen, S. Fungi as a Cause of Allergic Disease. Allergy 1979, 34, 135–154. [Google Scholar] [CrossRef]
- Frankland, A.; Davies, R. Allergie Aux Spores de Moisissures En Angleterre. Le Poumon Et Le Cœur 1965, 21, 11–23. [Google Scholar] [PubMed]
- Cortiñas Rodríguez, J.A.; Fernández-González, E.; Fernández-González, M.; Vázquez-Ruiz, R.A.; Aira, M.J. Fungal Diseases in Two North-West Spain Vineyards: Relationship with Meteorological Conditions and Predictive Aerobiological Model. Agronomy 2020, 10, 219. [Google Scholar] [CrossRef] [Green Version]
- Fernández-González, M.; Rodríguez-Rajo, F.J.; Escuredo, O.; Aira, M.J. Optimization of Integrated Pest Management for Powdery Mildew (Unincula Necator) Control in a Vineyard Based on a Combination of Phenological, Meteorological and Aerobiological Data. J. Agric. Sci. 2013, 151, 648–658. [Google Scholar] [CrossRef]
- Martínez-Bracero, M.; Alcázar, P.; Velasco-Jiménez, M.; Galán, C. Fungal Spores Affecting Vineyards in Montilla-Moriles Southern Spain. Eur. J. Plant Pathol. 2019, 153, 1–13. [Google Scholar] [CrossRef]
- Gessler, C.; Pertot, I.; Perazzolli, M. Plasmopara Viticola: A Review of Knowledge on Downy Mildew of Grapevine and Effective Disease Management. Phytopathol. Mediterr. 2011, 50, 3–44. [Google Scholar] [CrossRef]
- Kennedy, R.; Wakeham, A.; Byrne, K.; Meyer, U.; Dewey, F. A New Method to Monitor Airborne Inoculum of the Fungal Plant Pathogens Mycosphaerella Brassicicola AndBotrytis Cinerea. Appl. Environ. Microbiol. 2000, 66, 2996–3003. [Google Scholar] [CrossRef] [PubMed] [Green Version]
- Rodríguez-Rajo, F.J.; Jato, V.; Fernández-González, M.; Aira, M.J. The Use of Aerobiological Methods for Forecasting Botrytis Spore Concentrations in a Vineyard. Grana 2010, 49, 56–65. [Google Scholar] [CrossRef] [Green Version]
- Grinn-Gofroń, A.; Strzelczak, A. Hourly Predictive Artificial Neural Network and Multivariate Regression Tree Models of Alternaria and Cladosporium Spore Concentrations in Szczecin (Poland). Int. J. Biometeorol. 2009, 53, 555–562. [Google Scholar] [CrossRef]
- Joshi, S.M. The Sick Building Syndrome. Indian J. Occup. Environ. Med. 2008, 12, 61. [Google Scholar] [CrossRef]
- Redlich, C.A.; Sparer, J.; Cullen, M.R. Sick-Building Syndrome. Lancet 1997, 349, 1013–1016. [Google Scholar] [CrossRef]
- Garcia-Mozo, H.; Lopez-Orozco, R.; Canalejo, C.; Oteros, J. Indoor Biological Particles in a Train: Comparative Analysis with Outdoor Atmosphere. Aerobiologia 2020, 36, 481–492. [Google Scholar] [CrossRef]
- Cho, S.-Y.; Myong, J.-P.; Kim, W.-B.; Park, C.; Lee, S.J.; Lee, S.H.; Lee, D.-G. Profiles of Environmental Mold: Indoor and Outdoor Air Sampling in a Hematology Hospital in Seoul, South Korea. Int. J. Environ. Res. Public Health 2018, 15, 2560. [Google Scholar] [CrossRef] [PubMed] [Green Version]
- Reyes, E.S.; de la Cruz, D.R.; Merino, E.; Sánchez, J.S. Meteorological and Agricultural Effects on Airborne Alternaria and Cladosporium Spores and Clinical Aspects in Valladolid [Spain]. Ann. Agric. Environ. Med. 2009, 16, 53–61. [Google Scholar]
- Almaguer, M.; Rojas-Flores, T.I.; Rodríguez-Rajo, F.J.; Aira, M.-J. Airborne Basidiospores of Coprinus and Ganoderma in a Caribbean Region. Aerobiologia 2014, 30, 197–204. [Google Scholar] [CrossRef]
- Rockett, T.R.; Kramer, C.L.; Collins, T.I. A New Collector to Measure Total Spore Production. Mycologia 1974, 66, 526–530. [Google Scholar] [CrossRef] [PubMed]
- West, J.S.; Kimber, R.B.E. Innovations in Air Sampling to Detect Plant Pathogens. Ann. Appl. Biol. 2015, 166, 4–17. [Google Scholar] [CrossRef] [PubMed] [Green Version]
- Comtois, P.; Alcazar, P.; Néron, D. Pollen Counts Statistics and Its Relevance to Precision. Aerobiologia 1999, 15, 19–28. [Google Scholar] [CrossRef]
- Šikoparija, B.; Pejak-Šikoparija, T.; Radišić, P.; Smith, M.; Soldevilla, C.G. The Effect of Changes to the Method of Estimating the Pollen Count from Aerobiological Samples. J. Environ. Monit. 2011, 13, 384–390. [Google Scholar] [CrossRef]
- Galán, C.; Smith, M.; Thibaudon, M.; Frenguelli, G.; Oteros, J.; Gehrig, R.; Berger, U.; Clot, B.; Brandao, R.; Group, E.Q.W. Pollen Monitoring: Minimum Requirements and Reproducibility of Analysis. Aerobiologia 2014, 30, 385–395. [Google Scholar] [CrossRef]
- Sikoparija, B.; Galán, C.; Smith, M. Pollen-Monitoring: Between Analyst Proficiency Testing. Aerobiologia 2017, 33, 191–199. [Google Scholar] [CrossRef]
- Smith, M.; Oteros, J.; Schmidt-Weber, C.; Buters, J.T. An Abbreviated Method for the Quality Control of Pollen Counters. Grana 2019, 58, 185–190. [Google Scholar] [CrossRef]
- Galan, C.; Ariatti, A.; Bonini, M.; Clot, B.; Crouzy, B.; Dahl, A.; Fernandez-González, D.; Frenguelli, G.; Gehrig, R.; Isard, S.; et al. Recommended Terminology for Aerobiological Studies. Aerobiologia 2017, 33, 293–295. [Google Scholar] [CrossRef]
- Personal Volumetric Air Sampler—Burkard Manufacturing Co., Ltd. Available online: http://burkard.co.uk/product/personal-volumetric-air-sampler/ (accessed on 13 December 2021).
- Feliziani, V.; Marfisi, R.M. Pollen Aerobiological Monitoring with the Personal Volumetric Air Sampler (PVAS). Correlation with a Fixed Hirst Type Sampling Station. Aerobiologia 1992, 8, 471–477. [Google Scholar] [CrossRef]
- Kapadi, M.; Patel, S. Aeromycological Approach of Some Fungal Diseases on Tomato Crop (Lycopersicon Esculentum Mill.) at Nashik, India 422007. J. Drug Deliv. Ther. 2019, 9, 329–331. [Google Scholar]
- Anderson, J.; Pityn, P.; Kelly, M. Pollen Count Standardization for Burkard & Rotorod Samplers. J. Allergy Clin. Immunol. 2020, 145, AB37. [Google Scholar]
- Lv, Y.; Hu, G.; Yuan, W.; Li, Y.; Liu, T.; He, P.; Wang, Y.; Sheng, Y. Experimental Study of Fungal Release Characteristics in Central Air. Atlantis Press: Paris, France, 2018. [Google Scholar]
- Pereira, M.L.; Knibbs, L.D.; He, C.; Grzybowski, P.; Johnson, G.R.; Huffman, J.A.; Bell, S.C.; Wainwright, C.E.; Matte, D.L.; Dominski, F.H.; et al. Sources and Dynamics of Fluorescent Particles in Hospitals. Indoor Air 2017, 27, 988–1000. [Google Scholar] [CrossRef]
- Fennelly, M.J.; Sewell, G.; Prentice, M.B.; O’Connor, D.J.; Sodeau, J.R. The Use of Real-Time Fluorescence Instrumentation to Monitor Ambient Primary Biological Aerosol Particles (PBAP). Atmosphere 2018, 9, 1. [Google Scholar] [CrossRef] [Green Version]
- Després, V.; Huffman, J.A.; Burrows, S.M.; Hoose, C.; Safatov, A.; Buryak, G.; Fröhlich-Nowoisky, J.; Elbert, W.; Andreae, M.; Pöschl, U. Primary Biological Aerosol Particles in the Atmosphere: A Review. Tellus B Chem. Phys. Meteorol. 2012, 64, 15598. [Google Scholar] [CrossRef] [Green Version]
- Huffman, J.A.; Perring, A.E.; Savage, N.J.; Clot, B.; Crouzy, B.; Tummon, F.; Shoshanim, O.; Damit, B.; Schneider, J.; Sivaprakasam, V. Real-Time Sensing of Bioaerosols: Review and Current Perspectives. Aerosol Sci. Technol. 2020, 54, 465–495. [Google Scholar] [CrossRef] [Green Version]
- Kanaani, H.; Hargreaves, M.; Ristovski, Z.; Morawska, L. Performance Assessment of UVAPS: Influence of Fungal Spore Age and Air Exposure. J. Aerosol Sci. 2007, 38, 83–96. [Google Scholar] [CrossRef] [Green Version]
- Healy, D.A.; Huffman, J.A.; O’Connor, D.J.; Pöhlker, C.; Pöschl, U.; Sodeau, J.R. Ambient Measurements of Biological Aerosol Particles near Killarney, Ireland: A Comparison between Real-Time Fluorescence and Microscopy Techniques. Atmos. Chem. Phys. 2014, 14, 8055–8069. [Google Scholar] [CrossRef] [Green Version]
- Kesavan, J.; Kilper, G.; Williamson, M.; Alstadt, V.; Dimmock, A.; Bascom, R. Laboratory Validation and Initial Field Testing of an Unobtrusive Bioaerosol Detector for Health Care Settings. Aerosol Air Qual. Res. 2019, 19, 331–344. [Google Scholar] [CrossRef]
- Zheng, Y.; Yao, M. Liquid Impinger BioSampler’s Performance for Size-Resolved Viable Bioaerosol Particles. J. Aerosol Sci. 2017, 106, 34–42. [Google Scholar] [CrossRef]
- Bhangar, S.; Adams, R.I.; Pasut, W.; Huffman, J.A.; Arens, E.; Nazaroff, W.W. Human Emissions of Size-Resolved Fluorescent Biological Aerosol Particles Indoors. Indoor Air 2014, 26, 193–206. [Google Scholar] [CrossRef] [Green Version]
- O’Connor, D.J.; Healy, D.A.; Sodeau, J.R. A 1-Month Online Monitoring Campaign of Ambient Fungal Spore Concentrations in the Harbour Region of Cork, Ireland. Aerobiologia 2015, 31, 295–314. [Google Scholar] [CrossRef]
- Cheng, B.; Yue, S.; Hu, W.; Ren, L.; Deng, J.; Wu, L.; Fu, P. Summertime Fluorescent Bioaerosol Particles in the Coastal Megacity Tianjin, North China. Sci. Total Environ. 2020, 723, 137966. [Google Scholar] [CrossRef]
- Healy, D.A.; O’Connor, D.J.; Burke, A.M.; Sodeau, J.R. A Laboratory Assessment of the Waveband Integrated Bioaerosol Sensor (WIBS-4) Using Individual Samples of Pollen and Fungal Spore Material. Atmos. Environ. 2012, 60, 534–543. [Google Scholar] [CrossRef]
- Healy, D.A.; O’Connor, D.J.; Sodeau, J.R. Measurement of the Particle Counting Efficiency of the “Waveband Integrated Bioaerosol Sensor” Model Number 4 (WIBS-4). J. Aerosol Sci. 2012, 47, 94–99. [Google Scholar] [CrossRef]
- O’Connor, D.J.; Healy, D.A.; Sodeau, J.R. The On-Line Detection of Biological Particle Emissions from Selected Agricultural Materials Using the WIBS-4 (Waveband Integrated Bioaerosol Sensor) Technique. Atmos. Environ. 2013, 80, 415–425. [Google Scholar] [CrossRef]
- Daly, S.M.; O’Connor, D.J.; Healy, D.A.; Hellebust, S.; Arndt, J.; McGillicuddy, E.J.; Feeney, P.; Quirke, M.; Wenger, J.C.; Sodeau, J.R. Investigation of Coastal Sea-Fog Formation Using the WIBS (Wideband Integrated Bioaerosol Sensor) Technique. Atmos. Chem. Phys. 2019, 19, 5737–5751. [Google Scholar] [CrossRef] [Green Version]
- Fennelly, M.; Keane, J.; Dolan, L.; Plant, B.J.; O’Connor, D.J.; Sodeau, J.R.; Prentice, M.B. Containment of Procedure-Associated Aerosols by an Extractor Tent: Effect on Nebulized Drug Particle Dispersal. J. Hosp. Infect. 2021, 110, 108–113. [Google Scholar] [CrossRef] [PubMed]
- Saari, S.; Mensah-Attipoe, J.; Reponen, T.; Veijalainen, A.M.; Salmela, A.; Pasanen, P.; Keskinen, J. Effects of Fungal Species, Cultivation Time, Growth Substrate, and Air Exposure Velocity on the Fluorescence Properties of Airborne Fungal Spores. Indoor Air 2015, 25, 653–661. [Google Scholar] [CrossRef] [PubMed]
- Saari, S.; Reponen, T.; Keskinen, J. Performance of Two Fluorescence-Based Real-Time Bioaerosol Detectors: BioScout vs. UVAPS. Aerosol Sci. Technol. 2014, 48, 371–378. [Google Scholar] [CrossRef] [Green Version]
- DeFreez, R. LIF Bio-Aerosol Threat Triggers: Then and Now; International Society for Optics and Photonics: Bellingham, DC, USA, 2009; Volume 7484, p. 74840H. [Google Scholar]
- Santarpia, J.L.; Ratnesar-Shumate, S.; Gilberry, J.U.; Quizon, J.J. Relationship Between Biologically Fluorescent Aerosol and Local Meteorological Conditions. Aerosol Sci. Technol. 2013, 47, 655–661. [Google Scholar] [CrossRef] [Green Version]
- Jonsson, P.; Kullander, F. Bioaerosol Detection with Fluorescence Spectroscopy; Bioaerosol Detection Technologies; Springer: Berlin/Heidelberg, Germany, 2014; pp. 111–141. [Google Scholar] [CrossRef]
- Anchlia, P. Aerosol Data Modeling & Similarity Assessment–A Probabilistic Approach. 2015. Available online: https://uh-ir.tdl.org/handle/10657/2157 (accessed on 13 December 2021).
- FLIR IBAC 2 Bio-Threat Detection & Collection | Teledyne FLIR. Available online: https://www.flir.eu/products/ibac-2/ (accessed on 6 October 2021).
- Simoneit, B.R.T.; Mazurek, M.A. Organic Tracers in Ambient Aerosols and Rain. Aerosol Sci. Technol. 1989, 10, 267–291. [Google Scholar] [CrossRef]
- Di Filippo, P.; Pomata, D.; Riccardi, C.; Buiarelli, F.; Perrino, C. Fungal Contribution to Size-Segregated Aerosol Measured through Biomarkers. Atmos. Environ. 2013, 64, 132–140. [Google Scholar] [CrossRef]
- Burshtein, N.; Lang-Yona, N.; Rudich, Y. Ergosterol, Arabitol and Mannitol as Tracers for Biogenic Aerosols in the Eastern Mediterranean. Atmos. Chem. Phys. 2011, 11, 829–839. [Google Scholar] [CrossRef] [Green Version]
- Gosselin, M.I.; Rathnayake, C.M.; Crawford, I.; Pöhlker, C.; Fröhlich-Nowoisky, J.; Schmer, B.; Després, V.R.; Engling, G.; Gallagher, M.; Stone, E. Fluorescent Bioaerosol Particle, Molecular Tracer, and Fungal Spore Concentrations during Dry and Rainy Periods in a Semi-Arid Forest. Atmos. Chem. Phys. 2016, 16, 15165–15184. [Google Scholar] [CrossRef] [Green Version]
- Musgrave, D. Detection of an Endophytic Fungus of Lolium Perenne Using Enzyme-Linked Immunosorbent Assay (ELISA). N. Z. J. Agric. Res. 1984, 27, 283–288. [Google Scholar] [CrossRef] [Green Version]
- Flückiger, B.; Koller, T.; Monn, C. Comparison of Airborne Spore Concentrations and Fungal Allergen Content. Aerobiologia 2000, 16, 393. [Google Scholar] [CrossRef]
- Carisse, O.; Savary, S.; Willocquet, L. Spatiotemporal Relationships between Disease Development and Airborne Inoculum in Unmanaged and Managed Botrytis Leaf Blight Epidemics. Phytopathology 2008, 98, 38–44. [Google Scholar] [CrossRef] [Green Version]
- Lindsley, W.G.; Schmechel, D.; Chen, B.T. A Two-Stage Cyclone Using Microcentrifuge Tubes for Personal Bioaerosol Sampling. J. Environ. Monit. 2006, 8, 1136–1142. [Google Scholar] [CrossRef] [PubMed]
- Dodge, A.H.; Meng, Y.-J.G.; Sims, P.W.; Sinicropi, D.V.; Williams, P.M.; Wong, W.L. PCR Assay. 2005. Available online: https://uspto.report/patent/grant/6927024 (accessed on 13 December 2021).
- Conen, F.; Eckhardt, S.; Gundersen, H.; Stohl, A.; Yttri, K.E. Rainfall Drives Atmospheric Ice Nucleating Particles in the Maritime Climate of Southern Norway. Atmos. Chem. Phys. Discuss. 2017, 17, 1–13. [Google Scholar] [CrossRef]
- Phillips, V.T.J.; Andronache, C.; Christner, B.; Morris, C.E.; Sands, D.C.; Bansemer, A.; Lauer, A.; McNaughton, C.; Seman, C. Potential Impacts from Biological Aerosols on Ensembles of Continental Clouds Simulated Numerically. Biogeosciences 2009, 6, 987–1014. [Google Scholar] [CrossRef] [Green Version]
- Bieber, P.; Seifried, T.M.; Burkart, J.; Gratzl, J.; Kasper-Giebl, A.; Schmale, D.G.; Grothe, H. A Drone-Based Bioaerosol Sampling System to Monitor Ice Nucleation Particles in the Lower Atmosphere. Remote Sens. 2020, 12, 552. [Google Scholar] [CrossRef] [Green Version]
- Maki, L.R.; Galyan, E.L.; Chang-Chien, M.M.; Caldwell, D.R. Ice Nucleation Induced by Pseudomonas Syringae. Appl. Microbiol. 1974, 28, 456–459. [Google Scholar] [CrossRef]
- Pratt, K.A.; Demott, P.J.; French, J.R.; Wang, Z.; Westphal, D.L.; Heymsfield, A.J.; Twohy, C.H.; Prenni, A.J.; Prather, K.A. In Situ Detection of Biological Particles in Cloud Ice-Crystals. Nat. Geosci. 2009, 2, 398–401. [Google Scholar] [CrossRef]
- Prenni, A.J.; Petters, M.D.; Kreidenweis, S.M.; Heald, C.L.; Martin, S.T.; Artaxo, P.; Garland, R.M.; Wollny, A.G.; Pöschl, U. Relative Roles of Biogenic Emissions and Saharan Dust as Ice Nuclei in the Amazon Basin. Nat. Geosci. 2009, 2, 402–405. [Google Scholar] [CrossRef]
- DeMott, P.J.; Prenni, A.J. New Directions: Need for Defining the Numbers and Sources of Biological Aerosols Acting as Ice Nuclei. Atmos. Environ. 2010, 44, 1944–1945. [Google Scholar] [CrossRef]
- Pöschl, U.; Martin, S.T.; Sinha, B.; Chen, Q.; Gunthe, S.S.; Huffman, J.A.; Borrmann, S.; Farmer, D.K.; Garland, R.M.; Helas, G.; et al. Rainforest Aerosols as Biogenic Nuclei of Clouds and Precipitation in the Amazon. Science 2010, 329, 1513–1516. [Google Scholar] [CrossRef] [PubMed] [Green Version]
- Whitehead, J.D.; Darbyshire, E.; Brito, J.; Barbosa, H.M.J.; Crawford, I.; Stern, R.; Gallagher, M.W.; Kaye, P.H.; Allan, J.D.; Coe, H.; et al. Biogenic Cloud Nuclei in the Central Amazon during the Transition from Wet to Dry Season. Atmos. Chem. Phys. 2016, 16, 9727–9743. [Google Scholar] [CrossRef] [Green Version]
- Hoose, C.; Kristjánsson, J.E.; Burrows, S.M. How Important Is Biological Ice Nucleation in Clouds on a Global Scale? Environ. Res. Lett. 2010, 5, 024009. [Google Scholar] [CrossRef]
- Haga, D.I.; Burrows, S.M.; Iannone, R.; Wheeler, M.J.; Mason, R.H.; Chen, J.; Polishchuk, E.A.; Pöschl, U.; Bertram, A.K. Ice Nucleation by Fungal Spores from the Classes Agaricomycetes, Ustilaginomycetes, and Eurotiomycetes, and the Effect on the Atmospheric Transport of These Spores. Atmos. Chem. Phys. 2014, 14, 8611–8630. [Google Scholar] [CrossRef] [Green Version]
- Hummel, M.; Hoose, C.; Pummer, B.; Schaupp, C.; Fröhlich-Nowoisky, J.; Möhler, O. Simulating the Influence of Primary Biological Aerosol Particles on Clouds by Heterogeneous Ice Nucleation. Atmos. Chem. Phys. 2018, 18, 15437–15450. [Google Scholar] [CrossRef] [Green Version]
- Spracklen, D.V.; Heald, C.L. The Contribution of Fungal Spores and Bacteria to Regional and Global Aerosol Number and Ice Nucleation Immersion Freezing Rates. Atmos. Chem. Phys. 2014, 14, 9051–9059. [Google Scholar] [CrossRef] [Green Version]
- Maya-Manzano, J.M.; Smith, M.; Markey, E.; Hourihane Clancy, J.; Sodeau, J.; O’Connor, D.J. Recent Developments in Monitoring and Modelling Airborne Pollen, a Review. Grana 2021, 60, 1–19. [Google Scholar] [CrossRef]
- Damialis, A.; Gioulekas, D. Airborne Allergenic Fungal Spores and Meteorological Factors in Greece: Forecasting Possibilities. Grana 2006, 45, 122–129. [Google Scholar] [CrossRef] [Green Version]
- Vélez-Pereira, A.M.; De Linares, C.; Belmonte, J. Aerobiological Modeling I: A Review of Predictive Models: Aerobiological Predictive Models, a Review. Sci. Total Environ. 2021, 795, 148783. [Google Scholar] [CrossRef]
- Sesartic, A.; Dallafior, T.N. Global Fungal Spore Emissions, Review and Synthesis of Literature Data. Biogeosciences 2011, 8, 1181–1192. [Google Scholar] [CrossRef] [Green Version]
- Filali Ben Sidel, F.; Bouziane, H.; del Mar Trigo, M.; El Haskouri, F.; Bardei, F.; Redouane, A.; Kadiri, M.; Riadi, H.; Kazzaz, M. Airborne Fungal Spores of Alternaria, Meteorological Parameters and Predicting Variables. Int. J. Biometeorol. 2015, 59, 339–346. [Google Scholar] [CrossRef] [PubMed]
- Grinn-Gofroń, A.; Mika, A. Selected Airborne Allergenic Fungal Spores and Meteorological Factors in Szczecin, Poland, 2004-2006. Aerobiologia 2008, 24, 89–97. [Google Scholar] [CrossRef]
- Grinn-Gofroń, A.; Strzelczak, A. The Effects of Meteorological Factors on the Occurrence of Ganoderma sp. Spores in the Air. Int. J. Biometeorol. 2011, 55, 235–241. [Google Scholar] [CrossRef] [PubMed] [Green Version]
- Ianovici, N. Atmospheric Concentrations of Selected Allergenic Fungal Spores in Relation to Some Meteorological Factors, in Timişoara (Romania). Aerobiologia 2016, 32, 139–156. [Google Scholar] [CrossRef]
- Lyon, F.L.; Kramer, C.L.; Eversmeyer, M.G. Variation of Airspora in the Atmosphere Due to Weather Conditions. Grana 1984, 23, 177–181. [Google Scholar] [CrossRef]
- Sadyś, M.; Kaczmarek, J.; Grinn-Gofron, A.; Rodinkova, V.; Prikhodko, A.; Bilous, E.; Strzelczak, A.; Herbert, R.J.; Jedryczka, M. Dew Point Temperature Affects Ascospore Release of Allergenic Genus Leptosphaeria. Int. J. Biometeorol. 2018, 62, 979–990. [Google Scholar] [CrossRef] [Green Version]
- Elbert, W.; Taylor, P.E.; Andreae, M.O.; Pöschl, U. Contribution of Fungi to Primary Biogenic Aerosols in the Atmosphere: Wet and Dry Discharged Spores, Carbohydrates, and Inorganic Ions. Atmos. Chem. Phys. 2007, 7, 4569–4588. [Google Scholar] [CrossRef] [Green Version]
- Li, D.W.; Kendrick, B. A Year-Round Study on Functional Relationships of Airborne Fungi with Meteorological Factors. Int. J. Biometeorol. 1995, 39, 74–80. [Google Scholar] [CrossRef]
- Sadyś, M.; Kennedy, R.; West, J.S. Potential Impact of Climate Change on Fungal Distributions: Analysis of 2 Years of Contrasting Weather in the UK. Aerobiologia 2016, 32, 127–137. [Google Scholar] [CrossRef]
- Grinn-Gofroń, A.; Bosiacka, B. The Advanced Statistical Methods in Aerobiological Studies. Acta Agrobot. 2012, 65, 69–74. [Google Scholar] [CrossRef] [Green Version]
- Mediavilla Molina, A.; Angulo Romero, J.; Infante García-Pantaleón, F.; Comtois, P.; Domínguez Vilches, E. Preliminary Statistical Modeling of the Presence of Two Conidial Types of Cladosporium in the Atmosphere of Córdoba, Spain. Aerobiologia 1998, 14, 229–234. [Google Scholar] [CrossRef]
- Rodríguez-Rajo, F.J.; Iglesias, I.; Jato, V. Variation Assessment of Airborne Alternaria and Cladosporium Spores at Different Bioclimatical Conditions. Mycol. Res. 2005, 109, 497–507. [Google Scholar] [CrossRef]
- Aira, M.J.; Rodríguez-rajo, F.J.; Jato, V. Annual records of allergenic fungi spore: Predictive models from the nw iberian peninsula. Ann. Agric. Environ. Med. 2008, 15, 91–98. [Google Scholar] [PubMed]
- Verma, K.S.; Pathak, A.K. A Comparative Analysis of Forecasting Methods for Aerobiological Studies. Asian J. Exp. Sci. 2009, 23, 7. [Google Scholar]
- Recio, M.; del Mar Trigo, M.; Docampo, S.; Melgar, M.; García-Sánchez, J.; Bootello, L.; Cabezudo, B. Analysis of the Predicting Variables for Daily and Weekly Fluctuations of Two Airborne Fungal Spores: Alternaria and Cladosporium. Int. J. Biometeorol. 2012, 56, 983–991. [Google Scholar] [CrossRef] [PubMed]
- Ščevková, J.; Hrabovsky, M.; Kováč, J.; Rosa, S. Intradiurnal Variation of Predominant Airborne Fungal Spore Biopollutants in the Central European Urban Environment. Environ. Sci. Pollut. Res. 2019, 26, 34603–34612. [Google Scholar] [CrossRef]
- Ho, H.-M.; Rao, C.Y.; Hsu, H.-H.; Chiu, Y.-H.; Liu, C.-M.; Chao, H.J. Characteristics and Determinants of Ambient Fungal Spores in Hualien, Taiwan. Atmos. Environ. 2005, 39, 5839–5850. [Google Scholar] [CrossRef]
- Stȩpalska, D.; Wołek, J. Variation in Fungal Spore Concentrations of Selected Taxa Associated to Weather Conditions in Cracow, Poland, in 1997. Aerobiologia 2005, 21, 43–52. [Google Scholar] [CrossRef]
- Burch, M.; Levetin, E. Effects of Meteorological Conditions on Spore Plumes. Int. J. Biometeorol. 2002, 46, 107–117. [Google Scholar] [CrossRef]
- De Linares, C.; Belmonte, J.; Canela, M.; de la Guardia, C.D.; Alba-Sanchez, F.; Sabariego, S.; Alonso-Pérez, S. Dispersal Patterns of Alternaria Conidia in Spain. Agric. For. Meteorol. 2010, 150, 1491–1500. [Google Scholar] [CrossRef]
- González-Fernández, E.; Piña-Rey, A.; Fernández-González, M.; Rodríguez-Rajo, F.J. Effect of Environmental Conditions and Phenology in the Dispersal of Secondary Erysiphe Necator Conidia in a Vineyard. Vitis J. Grapevine Res. 2019, 58, 49–58. [Google Scholar] [CrossRef]
- Stephen, E.; Raffery, A.E.; Dowding, P. Forecasting Spore Concentrations: A Time Series Approach. Int. J. Biometeorol. 1990, 34, 87–89. [Google Scholar] [CrossRef] [PubMed]
- Fernández-gonzález, M.; Ramos-valcárcel, D.; Aira, M.J.; Rodríguez-rajo, F.J. Prediction of Biological Sensors Appearance with ARIMA Models as a Tool for Integrated Pest Management Protocols. Ann. Agric. Environ. Med. 2016, 23, 129–137. [Google Scholar] [CrossRef] [PubMed]
- Box, G.; Jenkins, G.; Reinsel, G. Box—Time Series Analysis, 3rd ed.; Prentice Hall: Englewood Cliff, NJ, USA, 1994. [Google Scholar]
- Kallawicha, K.; Tsai, Y.-J.; Chuang, Y.-C.; Lung, S.-C.C.; Wu, C.-D.; Chen, T.-H.; Chen, P.-C.; Chompuchan, C.; Chao, H.J. The Spatiotemporal Distributions and Determinants of Ambient Fungal Spores in the Greater Taipei Area. Environ. Pollut. 2015, 204, 173–180. [Google Scholar] [CrossRef] [PubMed]
- Escuredo, O.; Seijo, M.C.; Fernández-González, M.; Iglesias, I. Effects of Meteorological Factors on the Levels of Alternaria Spores on a Potato Crop. Int. J. Biometeorol. 2011, 55, 243–252. [Google Scholar] [CrossRef]
- Fernández-gonzález, M.; Rodríguez-rajo, F.J.; Jato, V.; Aira, M.J.; Ribeiro, H.; Oliveira, M.; Abreu, I. Forecasting ARIMA Models for Atmospheric Vineyard Pathogens in Galicia and Northern Portugal: Botrytis Cinerea Spores. Ann. Agric. Environ. Med. 2012, 19, 255–262. [Google Scholar]
- Kasprzyk, I.; Walanus, A. Gamma, Gaussian and Logistic Distribution Models for Airborne Pollen Grains and Fungal Spore Season Dynamics. Aerobiologia 2014, 30, 369–383. [Google Scholar] [CrossRef] [Green Version]
- Belmonte, J.; Canela, M. Modelling Aerobiological Time Series. Application to Urticaceae. Aerobiologia 2002, 18, 287–295. [Google Scholar] [CrossRef]
- Kasprzyk, I.; Walanus, A. Description of the Main Poaceae Pollen Season Using Bi-Gaussian Curves, and Forecasting Methods for the Start and Peak Dates for This Type of Season in Rzeszów and Ostrowiec Św. (SE Poland). J. Environ. Monit. 2010, 12, 906. [Google Scholar] [CrossRef]
- Vélez-Pereira, A.M.; De Linares, C.; Canela, M.; Belmonte, J. Spatial Distribution of Fungi from the Analysis of Aerobiological Data with a Gamma Function. Aerobiologia 2021, 37, 461–477. [Google Scholar] [CrossRef]
- Comtois, P. The Gamma Distribution as the True Aerobiological Probability Density Function (PDF). Aerobiologia 2000, 16, 171–176. [Google Scholar] [CrossRef]
- Jedryczka, M.; Strzelczak, A.; Grinn-Gofron, A.; Nowak, M.; Wolski, T.; Siwulski, M.; Sobieralski, K.; Kaczmarek, J. Advanced Statistical Models Commonly Applied in Aerobiology Cannot Accurately Predict the Exposure of People to Ganoderma Spore-Related Allergies. Agric. For. Meteorol. 2015, 201, 209–217. [Google Scholar] [CrossRef]
- Recknagel, F. Applications of Machine Learning to Ecological Modelling. Ecol. Model. 2001, 146, 303–310. [Google Scholar] [CrossRef]
- Kasprzyk, I.; Grinn-Gofroń, A.; Strzelczak, A.; Wolski, T. Hourly Predictive Artificial Neural Network and Multivariate Regression Trees Models of Ganoderma Spore Concentrations in Rzeszów and Szczecin (Poland). Sci. Total Environ. 2011, 409, 949–956. [Google Scholar] [CrossRef]
- Astray, G.; Rodríguez-Rajo, F.J.; Ferreiro-Lage, J.A.; Fernández-González, M.; Jato, V.; Mejuto, J.C. The Use of Artificial Neural Networks to Forecast Biological Atmospheric Allergens or Pathogens Only as Alternaria Spores. J. Environ. Monit. 2010, 12, 2145–2152. [Google Scholar] [CrossRef]
- Bruno, A.A.; Pace, L.; Tomassetti, B.; Coppola, E.; Verdecchia, M.; Pacioni, G.; Visconti, G. Estimation of Fungal Spore Concentrations Associated to Meteorological Variables. Aerobiologia 2007, 23, 221–228. [Google Scholar] [CrossRef]
- Grinn-Gofroń, A.; Strzelczak, A.; Wolski, T. The Relationships between Air Pollutants, Meteorological Parameters and Concentration of Airborne Fungal Spores. Environ. Pollut. 2011, 159, 602–608. [Google Scholar] [CrossRef]
- Grinn-Gofroń, A.; Strzelczak, A. Changes in Concentration of Alternaria and Cladosporium Spores during Summer Storms. Int. J. Biometeorol. 2013, 57, 759–768. [Google Scholar] [CrossRef] [Green Version]
- Grinn-Gofroń, A.; Strzelczak, A. Artificial Neural Network Models of Relationships between Alternaria Spores and Meteorological Factors in Szczecin (Poland). Int. J. Biometeorol. 2008, 52, 859–868. [Google Scholar] [CrossRef]
- Tomassetti, B.; Lombardi, A.; Cerasani, E.; Di Sabatino, A.; Pace, L.; Ammazzalorso, D.; Verdecchia, M. Mapping of Alternaria and Pleospora Concentrations in Central Italy Using Meteorological Forecast and Neural Network Estimator. Aerobiologia 2013, 29, 55–70. [Google Scholar] [CrossRef]
- Tomassetti, B.; Angelosante Bruno, A.; Pace, L.; Verdecchia, M.; Visconti, G. Prediction of Alternaria and Pleospora Concentrations from the Meteorological Forecast and Artificial Neural Network in L’Aquila, Abruzzo (Central Italy). Aerobiologia 2009, 25, 127–136. [Google Scholar] [CrossRef]
- Mojerlou, S.; Mousanejad, S.; Safaie, N. Modeling Fluctuation of Pyricularia Grisea Spore Population as Affected by Meteorological Factors in Guilan Province (Iran) Using Artificial Neural Network. J. Crop Prot. 2013, 2, 501–514. [Google Scholar]
- De’ath, G. Multivariate Regression Trees: A New Technique for Modeling Species-Environment Relationships. Ecology 2002, 83, 1105–1117. [Google Scholar] [CrossRef]
- Sadyś, M.; Skjøth, C.A.; Kennedy, R. Forecasting Methodologies for Ganoderma Spore Concentration Using Combined Statistical Approaches and Model Evaluations. Int. J. Biometeorol. 2016, 60, 489–498. [Google Scholar] [CrossRef]
- Grinn-Gofroń, A.; Nowosad, J.; Bosiacka, B.; Camacho, I.; Pashley, C.; Belmonte, J.; De Linares, C.; Ianovici, N.; Manzano, J.M.M.; Sadyś, M.; et al. Airborne Alternaria and Cladosporium Fungal Spores in Europe: Forecasting Possibilities and Relationships with Meteorological Parameters. Sci. Total Environ. 2019, 653, 938–946. [Google Scholar] [CrossRef]
- Grinn-Gofroń, A.; Bogawski, P.; Bosiacka, B.; Nowosad, J.; Camacho, I.; Sadyś, M.; Skjøth, C.A.; Pashley, C.H.; Rodinkova, V.; Çeter, T.; et al. Abundance of Ganoderma Sp. in Europe and SW Asia: Modelling the Pathogen Infection Levels in Local Trees Using the Proxy of Airborne Fungal Spore Concentrations. Sci. Total Environ. 2021, 793, 148509. [Google Scholar] [CrossRef]
- Grundström, M.; Adams-Groom, B.; Pashley, C.H.; Dahl, Å.; Rasmussen, K.; de Weger, L.A.; Thibaudon, M.; Fernández-Rodríguez, S.; Silva-Palacios, I.; Skjøth, C.A. Oak Pollen Seasonality and Severity across Europe and Modelling the Season Start Using a Generalized Phenological Model. Sci. Total Environ. 2019, 663, 527–536. [Google Scholar] [CrossRef]
- Crandall, S.G.; Gilbert, G.S. Meteorological Factors Associated with Abundance of Airborne Fungal Spores over Natural Vegetation. Atmos. Environ. 2017, 162, 87–99. [Google Scholar] [CrossRef]
- Qi, Y.; Li, Y.; Xie, W.; Lu, R.; Mu, F.; Bai, W.; Du, S. Temporal-Spatial Variations of Fungal Composition in PM2.5 and Source Tracking of Airborne Fungi in Mountainous and Urban Regions. Sci. Total Environ. 2020, 708, 135027. [Google Scholar] [CrossRef]
- Apangu, G.P.; Frisk, C.A.; Adams-Groom, B.; Satchwell, J.; Pashley, C.H.; Skjøth, C.A. Air Mass Trajectories and Land Cover Map Reveal Cereals and Oilseed Rape as Major Local Sources of Alternaria Spores in the Midlands, UK. Atmos. Pollut. Res. 2020, 11, 1668–1679. [Google Scholar] [CrossRef]
- Redondo, M.A.; Berlin, A.; Boberg, J.; Oliva, J. Vegetation Type Determines Spore Deposition within a Forest-Agricultural Mosaic Landscape. FEMS Microbiol. Ecol. 2020, 96, fiaa082. [Google Scholar] [CrossRef] [PubMed]
- Ansari, T.U.; Valsan, A.E.; Ojha, N.; Ravikrishna, R.; Narasimhan, B.; Gunthe, S.S. Model Simulations of Fungal Spore Distribution over the Indian Region. Atmos. Environ. 2015, 122, 552–560. [Google Scholar] [CrossRef]
- Hummel, M.; Hoose, C.; Gallagher, M.; Healy, D.A.; Huffman, J.A.; O’Connor, D.; Pöschl, U.; Pöhlker, C.; Robinson, N.H.; Schnaiter, M.; et al. Regional-Scale Simulations of Fungal Spore Aerosols Using an Emission Parameterization Adapted to Local Measurements of Fluorescent Biological Aerosol Particles. Atmos. Chem. Phys. 2015, 15, 6127–6146. [Google Scholar] [CrossRef] [Green Version]
- Sadyś, M.; Skjøth, C.A.; Kennedy, R. Determination of Alternaria Spp. Habitats Using 7-Day Volumetric Spore Trap, Hybrid Single Particle Lagrangian Integrated Trajectory Model and Geographic Information System. Urban Clim. 2015, 14, 429–440. [Google Scholar] [CrossRef]
- Skjøth, C.A.; Kennedy, R. Back-Trajectories Show Export of Airborne Fungal Spores (Ganoderma Sp.) from Forests to Agricultural and Urban Areas in England. Atmos. Environ. 2014, 84, 88–99. [Google Scholar] [CrossRef]
- Sarda-Estève, R.; Baisnée, D.; Guinot, B.; Sodeau, J.; O’Connor, D.; Belmonte, J.; Besancenot, J.P.; Petit, J.E.; Thibaudon, M.; Oliver, G.; et al. Variability and Geographical Origin of Five Years Airborne Fungal Spore Concentrations Measured at Saclay, France from 2014 to 2018. Remote Sens. 2019, 11, 1671. [Google Scholar] [CrossRef] [Green Version]
- Hirst, J. Bioaerosols: Introduction, Retrospect and Prospect. In Bioaerosol Handbook; CRC Press: Boca Raton, FL, USA, 1995. [Google Scholar]
| Publisher’s Note: MDPI stays neutral with regard to jurisdictional claims in published maps and institutional affiliations. |
© 2022 by the authors. Licensee MDPI, Basel, Switzerland. This article is an open access article distributed under the terms and conditions of the Creative Commons Attribution (CC BY) license (https://creativecommons.org/licenses/by/4.0/).


 ,
, 

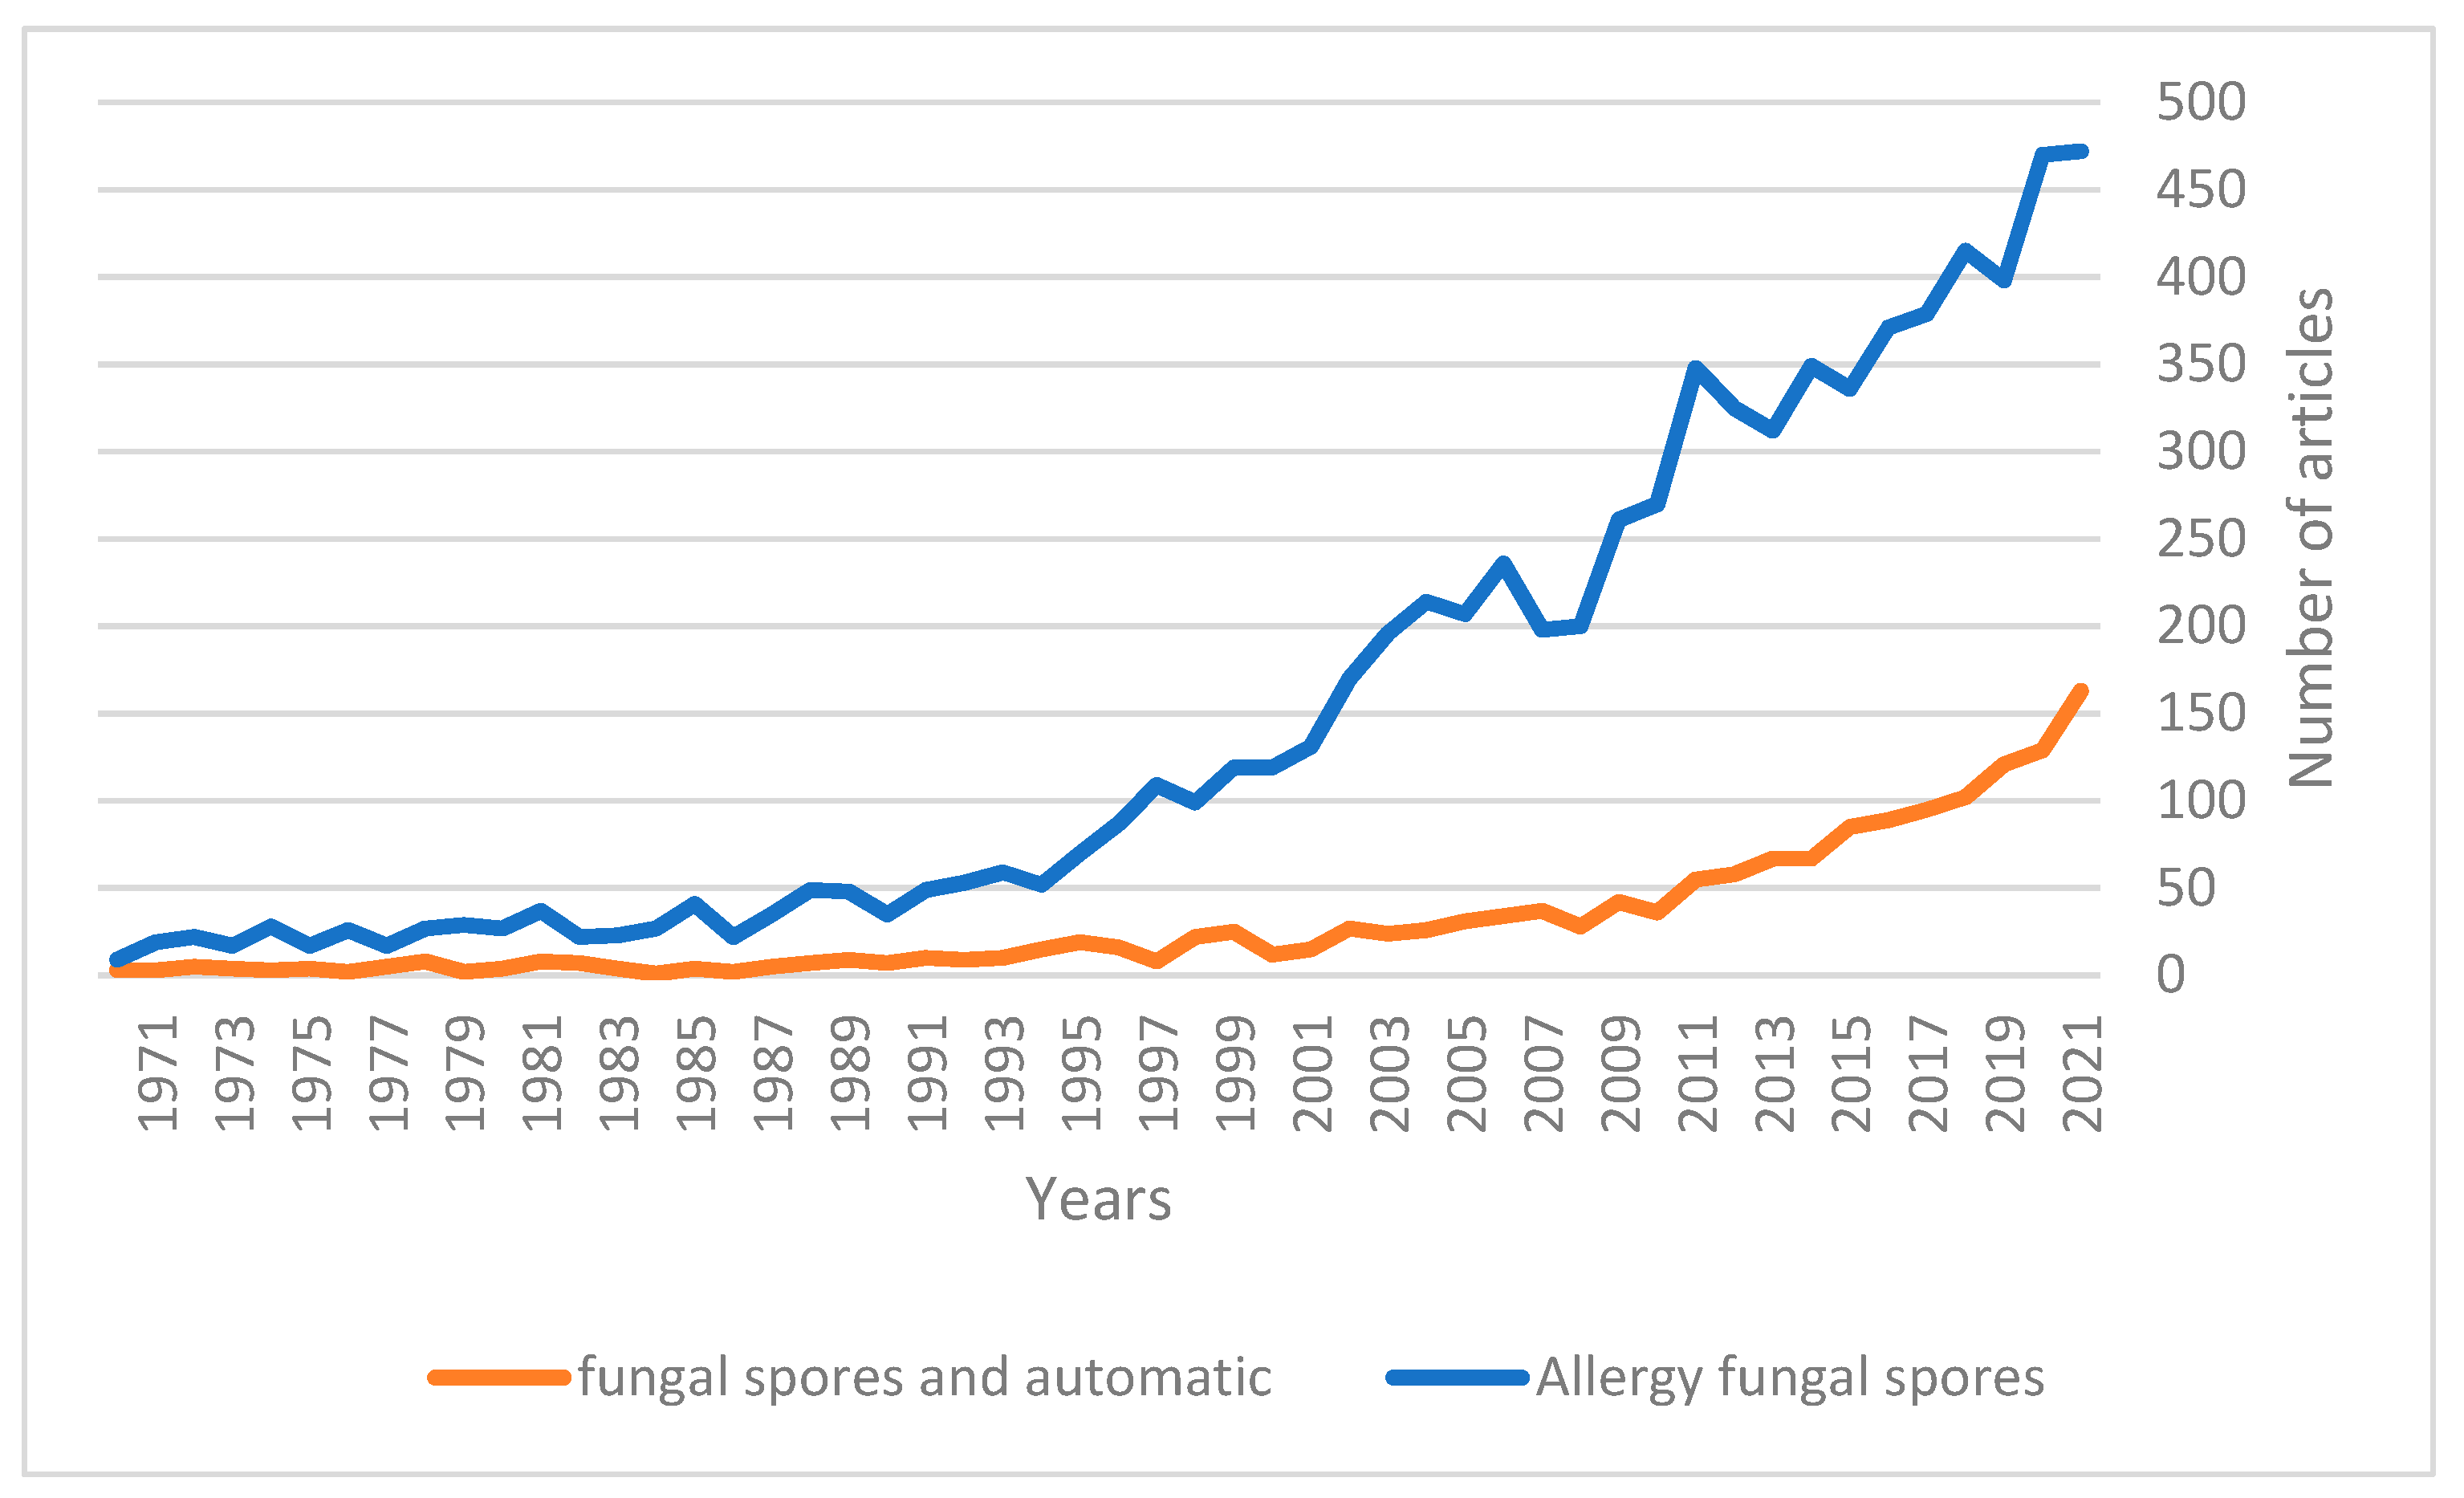

