Article

Spatiotemporal Distribution of Precipitation over the Mongolian Plateau during 1976–2017

1
Provincial Key Laboratory of Mongolian Plateau’s Climate System, Inner Mongolia Normal University, Hohhot 010022, China
2
Inner Mongolia Restoration Engineering Laboratory of Wetland Eco-Environment System, Inner Mongolia Normal University, Hohhot 010022, China
3
College of Geographical Science, Inner Mongolia Normal University, Hohhot 010022, China
*
Author to whom correspondence should be addressed.
Atmosphere 2022, 13(12), 2132; https://doi.org/10.3390/atmos13122132
Submission received: 14 November 2022 / Accepted: 13 December 2022 / Published: 19 December 2022
(This article belongs to the Topic Advanced Research in Precipitation Measurements)

Abstract

:
Located in the interior of Eurasia, the Mongolian Plateau (MP) is extremely sensitive to global warming and become a critical area for studying precipitation patterns. Based on the monthly data of 135 meteorological stations during 1976–2017, we analyze the spatiotemporal change in precipitation and discuss its response to atmospheric circulation. The results show that: (1) Precipitation shows increasing trends in spring, autumn, and winter, but a decreasing trend at a rate of 5.3 mm/decade in summer. The annual precipitation also shows an overall slight decreasing trend. (2) The spatial distribution is uneven, the annual precipitation in the northern Great Khingan Mountains is more, but it gradually decreases at the rate of 10–30 mm/decade, showing a trend of “wet gets dry”; while there is less in the southwest Gobi Desert region, but it gradually increases with the rate of 10–20 mm/decade, showing a trend of “dry gets wet”. (3) Over decades, the East Asian summer monsoon (EASM) and westerly circulation show a seesaw change in MP. Affected by the weakening of the EASM, the area of arid regions has gradually expanded. The results also demonstrate that the EASM has a higher impact on the annual precipitation change pattern, particularly in the southeastern MP. The conclusion indicated that the variation in the position and orientation between EASM and the westerly circulation may be an explanation for the spatiotemporal precipitation pattern, providing a new viewpoint to the question of circulation mechanisms behind climate change in MP in recent 40 years.

1. Introduction

Global warming has become one of the most important environmental problems of the 21st century, and arid climate conditions will have a significant impact on the restriction of hydrology and agricultural production. Drought often results in substantial production reduction or even no harvest, which has attracted increasing attention from the international community as well as the governments of various countries [1]. Therefore, it is of great practical significance to further study the regularity and characteristics of precipitation in exploiting the agricultural production potential in arid and semi-arid areas. Since the 1950s, almost all regions of the world have experienced warming [2,3], especially marked in the middle and high latitudes of the Northern Hemisphere, for example, in the Arctic [4,5,6,7]. It may accelerate the marine–continental hydrological cycle, resulting in differences in the spatiotemporal distribution of water resources and the patterns of precipitation change rate [8,9,10,11,12]. The land will become drier or wetter in arid areas, which has become a hot topic in the scientific community. On a large scale, about 75% of the global land area cannot detect strong dry and wet changes [13,14,15]. In the remaining 25% of the land, among them only 10.8% of the region has experienced the process of “dry gets drier, wet gets wetter” (DDWW), but 13.8% of the area has a trend of “dry to wet, wet to dry” (DWWD) [16,17]. The drought situation has become more serious based on the calculation of multiple drought indexes in Central Asia [8,18], and due to the influence of atmospheric circulation, the precipitation has decreased rapidly, showing a trend of dry gets drier [15,19,20,21,22]. Even a partly humid region of Asia, the western Mediterranean, and eastern Australia show a pattern of wet gets dry [14,23,24,25,26,27]. On the contrary, a part of inland Asia such as Xinjiang and Northwest China shows a trend of dry gets wet, with a gradual increase in precipitation [28,29]. It shows that precipitation pattern and distribution appeared significantly changes in the world, especially in arid regions. Temperature and precipitation have various response relationships at different time scales, and there are obvious regional differences [30,31].
This difference of precipitation variation is particularly pronounced in the Mongolian Plateau (MP) due to the influence of the East Asian summer monsoon (EASM), westerly and plateau topography [32,33,34,35]. MP plays an important role in the climate and environmental system of the Northern Hemisphere and is a representative of arid and semi-arid areas [36,37]. The annual precipitation does not change significantly in the central plateau, but the difference is obvious in the eastern and western MP [38,39,40]. There is a decreasing trend with the rate of 2.3 mm/decade in the east MP such as Horqin Sandy Land [41]. It increases in the northwest and southwest, and has a slight trend of precipitation increasing [38,39]. There is different evolution process at different spatiotemporal scales, while the causes of precipitation in different regions are still unclear, especially the changes in dry and wet conditions and their impact mechanisms are more complex and many problems need further scientific discussions.
The temperature increased significantly with a rate of 0.36 °C/decade in the southern MP over the past decades [42], a similar warming rate to that of Tehran in the Middle East (0.37 °C/decade) [43], it is unequivocally warming at a rate almost twice as fast as the global means (0.2 °C/decade), and is also higher than the average temperature increasing rate of 0.23 °C/decade in mainland China [6] and 0.34 °C/decade in the Tibetan Plateau [44,45] during the same period. The rising temperature may cause large-scale circulation anomalies and differences in precipitation patterns and distribution [46]. Due to located in the mid-latitude region, MP is one of the key regions for water vapor transmission between low and high latitudes in the world [32]. The climate is mainly controlled by the westerly circulation, which is dominated by summer precipitation, and the perennial water vapor mainly comes from the transport of mid-latitude westerly circulation [33,47]. A significant characteristic of precipitation is that it increases in northern China and decreases in southern China [48,49]. In addition, the western Pacific subtropical high (WPSH), which is an important component of the EASM circulation system, plays a major role in precipitation [50].
Although previous studies mainly focused on determining the change characteristics of precipitation on annual and seasonal timescales [38,39,40], the spatial resolution of the station is low, and there is still a lack of corresponding research on the mechanism of change in this region. The changing trends and spatial distribution characteristics of precipitation and the factors need to be further explored. Therefore, in this paper, we try to (1) discuss the spatiotemporal distribution pattern of precipitation and (2) analyze its relationship with the circulation characteristics of the EASM and westerly.

2. Materials and Methods
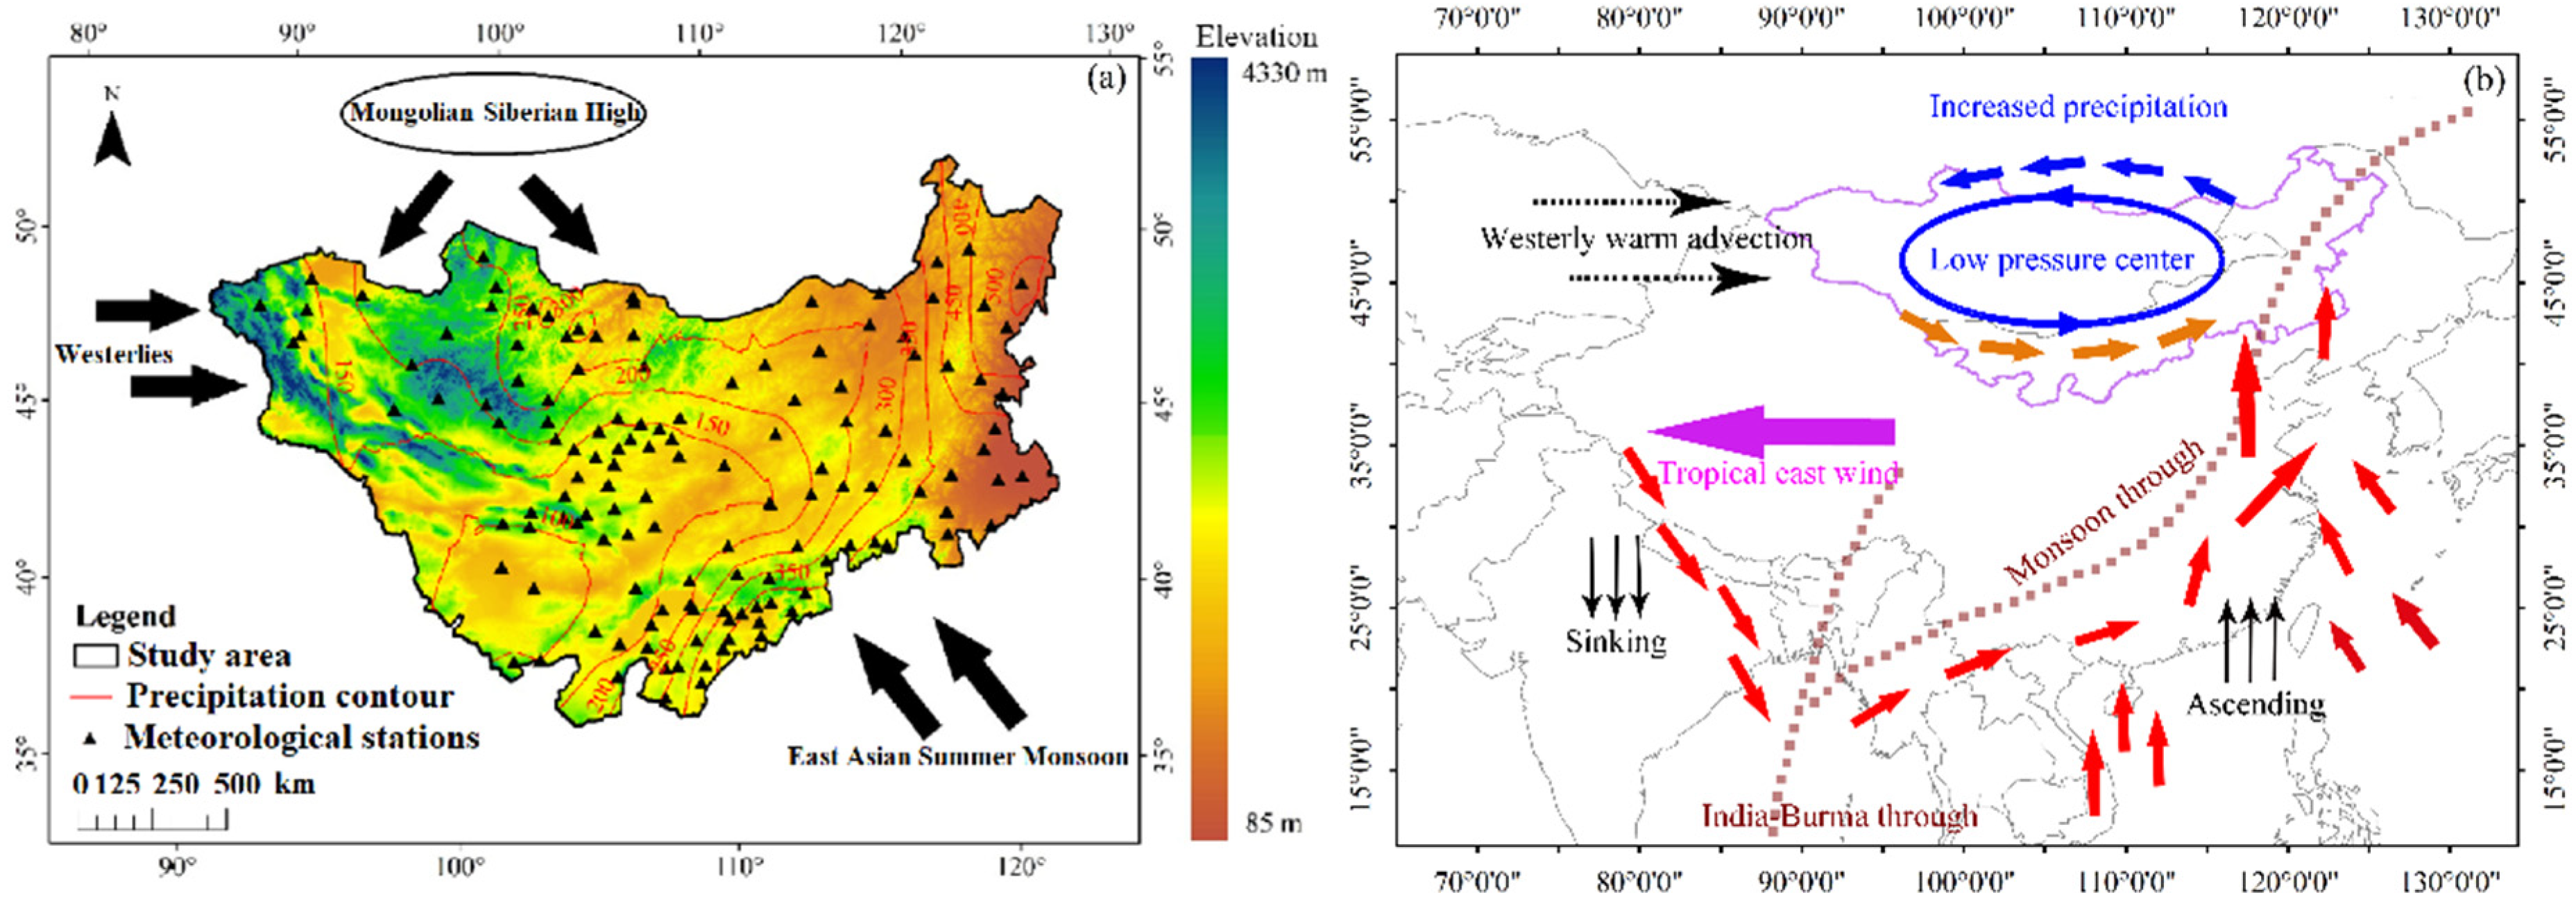
2.1. Study Area

MP is located in inland Eurasia. The east–west length and north–south width are about 2500 and 1700 km, respectively, covering a total area of approximately 2.74 × 10⁶ km2 in MP (Figure 1a). Its boundaries are determined by the Greater Khingan Mountains in the east, and the west extends to the Altai Mountains, and the northern boundary is from the Sayan Mountains to the Khentii Mountains, and the south border extends to the YinShan Mountains [51]. There are 454 lakes with an area of more than 1 km2; most of the rivers are in northern and western Mongolia. The main rivers include the Ural River, the Selenga River, and the Klulun River. The total length of the rivers is 6.7 × 10⁴ km, and the drainage area is 3.2 × 10⁵ km2 in Mongolia [52]. The elevation gradually decreases from west to east, with an average elevation of about 1500 m [53], high mountains in the northwest, Gobi and deserts in the southwest, and grasslands over the MP.
It has the typical temperate continental climate types, and water resources shortage is easy to cause the contradiction between supply and demand, restricting the development of the eco-environment and social system. Affected by the EASM in summer (Figure 1b), it is hot and rainy. In winter, the climate is dry and cold with the influence of the Mongolian–Siberian High, and it also leads to natural disasters such as snowstorms and sandstorms. Total annual precipitation is about 500 mm in the northeast, and it is less than 150 mm in the Gobi and desert area of the west (Figure 1a). Under the influence of precipitation, forests, steppe, and the Gobi Desert are distributed from northeast to southwest. The plateau has more than 60% of the total desert in China, such as the Tengger Desert, Ulan Buh Desert, Badain Jaran Desert, Otindag Sandy Land, Mu Us Sandy Land in Inner Mongolia, and the Southern Gobi Desert in Mongolia, the total area is approximately 7 × 10⁵ km2 [41,54].
Total population of Inner Mongolia and Mongolia are approximately 24.1 and 3.4 million, respectively. The population density is about 21 and 2 persons/km2, respectively [55]. In addition, it is a key green ecological barrier in the north of China and is also an important region of the China–Mongolia–Russia economic corridor in “One Belt and One Road” [33,56].

2.2. Data

The monthly precipitation data were obtained from the Mongolian National University (68 stations) and China Meteorological Data Sharing Service Network (67 stations) during 1976–2017 (http://data.cma.cn)(accessed on 12 December 2022). This paper refers to the quality control methods of data sets [58], including station extreme values, internal consistency, and spatial consistency checks, and the missing values are extended to get a complete time series. Station extreme value test: We checked whether the precipitation element exceeded the historical extreme value range. If the value of the element tested did not exceed 5 times the standard deviation of the average value, the element was considered credible. Uniformity test: We selected stations with a correlation coefficient greater than 0.5, and used F-test to check that there was no inhomogeneity and the data quality was good. The spatial difference method was used to check the consistency of the data space. There were a total of 135 meteorological stations; most were densely distributed in the east, and sparsely distributed in the west. There were 121 stations with an altitude of 1000–1500 m, accounting for 90% of all stations (p < 0.01) (Table S1). The relative elevation difference was 500 m, which excluded the influence of altitude and topography. The results show that all stations meet the requirements. Eleven stations lacked measured data during 2011–2014 in western Mongolia, and the average precipitation data of the adjacent station in the same period were used for interpolation. The accuracy of the Inverse Distance Weight (IDW) method was better than that of the Kriging method (Tables S2 and S3). The effect between data points decreased with the increase in distance. However, the interpolation process does not consider the maximum and minimum values, and the results are easily affected by the non-uniform distribution of data points. The data processing results before and after interpolation were compared, and the difference was very small (p < 0.01), indicating that the interpolation method did not have a significant impact on the result.
The East Asian Summer Monsoon Index (EASMI) [59] is I EAM = ( u + v ) / 2 1 / 2 , where u and v are the normalized wind speeds along the latitudinal circle at 850 hPa, respectively, and the area is calculated in 110°~125° E, 20°~40° N. The westerly index (WI) is H ¯ 35 ° = 1 36 λ = 1 36 H λ 35 ° - 1 36 λ = 1 36 H λ 55 ° , where λ is a geopotential height value taken every 10 longitudes along the latitude circle. The WI is the difference between the mean sea level pressure at 35° N and 55° N, reflecting the strength of the westerly in the Northern Hemisphere, which comes from a 74-item circulation index provided by the National Climate Center (https://cmdp.ncc-cma.net/cn/download.htm) (accessed on 12 December 2022). In addition, we cite other circulation indices as follow: The North Atlantic Oscillation (NAO) refers to the inverse relationship, the sea level pressure between the Azores high and Icelandic low are seesaw; El Niño/Southern Oscillation (ENSO) refers to a phenomenon that affects the world’s continuous but irregular atmospheric and oceanic circulation changes (https://cmdp.ncc-cma.net/cn/prediction.htm#phenomena) (accessed on 12 December 2022); the high pressure located in the subtropical regions of the northern and southern hemispheres, referred to as the Subtropical High (SH) (https://cmdp.ncc-cma.net/cn/prediction.htm#pred) (accessed on 12 December 2022); Arctic Oscillation (AO) is the first principal mode of empirical orthogonal decomposition (EOF) of the sea surface pressure in Northern Hemisphere, and the AO index is one of the most important climate change indices in the Northern Hemisphere; Pacific Decadal Oscillation (PDO) is the North Pacific Ocean north of 20° N, and the monthly average sea surface temperature anomaly after removing the global average is used to perform EOF, and the obtained first modal time series is used as the PDO index; the Southern Oscillation (SO) is a seesaw phenomenon that describes the opposite phase changes of the pressure fields in the tropical eastern Pacific and the tropical Indian Ocean. AO, SO, PDO, and NAO indices are all derived from NOAA’s National Climatic Data Center (https://www.ncdc.noaa.gov/teleconnections/, accessed on 12 December 2022). The atmospheric circulation index mainly selects NCEP/NCAR reanalysis data with a horizontal resolution of 2 . 5 °   ×   2 . 5 ° , including 500 hPa wind field data and water vapor flux data (https://psl.noaa.gov/data/gridded/data.necp.reanalysis.html, accessed on 12 December 2022).

2.3. Methods

2.3.1. Sen’s Slope

Sen’s slope was used to determine the magnitude of long-term trends in precipitation for in situ meteorological data. This slope is the median over all combinations of record pairs for the entire dataset and is thereby resistant to the effect of extreme values in the observed data [60]. It is estimated by
β = Median x i - x j i - j ,   1 j < i n
A positive value of β indicates an increasing trend. Otherwise, it is a downward trend.
An amount of 10 times β is taken as the climate tendency rate, which in this paper refers to the variation amplitude of precipitation.

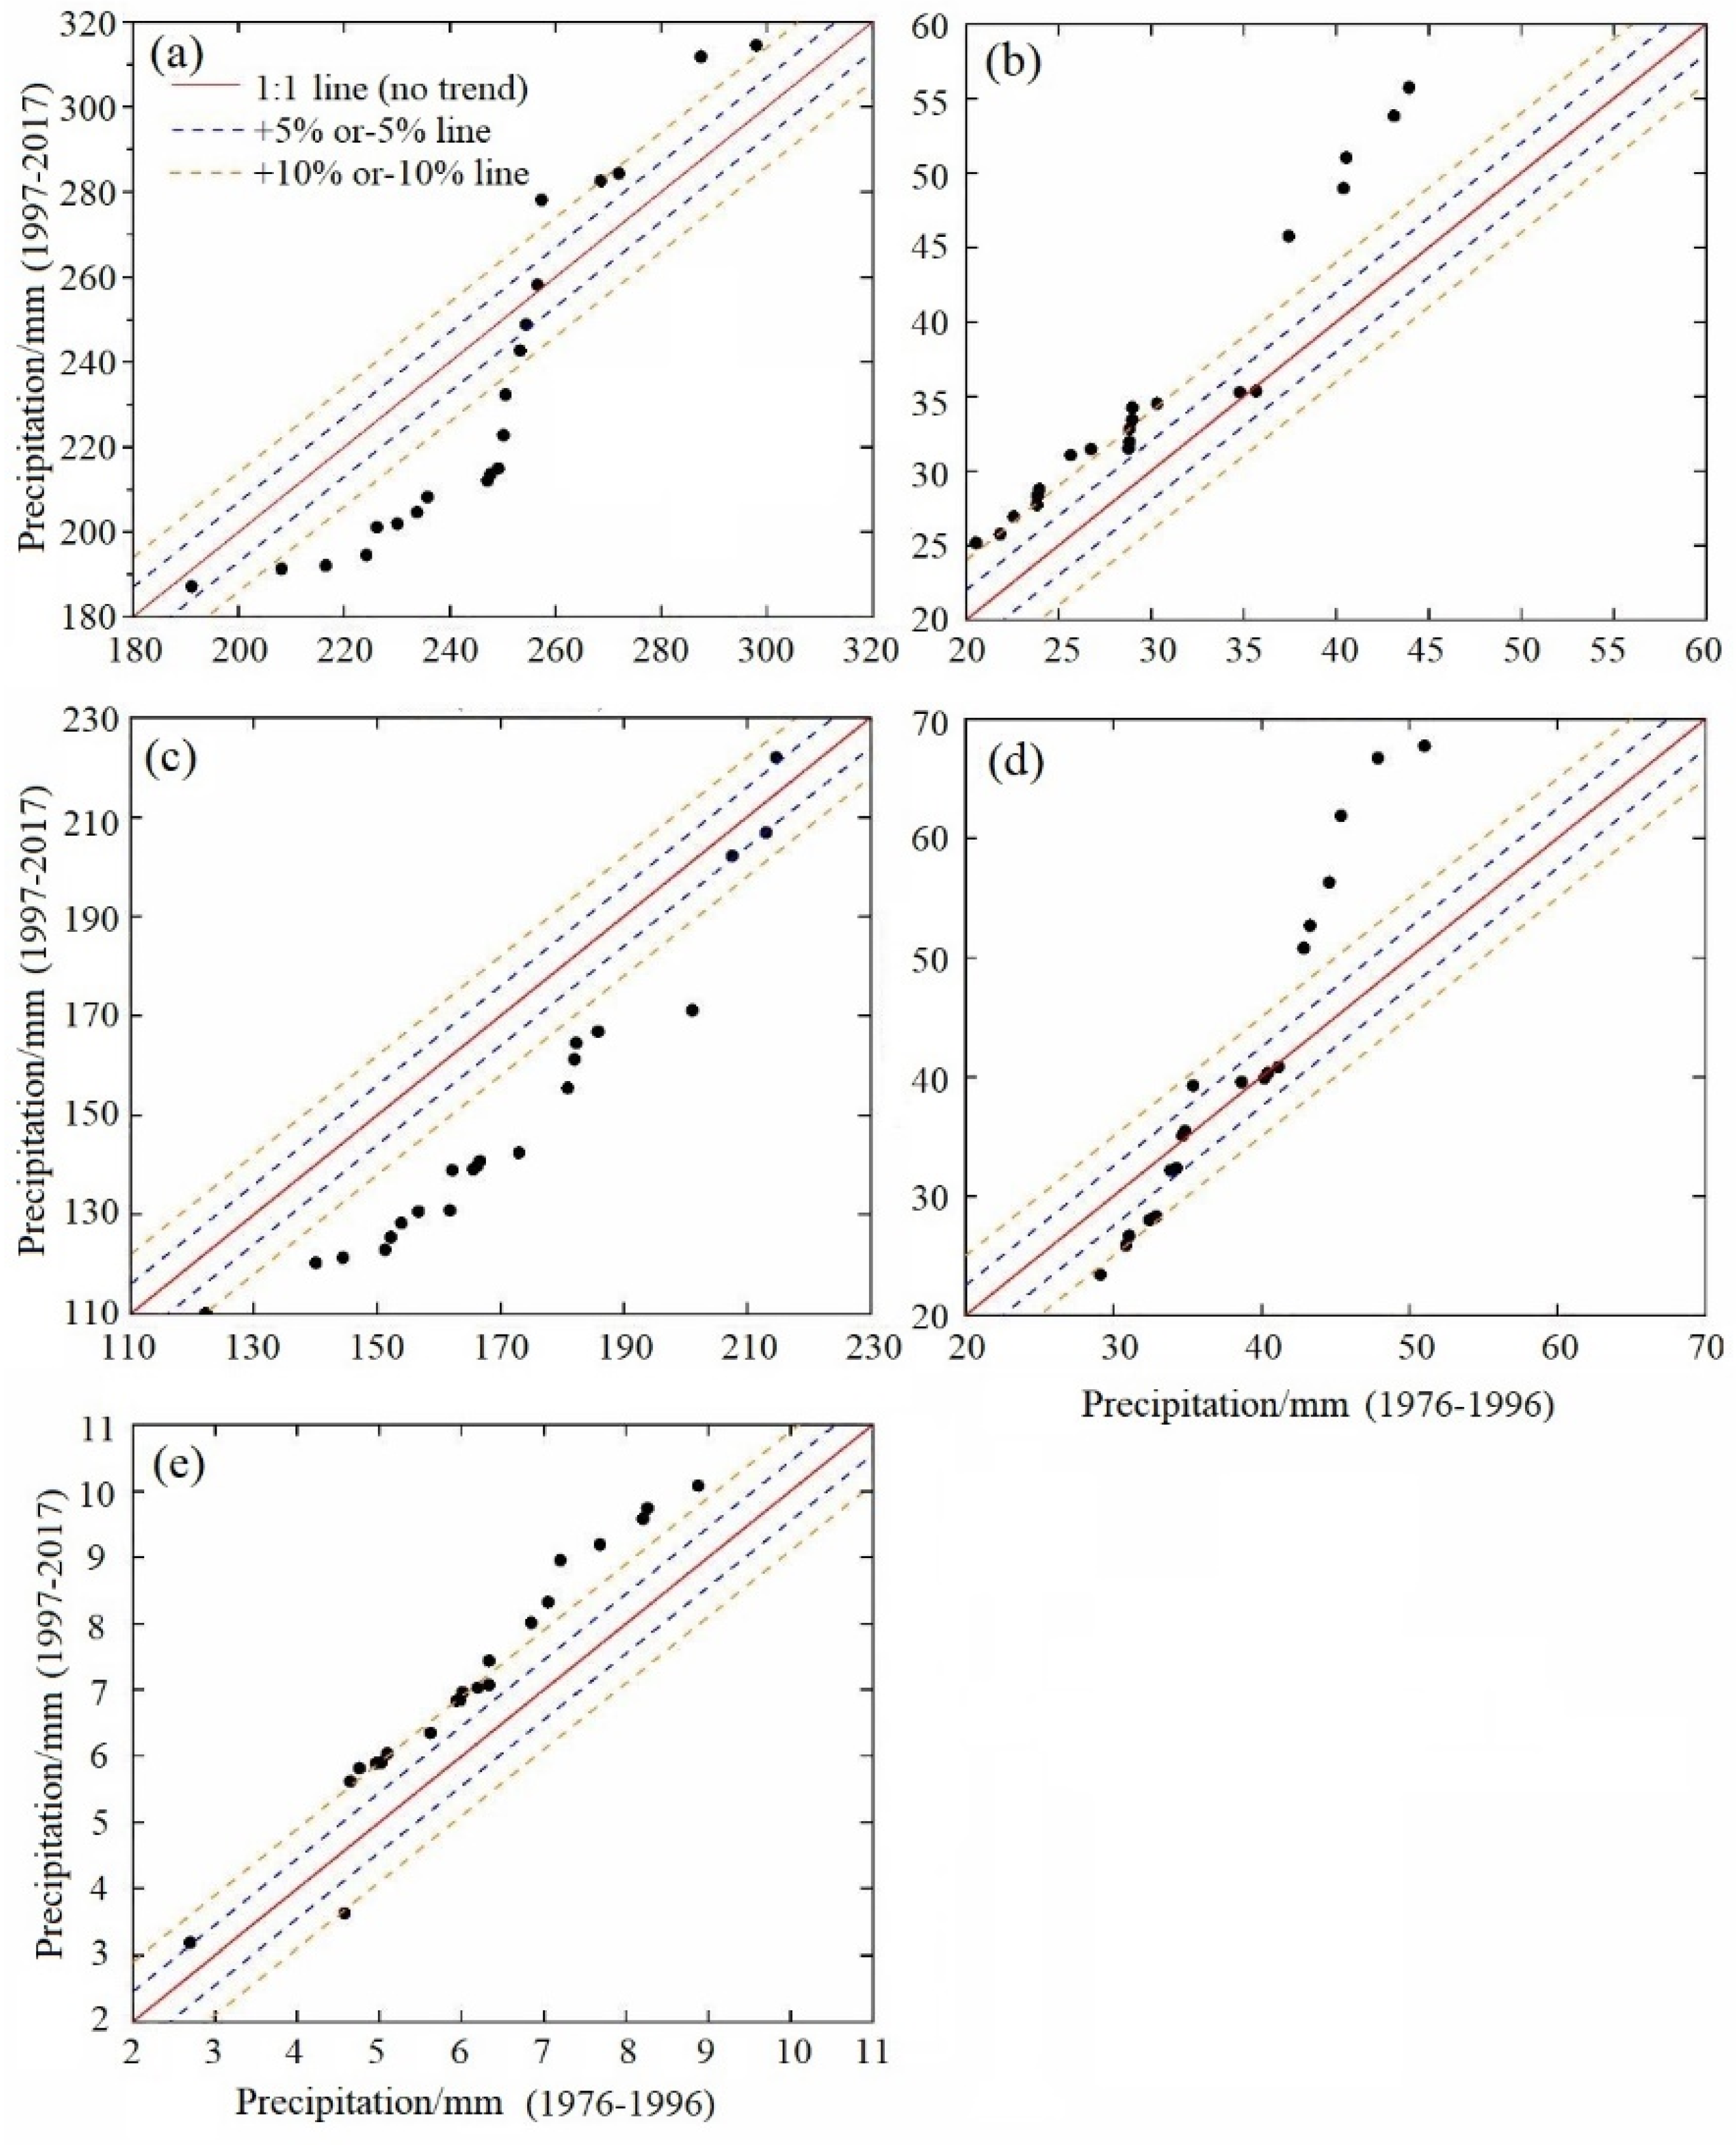
2.3.2. Innovative Trend Analysis

The innovative trend analysis divides a time series into two equal parts (xi and yi), and it sorts both sub-series in ascending order. If the xi and yi are equal, which indicates that it is not trend, the points in the scatter plot are collected on the 1:1 (45°) line. If the points fall above the line, it has been considered the time series exhibits an increasing trend. Otherwise, it shows a downward trend [61]. As the detection of change is based on the first subseries, the trend indicator is derived from the average difference divided by the average of the first sub-series. Then, the innovative trend analysis indicator is expressed as follows [62]:
D = 1 n i = 1 n 10 ( y i - x i ) x ¯
where D is the trend indicator, and a positive value indicates an upward trend, otherwise, it is a downward trend; n is the number of observations in each sub-series and x is the average of the first subseries. It is widely used in precipitation changes.

2.3.3. Mann–Kendall (MK) Test

MK test is a non-parametric statistical test [63,64]. A time series x with n sample construct a sequence:
S k = i = 1 k r i , r i = 1 , x i > x j 0 , x i x j ,   j = 1 , 2 i ;   k = 2 , 3 n
UF K = [ S k - E ( S k ) ] Var ( S k )   ( k = 1 , 2 n )
where UF1 = 0, E(Sk), Var(Sk) are the average and variance of the Sk, they can be calculated by the following formula:
E S K = n n - 1 4
Var S K = n ( n - 1 )   ( 2 n + 5 ) / 72
Given the significance level α, if |UFi|>Uα, then indicates that the sequence has an obvious trend change. According to the time series x in reverse order xn, xn−1 ... x1, and make UBk = UFk, k = n, n 1 ... 1, UB = 0.
If the intersection points of UFk and UBk curves are between the critical lines, then this moment is the time when the mutation occurs [65].

2.3.4. Inspection Methods

Because it is difficult to evaluate the accuracy of spatial interpolation, the crossover method is usually used to verify it. In this paper, mean absolute error (MAE) and root of mean square error (RMSE) are used to reflect the spatial interpolation ability of IDW and Kriging interpolation. Smaller MAE and RMSE values indicate better interpolation results; otherwise, the interpolation results are worse. The calculation formula is:
MAE = 1 n i = 1 n ( O i - E i )
RMSE = i = 1 n ( O i - E i ) 2 n
Oi represents the measured precipitation; Ei represents the predicted precipitation; n indicates the number of stations used for checking.
In addition, the univariate linear regression was used to analyze the variation trends of precipitation. The IDW model interpolates the stations to analyze the spatial distribution of precipitation.

3. Results

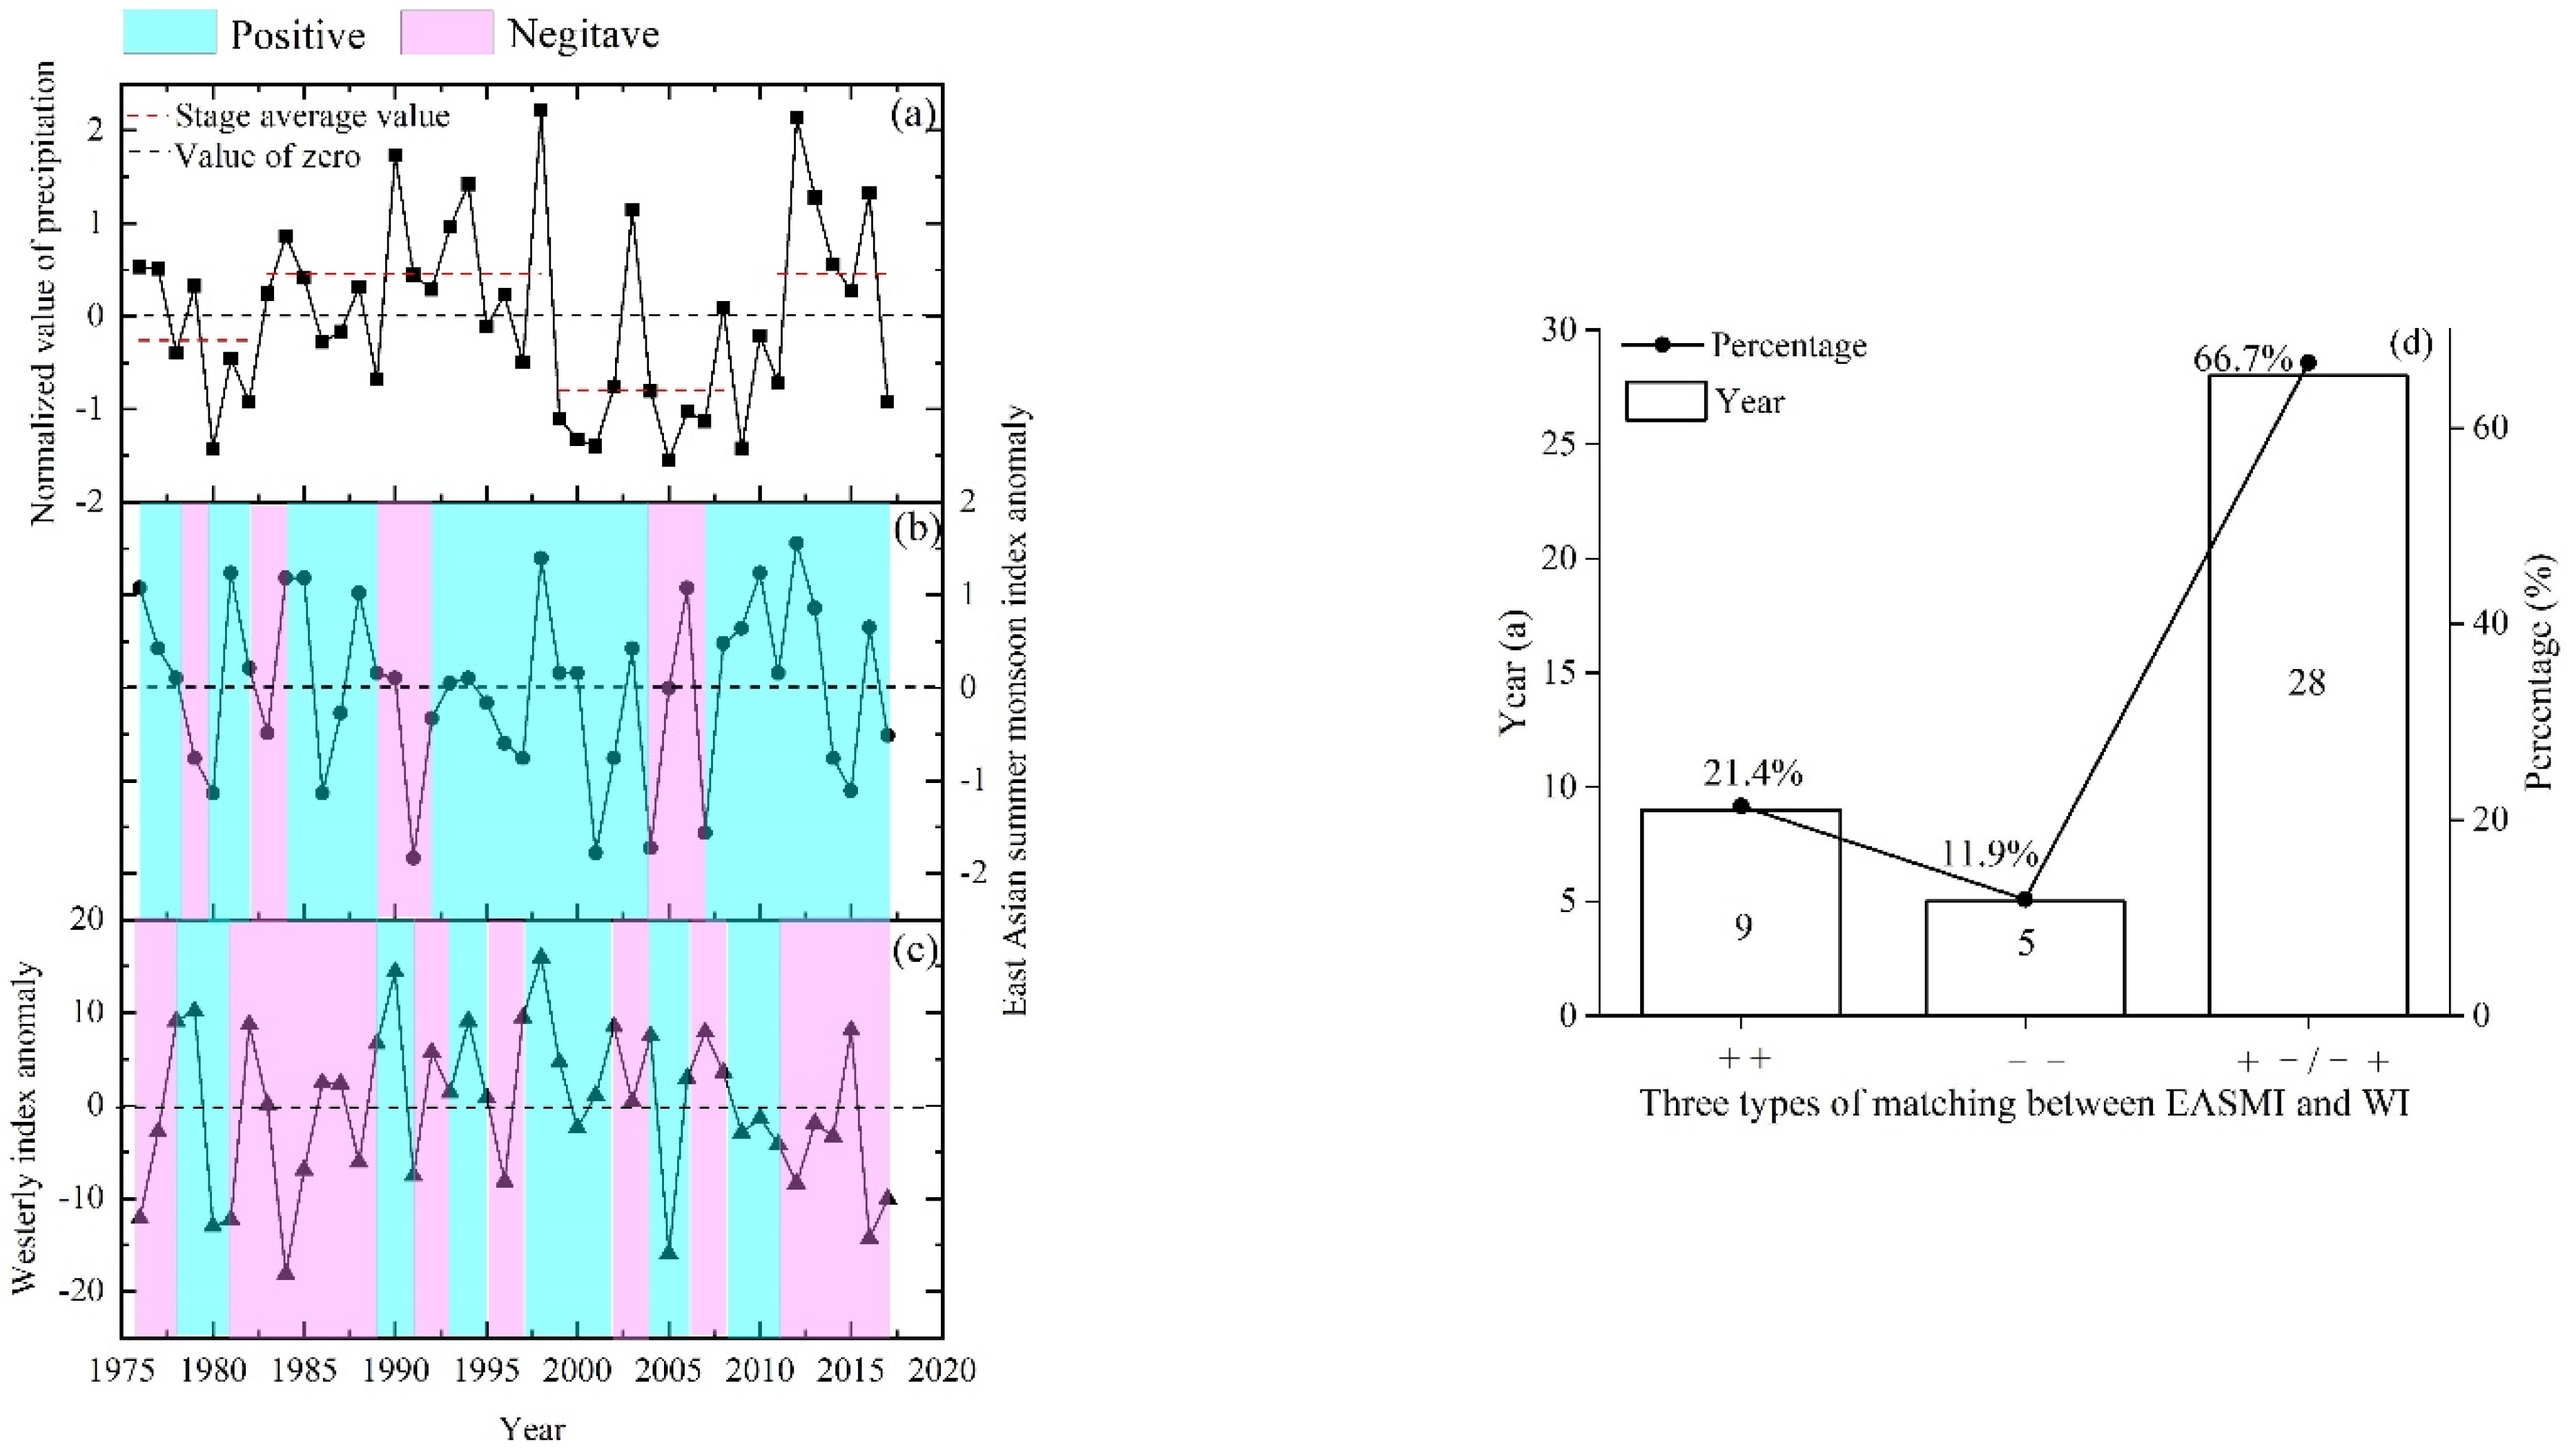
3.1. Interannual Variability of Precipitation

On a regional scale, based on the records of all meteorological stations on the MP during 1976–2017, the annual average precipitation is 239.4 mm by calculating, and the maximum and minimum values are 314.5 (1998) and 187.2 mm (2005), respectively (Table 1), and the difference of extreme values reaches 40.5%. The standard deviation (SD) and coefficient of variation (CV) are 33.4 mm and 14%, respectively, indicating that there is a major interannual fluctuation and uneven temporal distribution. The abrupt change years are identified according to the Mann–Kendall test (Figure S1), there are obvious four stages of 1976–1982, 1983–1998, 1999–2010, and 2011–2017 (Table S4), and their average precipitation are 230.6, 255.1, 212.6, and 258.4 mm, respectively. The changing rate is −0.6 mm/decade (Figure 2a). In Figure 3a, 71.4% of the points are located in the lower triangle area of the 45°line, further indicating that the precipitation has a slightly downward trend.
On a seasonal scale, the average precipitation in spring, summer, autumn, and winter are 33.1, 160.1, 39.3, and 6.6 mm, respectively (Table 1). The largest and smallest CV are 26.6% (autumn) and 18.1% (summer), respectively, and the maximum and minimum SD are 28.9 mm (summer) and 1.7 mm (winter), respectively, indicating that the precipitation fluctuation in summer is the largest. The changing rates are 1.6, −5.3, 2.6, and 0.4 mm/decade, respectively (Figure 2b–e), and their proportion to annual precipitation are 14%, 66.7%, 16.2%, and 3.1%, respectively (Figure 2f). The proportion of summer precipitation is the largest and experiences a decreasing process (Figure 3c), especially there is an obvious downward trend after the abrupt change in 1998 (Figure 2c). However, spring, autumn and winter precipitation all show a significant increasing trend (Figure 3b,d,e). The decrease in summer precipitation leads to the precipitation, showing a slightly downward trend at the regional scale.

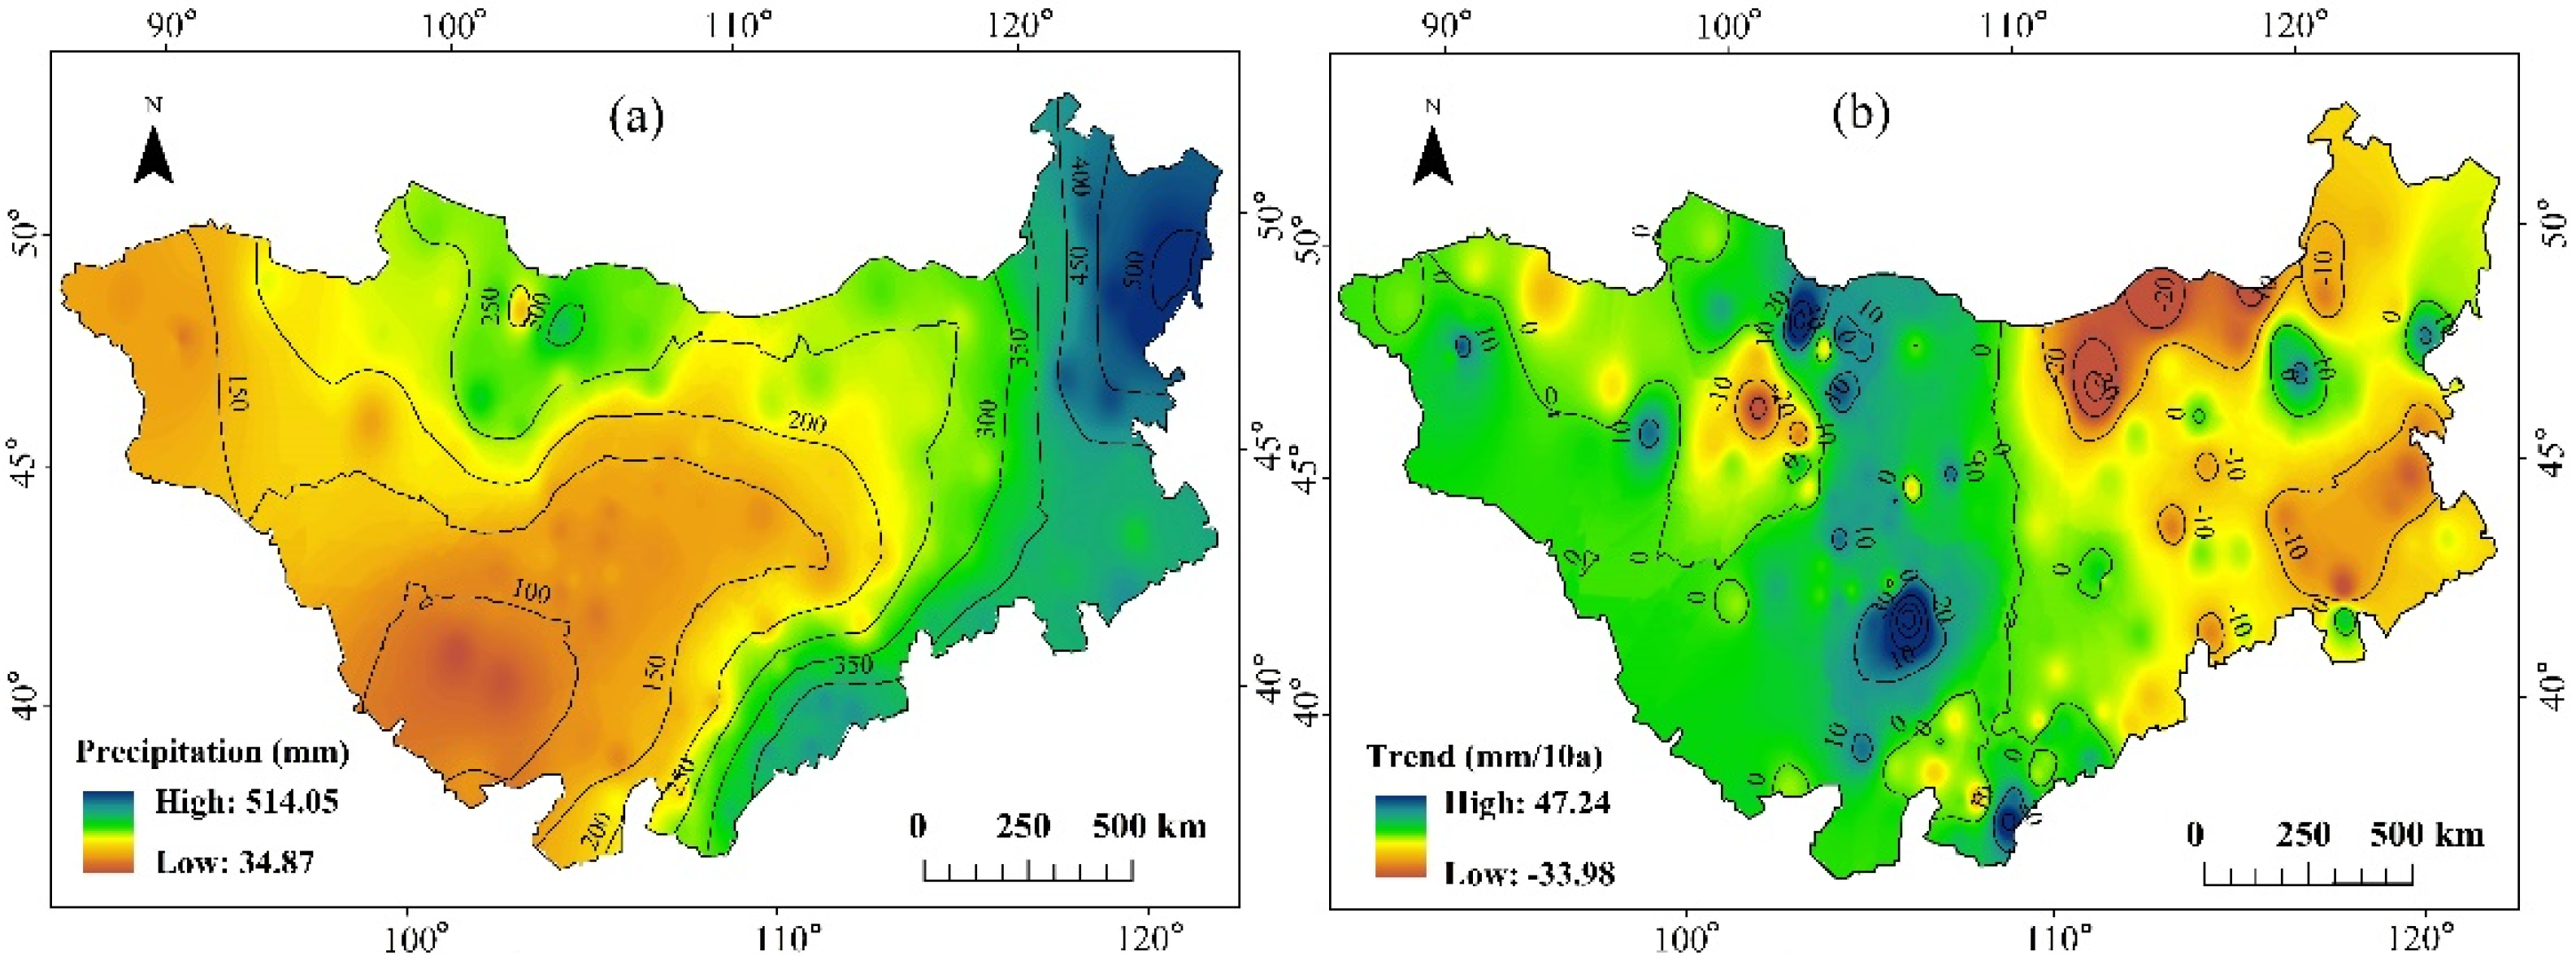
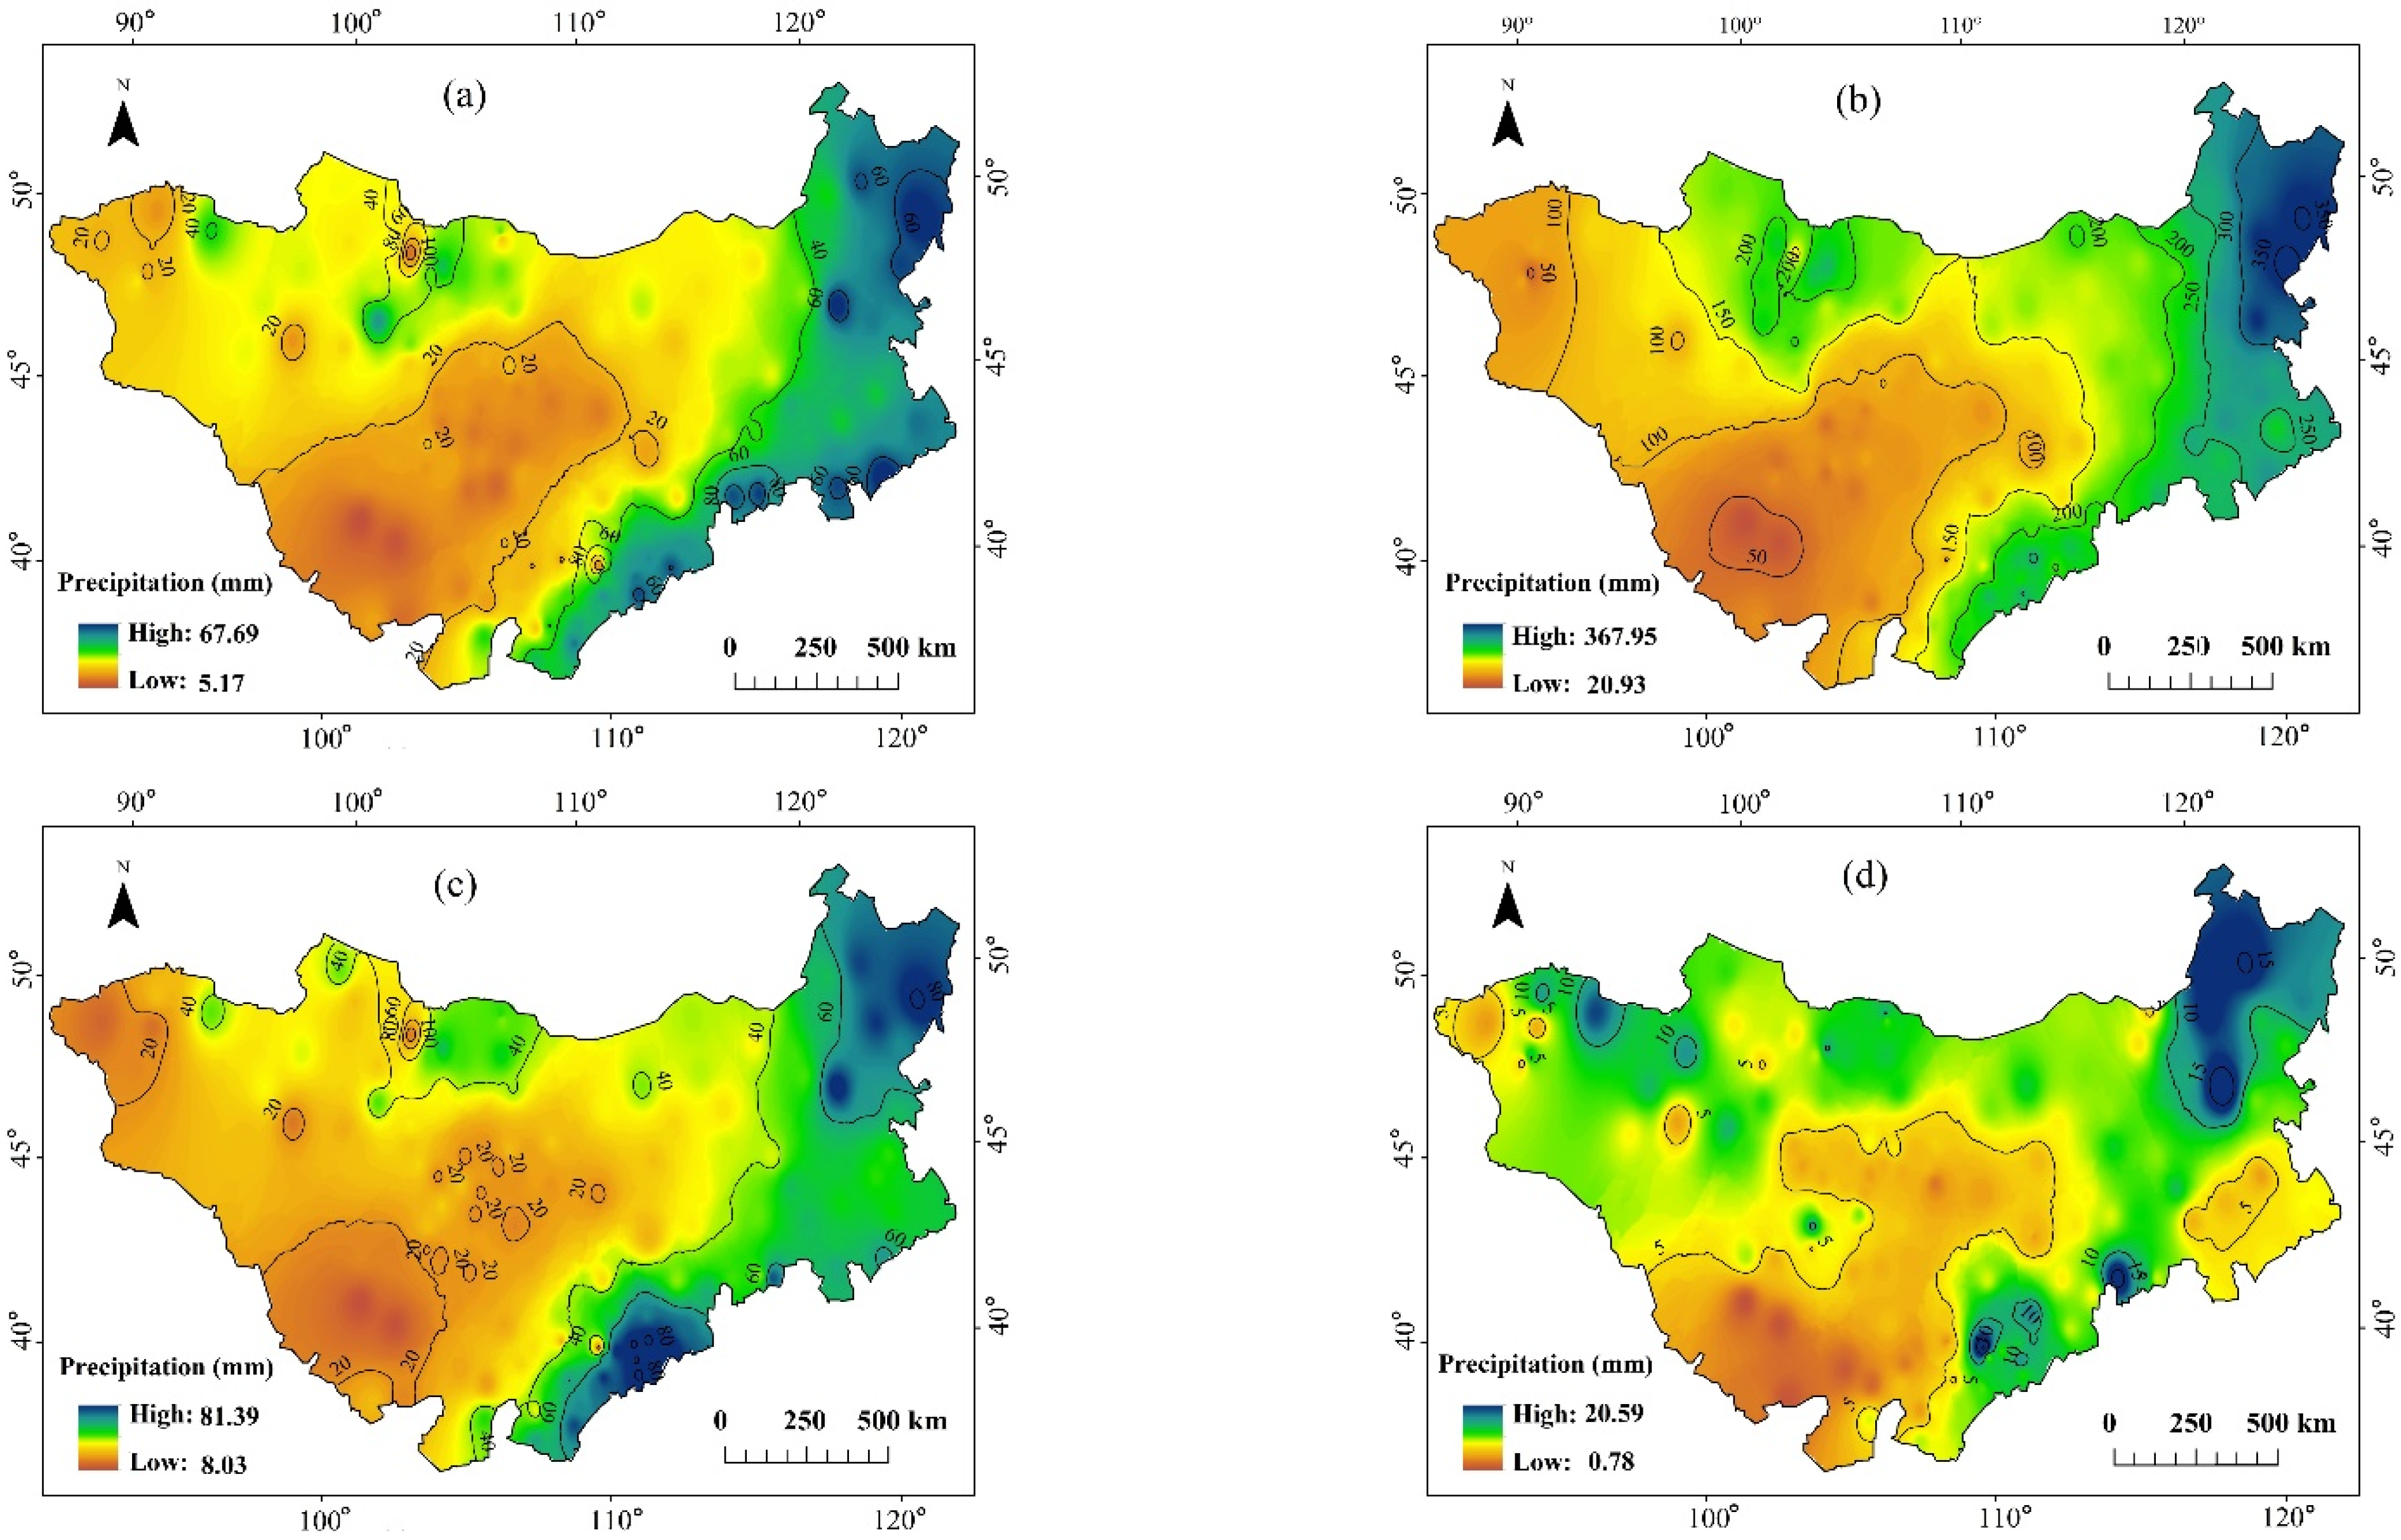
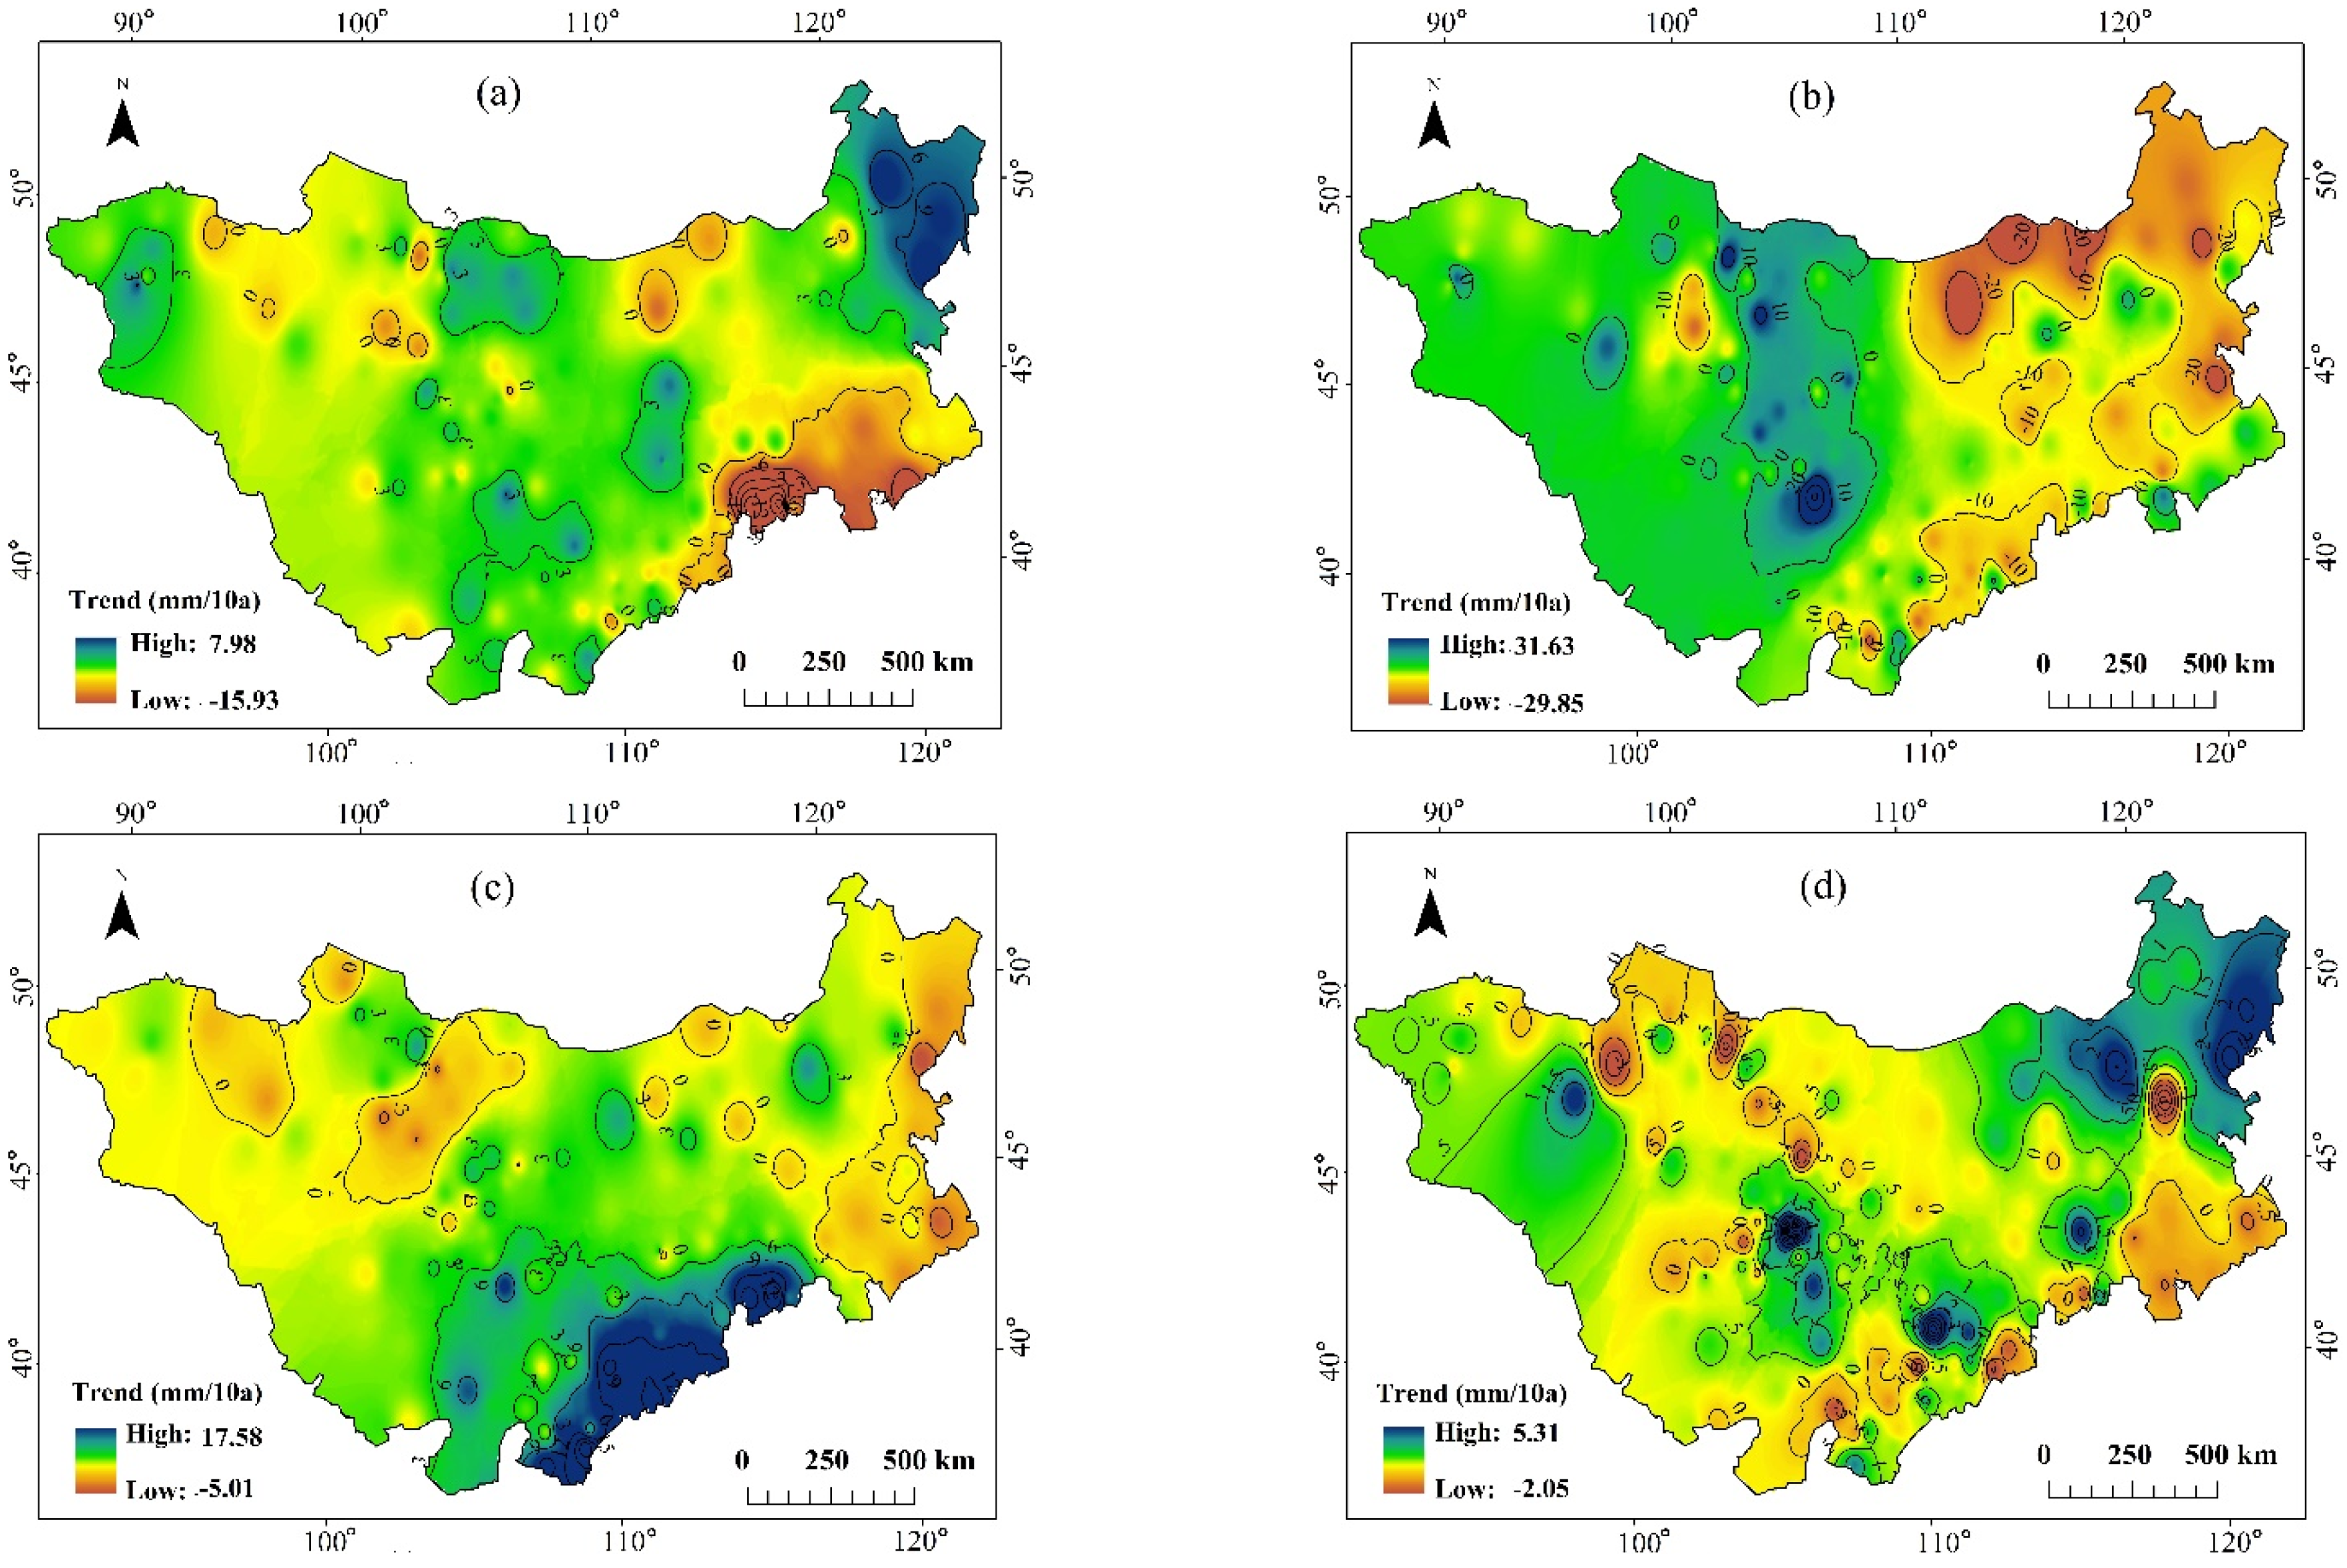
3.2. Spatial Distribution of Precipitation

The annual average precipitation gradually declines from northeast to southwest (Figure 4a). Spatial distribution is uneven, and precipitation can reach about 500 mm in eastern MP such as Greater Khingan Mountains, while it does not exceed 150 mm in western Inner Mongolia and the Gobi regions of southern Mongolia such as Tengger, Ulan Buh, and Badain Jaran desert. However, the change rate of precipitation showed a positive trend in the west and a negative in the east (Figure 4b). Although 41% of the stations showed a stable change trend in central MP, it appeared obviously dry and wet in semi-wet and semi-arid regions, respectively. Stations with a positive trend accounted for 29% (Table S5), among them, 4% of the stations increased significantly in western Inner Mongolia. However, stations with the negative trend accounted for 30%, and it dropped significantly in eastern MP (p < 0.05) (Figure 4b). It seems to appear a pattern of “wet gets dry” in the east and “dry gets wet” in the west.
The spatial distribution of seasonal precipitation is consistent with that of annual precipitation (Figure 5a–d). Stations with positive trend accounted for 64%, 55%, and 56% in spring, autumn, and winter, respectively, of which 17%, 19%, and 23% are significant (p < 0.05), while only 5%, 7% and 13% showed a negative trend, respectively (Table S5). However, stations with negative trend accounted for 54% in summer, and only 13% of stations showed a positive trend (Figure 6b).
In summary, there is only a positive trend of 10.7% and a negative of 25.3% in semi-arid (200–400 mm) and semi-wet areas (400–600 mm), respectively. However, the dry (100–200 mm) and extremely dry areas (≤100 mm) appear 19.2% positive and 4% negative, respectively (Table S6).

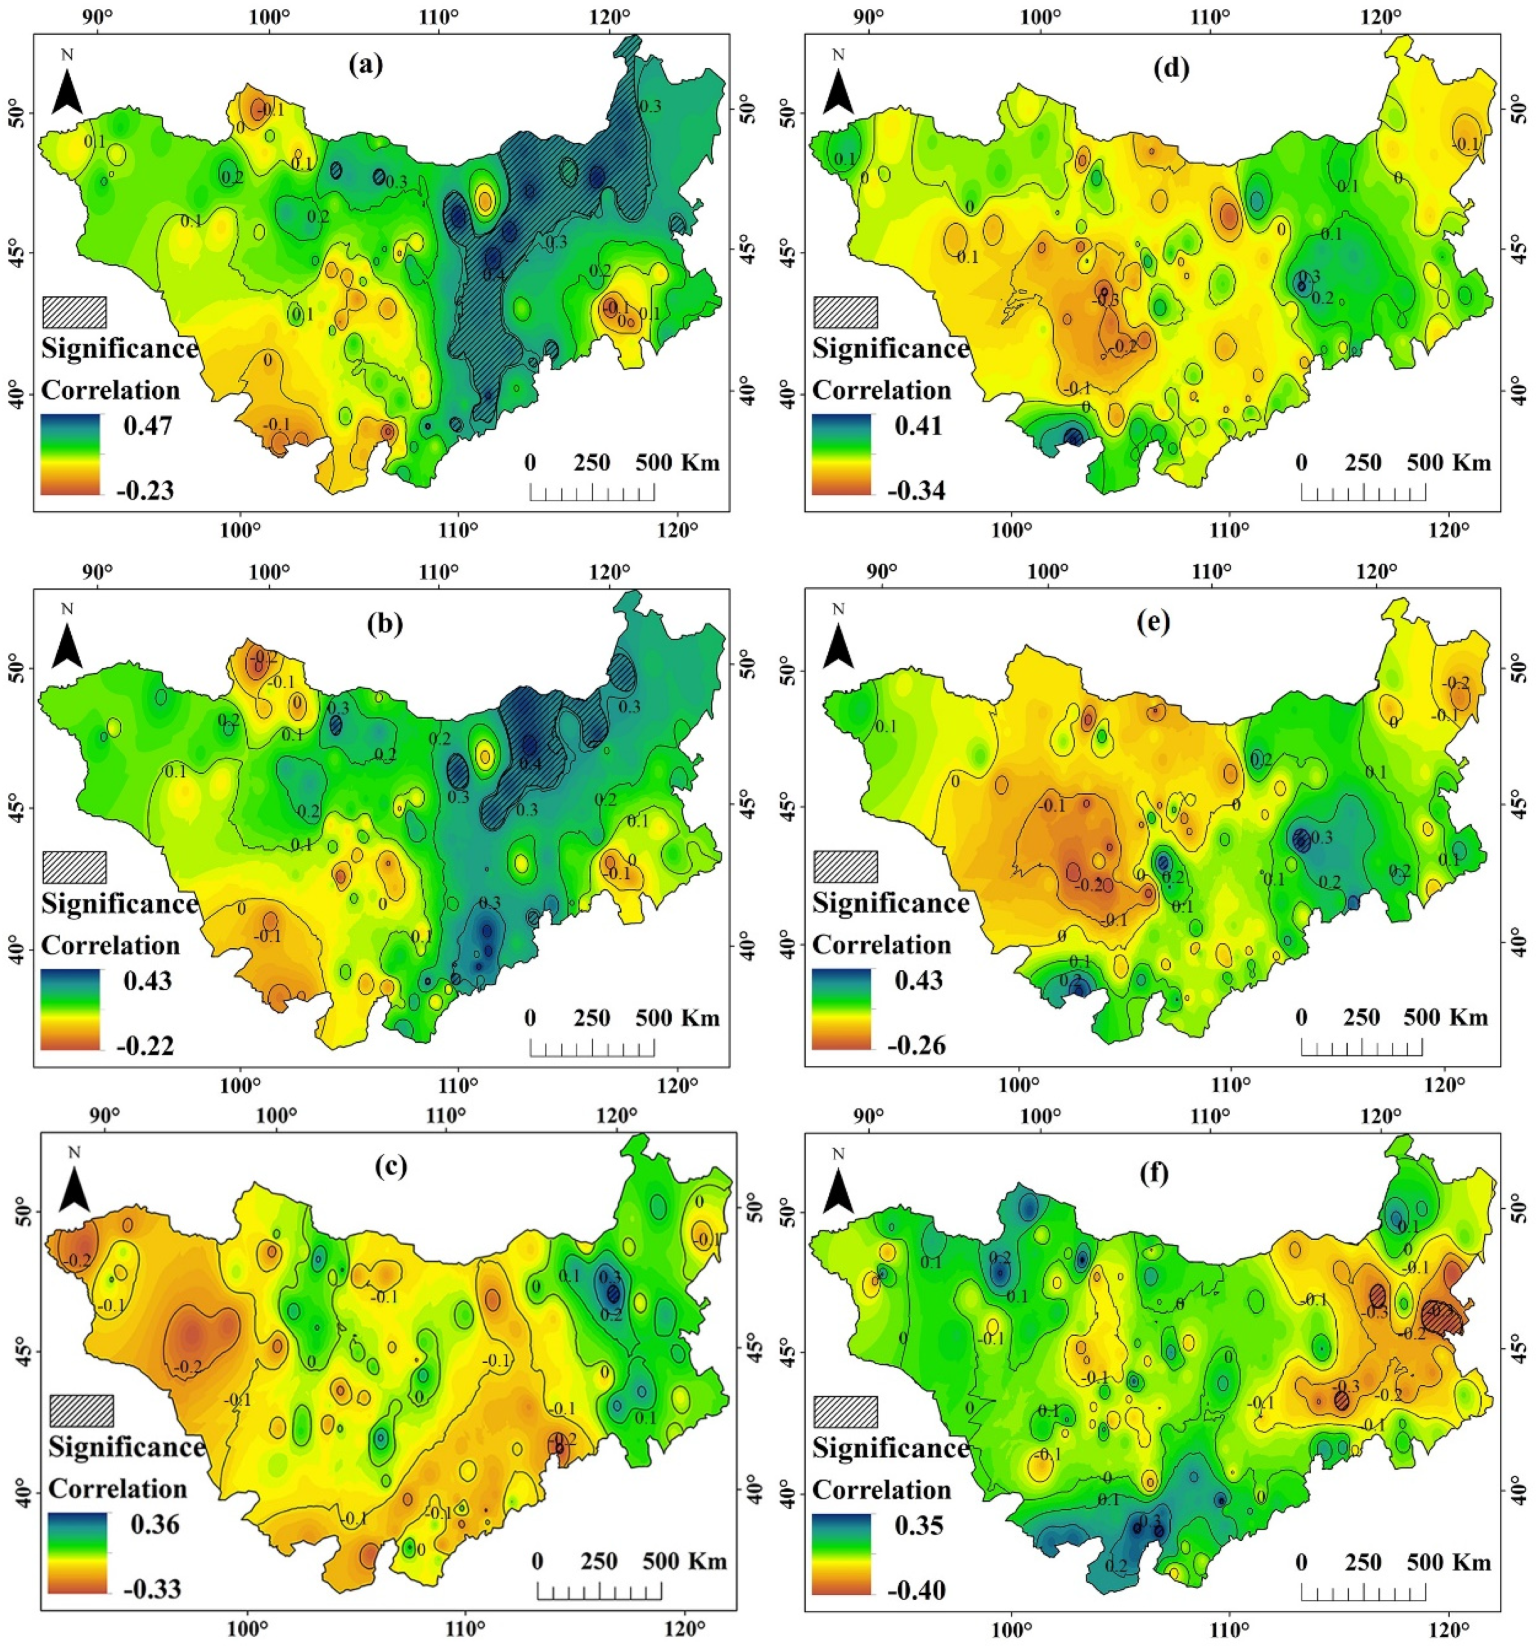
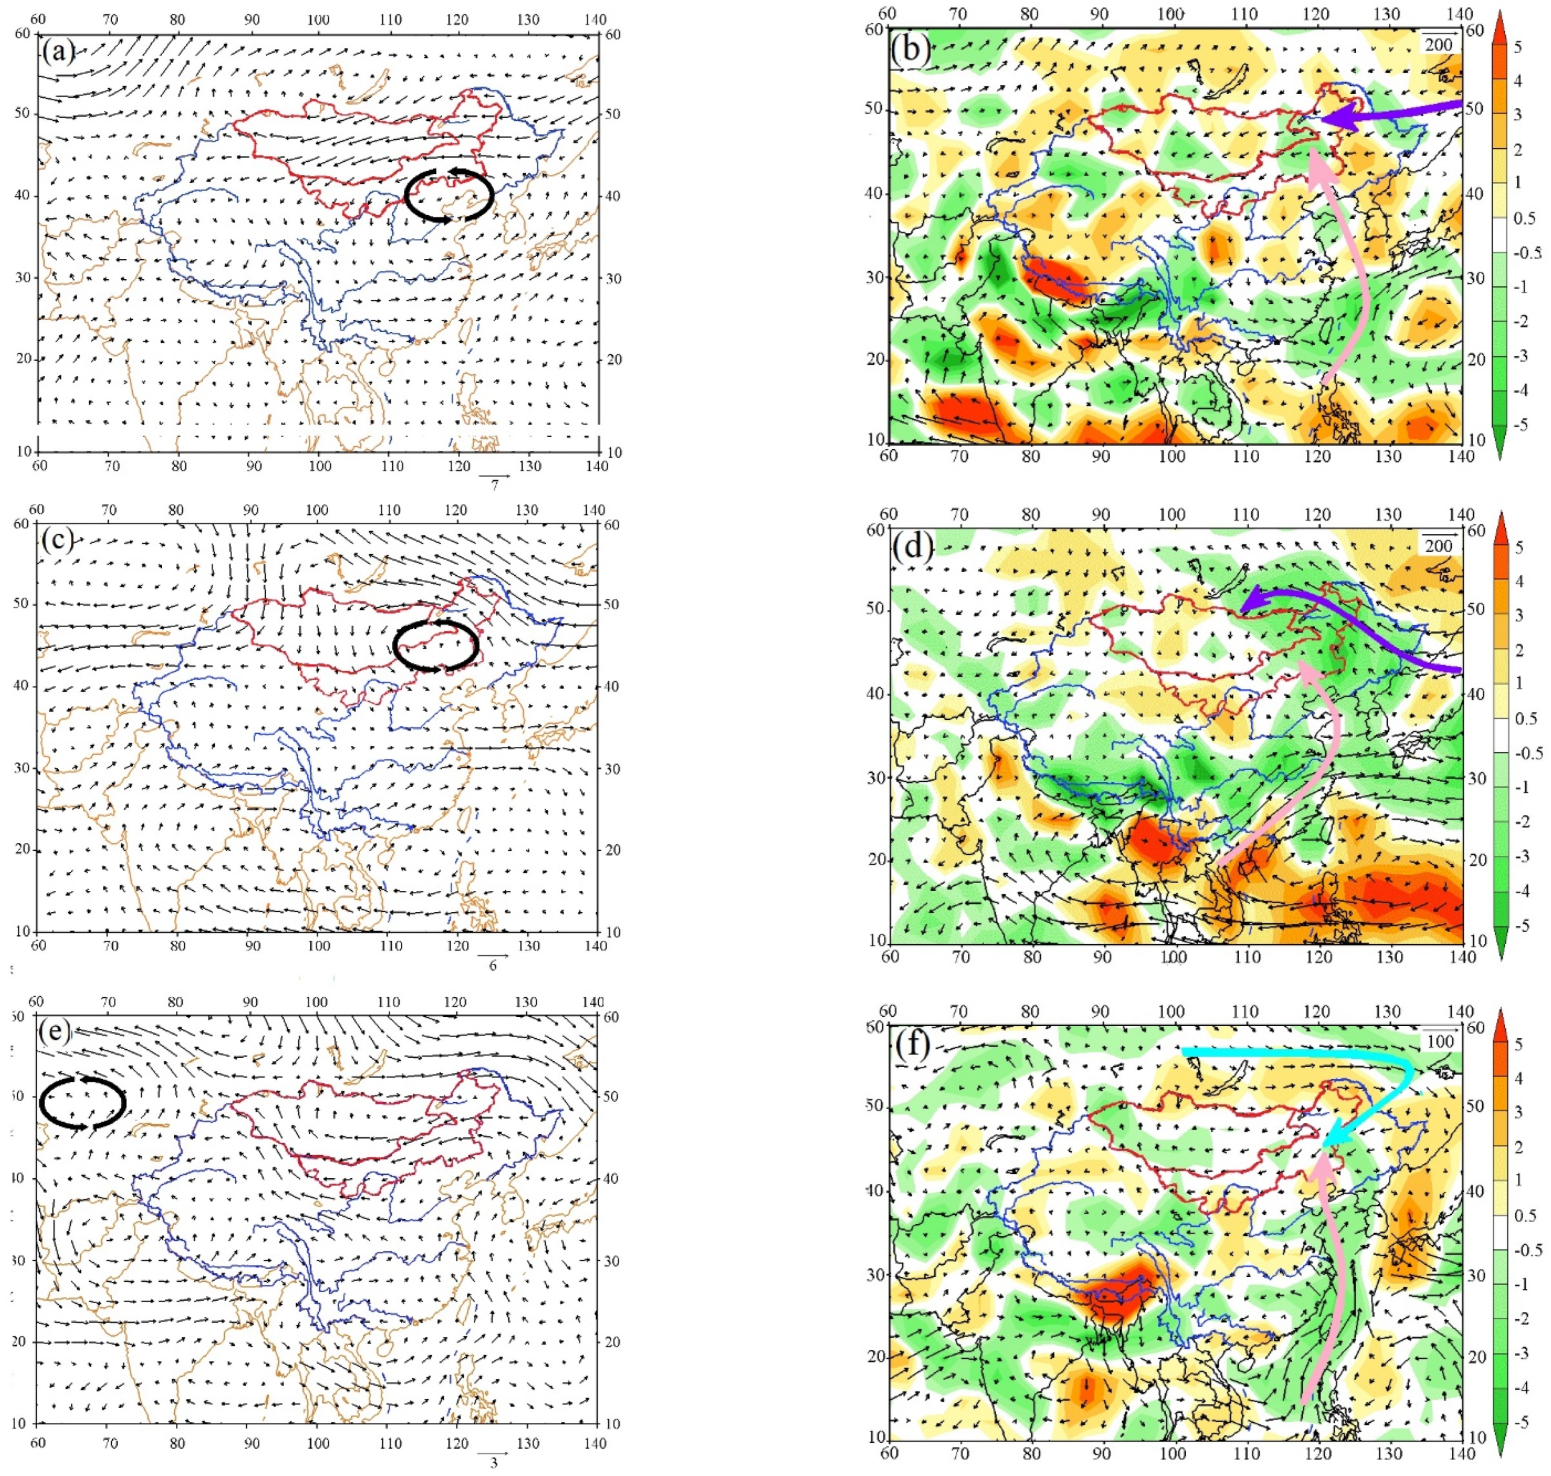
3.3. The Correlation between Precipitation and Atmospheric Circulation Factors

Precipitation is affected by multiple atmospheric circulation factors (Table S7), particularly by the EASM and westerly circulation system, and the NAO may change the westerly circulation which affect climate change in arid areas [66,67].
When the EASMI is large (small), the precipitation is relatively more (less), and its positive relationship is significant in a part of semi-arid area (Figure 7a). On the interannual scale, the corresponding relationship between annual average precipitation and EASMI well synchronized over almost all of MP during 1983–1998 and 2011–2017 (Figure 8a,b). However, the negative correlation area appears in the southwest extremely dry area. In summer, most of the regions are positively correlated, of which the significantly relevant areas are mainly distributed in the east, the correlation coefficient can reach 0.43 (Figure 7b), except for the Horqin Sandy Land in the east and the extremely dry areas in the southwest. In winter, the EASM declines, so it has little positive correlation with precipitation (Figure 7c). There is no detailed analysis in spring and autumn (Figure S2).
The annual precipitation and WI show a positive correlation relationship of 0.21–0.41, except for part of the central and eastern and the extremely dry region in south MP, while the rest of the region is negatively correlated with −0.26–−0.34 (Figure 7d) during 1983–1998 and 2011–2017 (Figure 8a,c). In summer, the negative correlation is −0.26 in the west (Figure 7e). However, the correlation was positive in most areas except for the eastern MP (Figure 7f), indicating that as the EASM retreated southward, westerly gradually dominated the western part of the MP.
At a long time scale, the EASMI and WI show a characteristic of opposite change (Figure 8b,c). That is, when the EASMI is increasing, the WI is decreasing in MP. In total, 28 years (66.7% of the total records) showed opposite signs. The positive and negative anomaly of EASMI and WI are only 21.4% and 11.9%, respectively (Figure 8d). It also shows an obvious characteristic of a seesaw.

4. Discussion

The EASM and westerly circulations are two extremely important wind air systems, which are closely related and jointly affect the regional precipitation and climate environment changes in the middle latitudes in the Northern Hemisphere [36,68,69].
In the spatiotemporal scale, 2015, 1998, and 2005 are selected as ordinary, abundant and less precipitation years to analyze the spatiotemporal variation mechanism. In ordinary year, the cyclone center appeared in the southeastern margin of the MP (Figure 9a), the overall intensity of the WPSH was strong, and the ridge position was westward. The gradual strengthening of the EASM, moisture from the westerly circulation is not easy to develop eastward, resulting in the weakening of the westerly circulation. However, the inconsistent location of the Mongolian–Siberian High during different degrees of movement of WPSH events may lead to weakened divergence, which results in a weakly defined anticyclone over the MP. Moisture from the Pacific Ocean is mainly transported along the eastern side of the China and reaches the Yangtze River basin and its southern regions, while the water vapor transportation from north to Northeast China is weak (Figure 9b), resulting in insignificant precipitation variation over the MP. At this time, the correlation between precipitation and the EASMI is positive with 0.63 in most areas except for the northeast (Figure S3a), while the negative correlation between precipitation and the WI is −0.63 in western MP (Figure S3b), which further indicates that the seesaw relationship between the EASM and westerly is marked by precipitation in MP [32,36,70].
In 1998, the middle latitude atmospheric circulation formed an anomalous cyclone covering the North China (Figure 9c), and appeared a strong convergence center in the eastern Inner Mongolia. At the same time, it formed an anomalous anticyclone in the Indian and Pacific oceans, and the anticyclonic divergence of water vapor was transported through the warm airflow from the Indian and Pacific Ocean to North China (Figure 9d). As a result, the rising water vapor is strengthened and the WPSH is gradually extended westward and northward. The EASM gradually interacts with the westerly circulation through the WPSH. The airflow strengthens the low-level anticyclone and is not conducive to the development of westerly circulation. In the plateau scale, precipitation and EASM were significantly positively correlated to distribution mainly in the east (p < 0.05), and the negative correlation appeared in the desert area of the southwest (Figure S3c). However, there was a positive correlation with westerly in the southeast and a negative correlation in the north (Figure S3d). This indicates that when the EASM breaks out, the upper-level westerly weakens, and MP is mainly controlled by the EASM [32,33,47,57]. As a result, it is conducive to the northward transport of water vapor and the northward shift of the rain belt, which increases the precipitation in the eastern part of MP [33,71].
On the contrary, the center of the cyclone gradually moved westward over Central Asia and left the MP in a drought year in 2005 (Figure 9e), resulting in water vapor in the Indian and Pacific Ocean far away from the cyclone (Figure 9f). The position of the WPSH continues to decline abnormally southward and westward, and strengthen the ridge of high pressure and the divergence, together with enhanced anticyclonic activity over the MP. Precipitation and EASM showed a positive correlation only in the northwest and northeast, but a negative correlation in Horqin Sandy Land and western desert regions (Figure S3e). However, it is negatively correlated with westerly in the west and south, and positively correlated in the northwest (Figure S3f). This is a sign of the weakening of the EASM and slight strengthening of westerly circulation. The westerly circulation gradually developed eastward, and the precipitation was slightly increased in the western Gobi Desert area, showing a sign of dry to wet. The southward retreat of EASM could lead to reducing water vapor transport into inland regions, causing the rainfall deficit. There is an obvious drying trend in the central and eastern parts of the MP, especially in the Horqin Sandy Land, which also has the trend of wet to dry. During the same period, the rate of aridification accelerated in Northern China [69,72], the summer precipitation was significantly reduced in the semi-arid areas, and the arid and semi-arid areas expanded, and its boundary tended to move west and north [73,74,75,76].
Although the location of cyclones varies in different periods, the precipitation differences are greatly due to the influence of the outbreak time, intensity, and path of EASM [77,78]. The East Asian Winter monsoon (EAWM) inevitably affects the precipitation through water vapor from the Mongolian–Siberian High and western Pacific Ocean [24,79]. However, the winter precipitation accounts for only 3% of the annual precipitation, the EAWM has far less impact on precipitation than EASM in Mongolia. Therefore, the EASM is the most critical factor for the summer precipitation in MP.
In addition to atmospheric circulation, topographical factors (slope, aspect, elevation) are also the most important factors affecting the distribution of precipitation in the Eurasia hinterland [34,40,76]. The eastern and western parts have high mountains, and the reasons for the precipitation in the eastern and western parts of the plateau are different. The piedmont can lift the airflow to form orographic rain, and the foehn is formed due to the sinking of the mountain airflow on the leeward slope [80]. For example, the existence of the terrain of the Greater Khingan Mountains increases the summer precipitation from the east to the Songnen Plain by 1.09 mm/day and reduces the summer precipitation in the eastern Mongolia to the west by 0.69 mm/day based on a regional numerical model [9,81]. In addition, the Altai Mountains also have a significant impact on the westerly system [82]. The existence of highland terrain will cause the westerly airflow to circulate when passing through the terrain, which plays an important role in the formation of vortices [83]. Even if the western part is affected by the westerly wind, the amount of precipitation is still relatively small in the Altai Mountains [34], so the local topography plays an important role in the formation of regional climate.

5. Conclusions

This study tries to analysis the spatiotemporal patterns of the annual and seasonal average precipitation over MP and compares atmospheric circulation factors with the precipitation variations.
(1) The annual average precipitation has a slightly decreasing trend in the MP during 1976–2017, particularly, the summer precipitation decreased significantly at a rate of 5.3 mm/decade. The global warming significantly affects the change in precipitation patterns, it will further cause water resources shortage and aggravate the contradiction between supply and demand.
(2) Specifically, the change rate of annual average precipitation has a significant negative trend in the semi-wet and semi-arid area, while positive trend appears in arid and extreme arid area, showing a pattern of wet gets dry in the east and dry gets wet in the west. However, the precipitation is increased with the rate of only 0.22–3.4 mm/decade in the arid region, which was not enough to prove the characteristics of wetter.
(3) The EASM and westerly basically show the characteristics of seesaw changes in parts of the MP, the EASM weakened and the westerly circulation slightly increased, weakening water vapor transport leads to a slightly decrease in precipitation in MP. Precipitation pattern change is the result of a comprehensive configuration of multiple influencing factors. It is not only influenced by atmospheric circulation, but also by human activities such as land use/cover, urbanization, and regional factors. The driving factors are very complex and therefore require further research.

Supplementary Materials

The following supporting information can be downloaded at: https://www.mdpi.com/article/10.3390/atmos13122132/s1, Table S1: Altitude statistics of Mongolian Plateau stations, Table S2 The forecasted annual average precipitation using different interpolation methods during 1976-2017, Table S3 The interpolation analysis of the mean annual precipitation during 1976-2017, Table S4 Annual precipitation in different stages and its correlation with EASMI and WI, Table S5 Precipitation change rate at 135 stations during 1976-2017 in the Mongolian Plateau, Table S6 Precipitation change rate at 135 stations during 1976-2017 in the Mongolian Plateau, Table S7. Analysis of Partial between precipitation and atmospheric circulation factors during 1976–2017 in the Mongolian Plateau., Figure S1. MK test of precipitation in Mongolian Plateau during 1976 to 2017 ((a) Annual, (b) Spring, (c) Summer, (d) Autumn, (e) Winter). Figure S2. The spatial distribution of the correlation between precipitation and East Asian Summer Monsoon Index ((a) Spring, (c) Autumn), the correlation between precipitation and Westerly Index ((b) Spring, (d) Autumn) (Shaded indicates p < 0.05)., Figure S3. The spatial distribution of the correlation between precipitation and East Asian Summer Monsoon Index ((a) 2015, (c)1998, (e) 2005), the correlation between precipitation and Westerly Index ((b) 2015, (d) 1998, (f) 2005) (Shaded indicates p < 0.05).

Author Contributions

Conceptualization, Y.X.; methodology, Y.X.; software, Y.X. and H.L.; validation, D.D., H.L., Z.W., and H.Z.; writing—original draft preparation, Y.X. All authors have read and agreed to the published version of the manuscript.

Funding

This research was supported by the Graduate students’ research & Innovation fund of Inner Mongolia Normal University (CXJJS20117).

Institutional Review Board Statement

Not applicable.

Informed Consent Statement

Not applicable.

Data Availability Statement

Data available on request due to restrictions, privacy or ethical. Data presented in this study are available on request from the corresponding author. The data are not publicly available due to its confidentiality of measured data.

Conflicts of Interest

The authors declare no conflict of interest.

References

  1. Doblas–Reyes, F.J.; Srensson, A.A.; Almazroui, M.; Dosio, A.; Zou, Z. IPCC AR6 WGI Chapter 10: Linking global to regional climate change. In Climate Change 2021: The Physical Science Basis. Contribution of Working Group I to the Sixth Assessment Report of the Intergovernmental Panel on Climate Change; Masson–Delmotte, V., Zhai, P., Pirani, A., Connors, S., Péan, C., Berger, S., Caud, N., Chen, Y., Goldfarb, L., Gomis, M., et al., Eds.; Cambridge University Press: Cambridge, UK, 2021. [Google Scholar]
  2. Pal, M.; Patwardhan, S.; Pandey, S.; Panigrahi, P.K. On the role of natural multidecadal oscillations on global warming and its hiatus. Financ. Anal. Econophys. 2021, 1–13. [Google Scholar] [CrossRef]
  3. Wang, X.X.; Jiang, D.B.; Lang, X.M. Future extreme climate changes linked to global warming intensity. Sci. Bull. 2017, 62, 1673–1680. [Google Scholar] [CrossRef] [Green Version]
  4. Woelders, L.; Lenaerts, J.T.M.; Hagemans, K. Recent climate warming drives ecological change in a remote high-Arctic Lake. Sci. Rep. 2018, 8, 6858. [Google Scholar] [CrossRef] [PubMed] [Green Version]
  5. Hansen, J.E.; Ruedy, R.; Sato; Lo, K. NASA GISS Surface Temperature (GISTEMP) Analysis. In Trends: A Compendium of Data on Global Change; Carbon Dioxide Information Analysis Center, Oak Ridge National Laboratory, U.S. Department of Energy: Oak Ridge, TN, USA, 2011. [Google Scholar] [CrossRef]
  6. Wu, Z.H.; Chassignet Eric, P.; Huang, J.P.; Ji, F. Evolution of land surface air temperature trend. Nat. Clim. Change 2014, 4, 462–466. [Google Scholar]
  7. Alizadeh, O.; Lin, Z. Rapid Arctic warming and its link to the waviness and strength of the westerly jet stream over West Asia. Glob. Planet. Change 2021, 199, 103447. [Google Scholar] [CrossRef]
  8. Yang, T.; Ding, J.Z.; Liu, D.; Wang, X.Y.; Wang, T. Combined Use of Multiple Drought Indices for Global Assessment of Dry Gets Drier and Wet Gets Wetter Paradigm. J. Clim. 2019, 32, 737–748. [Google Scholar] [CrossRef]
  9. Ji, Q.; Yang, J.P.; Chen, H.J. Comprehensive analysis of the precipitation changes over the Tibetan Plateau during 1961–2015. J. Glaciol. Geocryol. 2018, 40, 1090–1099. [Google Scholar]
  10. Sun, Q.H.; Miao, C.Y.; Duan, Q.Y. Changes in the Spatial Heterogeneity and Annual Distribution of Observed Precipitation across China. J. Clim. 2017, 30, 9399–9416. [Google Scholar] [CrossRef]
  11. Alizadeh, O.; Najafi, M.S. Extreme weather events in Iran under a changing climate. Clim. Dyn. 2017, 50, 249–260. [Google Scholar] [CrossRef]
  12. Alizadeh, O.; Morteza, B. Seasonally dependent precipitation changes and their driving mechanisms in Southwest Asia. Clim. Change 2022, 171, 1–20. [Google Scholar] [CrossRef]
  13. Li, Z.; Li, Y.P.; Li, H.W. Analysis of drought change and its impact in Central Asia. Adv. Earth Sci. 2022, 37, 37–50. [Google Scholar]
  14. Greve, P.; Orlowsky, B.; Mueller, B.; Sheffield, J.; Seneviratne, S.I. Global assessment of trends in wetting and drying over land. Nat. Geosci. 2014, 7, 716–721. [Google Scholar] [CrossRef]
  15. Feng, H.; Zhang, M. Global land moisture trends: Drier in dry and wetter in wet over land. Sci. Rep. 2015, 5, 18018. [Google Scholar] [CrossRef] [Green Version]
  16. Trenberth, K.E. Changes in precipitation with climate change. Clim. Res. 2011, 47, 123–138. [Google Scholar] [CrossRef] [Green Version]
  17. Donat, M.G.; Alexander, L.V.; Yang, H.; Durre, I.; Vose, R.; Dunn, R.J.H.; Willett, K.M.; Aguilar, E.; Brunet, M.; Caesar, J.; et al. Updated analyses of temperature and precipitation extreme indices since the beginning of the twentieth century: The HadEX2 dataset. J. Geophys. Res. Atmos. 2013, 118, 2098–2118. [Google Scholar] [CrossRef] [Green Version]
  18. Hu, Z.Y.; Chen, X.; Chen, D.L. “Dry gets drier, wet gets wetter”: A case study over the arid regions of central Asia. Int. J. Climatol. 2018, 39, 1072–1091. [Google Scholar] [CrossRef]
  19. Chou, C.; Neelin, J.; Chen, C.; Tu, J. Evaluating the “rich–get–ricer” mechanism in tropical precipitation change under global warming. J. Clim. 2009, 22, 1982–2004. [Google Scholar] [CrossRef]
  20. Brugnara, Y.; Maugeri, M. Daily precipitation variability in the southern Alps since the late 19th century. J. Climatol. 2019, 39, 3492–3504. [Google Scholar] [CrossRef]
  21. Fessehaye, M.; Brugnara, Y.; Savage, M.J.; Bronnimann, S. A note on air temperature and precipitation variability and extremes over Asmara: 1914-2015. J. Climatol. 2019, 39, 5215–5227. [Google Scholar] [CrossRef]
  22. Lesk, C.; Rowhani, P.; Ramankutty, N. Influence of extreme weather disasters on global crop production. Nature 2016, 529, 84–87. [Google Scholar] [CrossRef] [Green Version]
  23. Donat, M.G.; Lowry, A.L.; Alexander, L.V.; Gorman, P.A.; Maher, N. More extreme precipitation in the world’s dry and wet regions. Nat. Clim. Change 2017, 6, 154–158. [Google Scholar] [CrossRef] [Green Version]
  24. Zhang, M.; Chen, Y.; Shen, Y.; Li, Y. Changes of precipitation extremes in arid Central Asia. Quat. Int. 2017, 4, 16–27. [Google Scholar] [CrossRef]
  25. Chen, T.; Zhang, H.; Chen, X. Robust drying and wetting trends found in regions over China based on Köppen climate classifications. J. Geophys. Res. Atmos. 2017, 122, 4228–4237. [Google Scholar] [CrossRef]
  26. Adina-Eliza, C.; Adrian, P.; Doina, C.B. Changes in precipitation extremes in Romania. Quat. Int. 2016, 9, 325–335. [Google Scholar]
  27. Yan, H.; Wang, S.; Wang, J. Assessing spatiotemporal variation of drought in China and its impact on agriculture during 1982–2011 by using PDSI indices and agriculture drought survey data. J. Geophys. Res. Atmos. 2016, 121, 2283–2298. [Google Scholar] [CrossRef] [Green Version]
  28. Pan, Y.P.; Wang, H.J.; Chen, Y.N. Characteristics of drought in the aird region of Northwestern China. Clim. Res. 2015, 62, 99–113. [Google Scholar]
  29. Huang, Q.Z.; Zhang, Q.; Vijay, P.S.; Shi, P.; Zheng, Y. Variations of dryness/wetness across China: Changing properties, drought risks, and causes. Glob. Planet Change 2017, 155, 1–12. [Google Scholar] [CrossRef]
  30. Rehfeld, K.; Laepple, T. Warmer and wetter or warmer and dryer? Observed versus simulated covariability of Holocene temperature and rainfall in Asia. Earth Planet Sci. Lett. 2016, 436, 1–9. [Google Scholar] [CrossRef] [Green Version]
  31. Ljungqvist, F.C.; Seim, A.; Krusic, P.J. European warm-season temperature and hydroclimate since 850 CE. Environ. Res. Lett. 2019, 14, 084015. [Google Scholar] [CrossRef]
  32. Chen, F.H.; Chen, J.; Huang, W. Westerlies Asia and monsoonal Asia: Spatiotemporal differences in climate change and possible mechanisms on decadal to sub-orbital timescales. Earth Sci. Rev. 2019, 192, 337–354. [Google Scholar] [CrossRef]
  33. Chen, J.; Huang, W.; Zhang, Q.; Feng, S. Origin of the spatial consistency of summer precipitation variability between the Mongolian Plateau and the mid-latitude East Asian summer monsoon region. Sci. China Earth Sci. 2020, 63, 1199–1208. [Google Scholar] [CrossRef]
  34. Shi, Z.G.; Sha, Y.Y.; Liu, X.D. Effect of marginal topography around the Tibetan Plateau on the evolution of central Asian arid climate: Yunnan-Guizhou and Mongolian Plateau as examples. Clim. Dyn. 2019, 53, 4433–4445. [Google Scholar] [CrossRef]
  35. Babaei, M.; Alizadeh, O.; Irannejad, P. Impacts of orography on large-scale atmospheric circulation: Application of a regional climate model. Clim. Dyn. 2021, 57, 1973–1992. [Google Scholar] [CrossRef]
  36. Zhang, G.Q.; Yao, T.D.; Piao, S.L. Extensive and drastically different alpine lake changes on Asia’s high plateaus during the past four decades. Geophys. Res. Lett. 2017, 44, 252–260. [Google Scholar] [CrossRef]
  37. Jiang, L.; Yao, Z.; Huang, H.Q. Climate variability and change on the Mongolian Plateau: Historical variation and future predictions. Clim. Res. 2016, 67, 1–14. [Google Scholar] [CrossRef]
  38. Jiang, K.; Bao, G.; WuLan, T.Y. Spatiotemporal changes of snow cover in Mongolia Plateau based on MODIS data. Arid Land Geogr. 2019, 42, 789–792. [Google Scholar]
  39. Na, Y.T.; Qin, F.Y.; Jia, G.S. Change trend and regional differentiation of precipitation over the Mongolian Plateau in recent 54 years. Arid Land Geogr. 2019, 42, 1253–1261. [Google Scholar]
  40. Qin, F.Y.; Jia, G.S.; Yang, J.; Na, Y.T.; Hou, M.T.; Narenmandula. Spatiotemporal variability of precipitation during 1961–2014 across the Mongolian Plateau. J. Mt. Sci. 2018, 15, 992–1005. [Google Scholar] [CrossRef]
  41. Yang, X.P. Landscape evolution and precipitation changes in the Badain Jaran Desert during the last 30000 years. China Sci. Bull. 2006, 45, 1042–1047. [Google Scholar] [CrossRef]
  42. Li, C.L.; Filho, W.L.; Wang, J.; Hubert, F.; Mariia, F.; Hu, R.; Yin, S.; Bao, Y.H.; Yu, S.; Julian, H. An Analysis of Precipitation Extremes in the Inner Mongolian Plateau: Spatial-Temporal Patterns, Causes, and Implications. Atmosphere 2018, 9, 322. [Google Scholar] [CrossRef] [Green Version]
  43. Alizadeh, O.; Ghafarian, P.; Adibi, P. Inter-annual variations and trends of the urban warming in Tehran. Atmos. Res. 2016, 176–185. [Google Scholar] [CrossRef]
  44. You, Q.L.; Cai, Z.Y.; Pepin, N.; Chen, D.; Zhang, Y. Warming amplification over the Arctic Pole and Third Pole: Trends, mechanisms and consequences. Earth Sci. Rev. 2021, 217, 103625. [Google Scholar] [CrossRef]
  45. Xu, L.J.; Hu, Z.Y.; Zhao, Y.N. Climate change characteristics in Qinghai-Tibetan Plateau during 1961–2010. Meteorol. Plateau 2019, 38, 911–919. [Google Scholar]
  46. Zhang, H.; Wen, Z.; Wu, R. An inter-decadal increase in summer sea level pressure over the Mongolian region around the early 1990s. Clim. Dyn. 2019, 52, 1935–1948. [Google Scholar] [CrossRef]
  47. Liu, J.B.; Chen, F.H.; Chen, J.H.; Zhang, X.; Liu, J.; Bloemendal, J. Weakening of the East Asian summer monsoon at 1000–1100 A.D. within the Medieval Climate Anomaly: Possible linkage to changes in the Indian Ocean-western Pacific. J. Geophys. Res. Atmos. 2014, 119, 2209–2219. [Google Scholar] [CrossRef]
  48. Liu, B.Q.; He, J.H. Reviews on the dynamics of Asian summer monsoon. J. Trop. Meteorol. 2015, 31, 869–880. [Google Scholar]
  49. Wang, L.; Zhen, L.; Liu, X.L. Comparative studies on climate changes and influencing factors in central Mongolian Plateau region. Geogr. Res. 2008, 27, 171–180. [Google Scholar]
  50. Zhou, T.J. Why the Western Pacific subtropical high has extended westward since the late 1970s. J. Clim. 2009, 22, 2199–2215. [Google Scholar] [CrossRef] [Green Version]
  51. Adiya, S.; Dalantai, S.; Wu, T.H. Spatial and temporal change patterns of near-surface CO2 and CH4 concentrations in different permafrost regions on the Mongolian Plateau from 2010 to 2017. Sci. Total Environ. 2021, 800, 149433. [Google Scholar] [CrossRef]
  52. WuYun, G.R.L.; Zhang, Y.; Zong, Z.D. Mongolia fish species and environment of fishery economy thinking. J. Inn. Mong. Agric. Univ. 2015, 36, 167–172. [Google Scholar]
  53. John, R.; Chen, J.; Giannico, V.; Park, H.; Xiao, J.; Shirkey, G.; Ouyang, Z.; Shao, C.; Lafortezza, R.; Qi, J. Grassland canopy cover and aboveground biomass in Mongolia and Inner Mongolia: Spatiotemporal estimates and controlling factors. Remote Sens. Environ. 2018, 213, 34–48. [Google Scholar] [CrossRef]
  54. Li, Z.J.; Sun, D.H.; Chen, F.H. Chronology and paleoenvironmental records of a drill core in the central Tengger Desert of China. Quat. Sci. Rev. 2014, 85, 5–98. [Google Scholar] [CrossRef]
  55. Wang, C.H.; Zhang, S.N.; Li, K.C. Change Characteristics of Precipitation in Northwest China from 1961 to 2018. Chin. J. Atmos. Sci. 2021, 45, 713–724. [Google Scholar]
  56. Cao, X.M.; Feng, Y.M.; Shi, Z.J. Spatio-temporal Variations in Drought with Remote Sensing from the Mongolian Plateau During 1982–2018. Chin. Geogr. Sci. 2020, 30, 1081–1094. [Google Scholar] [CrossRef]
  57. Liu, Y.J.; Ding, Y.H. Analysis of the basic features of the onset of Asian summer monsoon. J. Meteorol. 2007, 65, 511–526. [Google Scholar]
  58. Ren, Z.H.; Zhang, Z.F.; Sun, C. Development of Three-Step quality control system of real-time observation data from AWS in China. Meteorology 2015, 41, 1268–1277. [Google Scholar]
  59. Wang, B.Z.; Wu, J.; Li, J. How to measure the strength of the East Asian summer monsoon. J. Clim. 2008, 21, 4449–4463. [Google Scholar] [CrossRef]
  60. Sen, P. Estimates of the regression coefficient based on Kendall’s tau. J. Stat. Assoc. 1968, 63, 1379–1389. [Google Scholar] [CrossRef]
  61. Singh, R.; Sah, S.; Das, B. Innovative trend analysis of spatio-temporal variations of rainfall in India during 1901–2019. Theor. Appl. Climatol. 2021, 145, 821–838. [Google Scholar] [CrossRef]
  62. Wu, H.; Qian, H. Innovative trend analysis of annual and seasonal rainfall and extreme values in Shaanxi, China, since the 1950s. Int. J. Climatol. 2017, 37, 2582–2592. [Google Scholar] [CrossRef]
  63. Mann, H.B. Nonparametric tests against trend. Econometrical 1945, 13, 245–259. [Google Scholar] [CrossRef]
  64. Kendall, M.G. Rank Correlation Methods, 4th ed.; Griffin Press: London, UK, 1975. [Google Scholar]
  65. Wei, F.Y. Modern Statistical Diagnosis and Prediction Techniques for Climate, 2nd ed.; China Meteorology Press: Beijing, China, 2007; pp. 63–64. [Google Scholar]
  66. Xing, W.; Wang, B. Predictability and prediction of summer rainfall in the arid and semi-arid regions of China. Clim. Dyn. 2017, 49, 419–431. [Google Scholar] [CrossRef]
  67. Zhu, C.; Wang, B.; Qian, W.; Zhang, B. Recent weakening of northern East Asian summer monsoon: A possible response to global warming. Geophys. Res. Lett. 2012, 39, L09701. [Google Scholar] [CrossRef]
  68. Liu, L.H.; Zhang, D.E. Spatio-temporal variation of annual precipitation in China and its relationship with the East Asian summer monsoon. Quat. Sci. 2013, 33, 97–107. [Google Scholar]
  69. Guan, X.; Yang, L.; Zhang, Y. Spatial distribution, temporal variation, and transport characteristics of atmospheric water vapor over Central Asia and the arid region of China. Glob. Planet. Change 2019, 172, 159–178. [Google Scholar] [CrossRef]
  70. Wei, W.; Zhang, R.; Wen, M. Relationship between the Asian westerly jet stream and summer rainfall over central Asia and North China: Roles of the Indian monsoon and the South Asian high. J. Clim. 2017, 30, 537–552. [Google Scholar] [CrossRef]
  71. Zhang, R. Changes in East Asian summer monsoon and summer rainfall over eastern China during recent decades. Sci. Bull. 2015, 60, 1222–1224. [Google Scholar] [CrossRef] [Green Version]
  72. Ma, Z.G.; Fu, C.B.; Yang, Q. Drying trend in Northern China and its shift during 1951-2016. Chin. J. Atmos. Sci. 2018, 42, 951–961. [Google Scholar]
  73. Yin, Y.H.; Ma, D.Y.; Wu, S.H. Enlargement of the semi-arid region in China from 1961 to 2010. Clim. Dyn. 2019, 52, 509–521. [Google Scholar] [CrossRef]
  74. Huang, J.P.; Ji, M.X.; Xie, Y.K. Global semi-arid climate change over last 60 years. Clim. Dyn. 2016, 46, 1131–1150. [Google Scholar] [CrossRef] [Green Version]
  75. Bao, G. Relationships between tree-ring growth of Hailar Pine and the North Atlantic Oscillation/Arctic Oscillation. J. Baoji Univ. Arts Sci. (Nat. Sci.) 2014, 34, 39–45. [Google Scholar]
  76. Bao, G.; Liu, Y.; Liu, N. Characteristics of climate changes during the instrumental period in the eastern and southern Mongolia Plateau and their ecological-environmental effects. J. Environ. 2013, 4, 1444–1460. [Google Scholar]
  77. Fallah, B.; Cubasch, U.; Prömmel, K. A numerical model study on the behaviour of Asian summer monsoon and AMOC due to orographic forcing of Tibetan Plateau. Clim. Dyn. 2016, 47, 1485–1495. [Google Scholar] [CrossRef] [Green Version]
  78. Sun, L.; Shen, B.Z.; Sui, B. The influences of East Asian monsoon on summer precipitation in Northeast China. Clim. Dyn. 2017, 48, 1647–1659. [Google Scholar] [CrossRef]
  79. Piao, J.; Chen, W.; Zhang, Q. Comparison of moisture transport between Siberia and northeast Asia on annual and interannual time scales. J. Clim. 2018, 31, 7645–7660. [Google Scholar] [CrossRef]
  80. Whiteman, C.D. Observations of thermally developed wind systems in mountainous terrain. In Atmospheric Processes over Complex Terrain; Meteorological Monographs; AMS: Boston, MA, USA, 1990; pp. 5–42. [Google Scholar]
  81. He, B.H.; Sun, J.Q.; Yu, E.T. Simulation Study on the Influence of the Great Khingan Strip and Changbai Mountain on Summer Rainfall in Northeast China. Clim. Res. 2020, 25, 268–280. [Google Scholar]
  82. Wu, M.H.; Chen, Y.N.; Xu, C.C. Assessment of meteorological disasters based on information diffusion theory in Xinjiang, Northwest China. J. Geogr. Sci. 2015, 25, 69–84. [Google Scholar] [CrossRef]
  83. Bolin, B. On the Influence of the Earth’s Orography on the General Character of the Westerlies. Tellus 1950, 2, 184–195. [Google Scholar] [CrossRef]
Figure 1. The Mongolian Plateau (a) the distribution of meteorological stations and annual average precipitation and (b) atmospheric circulation system [57].
Atmosphere 13 02132 g001
Figure 2. Variability of anomalies of annual and seasonal precipitation ((a) Annual, (b) Spring, (c) Summer, (d) Autumn, (e) Winter) and the (f) percentage of annual precipitation in each season during 1976–2017 in the Mongolian Plateau (* indicates p < 0.05).
Atmosphere 13 02132 g002
Figure 3. The innovative trend analysis for annual and seasonal precipitation during 1976–2017 in the Mongolian Plateau ((a) Annual, (b) Spring, (c) Summer, (d) Autumn, (e) Winter). A solid red line indicates no trend, a dotted blue line indicates 95% significance, and a dotted yellow line indicates 90% significance).
Atmosphere 13 02132 g003
Figure 4. Spatial distribution of annual average precipitation and trend magnitude of 135 stations during 1976–2017 in the Mongolian Plateau ((a) annual average precipitation, (b) trend magnitude in annual precipitation).
Atmosphere 13 02132 g004
Figure 5. Spatial distribution of average precipitation of 135 stations during 1976–2017 in the Mongolian Plateau ((a) Spring, (b) Summer, (c) Autumn, (d) Winter).
Atmosphere 13 02132 g005
Figure 6. Spatial pattern of average precipitation change trend of 135 stations during 1976–2017 in the Mongolian Plateau ((a) Spring, (b) Summer, (c) Autumn, (d) Winter).
Atmosphere 13 02132 g006
Figure 7. The spatial distribution of the correlation between precipitation and East Asian Summer Monsoon Index ((a) Annual, (b) Summer, (c) Winter), the correlation between precipitation and Westerly Index ((d) Annual, (e) Summer, (f) Winter) (Shaded indicates p < 0.05).
Atmosphere 13 02132 g007
Figure 8. The relationship of normalized value of precipitation and EASMI anomaly and WI anomaly in MP. (a) Normalized value of precipitation, (b) EASMI anomaly, (c) WI anomaly, (d) Between EASMI and WI, this is, the opposite signs (+ −/− +), the signs are both negative (− −), and signs same as positive (+ +). Positive indicates that the change trend of EASMI or WI is the same as that of normalized value of precipitation, while negative indicates that the change trend of EASMI or WI is opposite to that of normalized value of precipitation.
Atmosphere 13 02132 g008
Figure 9. A 500 hPa anomalous wind field in summer (unit: m/s) ((a) 2015, (c) 1998, (e) 2005) and troposphere (1000–300 hPa) integral water vapor transport and convergence and divergence fields. The vector is the water vapor transport anomaly, unit kg/(s·m), the shaded area is the water vapor transport convergent divergent anomaly, unit 10−5 kg/(s·m2) ((b) 2015, (d) 1998, (f) 2005) (the pink, purple, and green arrows indicate the directions of the India-Pacific, Pacific, and Arctic Ocean water vapor to the arid region).
Atmosphere 13 02132 g009
Table 1. The annual and seasonal average precipitation change during 1976–2017 in the Mongolian Plateau.
SeasonAverage (mm)CV (%)SD (mm)Max (mm)Min (mm)Range (%)
Annual239.413.933.4314.5187.240.5
Spring33.126.18.655.720.563.2
Summer160.118.128.9221.9110.150.4
Autumn39.326.610.467.823.465.4
Winter6.625.81.710.12.673.8
Publisher’s Note: MDPI stays neutral with regard to jurisdictional claims in published maps and institutional affiliations.

