
Climate Adaptability Analysis on the Shape of Outpatient Buildings for Different Climate Zones in China Based on Low-Energy Target

Abstract
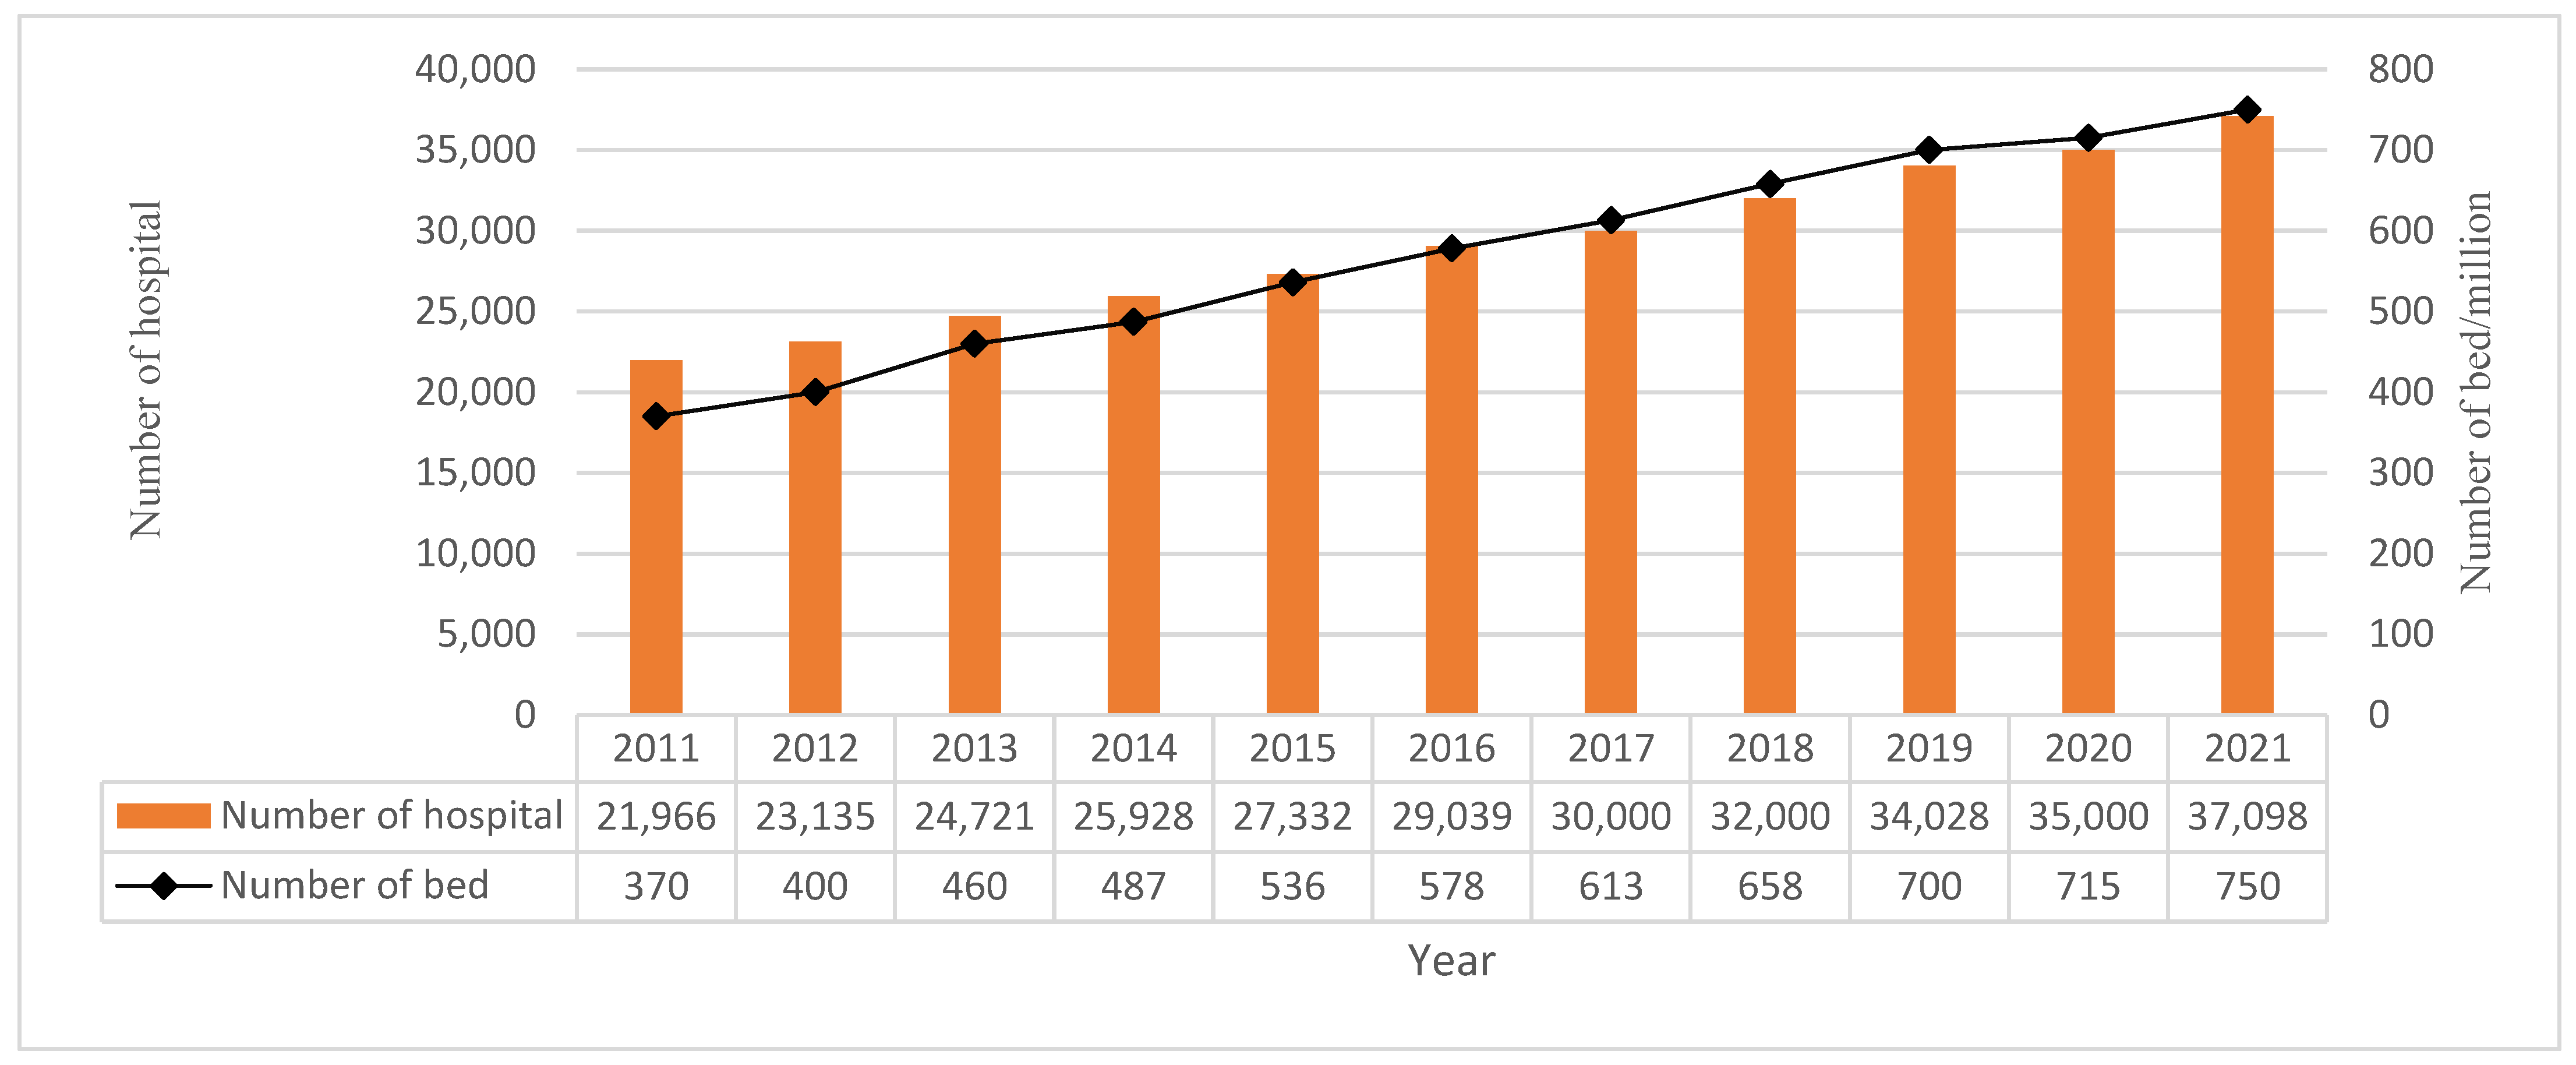
:1. Introduction
2. Methodology
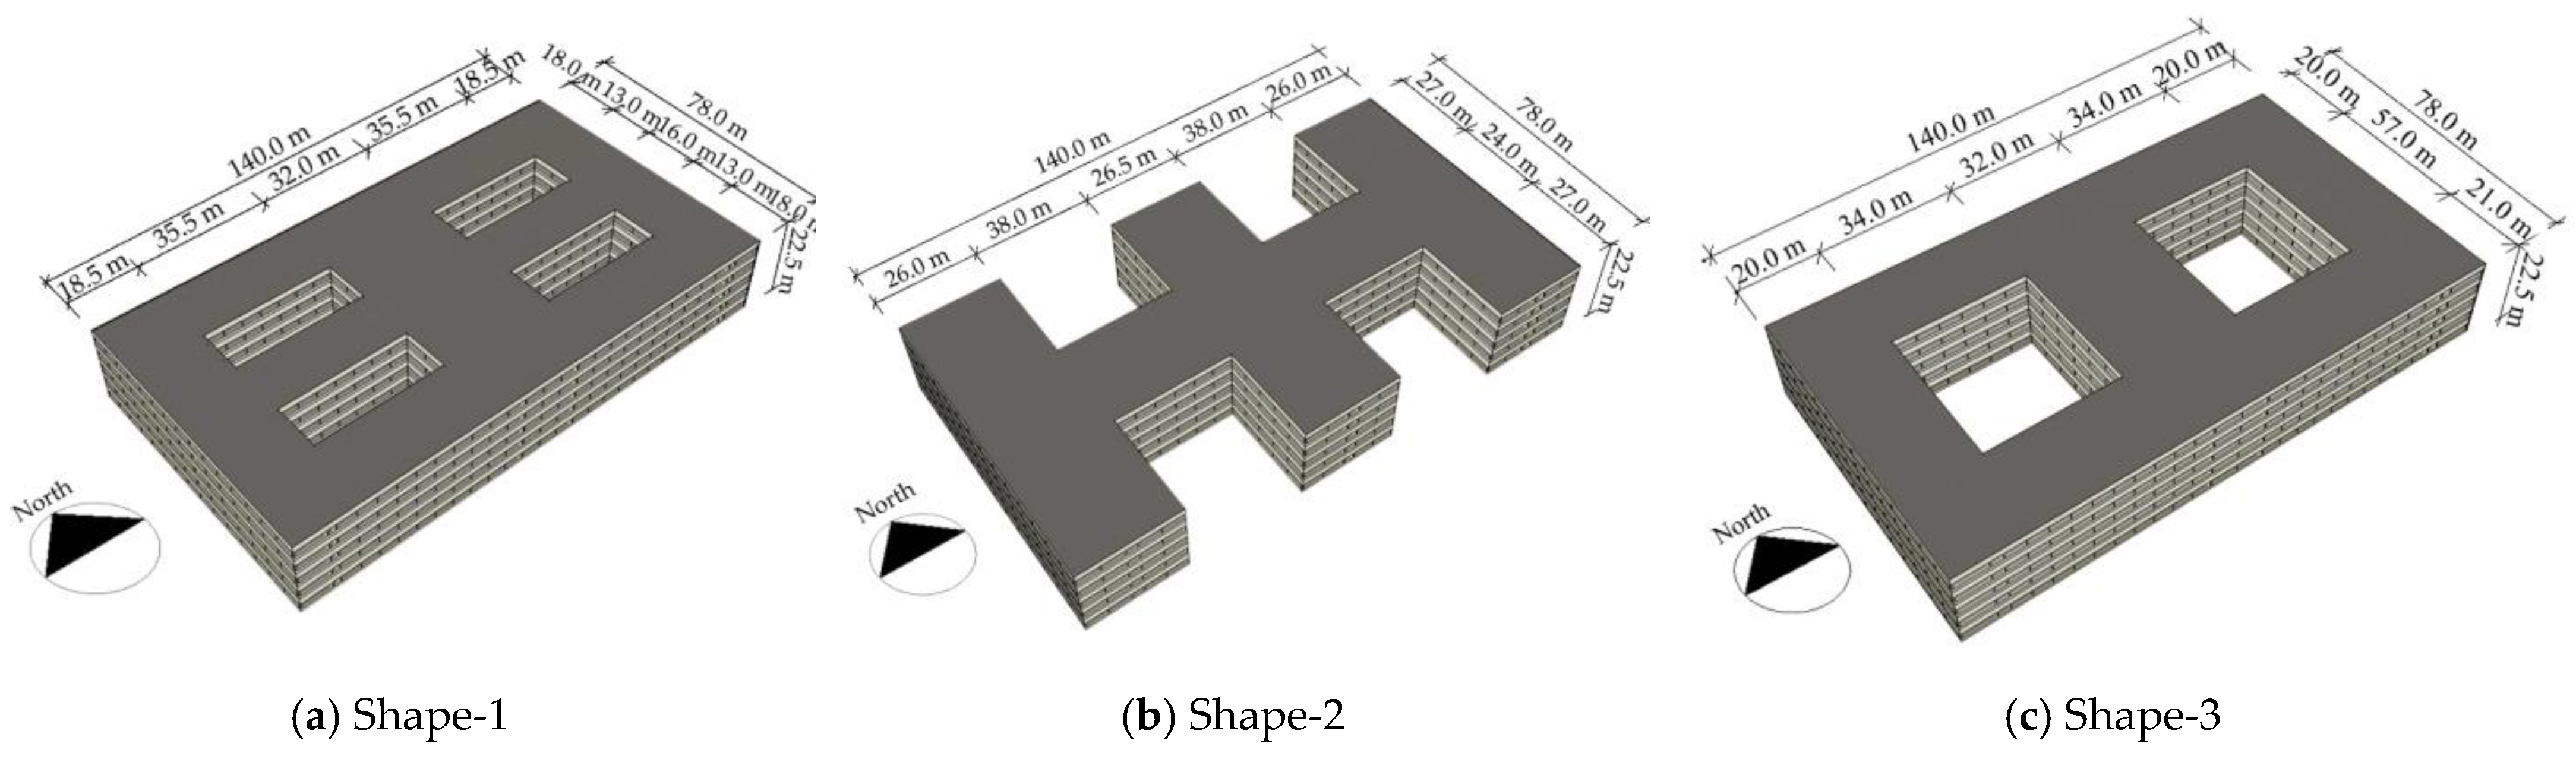
2.1. Building a Typical Model
2.2. Model Establishment Principle and Simulation Environment Setting
2.3. Simulation Tool and Methods
3. Parameter Setting of Simulation Tool
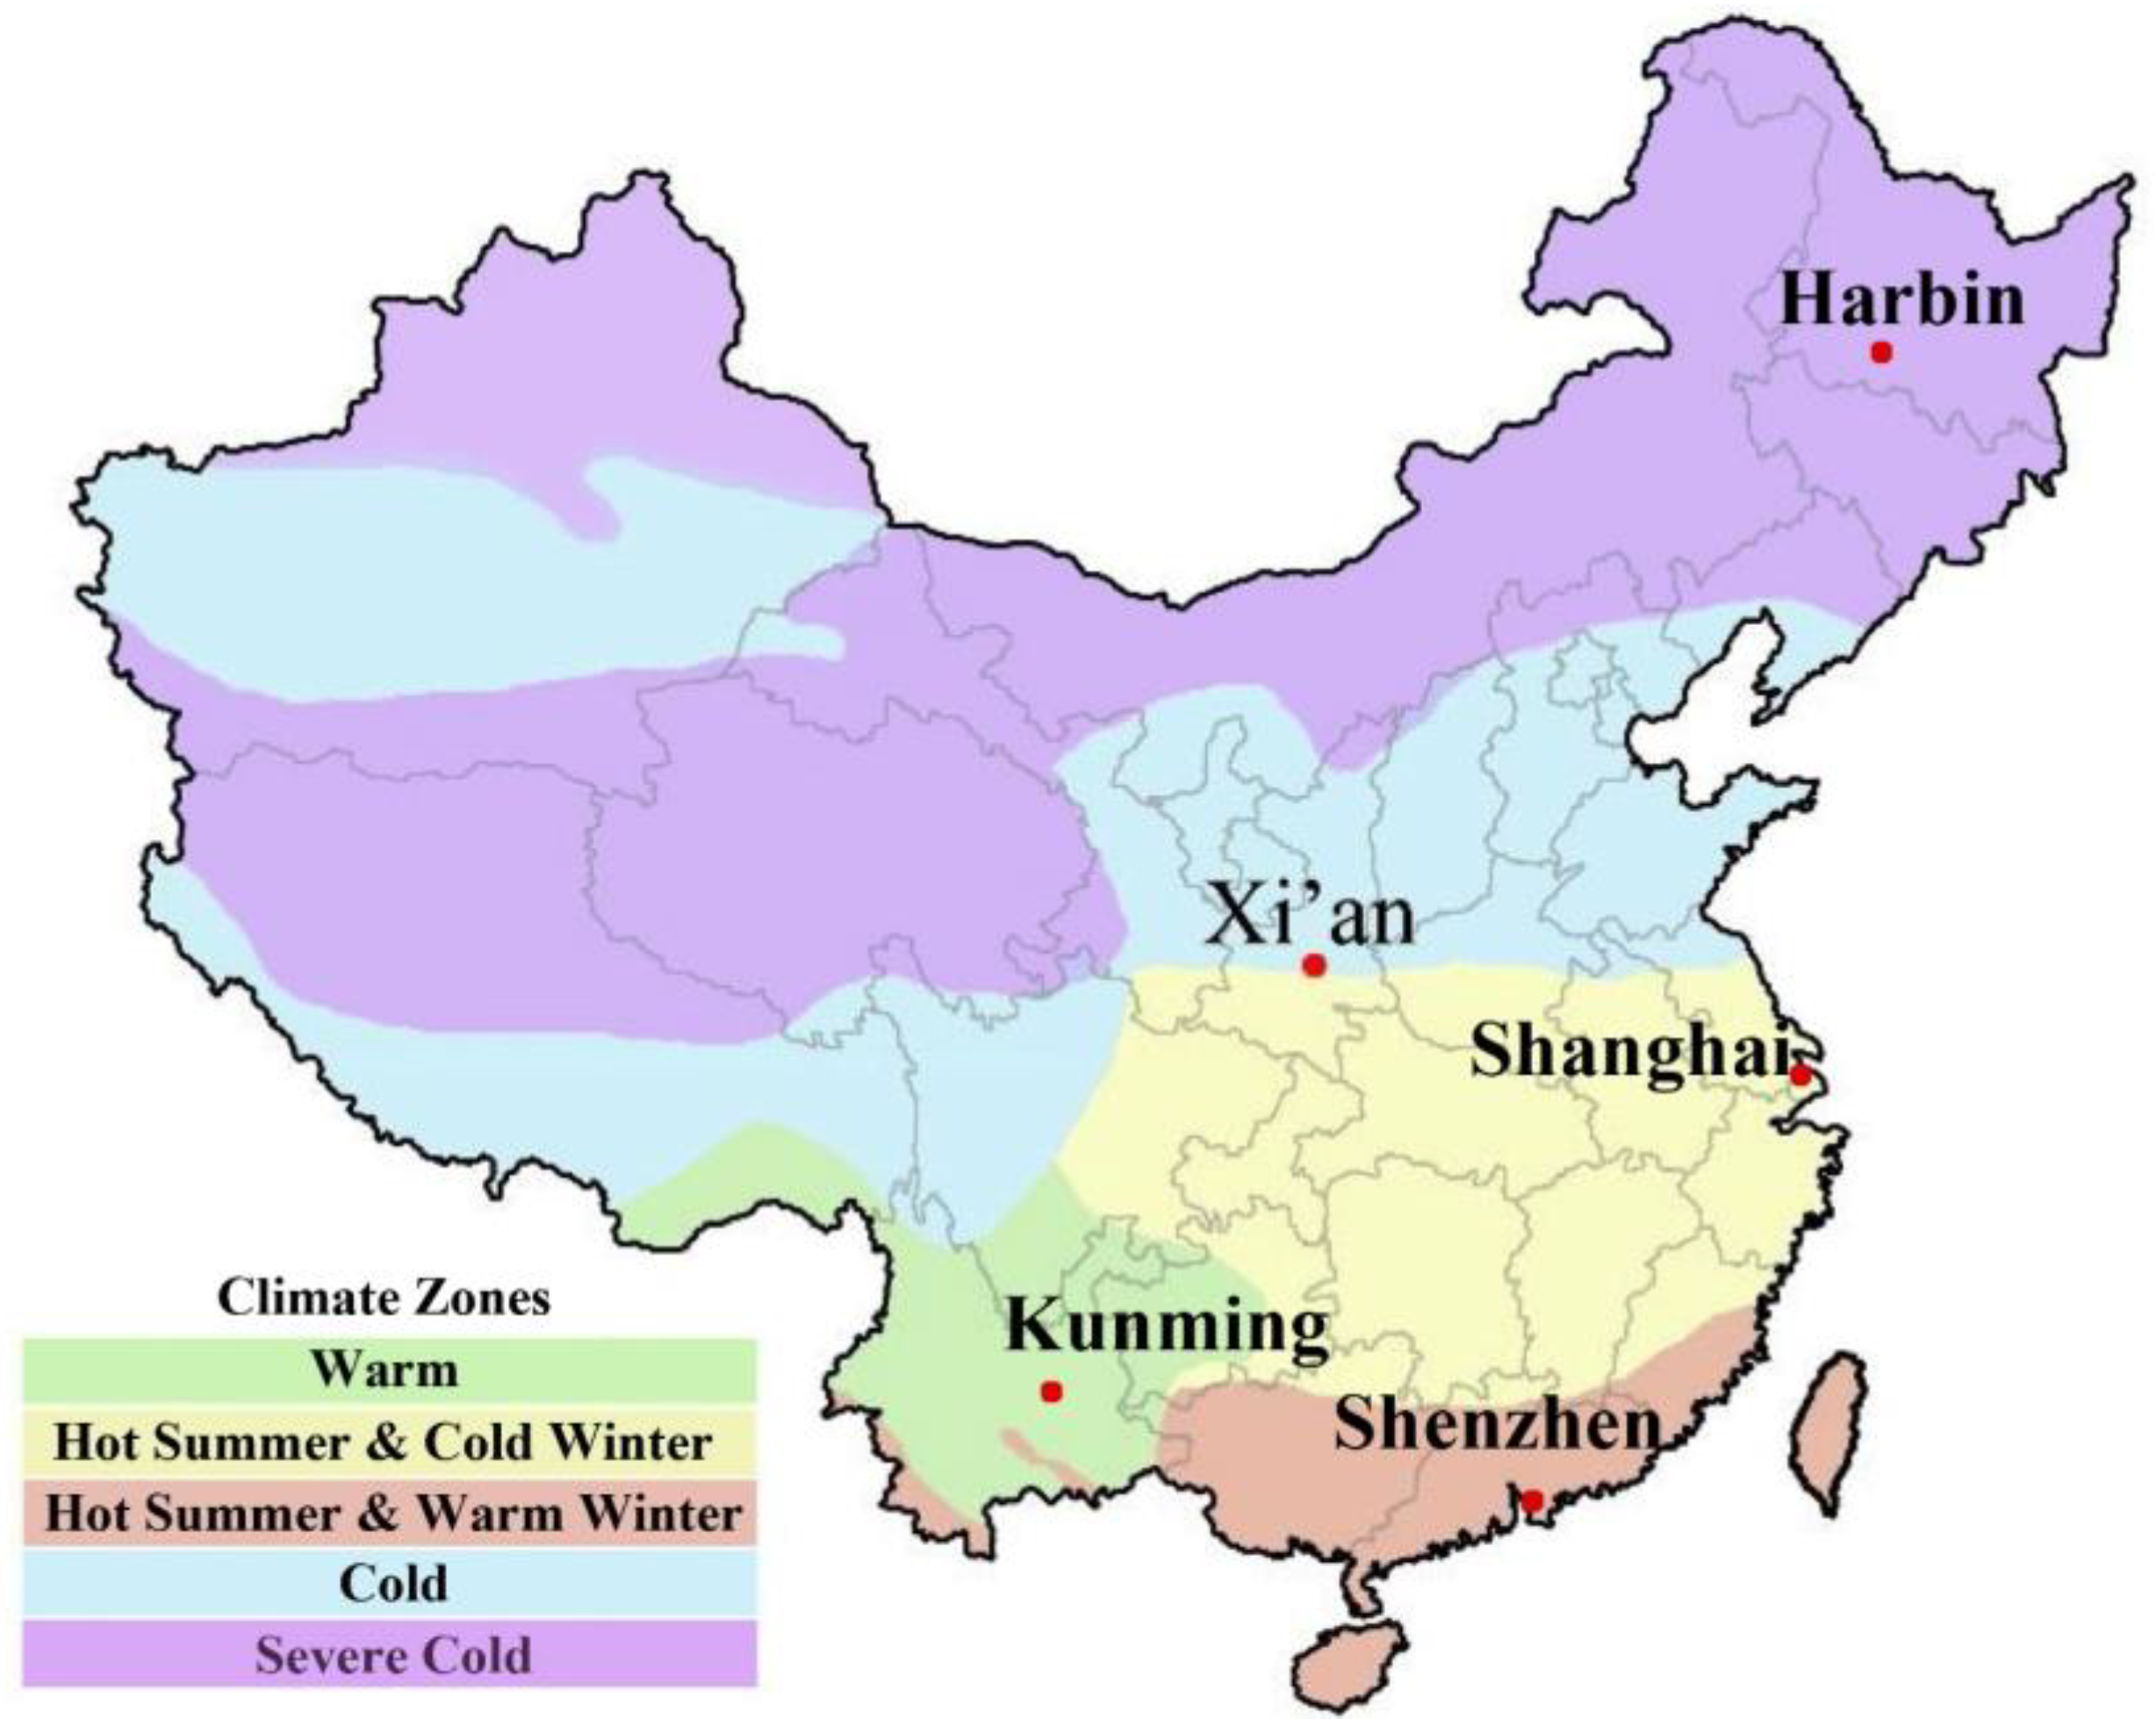
3.1. The Simulated Meteorological Parameter Setting
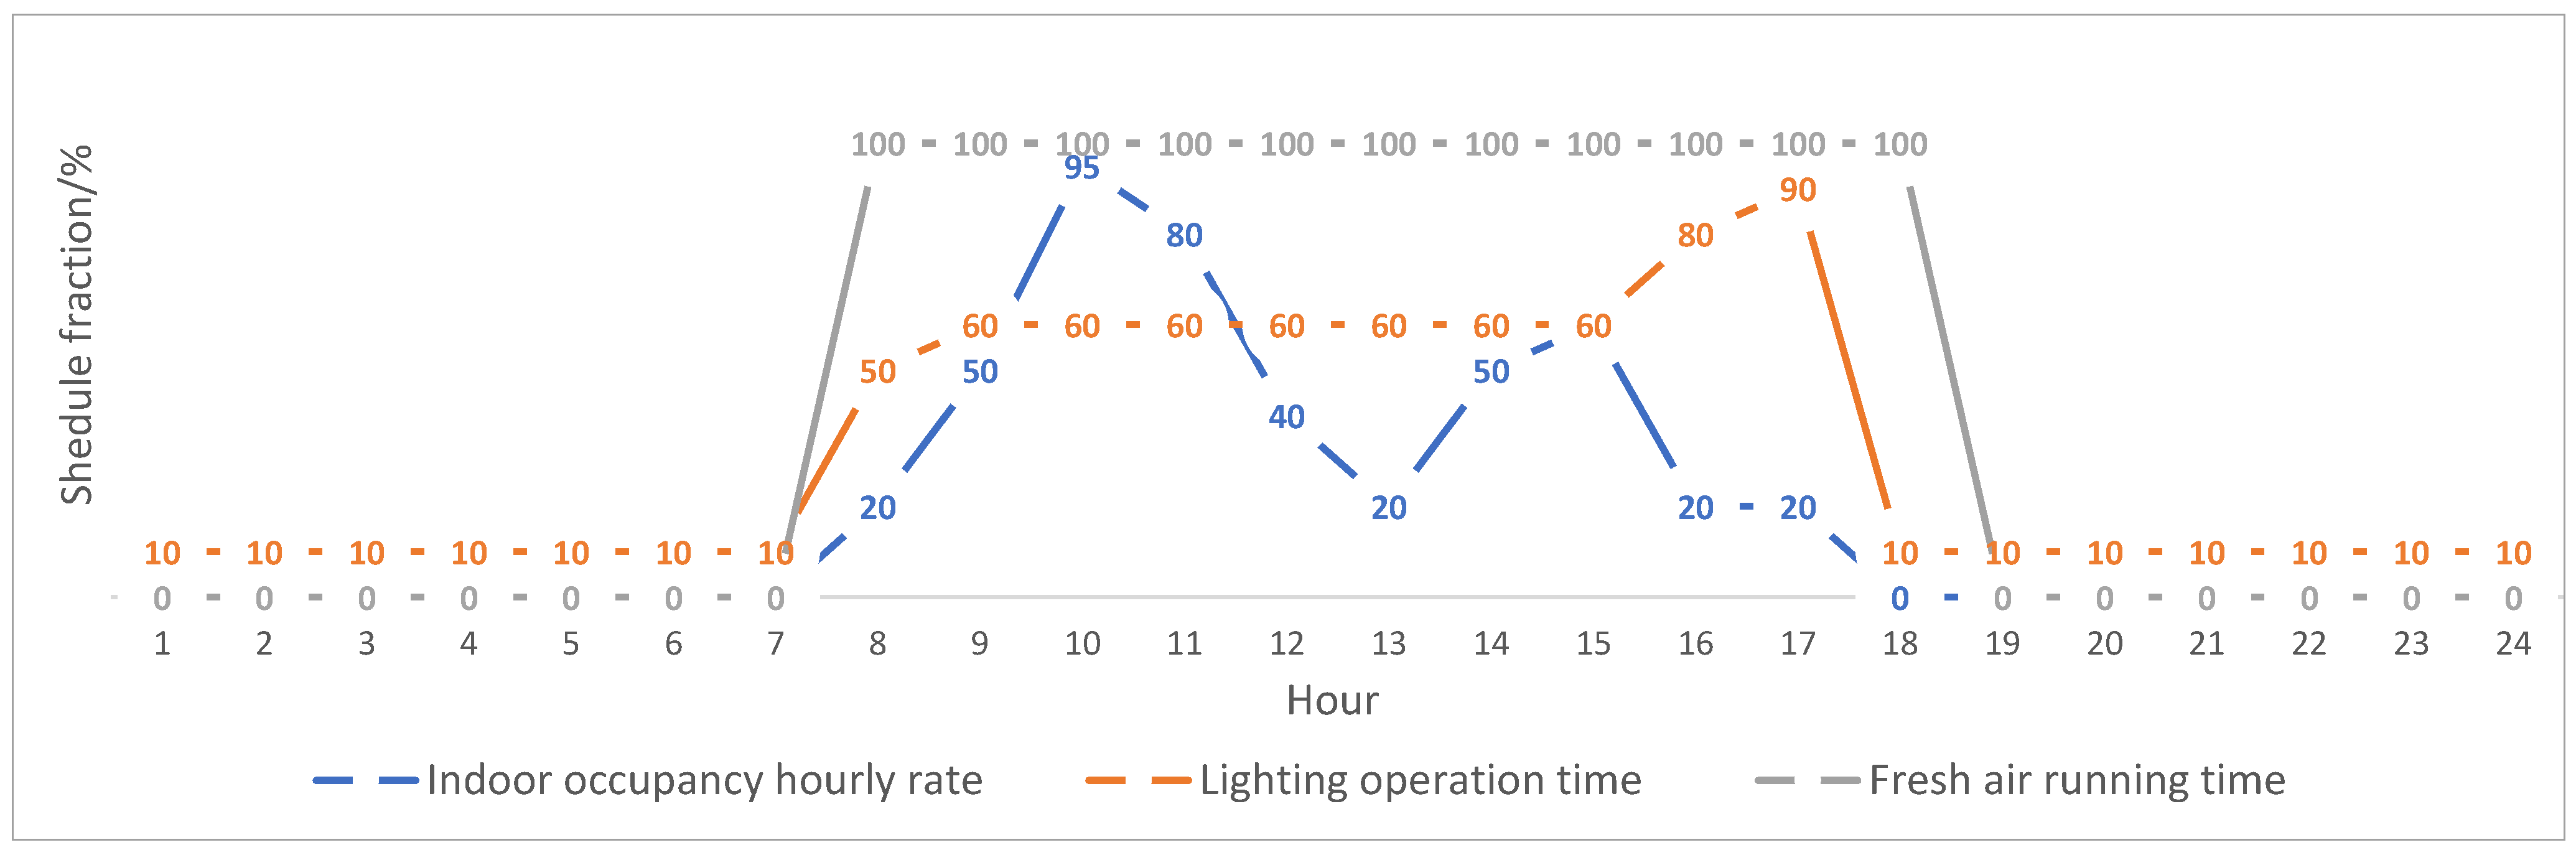
3.2. Personnel Activity Parameter Setting
3.3. Parameter Setting of Envelope Structure
3.4. Parameter Setting of Air Conditioning System
4. Analysis of the Effect of Building Shape on Energy Consumption
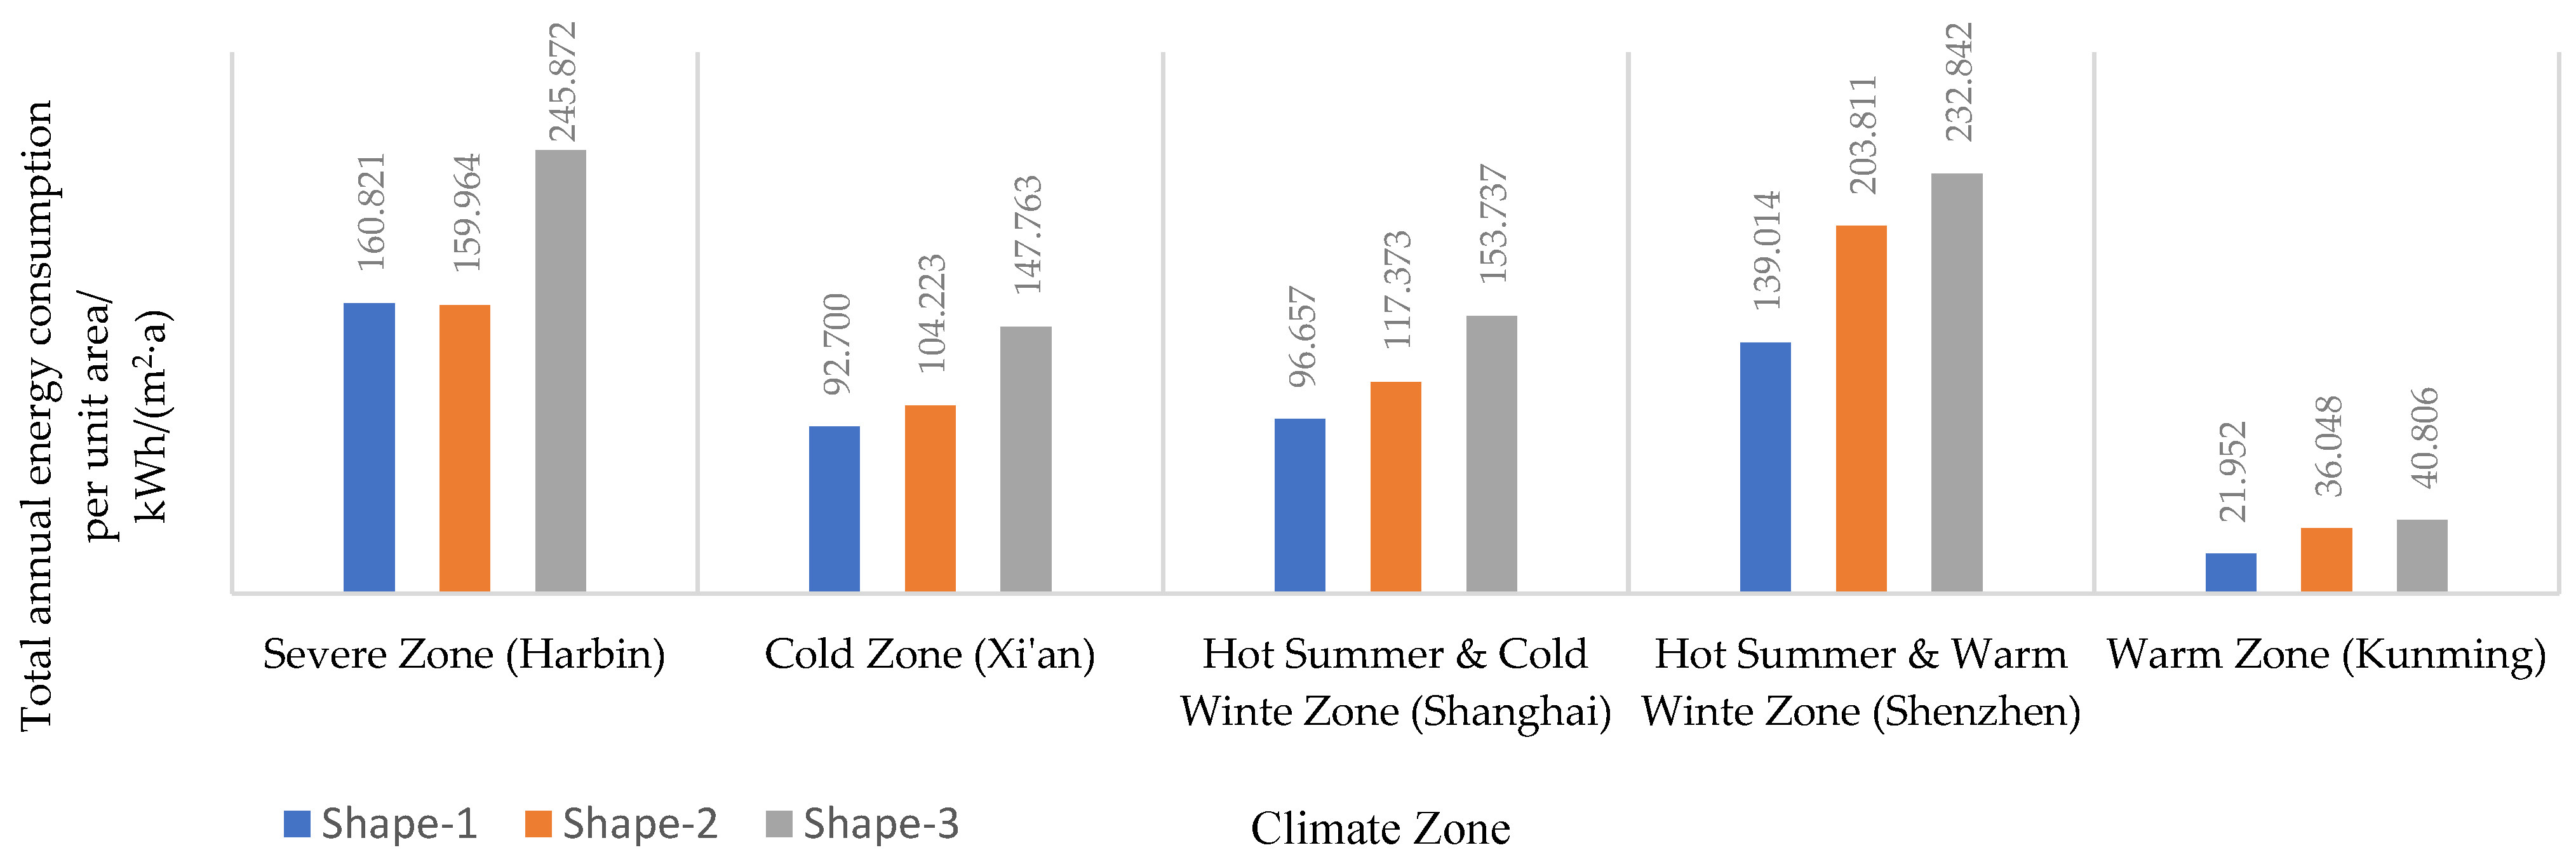
4.1. Comprehensive Energy Consumption Analysis
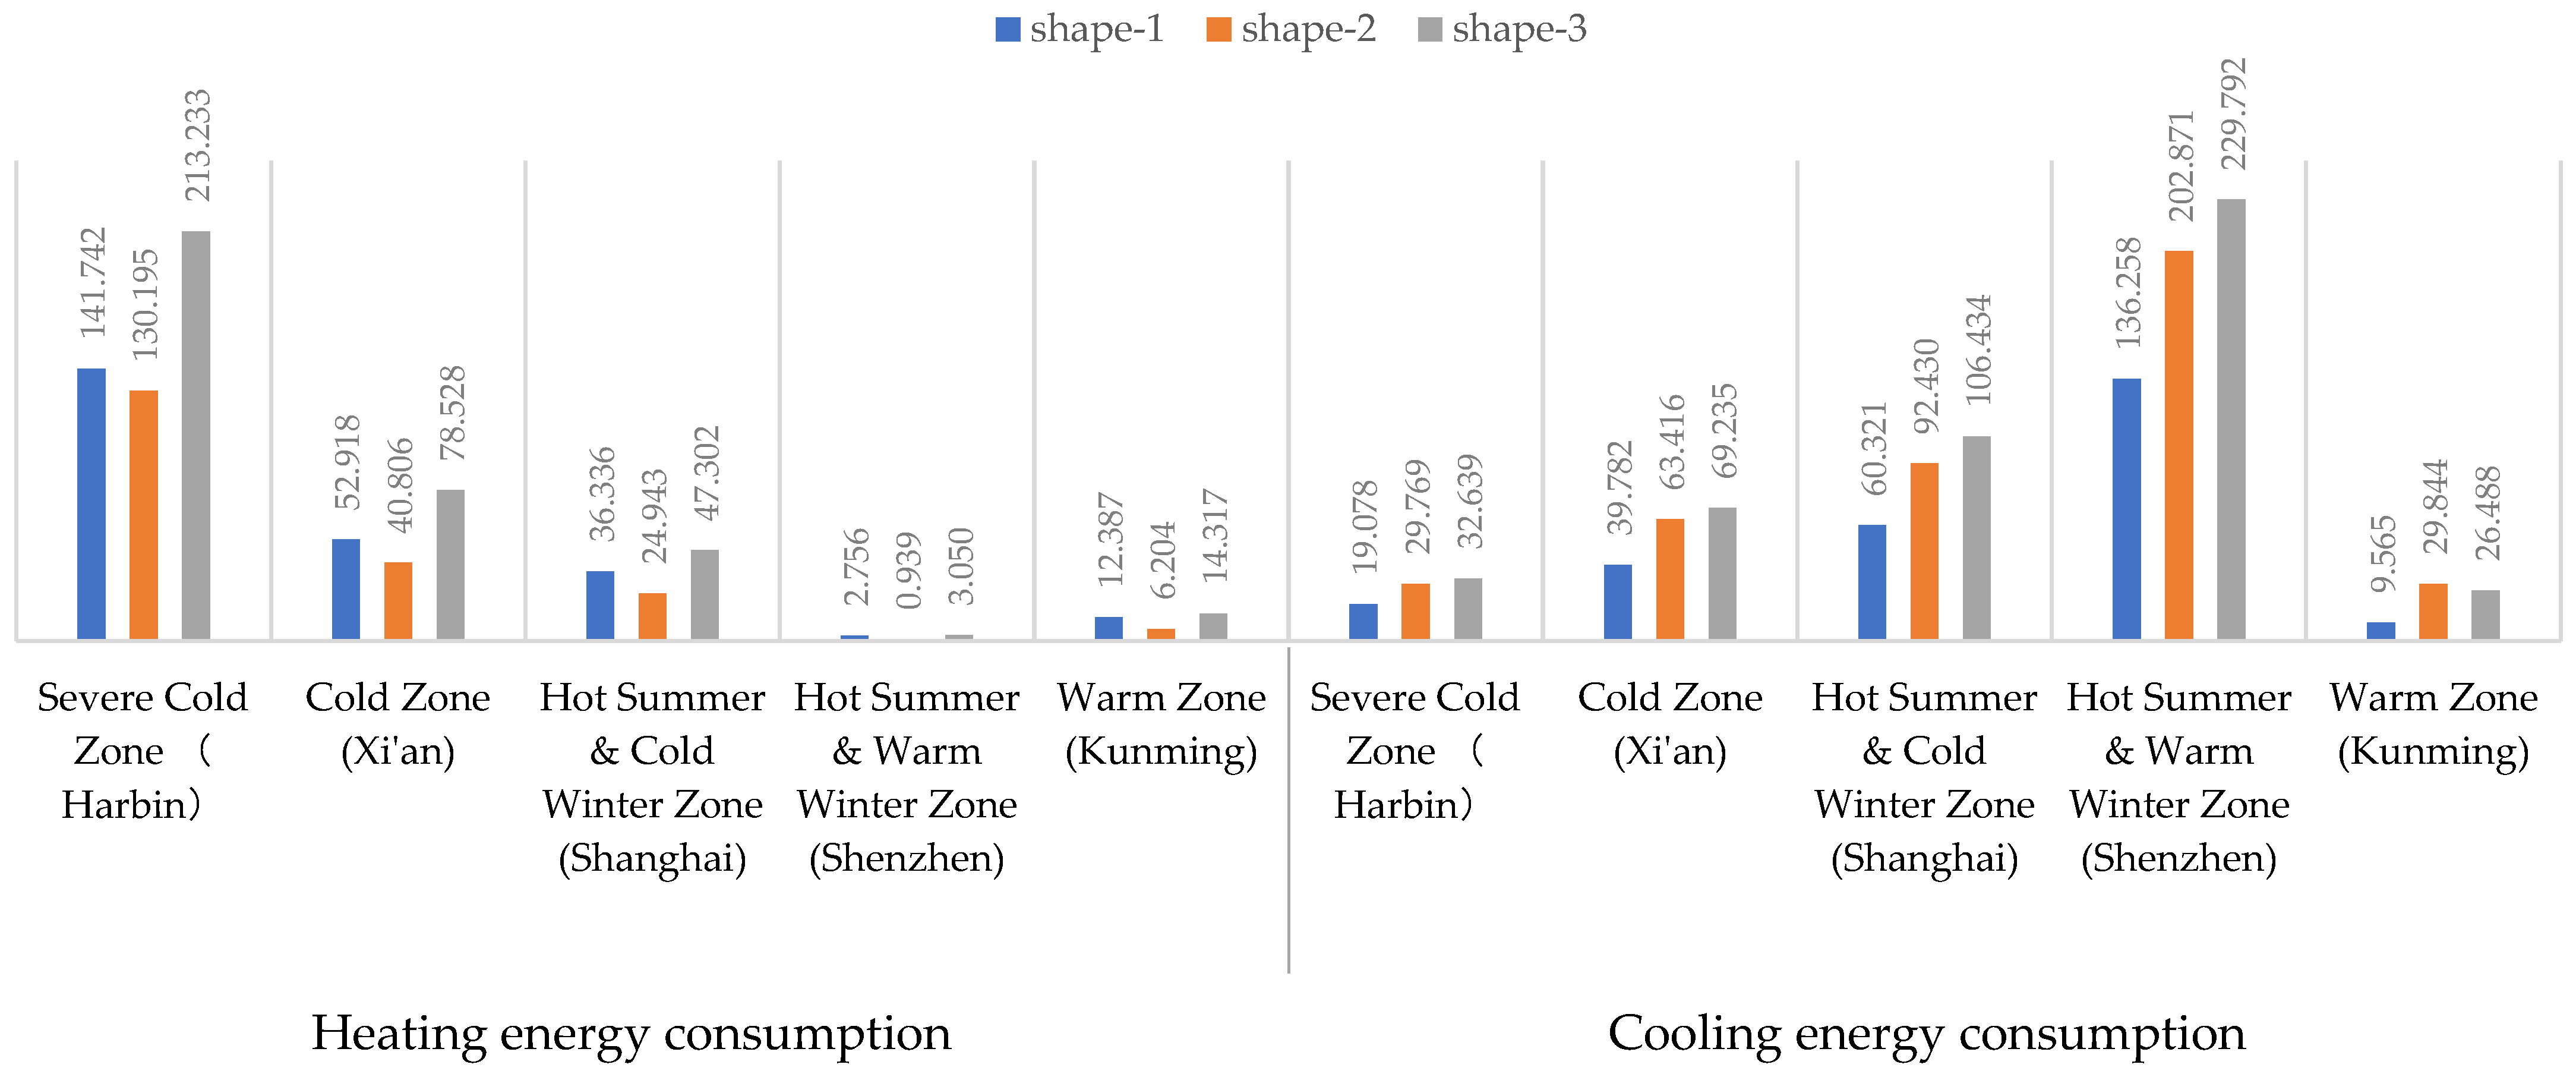
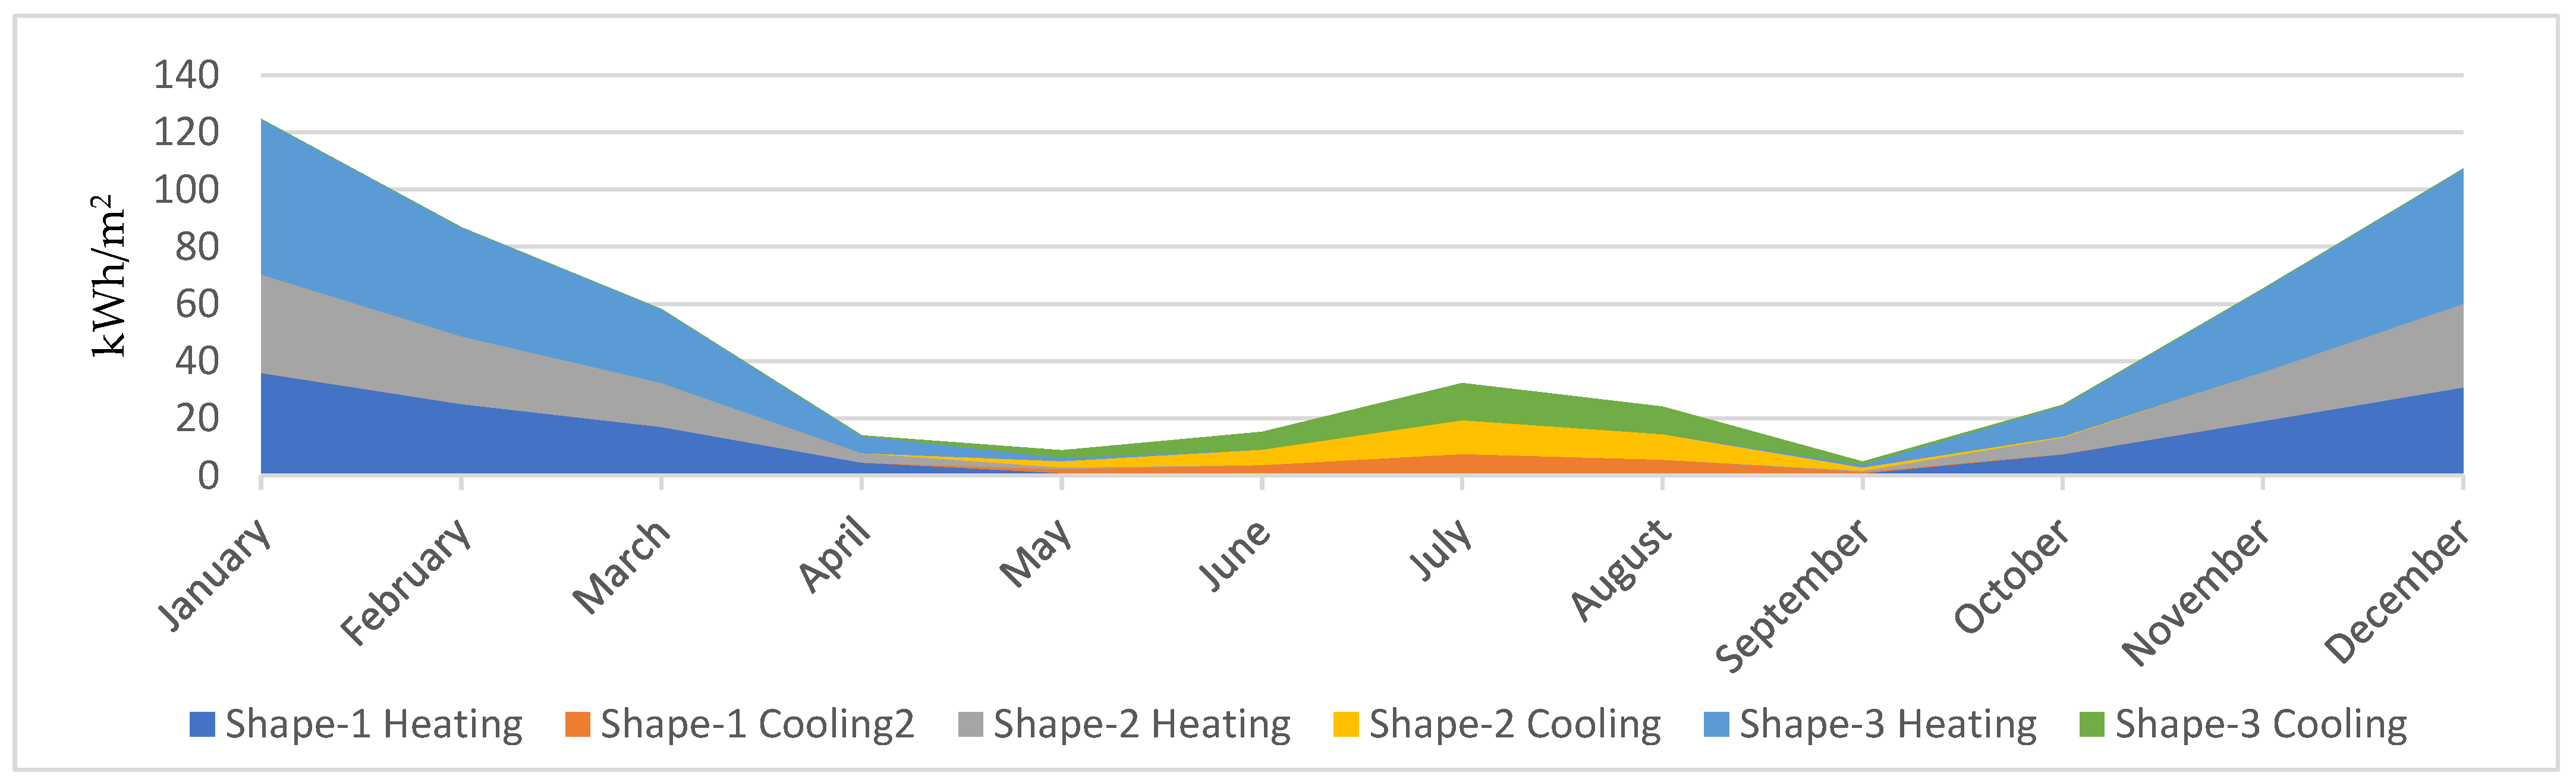
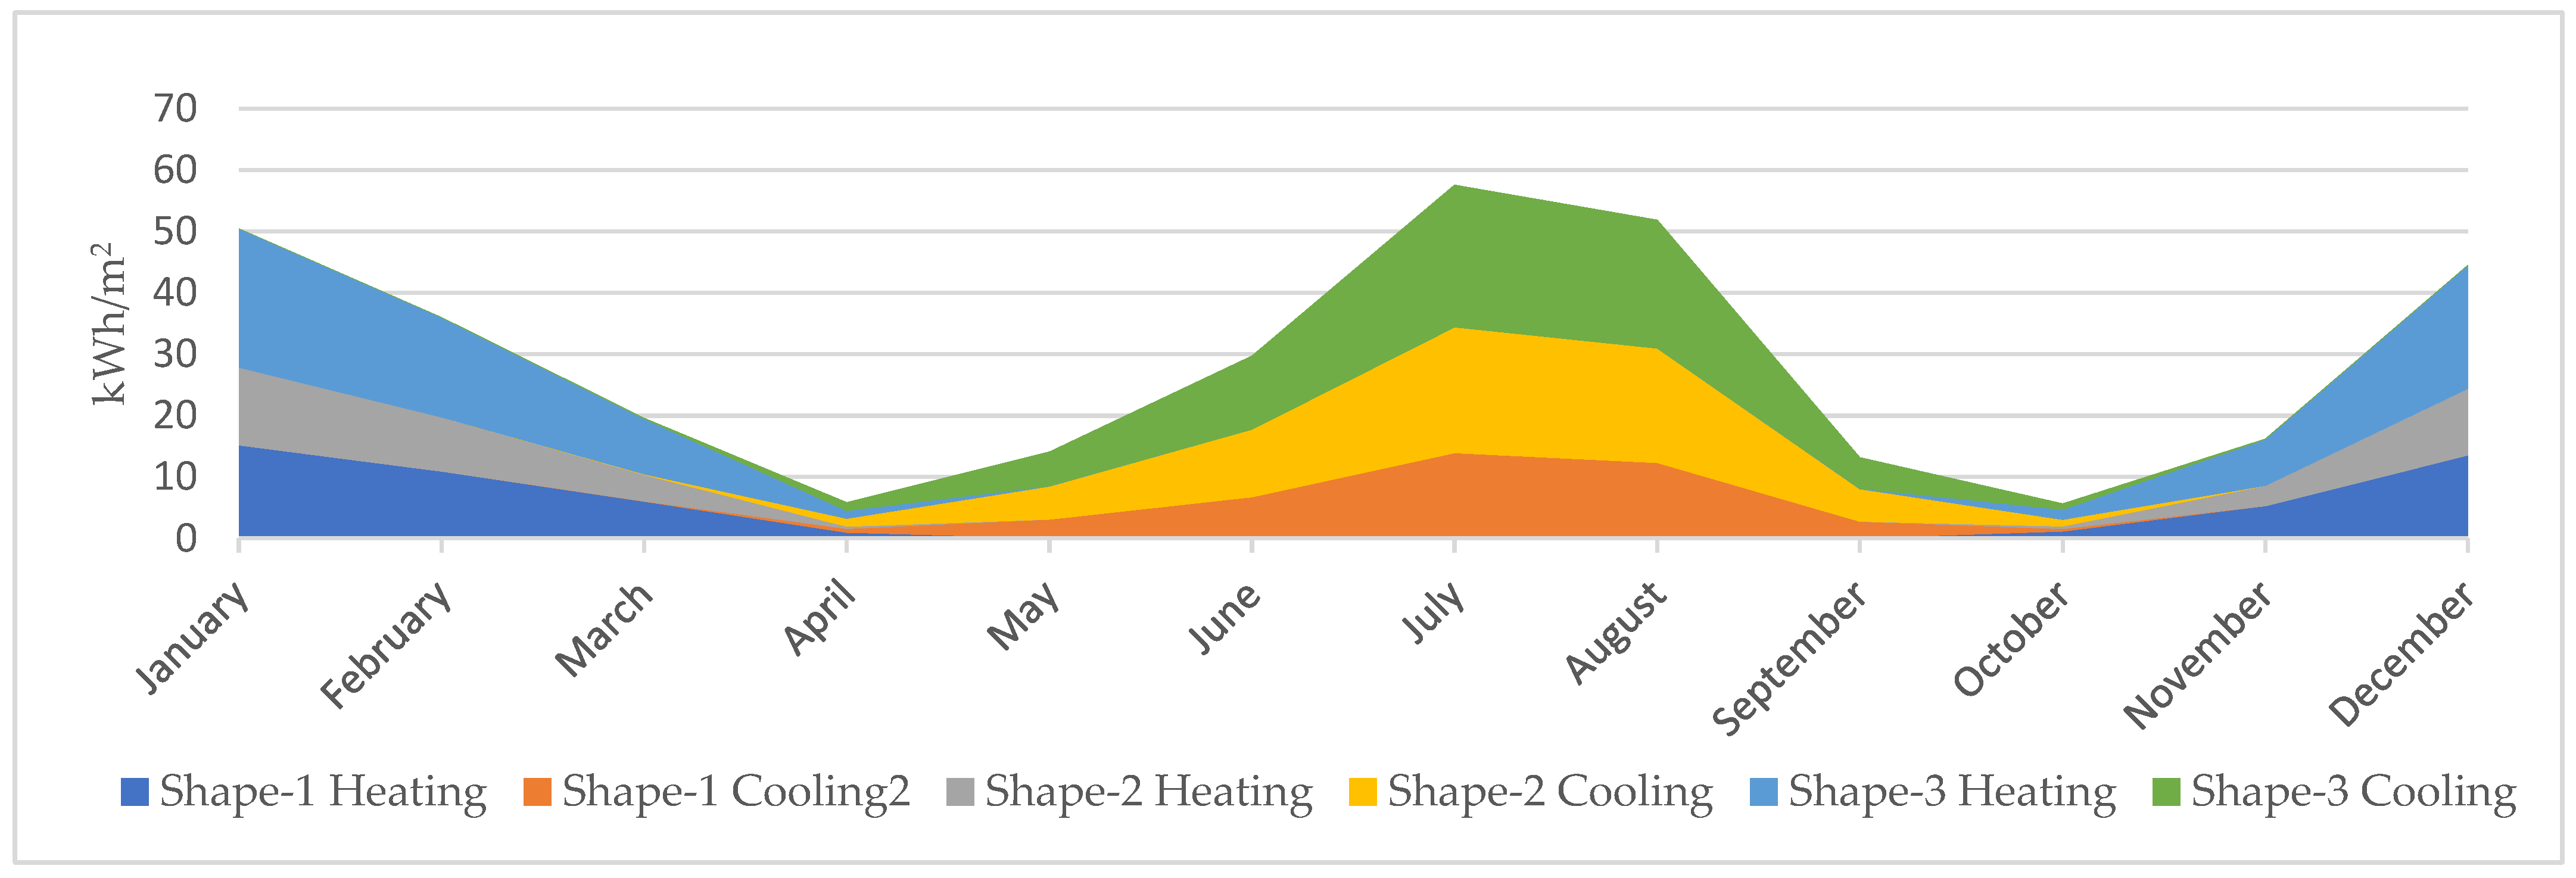
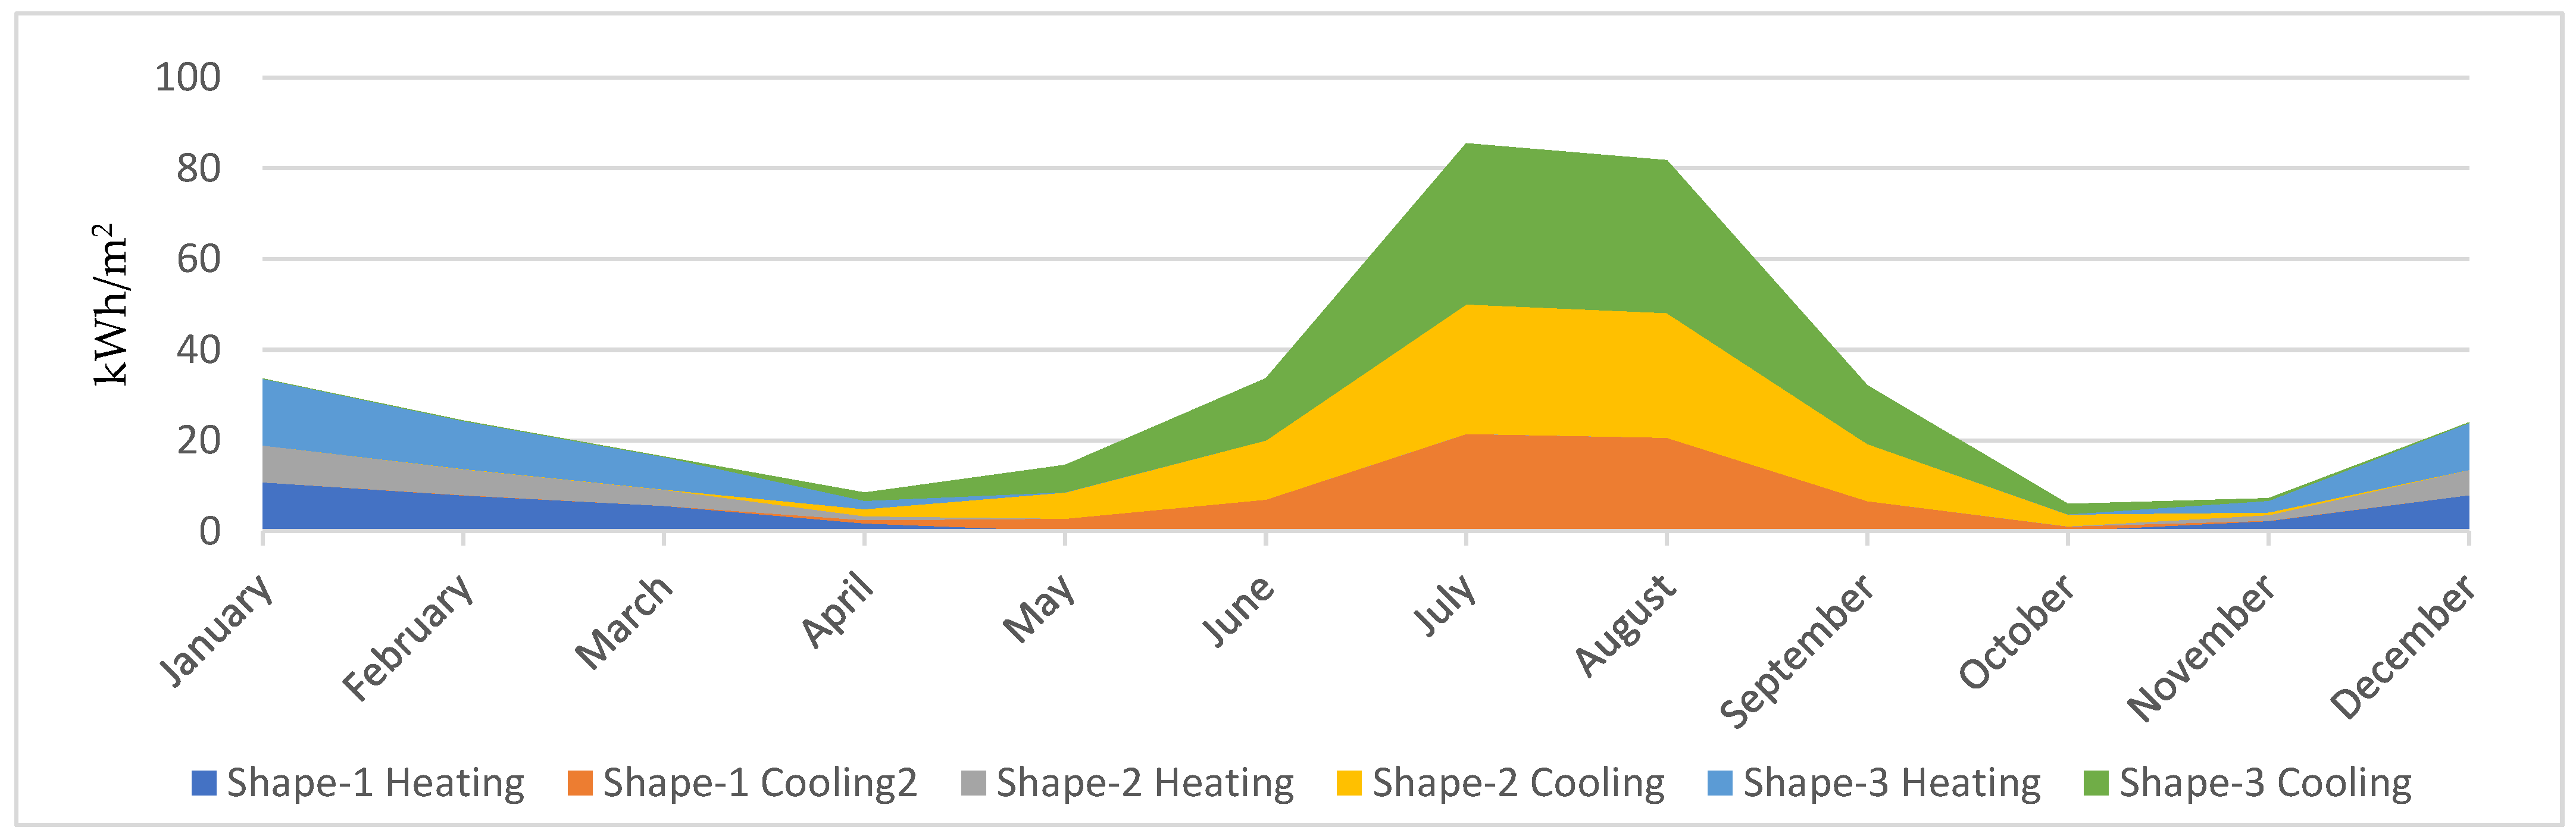
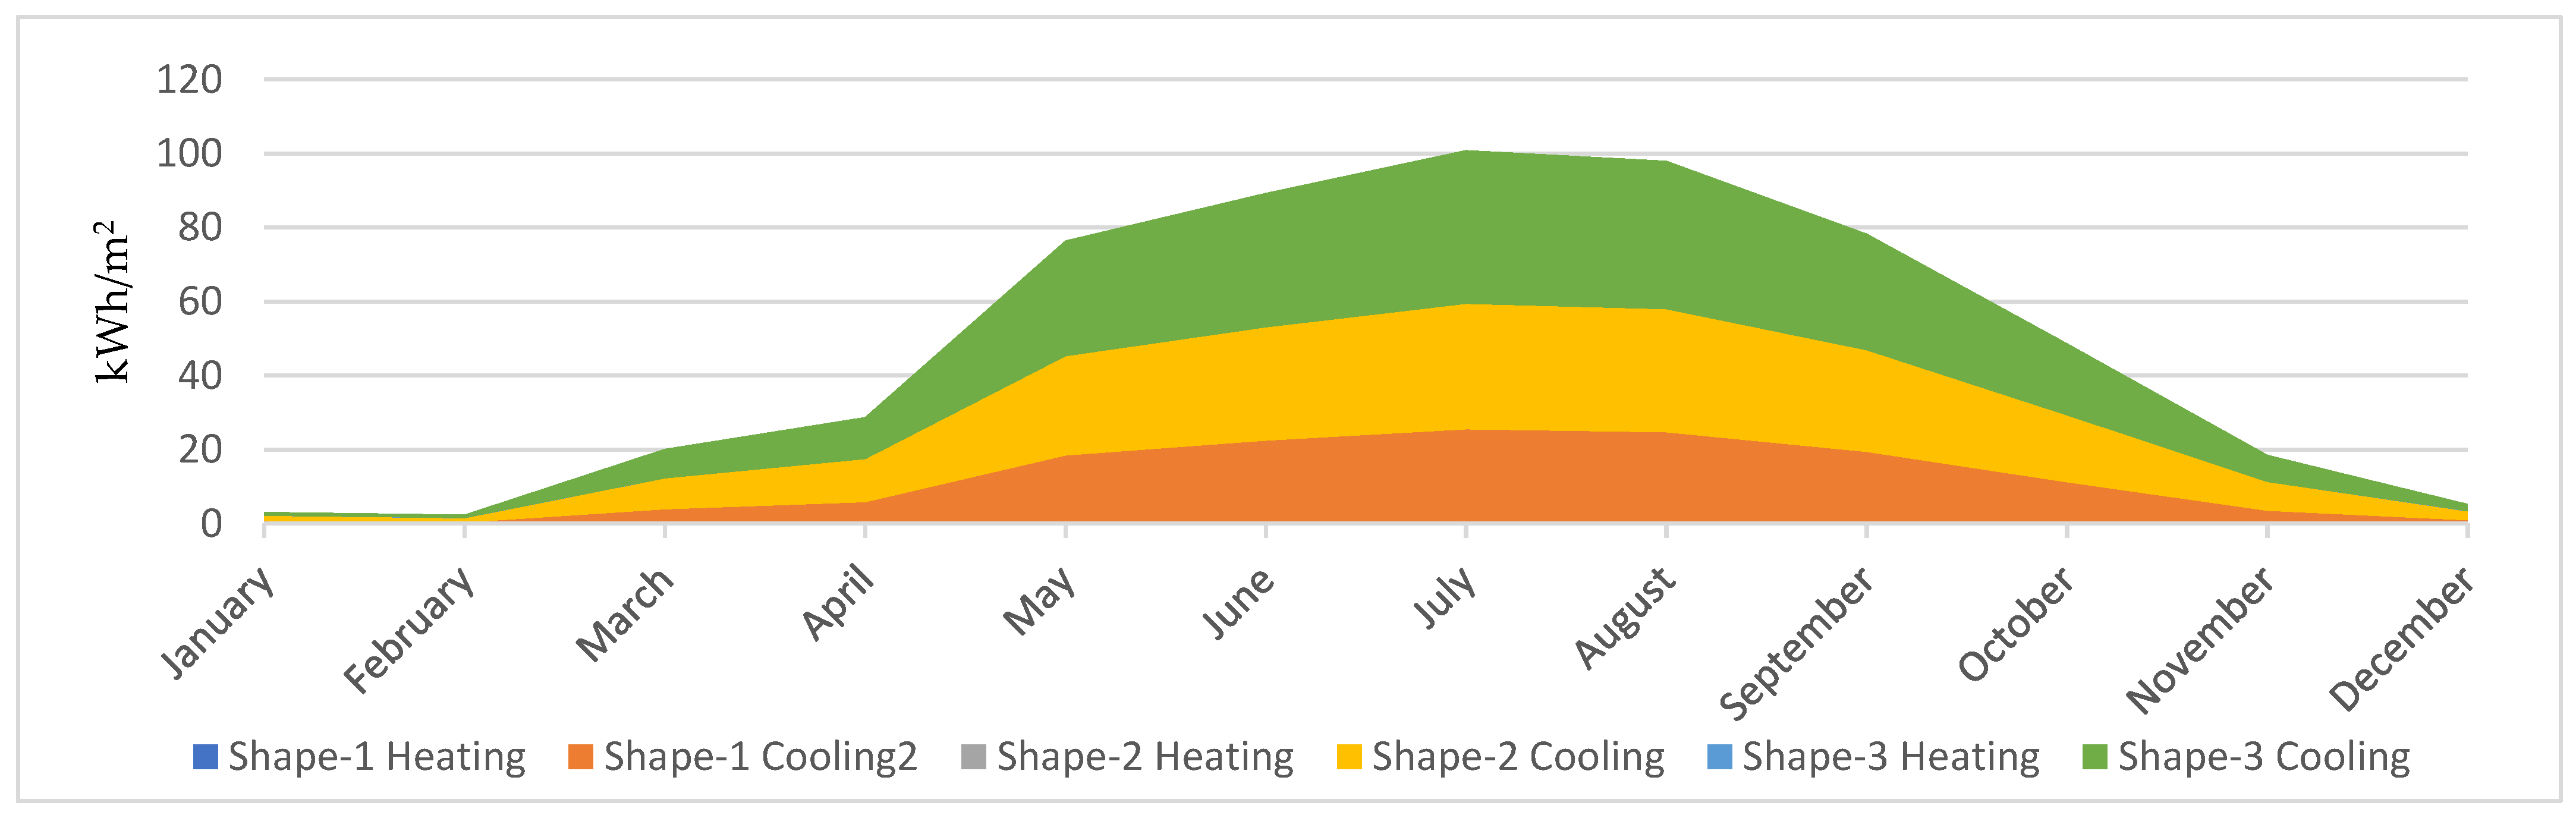
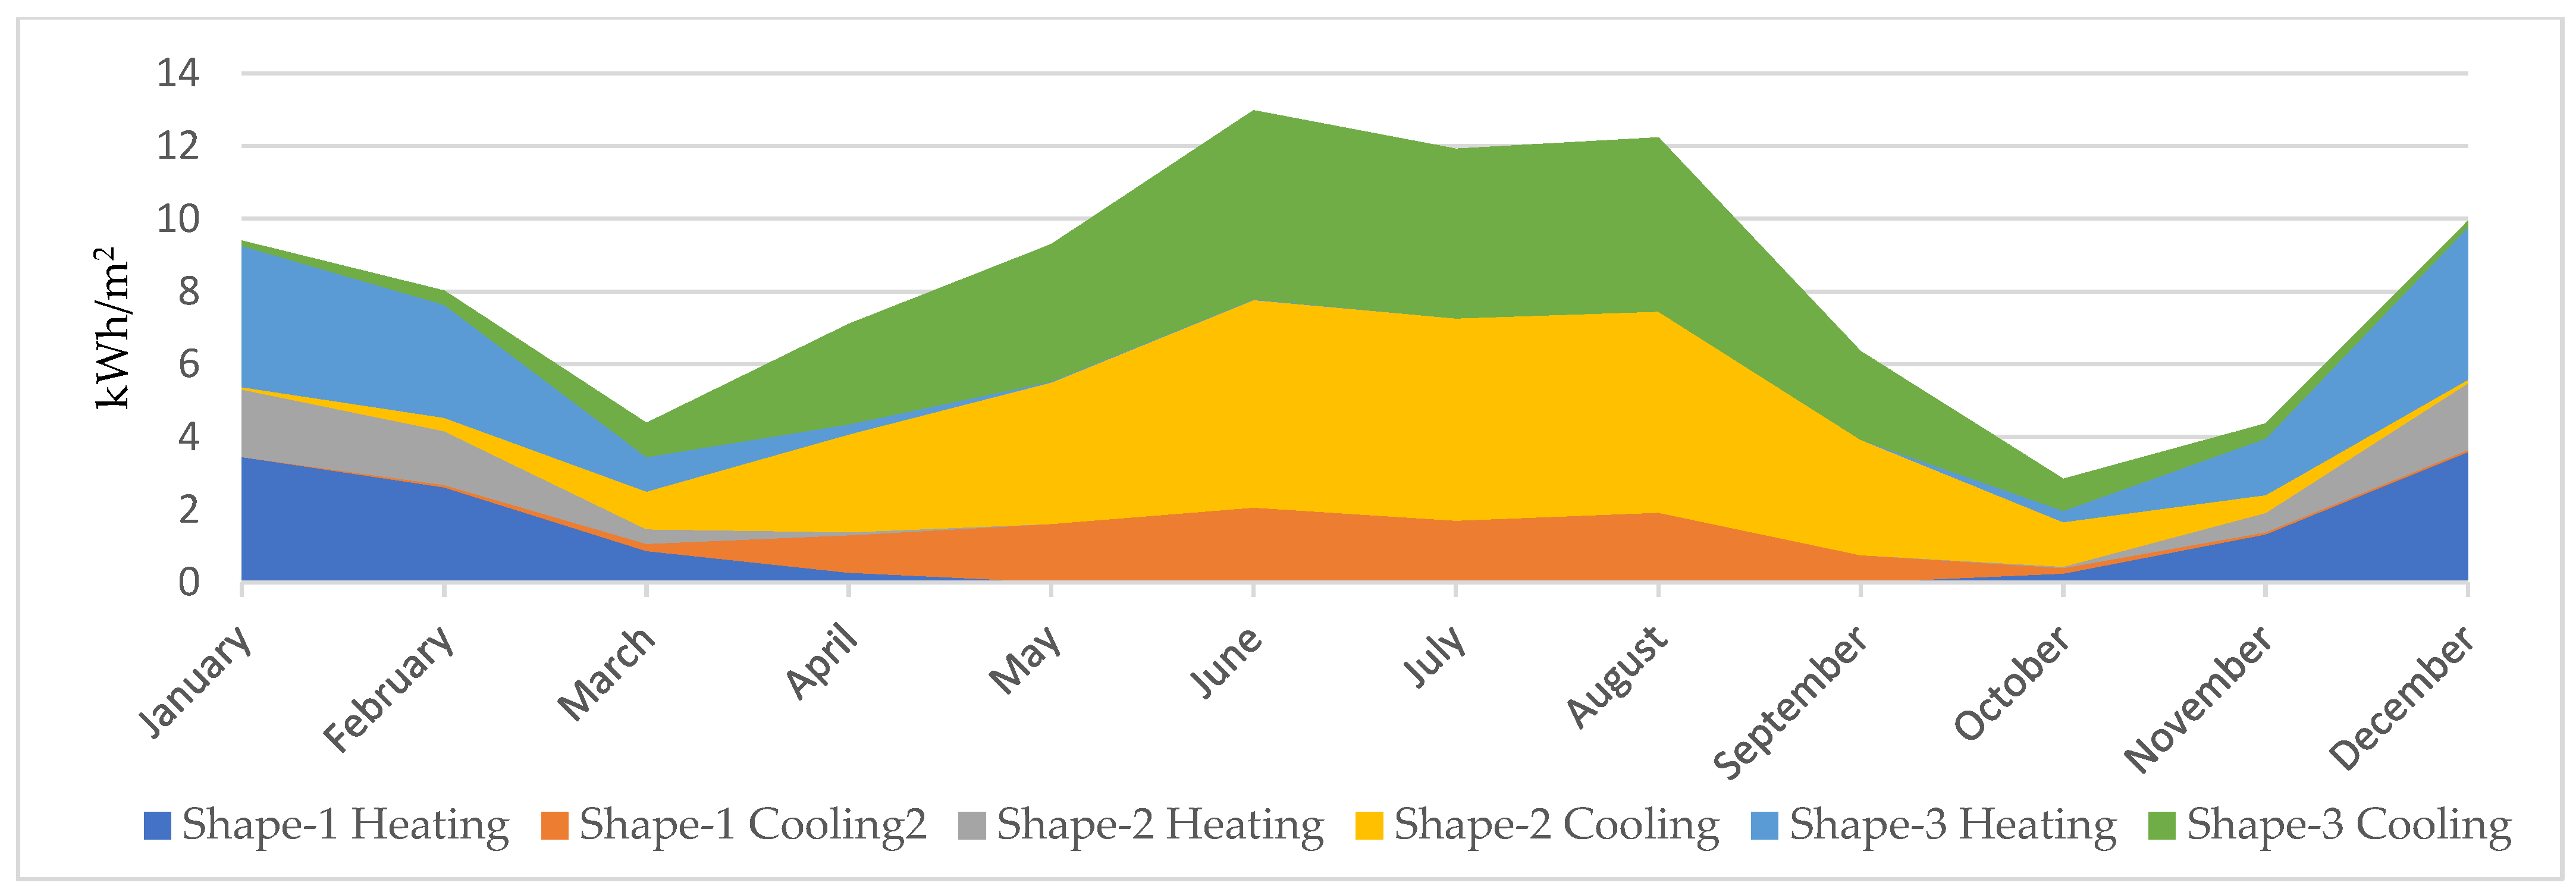
4.2. Heating and Cooling Energy Consumption Analysis
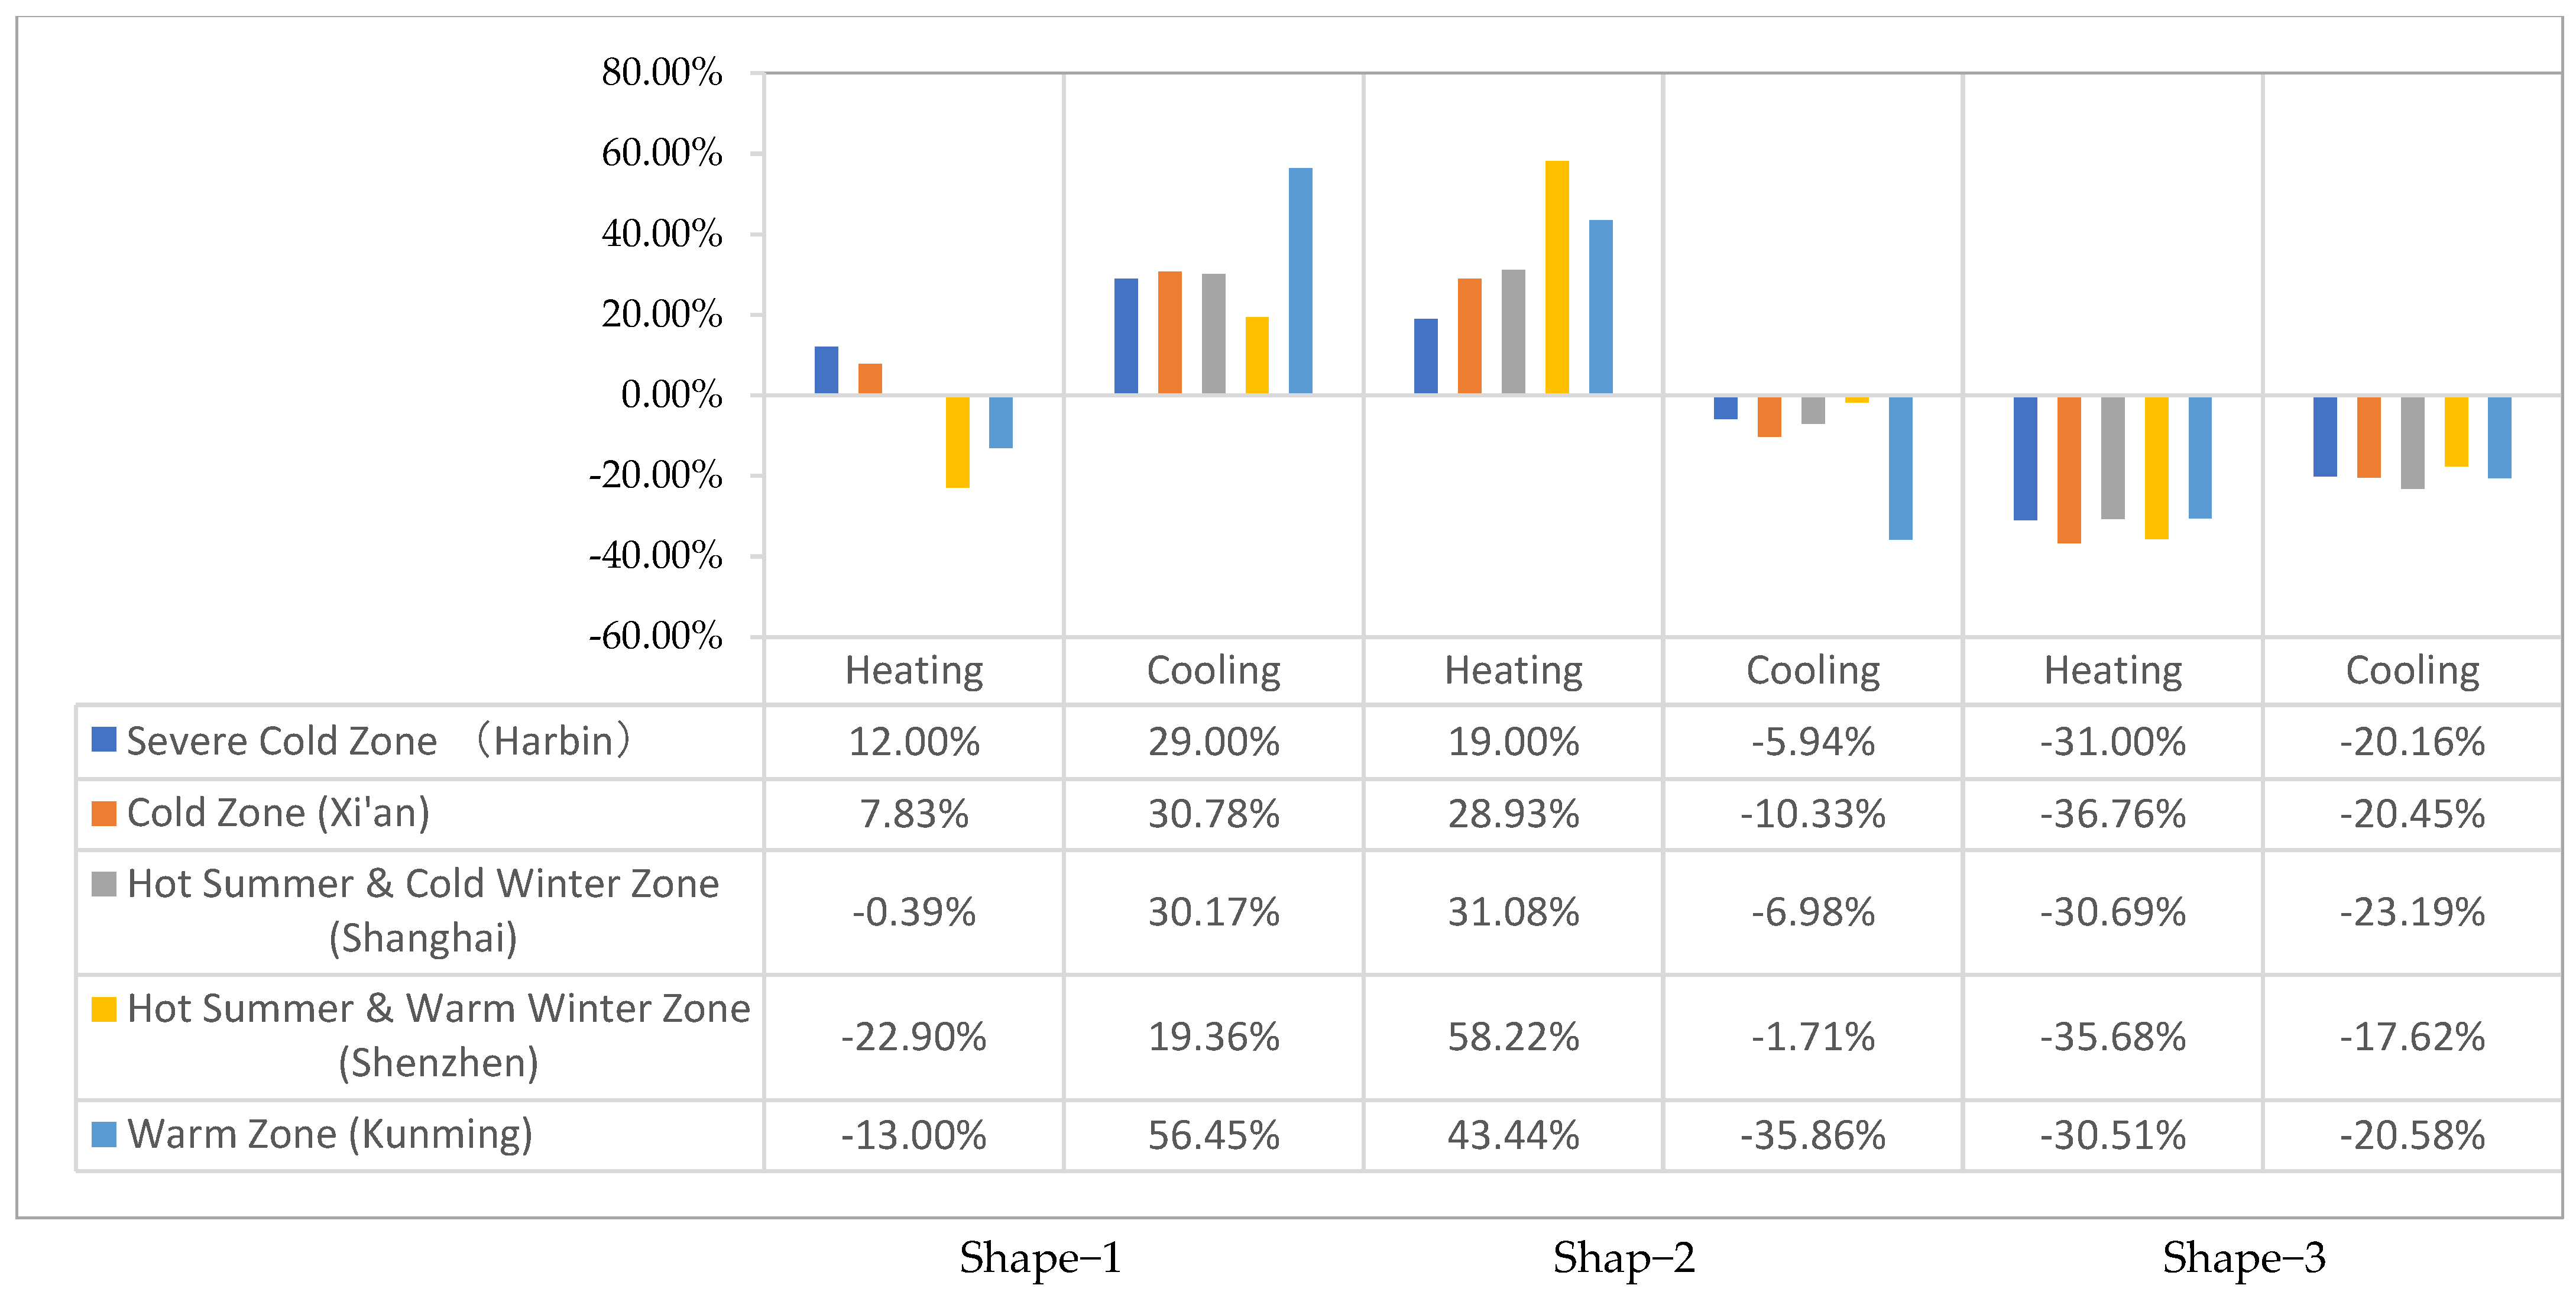
4.3. Analysis of Energy Saving Rate between Three Typical Models
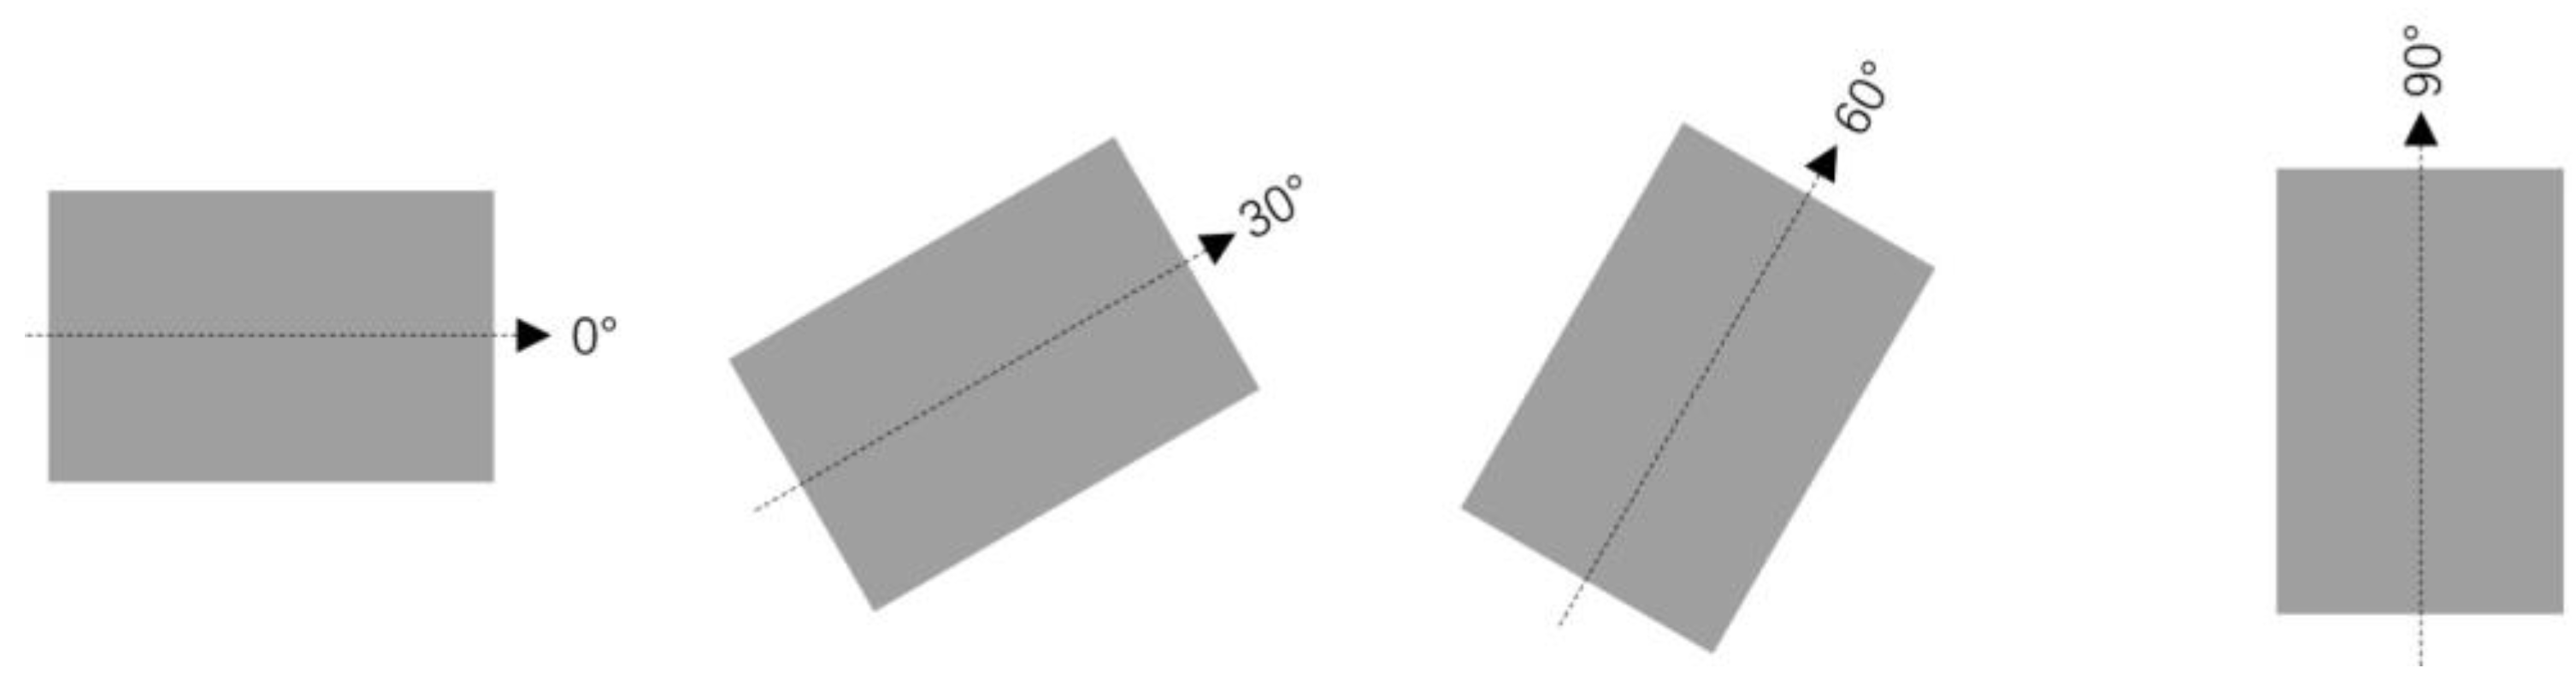
5. Analysis of the Building Orientation Effect on Energy Consumption
5.1. Detailed Discussion of the Results for Severe Cold Zone (Harbin)
5.2. Detailed Discussion of the Results for Cold Zone (Xi’an)
5.3. Detailed Discussion of the Results for Hot Summer and Cold Winter Zone (Shanghai)
5.4. Detailed Discussion of the Results for Hot Summer and Warm Winter Zone (Shenzhen)
5.5. Detailed Discussion of the Results for Warm Zone (Kunming)
6. Discussion
7. Conclusions
Author Contributions
Funding
Institutional Review Board Statement
Informed Consent Statement
Conflicts of Interest
References
- Statistical Bulletin of the People’s Republic of China on National Economic and Social Development in 2021. Available online: http://www.gov.cn/xinwen/2022-02/28/content_5676015.htm (accessed on 8 September 2020).
- Balali, A.; Valipour, A. Prioritization of passive measures for energy optimization designing of sustainable hospitals and health centres. J. Build. Eng. 2020, 35, 101992. [Google Scholar] [CrossRef]
- Jiang, Y. Research Report on Annual Development of Building Energy Efficiency in China; China Architecture & Building Press: Beijing, China, 2018. [Google Scholar]
- Zhu, Y.; Gan, N. Analysis and countermeasures on large general hospital energy saving management. Chin. Hosp. 2011, 15, 73–75. [Google Scholar]
- Shanshan, Y.; Wei, X. Research on evaluation method of energy system of green hospital building. Build. Sci. 2014, 30, 1–7. [Google Scholar]
- Xiaodong, D.; Liang, C. The status quo of building energy and equipment management in large hospitals in China. Intell. Build. Smart City 2015, 6, 66–68. [Google Scholar]
- Chaoyang, L.; Zhou, L.; Pingfang, H.; Fei, L.; Na, Z.; Zhangning, J. Analysis of Energy Consumption of Some Grade–A Hospital Buildings in Wuhan. Build. Energy Effic. 2017, 45, 110–113+117. [Google Scholar]
- Liping, Z.; Zhixin, L.; Jian, G. Research on building energy consumption audit and energy-saving measures for a hospital in Shanghai. Ind. Constr. 2008, 06, 9–11+101. [Google Scholar]
- Liying, L.; Xiangzhao, F. Energy Consumption Modes and Evaluation Indicators of Hospital Buildings: A Review. Build. Energy Effic. 2014, 42, 90–94. Available online: http://en.cnki.com.cn/Article_en/CJFDTOTAL-FCYY201410034.htm (accessed on 4 December 2020).
- Shan, C. Study on Low Energy Consumption of Large Hospital Building in Xian Area. Master’s Thesis, Chang’an University, Xi’an, China, 2012. [Google Scholar]
- Pang, Z.; O’Neill, Z.; Li, Y.; Niu, F. The Role of Sensitivity Analysis in the Building Performance Analysis:A Critical Review. Energy Build. 2020, 209, 1–28. [Google Scholar] [CrossRef]
- Andre, P.; Lebrun, J.; Ternoveanu, A. Bringing simulation to application.Some guidelines and practical recommandations issued from IEA-BCS Annex 30. Build. Simul. 1999, 99, 1189–1194. [Google Scholar]
- Kai, C.; Heng, L. Green Architecture Design Guidelines; China Architecture & Building Press: Beijing, China, 2021. [Google Scholar]
- Du, T.; Jansen, S.; Turrin, M.; Dobbelsteen, A.V.D. Effect of space layouts on the energy performance of office buildings in three climates. J. Build. Eng. 2021, 39, 102198. [Google Scholar] [CrossRef]
- Liu, L.; Lin, B.; Peng, B. Correlation analysis of building plane and energy consumption of high-rise office building in cold zone of China. Build. Simul. 2015, 8, 487–498. [Google Scholar] [CrossRef]
- Yeretzian, A.; Partamian, H.; Dabaghi, M.; Jabr, R. Integrating building shape optimization into the architectural design process. Archit. Sci. Rev. 2019, 63, 63–73. [Google Scholar] [CrossRef]
- Wang, S.; Zhang, Q.; Liu, P.; Liang, R.; Fu, Z. A Parameterized Design Method for Building a Shading System Based on Climate Adaptability. Atmosphere 2022, 13, 1244. [Google Scholar] [CrossRef]
- Jain, N.; Burman, E.; Stamp, S.; Shrubsole, C.; Bunn, R.; Oberman, T.; Barrett, E.; Aletta, F.; Kang, J.; Raynham, P.; et al. Building Performance Evaluation of a New Hospital Building in the UK: Balancing Indoor Environmental Quality and Energy Performance. Atmosphere 2021, 12, 115. [Google Scholar] [CrossRef]
- Liu, H.; Pan, Y.; Yang, Y.; Huang, Z. Evaluating the impact of shading from surrounding buildings on heating/ cooling energy demands of different community forms. Build. Environ. 2021, 206, 108322. [Google Scholar] [CrossRef]
- Asim, N.; Badiei, M.; Mohammad, M.; Razali, H.; Rajabi, A.; Haw, L.C.; Ghazali, M.J. Sustainability of Heating, Ventilation and Air-Conditioning (HVAC) Systems in Buildings—An Overview. Int. J. Environ. Res. Public Health 2022, 19, 1016. [Google Scholar] [CrossRef]
- Panagiotou, D.K.; Dounis, A.I. Comparison of Hospital Building’s Energy Consumption Prediction Using Artificial Neural Networks, ANFIS, and LSTM Network. Energies 2022, 15, 6453. [Google Scholar] [CrossRef]
- Zhao, J.; Shi, X.; Jin, X. A Comparative Study on International Standard Methodologies of Building Energy Simulation. J. Hum. Settl. West China 2017, 32, 64–70. [Google Scholar] [CrossRef]
- Liu, Y.-C.; Chakrabarti, A.; Bligh, T. Towards an ‘ideal’ approach for concept generation. Des. Stud. 2003, 24, 341–355. [Google Scholar] [CrossRef]
- Li, C.; Tang, H. Study on ventilation rates and assessment of infection risks of COVID-19 in an outpatient building. J. Build. Eng. 2021, 42, 103090. [Google Scholar] [CrossRef]
- Xiqiu, H. Overall layout of hospitals in change. Constr. Des. Eng. 2001, 03, 3–5. [Google Scholar]
- Jin, M. The Research on the Sustainable Design of Out-Patient Department Space in General Hospital. Master’s Thesis, Beijing University of Technology, Beijing, China, 2009. [Google Scholar]
- Shizhi, Z.; Jingzong, W.; Shuying, H.; Di’an, N. Design considerations for large scale general hospital architecture master planning. Chin. Hosp. Archit. Equip. 2015, 05, 33–40. [Google Scholar]
- Arnolds, I.V.; Gartner, D. Improving hospital layout planning through clinical pathway mining. Ann. Oper. Res. 2017, 263, 453–477. [Google Scholar] [CrossRef]
- Bing, S. Research on History and Development of Hospital Buildings in Canton (Since 1835). Ph.D. Thesis, South China University of Technology, Guangdong, China, 2018. [Google Scholar]
- Lather, J.I.; Logan, T.; Renner, K.; Messner, J.I. Implementation and Evaluation of Generative Layout Options Using the Graph Theoretical Approach for a Hospital Layout Problem. J. Comput. Civ. Eng. 2020, 34, 04020014. [Google Scholar] [CrossRef]
- Shaopeng, W.; Miao, Z. Study on outpatient layout design of large general hospital—Take the outpatient building of a large general hospital in sichuan province as an example. Fujian Archit. Constr. 2019, 11, 7–10+25. [Google Scholar]
- Caplan, J.; Clements, R.; Chadwick, C.; Kadirgamar, J.; Morgan, J.; Rao, A. Medical Education in 2020: Developing COVID Secure Undergraduate Hospital Placements. Med. Sci. Educ. 2020, 30, 1677–1683. [Google Scholar] [CrossRef]
- Wahyuningrum, S.H.; Wardhani, M.K. Efficiency of inpatient layout in private hospital (Case Study: Bhakti Asih Hospital, Brebes Central Java). MODUL 2020, 20, 1–9. [Google Scholar] [CrossRef]
- Zhao, C.-W.; Yang, J.; Li, J.-T. Generation of hospital emergency department layouts based on generative adversarial networks. J. Build. Eng. 2021, 43, 102539. [Google Scholar] [CrossRef]
- Ministry of Housing and Urban-Rural Development of the People’s Republic of China. Thermal Design Code for Civil Building; China Architecture & Building Press: Beijing, China, 2016; 90p. [Google Scholar]
- Rahman, M.; Rasul, M.; Khan, M. Energy conservation measures in an institutional building in sub-tropical climate in Australia. Appl. Energy 2010, 87, 2994–3004. [Google Scholar] [CrossRef]
- Yizhao, S.; Qiong, H. Study on the space form of courtyards in outpatient department of hospital in cold climate region based on performance. Archit. J. 2016, S2, 67–71. [Google Scholar]
- Bevilacqua, P.; Bruno, R.; Szyszka, J.; Cirone, D.; Rollo, A. Summer and winter performance of an innovative concept of Trombe wall for residential buildings. Energy 2022, 258, 124798. [Google Scholar] [CrossRef]
- Wei, Y.; Li, W.; Tan, J.; Yuan, J.; Wu, Z.; Li, Y.; Mao, Y.; Huang, D. A Method for Improving the Prediction of Outpatient Visits for Hospital Management: Bayesian Autoregressive Analysis. Comput. Math. Methods Med. 2022, 2022, 4718157. [Google Scholar] [CrossRef] [PubMed]
- Kohansal, M.E.; Akaf, H.R.; Gholami, J.; Moshari, S. Investigating the simultaneous effects of building orientation and thermal insulation on heating and cooling loads in different climate zones. Arch. Eng. Des. Manag. 2021, 18, 410–433. [Google Scholar] [CrossRef]


| Country | Scholar | Time | Research Direction | Shape Type Mentioned/Analyzed |
|---|---|---|---|---|
| China | Huang Xiqiu et al. [25] | 2001 | Building density | (1) Centralized-type; (2) corridor-type; and (3) decentralized-type. |
| China | Ma Jin et al. [26] | 2009 | Building layout | (1) Corridor-type; (2) street-type; (3) courtyard-type; and (4) combination-type. |
| China | Zhang Shizhi et al. [27] | 2015 | Building layout | (1) Courtyard-type; (2) street-type; (3) centralized-type; and (4) semi centralized-type. |
| Germany | Ines Verena Arnolds et al. [28] | 2017 | Pathway design | (1) Street-type; (2) courtyard-type; and (3) semi centralized-type. |
| China | Sun Bing et al. [29] | 2018 | Building layout | (1) street-type; (2) covered courtyard-type; (3) alley-type; and (4) plate-type. |
| The United States | Jennifer I. Lather et al. [30] | 2019 | Building shape | (1) Covered courtyard-type; (2) vertical combined-type; and (3) street-type. |
| China | Wu Shaopeng et al. [31] | 2019 | Building density | (1) Streets-type; (2) courtyard-type; and (3) plate-type. |
| UK | Joshua Caplan et al. [32] | 2020 | Social distance | (1) Centralized-type; (2) semi centralized-type; (3) street-type; and (4) decentralized-type. |
| Indonesia | Sri Hartuti Wahyuningrum et al. [33] | 2020 | Efficiency of space using. | (1) Decentralized-type, and (2) centralized-type. |
| China | Zhao Chao Wang [34] | 2021 | Pathway design | (1) Centralized-type, and (2) corridor-type. |
 |  |  |  |  |
 |  |  |  |  |
| BeiJing City | Binzhou, Shandong province | Jinan, Shandong province | Xi’an, Shaanxi province | Xi’an, Shaanxi province |
| Combined-type | Centralized-type | Plate-type | Centralized-type | Corridor-type |
| Building shape of cold zone samples | ||||
 |  |  |  |  |
 |  |  |  |  |
| Harbin, Heilongjiang province | Hohhot, Inner Mongoria IM province | Changchun, Jilin Province | Shenyang, Liaoning Province | Urumqi City, Xinjiang Uygur Autonomous Region |
| Combined-type | Plate-type | Decentralized-type | Vertical combined-type | Plate-type |
| Building shape of severe cold zone samples | ||||
 |  |  |  |  |
 |  |  |  |  |
| Chengdu, Sichuan Province | Guilin, Guangxi Province | Nanjing, Jiangsu Province | Shanghai | Changsha, Hunan Province |
| Plate-type | Plate-type | Semi centralized-type | Semi centralized-type | Street-type |
| Building shape of hot summer and cold winter zone samples | ||||
 |  |  |  |  |
 |  |  |  |  |
| Guangzhou, Guangdong Province | Haikou, Hainan Province | Putian, Fujian Province | Xiamen, Fujian Province | Shenzhen |
| Centralized-type | Centralized-type | Corridor-type | Decentralized-type | Centralized-type |
| Building shape of hot summer and warm winter zone samples | ||||
 |  |  |  |  |
 |  |  |  |  |
| Dali, Yunnan Province | Guiyang, Guizhou Province | Guiyang, Guizhou Province | Kunming, Yunnan Province | Kunming, Yunnan Province |
| Plate-type | Centralized-type | Street-type | Centralized-type | Centralized-type |
| Building shape of warm zone samples | ||||
| Summer | ||||||
|---|---|---|---|---|---|---|
| Harbin | Xi’an | Shanghai | Shenzhen | Kunming | ||
| Mean solar irradiance (W/m2) (July) | S | 75.4 | 93.5 | 76.4 | 58.9 | 61.2 |
| W(E) | 31.9 | 151.8 | 151.6 | 145.1 | 148.3 | |
| N | 25.3 | 72.0 | 67.4 | 81.1 | 86.0 | |
| H | 145.8 | 312.0 | 315.4 | 304.9 | 310.9 | |
| Mean wind speed (m/s) | 3.2 | 1.7 | 3.8 | 3.2 | 2.1 | |
| Mean temperature of coldest month (°C) | 22.8 | 26.4 | 27.8 | 28.4 | 19.8 | |
| Winter | ||||||
| Mean solar irradiance (W/m2) (January) | S | 128.9 | 104.4 | 136.2 | 215.8 | 193.3 |
| W(E) | 49.7 | 59.2 | 63.7 | 73.8 | 84.5 | |
| N | 28.0 | 42.8 | 53.1 | 40.3 | 46.6 | |
| H | 697 | 91.4 | 103.9 | 183.7 | 128.2 | |
| Mean wind speed (m/s) | 3.6 | 1.7 | 3.0 | 2.2 | 2.5 | |
| Mean temperature of coldest month (°C) | −19.4 | −0.9 | 3.5 | 13.3 | 7.7 | |
| Function | Temperature (Summer/Winter) | Humidity (Summer/Winter) | Occupant Density (Persons/m2) | Power Density of Equipment (W/m2) |
|---|---|---|---|---|
| Outpatient department | 26 °C/20 °C | 60%/40% | 0.17 | 20 |
| Medical technology department | 26 °C/22 °C | 65%/30% | 0.10 | 64 |
| Circulation space | 27 °C/18 °C | 60%/35% | 0.25 | 13 |
| Harbin | Xi’an | Shanghai | Shenzhen | Kunming | |
|---|---|---|---|---|---|
| U value (W/m2·K) | 1.93 | 2.32 | 2.58 | 2.61 | 2.85 |
| Solar heat gain coefficient (SHGC) | 0.63 | 0.63 | 0.35 | 0.30 | 0.36 |
| Construction of the Exterior Wall | ||
|---|---|---|
| Location | Layers (from inside to outside) | U value (W/m2·K) |
| Harbin | 20 mm gypsum plaster + 120 mm concrete blocks (medium-weight (MW)) + 70 mm foam-polyurethane, freon-filled + 120 mm concrete blocks (lightweight) | 0.29 |
| Xi’an | 20 mm gypsum plaster + 200 mm concrete blocks (lightweight) + 50 mm foam-polyurethane + 20 mm lime plaster | 0.32 |
| Shanghai | 20 mm gypsum plaster + 200 mm concrete blocks (MW) + 35 mm foam-polyisocyanate + 20 mm lime plaster | 0.55 |
| Shenzhen | 20 mm gypsum plaster + 200 mm concrete blocks (lightweight) + 20 mm lime plaster | 0.77 |
| Kunming | 25 mm cement plaster + 200 mm hollow concrete blocks (lightweight) + 20 mm gypsum plaster | 1.48 |
| Construction of the interior wall | ||
| 20 mm gypsum plaster + 180 mm concrete blocks (MW) + 20 mm gypsum plaster | 1.4 | |
| Construction of the Roof | ||
|---|---|---|
| Location | Layers (from inside to outside) | U value (W/m2·K) |
| Harbin | 20 mm gypsum plaster + 120 mm cast concrete (lightweight) + 60 mm air gap (downwards) + 90 mm foam-polyurethane, freon-filled + 10 mm asphalt | 0.26 |
| Xi’an | 20 mm gypsum plaster + 100 mm cast concrete (lightweight) + 50 mm air gap (downwards) + 60 mm foam-polyurethane + 10 mm asphalt | 0.35 |
| Shanghai | 20 mm gypsum plaster + 100 mm cast concrete (lightweight) + 50 mm air gap (downwards) + 40 mm foam-polyurethane + 10 mm asphalt | 0.47 |
| Shenzhen | 20 mm gypsum plaster + 100 mm cast concrete (lightweight) + 50 mm air gap (downwards) + 25 mm MW glass wool (rolls) + 10 mm asphalt | 0.76 |
| Kunming | 25 mm gypsum plaster + 100 mm cast concrete (lightweight) + 50 mm air gap (downwards) + 25 mm MW glass wool (rolls) + 10 mm asphalt | 0.76 |
| Construction of the floor | ||
| 9 mm ceramic floor tiles + 20 mm cement screed + 100 mm cast concrete (lightweight) + 20 mm plaster ceiling tiles | 1.63 | |
| Layout | Orientation | Harbin kWh/(m2·a) | Xi’an kWh/(m2·a) | Shanghai kWh/m2·a) | Shenzhen kWh/(m2·a) | Kunming kWh/(m2·a) |
|---|---|---|---|---|---|---|
| Shape-1 | 0° | 160.124 | 92.367 | 96.005 | 138.265 | 21.254 |
| 30° | 161.354 | 93.125 | 95.369 | 138.917 | 21.976 | |
| 60° | 163.014 | 94.368 | 96.475 | 139.324 | 22.248 | |
| 90° | 165.256 | 96.389 | 97.321 | 140.018 | 23.147 | |
| Shape-2 | 0° | 159.964 | 106.254 | 118.325 | 202.358 | 37.035 |
| 30° | 160.811 | 105.024 | 117.218 | 203.124 | 36.958 | |
| 60° | 161.964 | 103.268 | 117.032 | 203.814 | 36.048 | |
| 90° | 162.500 | 102.354 | 116.695 | 204.040 | 35.247 | |
| Shape-3 | 0° | 241.677 | 145.213 | 154.328 | 231.985 | 39.684 |
| 30° | 243.513 | 147.763 | 155.013 | 230.847 | 40.806 | |
| 60° | 244.875 | 148.165 | 155.951 | 233.547 | 41.367 | |
| 90° | 245.821 | 148.916 | 156.330 | 234.186 | 41.968 |
| Typical Model | Harbin kWh/(m2·a) | Xi’an kWh/(m2·a) | Shanghai kWh/(m2·a) | Shenzhen kWh/(m2·a) | Kunming kWh/(m2·a) | ||||||
|---|---|---|---|---|---|---|---|---|---|---|---|
| Heating | Cooling | Heating | Cooling | Heating | Cooling | Heating | Cooling | Heating | Cooling | ||
| Shape-1 | 0° | 141.954 | 17.307 | 50.895 | 36.861 | 35.324 | 58.955 | 1.732 | 137.203 | 10.289 | 7.730 |
| 30° | 142.042 | 19.295 | 53.083 | 43.399 | 36.330 | 60.947 | 2.724 | 137.227 | 12.270 | 8.712 | |
| 60° | 142.742 | 19.078 | 52.918 | 39.782 | 36.336 | 60.321 | 2.756 | 135.258 | 12.387 | 9.565 | |
| 90° | 143.954 | 19.992 | 52.674 | 42.979 | 36.160 | 60.325 | 2.696 | 136.304 | 12.086 | 9.421 | |
| Shape-2 | 0° | 129.946 | 27.100 | 42.350 | 63.513 | 25.941 | 92.403 | 0.881 | 200.076 | 6.956 | 27.878 |
| 30° | 131.164 | 28.636 | 41.977 | 62.679 | 24.925 | 92.495 | 0.829 | 201.078 | 6.651 | 28.958 | |
| 60° | 131.986 | 28.769 | 41.785 | 61.226 | 24.543 | 92.430 | 0.799 | 202.871 | 6.204 | 29.244 | |
| 90° | 133.497 | 29.003 | 40.648 | 60.988 | 24.177 | 93.260 | 0.736 | 203.104 | 6.120 | 29.892 | |
| Shape-3 | 0° | 213.096 | 31.280 | 76.692 | 68.732 | 45.352 | 105.997 | 3.962 | 229.531 | 16.400 | 24.822 |
| 30° | 213.658 | 32.145 | 77.229 | 69.173 | 46.324 | 106.147 | 3.544 | 230.432 | 15.998 | 25.723 | |
| 60° | 214.233 | 32.639 | 78.528 | 69.235 | 47.302 | 106.434 | 3.150 | 230.792 | 15.317 | 26.488 | |
| 90° | 214.935 | 32.986 | 78.946 | 69.979 | 47.935 | 106.952 | 2.258 | 230.911 | 14.385 | 26.556 | |
Publisher’s Note: MDPI stays neutral with regard to jurisdictional claims in published maps and institutional affiliations. |
© 2022 by the authors. Licensee MDPI, Basel, Switzerland. This article is an open access article distributed under the terms and conditions of the Creative Commons Attribution (CC BY) license (https://creativecommons.org/licenses/by/4.0/).
Share and Cite
Wei, Y.; Wang, S.; Dang, H.; Liu, P. Climate Adaptability Analysis on the Shape of Outpatient Buildings for Different Climate Zones in China Based on Low-Energy Target. Atmosphere 2022, 13, 2121. https://doi.org/10.3390/atmos13122121
Wei Y, Wang S, Dang H, Liu P. Climate Adaptability Analysis on the Shape of Outpatient Buildings for Different Climate Zones in China Based on Low-Energy Target. Atmosphere. 2022; 13(12):2121. https://doi.org/10.3390/atmos13122121
Chicago/Turabian StyleWei, Youman, Siyan Wang, Hongwei Dang, and Peng Liu. 2022. "Climate Adaptability Analysis on the Shape of Outpatient Buildings for Different Climate Zones in China Based on Low-Energy Target" Atmosphere 13, no. 12: 2121. https://doi.org/10.3390/atmos13122121