Article

The Summertime Circulation Types over Eurasia and Their Connections with the North Atlantic Oscillation Modulated by North Atlantic SST

Key Laboratory of Meteorological Disaster, Ministry of Education (KLME)/Collaborative Innovation Center on Forecast and Evaluation of Meteorological Disasters (CIC-FEMD)/Joint International Research Laboratory of Climate and Environment Change (ILCEC), Nanjing University of Information Science and Technology, Nanjing 210044, China
*
Author to whom correspondence should be addressed.
Atmosphere 2022, 13(12), 2093; https://doi.org/10.3390/atmos13122093
Submission received: 10 November 2022 / Revised: 30 November 2022 / Accepted: 9 December 2022 / Published: 13 December 2022

Abstract

:
ERA5 monthly averaged reanalysis data during 1979–2020 are used to analyze the anomalous characteristics of summertime circulation types over Eurasia and their connections with the North Atlantic Oscillation (NAO) modulated by North Atlantic sea surface temperature (SST). A circulation index (CI) is defined to describe the anomalous characteristics of summertime circulation types over the Eurasian mid-high latitude and classify the anomalous circulation into a double-ridge type (DR-type) and double-trough type (DT-type). The results show that these anomalous circulation types are closely related to the variation of the western Pacific subtropical high (WPSH), East Asian subtropical jet (EASJ), South Asia high (SAH) and summer precipitation anomalies in China. There is a significant negative correlation between summer NAO and circulation types over Eurasia. The positive CI is favorable for the southward movement of the EASJ and two positive height anomalies over the Ural Mountains and the Sea of Okhotsk, respectively. Accompanied by moisture convergence and a strong ascending motion over the middle and lower reaches of the Yangtze River Valley (MLYRV), the summer rainfall will be above normal. These patterns are reversed in positive NAO-index years. The connection between the NAO and circulation types over Eurasia is modulated by a tri-pole SST anomaly pattern over the North Atlantic, which may induce the NAO-like atmospheric circulation and strengthen the impacts of the NAO on Eurasian circulation types. A wave train from the North Atlantic to East Asia, which is aroused by the tri-pole SST anomaly pattern, is the potential mechanism for linking summer NAO and circulation types over Eurasia.

1. Introduction

Anomalous atmosphere circulation can exert substantial influences on the weather and climate features over the surrounding areas [1,2]. Atmospheric blocking, one of the most notable characteristics of anomalous atmosphere circulation at mid-high latitude, is associated with severe precipitation anomalies and extreme high or low temperatures over East Asia [3,4,5,6]. Studies demonstrate that the double-blocking high type over the Ural Mountains and the Sea of Okhotsk, along with an intensified trough between them, is favorable for persistent low temperature and the occurrence of snowstorm and wet-freezing events in China [7,8]. Moreover, the anomalous precipitation in the Yangtze River Valley (YRV) is found to be greatly affected by the anomalous atmosphere circulation over Eurasia at mid-high latitudes [9,10]. The most severe and devastating summer monsoon flooding in 1998 that occurred along the YRV coincided with mid-tropospheric blocking over northeast Eurasia [11]. The circulation pattern with two blocking high anomaly centers over the eastern Ural Mountains and the western Sea of Okhotsk can facilitate cold air from high latitudes moving southward and westward to the upper YRV and play a key role in abundant rainfall over the YRV [12]. Owing to the upstream wave energy dispersion from the blocking over the Ural Mountains, a much stronger blocking high anomaly develops near the Sea of Okhotsk, which is beneficial for the establishment of the East Asia/Pacific pattern and ultimately contributes to persistent extreme precipitation events in the YRV [13]. Thus, it is necessary to pay attention to the causes of the anomalous circulation over Eurasia.
Previous studies show that the NAO has a remote impact on the downstream weather and climate anomalies over East Asia through teleconnection patterns and the propagation of anomalous planetary wave activity [14,15,16]. Characterized by a north–south dipole of the sea level pressure (SLP) anomalies over the Icelandic low and the Azores high, the NAO is the dominant mode of atmospheric variability over the North Atlantic [17,18]. As the most powerful phenomenon dominating the wintertime Northern Hemisphere, the winter NAO is closely related to the East Asian winter monsoon, which is accompanied by the frequent occurrence of the Ural–Siberian blocking and the strengthening of the East Asian trough [19,20,21]. The NAO can also impact the downstream weather and climate anomalies over East Asia in the subsequent months. The positive winter NAO provides an eastward-extended cooling signal over northern Africa, which reaches India and eastern China in February and March, respectively [22]. A considerable negative correlation is investigated between the December NAO and the East Asian summer monsoon, which is attributed to an atmospheric wave train originating from the North Atlantic [23]. Moreover, many studies show that the impacts of spring NAO/AO on the following East Asian summer monsoon are also evident, which is significantly correlated with anomalous summer rainfall over East Asia [24,25,26,27]. Although the summer NAO possesses a relatively smaller spatial extent and weaker signals than the winter NAO, the EOF analysis of observed summertime extratropical North Atlantic pressure at mean sea level still gives a dipole pattern parallel to the winter NAO [17]. The summer NAO also explains a large portion of the total variance in the atmosphere circulation over the North Atlantic region [28]. Some studies have shown that the summer NAO exerts a vital influence on the climate, including the summer air temperature and rainfall in the Northern Hemisphere [29,30]. The major patterns of summer climate over China are also highly connected with the interannual variation of summer NAO, supporting a teleconnection between the North Atlantic region and East Asia [31]. Previous studies mainly focus on the impact of the winter NAO on weather and climate anomalies over East Asia, but less attention is paid to the influence of summer NAO on the atmospheric circulation over Eurasia. Thus, this study aims to investigate the connection between summer NAO and circulation types over Eurasia.
Furthermore, SST plays an important role in climate variability. A number of studies demonstrated the impacts of ENSO-related SST anomalies over the Pacific and Indian oceans on atmospheric circulation and climate feature over East Asia [32,33,34,35]. Recently, there has been increasing evidence of the remote impact of Atlantic Ocean SST anomalies on Eurasia. Through inducing an atmospheric wave train extending from the North Atlantic to Eurasia, spring North Atlantic SST anomalies can modulate summer surface air temperature anomalies over Eurasia [26,36,37]. Some studies suggested that the wave train also explains why the North Atlantic SST anomalies can affect the precipitation variability in East Asia [12,38,39]. Additionally, the North Atlantic SST anomalies play a crucial role in prolonging the influence of the winter NAO on the atmospheric circulation anomalies over the subtropics of the Northern Hemisphere in the following seasons [20,40]. The ocean model simulations suggest that positive Atlantic SSTs near the equator persist in their locations and strengths until summer, playing key roles in connecting spring AO to East Asian summer monsoons by a positive air–sea feedback [41]. The anomalous NAO in spring impacts the following East Asian summer monsoon via inducing a tri-pole SST anomaly pattern in the North Atlantic, which persists into the ensuing summer and excites a subpolar teleconnection extending from northern Europe to East Asia [27,42]. The above studies indicated that the wave train aroused by the North Atlantic SST anomalies acts as an important bridge in the influence of the NAO on the weather and climate anomalies over East Asia. In this study, we further examine whether summer North Atlantic SST can modulate the connection between summer NAO and circulation types over Eurasia.
Therefore, this study aims to investigate the anomalous characteristics of summertime circulation types over Eurasia and their connections with the NAO modulated by North Atlantic SST. The paper is organized as follows. Section 2 describes data and methods. Section 3.1 presents the anomalous characteristics of summertime circulation types over Eurasia. Section 3.2 investigates the connection between summer NAO and circulation types over Eurasia. Section 3.3 explores the modulation of summer North Atlantic SST anomalies on the connection between the NAO and Eurasian circulation types. Section 4 and Section 5 give the discussion and conclusion, respectively.

2. Materials and Methods

The datasets used in the present study include (1) the ERA5 monthly averaged reanalysis data during 1979–2020 derived from the European Centre for Medium-Range Weather Forecasts [43] with a horizontal resolution of 1.0°, including geopotential height, u-component of wind, v-component of wind, SLP, vertical velocity, SST and latent heat flux, and (2) the daily precipitation data derived from the China Meteorological Administration (CMA). Summer mean values based on the monthly data are calculated from June to August (JJA).
The wave activity flux formulated by Plumb [44] is used to study the stationary wave propagation. The formulation of the wave activity flux may be expressed as:
F s = p   cos φ × ( v 2 1 2 Ω a sin 2 φ ( v Φ ) λ u v + 1 2 Ω a sin 2 φ ( u Φ ) λ 2 Ω sin φ S [ v T 1 2 Ω a sin 2 φ ( T Φ ) λ ] )
where p is pressure (hPa)/1000 hPa and φ and λ are latitude and longitude, respectively. The Earth’s rotation rate, radius of the Earth and static stability are given by Ω, a and S, respectively.
The SST and precipitation data used in this study have all removed the impact of ENSO by defining the Niño4 index as the area-averaged SST from 5° S–5° N and 160° E–150° W, and calculating the linear regression patterns of the SST and precipitation fields to the Niño4 index, then removing these patterns from the original fields [45].

3. Results

3.1. The Anomalous Characteristics of Summertime Circulation Types over Eurasia

3.1.1. Classification of Summertime Anomalous Circulation Types over Eurasia

The blocking high pressure, one of the main circulation systems affecting summer droughts and floods in East Asia, mainly occurs over the Ural Mountains, Lake Baikal and the Sea of Okhotsk [9,10,12]. Liu et al. [46] analyzed the temporal and spatial distributions of atmosphere blockings high in Asia during summer and indicated three active areas of blocking events, including the Sea of Okhotsk, the Ural Mountains and Lake Baikal, accounting for 30.4%, 27.5% and 23.8% of the accumulative numbers, respectively. According to principal component analysis using 500 hPa geopotential heights, the summer blocking was regarded as the major mode in these areas [47]. To investigate the characteristics of summertime anomalous circulation types over Eurasia, the three areas with a high frequency of blocking high pressure are chosen as the key areas, which include the Ural Mountains (40° N–50° N, 40° E–70° E), Lake Baikal (50° N–60° N, 80° E–110° E) and the Sea of Okhotsk (50° N–60° N, 120° E–150° E). Based on the circulation characteristics of these key areas, the summer anomalous circulation over Eurasia can be classified into double-ridge type (DR-type) and double-trough type (DT-type). The DR-type is mainly characterized by the ridges over the Ural Mountains and the Sea of Okhotsk, and a trough over Lake Baikal. The positions of the troughs and ridges for DT-type are opposite. Since the two types resemble well the leading EOF modes of Eurasian 500 hPa height in a previous study [48], it is reasonable to regard them as Eurasian-dominant variations in the summer. Additionally, the normalized latitudinal deviation is a defining method for analyzing persistent anomalies in the extratropical atmospheric circulation of the Northern Hemisphere [49]. Based on the normalized latitudinal deviation, a circulation index (CI) is defined as follows to describe the anomalous characteristics over Eurasia:
C I = h u + h o h b
where hu, hb and ho represent the normalized regional mean of the latitudinal deviation of summer 500 hPa height in the key areas of the Ural Mountains (40° N–50° N, 40° E–70° E), Lake Baikal (50° N–60° N, 80° E–110° E) and the Sea of Okhotsk (50° N–60° N, 120° E–150° E), respectively. The normalized time series of CI for 1979–2020 is shown in Figure 1a, which reveals an interannual variation clearly. The years in which the normalized CI values are higher than +1.0 standard deviation are defined as the DR-type, and the years in which the normalized CI values are lower than −1.0 are defined as the DT-type. From Figure 1a we can see that there were seven DR-type years (1988, 1989, 1997, 1998, 2008, 2010 and 2014) and seven DT-type years (1979, 1994, 2001, 2003, 2004, 2005 and 2018). To obtain a better understanding of the spatial structure of summertime anomalous circulation types over Eurasia related to the CI, Figure 1b,c present the composite summer geopotential height anomalies at 500 hPa for the DR-type and DT-type, respectively. There is a wave train with alternating positive and negative height anomalies over the Eurasian mid-high latitude. As for the DR-type (Figure 1b), significant negative height anomalies at 500 hPa can be seen over the east of Europe and Lake Baikal and significant positive height anomalies over the Ural Mountains and the Sea of Okhotsk. Compared with the DR-type, significant height anomalies for the DT-type (Figure 1c) are opposite. It is noteworthy that the positive height anomalies over the northern Pacific extend southwestward to the eastern coast of China, implying that the WPSH is more intense and more northwestward than that of the DR-type.

3.1.2. The Anomalous Characteristics of Summertime Circulation Types over Eurasia

To further investigate the anomalous characteristics of summertime circulation types over Eurasia, the composite summer geopotential height anomalies at 200 hPa and zonal wind at 200 hPa are plotted in Figure 2. An anomalous wave train pattern at 200 hPa over Eurasia, which originates from the North Atlantic and propagates eastward to East Asia, can be clearly identified, which is consistent with the wave train at 500 hPa (Figure 1b,c). Compared with the DR-type, the EASJ for the DT-type expands westward and the jet core moves from the northwest of China to the Caspian Sea. It also can be found that the area of SAH is smaller and more westward, whose border arrives west of 120° E.
As the circulation characteristics are shown in Figure 1 and Figure 2, the WPSH is weaker and further southeastern, and the location of the EASJ and the SAH deviate eastward for the DR-type, which is demonstrated to cause a “southern flood and northern drought” summer rainfall pattern over eastern China [50,51]. Thus, the composite summer horizontal wind anomalies at 850 hPa and precipitation anomalies are illustrated in Figure 3. A distribution of an anticyclone–cyclone–anticyclone pattern at 850 hPa is shown along the eastern coast of the Asian continent from south to north for the DR-type (Figure 3a). The western North Pacific is dominated by the cyclone anomalies, which are accompanied by the southeastward movement of WPSH. In this pattern, the southerly winds from low latitude anticyclone and the northerly winds from middle latitude cyclone converge over the MLYRV, which provides favorable conditions for extreme precipitation events. Compared with the DR-type, the distribution of horizontal wind anomalies at 850 hPa for the DT-type (Figure 3b) is opposite, which is consistent with the northwestward extension of WPSH. Consequently, the southerly winds from the middle-latitude anticyclone transport the moisture farther northward, causing precipitation to concentrate over the north of China. These results are demonstrated by the distribution of summer composite precipitation anomalies. As for the DR-type, significant positive precipitation anomalies appear over the MLYRV, and significant negative precipitation anomalies are seen over north China. These patterns are in contrast to the precipitation anomalies for the DT-type. Notably, a distinct meridional wave pattern along the East Asian coast can be observed in Figure 3a (Figure 3b), which resembles well the positive (negative) phase of the East Asia/Pacific (EAP) pattern [52]. Previous studies revealed that persistent circulation anomalies during the positive (negative) EAP phase may result in floods (droughts) in the YRV [13,53], consistent with the distribution of precipitation anomalies in Figure 3. Thus, the anomalous precipitation may be influenced by the combination of Eurasian circulation types and the EAP, which is worth investigating in detail in future work.
Sufficient water vapor and appropriate transportation of water vapor play an important role in precipitation, so we investigate the composite summer vertical integral of moisture flux anomalies and its divergence anomalies (Figure 4). Under the control of an anomalous anticyclone, anomalous southwestern winds prevail over the south of China, increasing the water vapor transported from the South China Sea to the MLYRV for the DR-type (Figure 4a), which leads to the anomalous convergence of water vapor and more precipitation. At the same time, dominated by the northerly winds, it is unbeneficial for the transportation of water vapor to the north of China, so anomalous divergence and less precipitation appear over there. Corresponding to the DT-type (Figure 4b), more water vapor is transported from the Pacific Ocean to the north of China by southeastern winds, leading to the anomalous convergence of water vapor over the north of China and divergence over the MLYRV. It can be clearly seen that the transportation of water vapor flux matches well with the patterns of the precipitation anomalies in Figure 3. The above evidence points to the fact that the precipitation is likely to occur in the MLYRV for the DR-type but in the north of China for the DT-type, which indicates that there exists a close relationship between the typical anomalous circulation types over Eurasia and precipitation in China.

3.2. The Connection between Summer NAO and Circulation Types over Eurasia

The anomalous circulation over Eurasia can be attributed to the NAO [19,20,21]. To investigate whether the summertime circulation types over Eurasia are linked to the NAO, the composite summer SLP anomalies are shown in Figure 5. The distribution of SLP for the DR-type (Figure 5a) is characterized by a north–south-orientated seesaw pattern over the North Atlantic. A positive anomalous center is observed over Greenland, and a negative one is found over the Azores. This pattern resembles well a negative phase of summer NAO revealed in previous studies [17,54]. As for the DT-type (Figure 5b), there also exists a significant seesaw pattern but with a positive anomalous center over the Azores and a negative one over Greenland, which represents a positive phase of NAO. The result suggests a connection between summer NAO and circulation types over Eurasia.
The variability of the NAO is quantified by the NAO index, which is defined as the difference between the normalized monthly SLP over the North Atlantic sector averaged from 80° W to 30° E at 35° N and that at 65° N [55] marked in Figure 5. The statistical relationship between summer NAO and circulation types over Eurasia can be further interpreted by the normalized time series of the CI and the NAO index for 1979–2020. As shown in Figure 6, it can be seen that the CI and the NAO index highly co-vary out of phase. The correlation coefficient between these two indices is −0.49, which is significant at the 99.9% confidence level. This result reconfirms that there is a significantly negative correlation between summer NAO and circulation types over the Eurasian mid-high latitude.
To confirm what is the possible mechanism linking the summer NAO and circulation types over Eurasia, we first analyzed the regression patterns of summer zonal wind at 200 hPa onto the CI and the NAO index, respectively. In Figure 7a, there are positive anomalies of 200 hPa zonal wind from MLYRV to Japan and negative anomalies over the northeast of China, which reveals that the EASJ shifts southward and dominates the MLYRV. However, in Figure 7b, the positive anomalies are seen in the northeast of China, indicating the northward movement of the EASJ, which has contributed to abundant rainfall over north China. Previous studies show that the EASJ, as a summer monsoon component, plays an important role in the East Asian summer precipitation. In general, a southward EASJ that appears from the YRV to Korea and Japan can lead to extreme summer precipitation located over the YRV. A northward EASJ may benefit the heavy precipitation over the north of China [56,57]. Therefore, the impact of anomalous circulation types at mid-high latitude on the movement of EASJ and the variation of summer rainfall is opposite to the NAO.
Moreover, the regression patterns of the summer geopotential height at 500 hPa onto the CI are shown in Figure 7c. It can be seen that a wave train appears from the North Atlantic through Eurasia to East Asia at mid-high latitude, resembling the composite geopotential height anomalies of the DR-type (Figure 2a), with negative height anomalies over the east of Europe and Lake Baikal, and positive height anomalies over the Ural Mountains and the Sea of Okhotsk, respectively. Due to two positive height anomalies over the Ural Mountains and the Sea of Okhotsk, the cold air from the mid-high latitudes invades persistently into the MLYRV and converges with the warm air from low latitudes, triggering a positive effect on precipitation. The regression patterns of the summer geopotential height at 500 hPa onto the NAO index (Figure 7d) also show a wave train but with the opposite phase to Figure 7c, which is accompanied by negative height anomalies over the Ural Mountains and the Sea of Okhotsk and less precipitation over the MLYRV. These results indicate that the wave train from the North Atlantic to East Asia may be a major bridge between summer NAO and circulation types over Eurasia and play a role in the precipitation over the MLYRV. Previous studies have dealt with the wave train between the North Atlantic and East Asia. The downstream extension of the NAO is caused by quasi-stationary Rossby waves along the Asian jet waveguide and excited by a vorticity source associated with the NAO [58]. In association with the positive (negative) NAO in May, the Rossby wave train propagates eastward along the northward (southward) westerly jet, which plays an important role in linking the May NAO and the summer extreme precipitation frequency over MLYRV [25].
Figure 7e,f show the regression patterns of the vertical integral of moisture flux and its divergence onto the CI and the NAO index, respectively. In Figure 7e, the divergence anomalies of moisture flux dominate the western North Pacific and north China, and the convergence anomalies appear from the MLYRV to Japan as a result of the water vapor from the South China Sea being transported by anomalous southwestern winds over the south of China. Corresponding to the positive NAO index years (Figure 7f), water vapor from the Pacific Ocean turns northward to the north of China by southeastern winds over eastern China, contributing to the moisture convergence over northern China and divergence over the MLYRV. Such patterns are favorable for less rainfall in the MLYRV but for more in north China.
A strong convergence pattern is associated with the development of convection, so the regression patterns of summer vertical velocity averaged along 90° E to 120° E onto the CI and the NAO index are shown in Figure 7g,h, respectively. In Figure 7g, there are significant negative vertical velocity anomalies along 25° N to 33° N and positive anomalies over the north of the Yellow River Basin and the South China, which implies that a strong ascending motion dominates the MLYRV. These patterns increase atmospheric instability and enhance the convergence of moisture, resulting in abundant rainfall over the MLYRV. In Figure 7h, an anomalous sinking motion appears over the MLYRV, which imposes a negative effect on the precipitation. In conclusion, the patterns in positive CI years are all opposite to those in positive NAO-index years, which further indicates a negative correlation between summer NAO and circulation types over the Eurasian mid-high latitude.

3.3. The Modulation of Summer North Atlantic SST Anomalies on the Connection between the NAO and Eurasian Circulation Types

Recently, a number of studies demonstrated the impacts of the North Atlantic SST anomalies on the atmospheric circulation and climate features over East Asia [26,36,37,39]. A tri-pole pattern of North Atlantic SST can produce NAO-like atmospheric anomalies [59,60]. Thus, can the summer North Atlantic SST anomalies modulate the connection between the NAO and Eurasian circulation types? To answer this question, the composite summer SST anomalies for the DR-type and DT-type are shown in Figure 8a,b. There is a tri-pole pattern with two significant positive anomalies over the low and high latitudes of the North Atlantic, and a significant negative anomaly over the south of Newfoundland in the midlatitudes for the DR-type, and the opposite SST anomalies are seen for the DT-type. Additionally, the tri-pole pattern that displays a positive–negative–positive distribution from north to south in the North Atlantic can also be seen in the correlation between the CI and summer SST anomalies (Figure 8c), indicating a close relationship between the tri-pole pattern of North Atlantic SST and anomalous circulation types over Eurasia. This tri-pole SST anomaly pattern is consistent with previous studies and was demonstrated to induce significant weather and climate changes in remote regions via a triggering atmospheric teleconnection pattern [26,61,62].
From the above analyses, a tri-pole SST pattern index (TSI) is defined by the difference of the average summer SST between the areas of the positive correlation in the high and low latitudes and the area of the negative correlation in the midlatitudes based on Figure 8c, as follows:
T S I = S S T h + S S T l S S T m
where SSTh, SSTm and SSTl represent the summer average SST fields in the curvilinear rectangle (50–58° N, 15–50° W), (30–42° N, 52–70° W) and (7–30° N, 15–52° W) of Figure 8c, respectively. Figure 9 shows the normalized time series of the TSI, the CI and the NAO index for 1979–2020, which displays a significant positive correlation (0.32) at the 95% confidence level between the TSI and the CI, and a significant negative correlation (−0.41) at the 99% confidence level between the TSI and the NAO index. The result reconfirms the negative correlation between the NAO and Eurasian circulation types and indicates that the correlation may be modulated by summer North Atlantic SST anomalies. Thus, corresponding to a higher (lower) TSI, a negative (positive) phase of the NAO and a DR-type (DT-type) circulation over Eurasian mid-high latitude are more likely to appear, and the precipitation will increase (decrease) over the MLYRV.
Figure 10 depicts the regression patterns of summer SLP and horizontal wind at 850 hPa onto the TSI. A seesaw pattern of SLP anomalies can be clearly seen over the North Atlantic, with a positive anomaly over high latitudes and a negative one over midlatitudes, which implies that a negative phase of the NAO appears in the positive TSI years. Significant westerly wind anomalies are seen around 25°–35° N and easterly wind anomalies are observed around 45°–60° N over the North Atlantic, with anticyclonic wind anomalies over the high latitudes and cyclonic wind anomalies over the midlatitudes, which resembles well the regression patterns of SLP. The results reveal that the tri-pole SST anomaly pattern in the summer North Atlantic can contribute to the variability of NAO, which may further prolong and strengthen the impacts of the NAO on circulation types over the Eurasian mid-high latitude.
The atmosphere circulation over the North Atlantic is likely stimulated by anomalous convective latent heating of the region [63]. As shown in the regression patterns of summer latent heat flux onto the TSI (Figure 11), there are significant negative centers over the low and high latitudes of the North Atlantic, indicating that more latent heat flux is transferred from the ocean to the atmosphere. Thus, corresponding to a tri-pole SST pattern, the increasing released latent heat flux can enhance the convection activity of the region, consequently exerting an impact on the NAO. Additionally, the formation of NAO-like atmospheric circulation can be explained by the wave-mean flow interaction and the transient eddy feedback process [64,65]. Some numerical studies suggest that the SST anomaly with strong meridional gradient in the oceanic frontal zones can affect the eddy-driven jet and annular mode variable through either the surface energy fluxes or the eddy-mediated processes [66,67]. This study using statistical method indicates that the tri-pole pattern can produce NAO-like atmospheric anomalies, and further analysis related to air–sea coupling or numerical experiments need to be conducted to confirm this process.
As is mentioned above, the wave train from the North Atlantic to East Asia may be an important channel linking the summer NAO and circulation types over Eurasia (Figure 7c,d). To further demonstrate whether the wave train is related to the North Atlantic SST anomalies, we chose years in which the TSI values are higher than +1.0 standard deviation (1987, 1995, 1997, 2005, 2007 and 2012) and diagnosed the composite summer geopotential height at 200 hPa and the wave activity fluxes (Figure 12). The wave train shown by geopotential height at 200 hPa is in good agreement with Figure 7c, implying that the origins of the wave train associated with the NAO may be traced to the North Atlantic. Additionally, wave activity fluxes show that the wave train originates from the North Atlantic and propagates eastward along the geopotential height anomalies centers (−+−+). The wave activity fluxes propagate strongly between the negative and positive centers of geopotential height anomalies, which is favorable for maintaining and reinforcing the anomalous geopotential heights. Compared with positive TSI cases, the wave train for negative TSI cases can also be seen from the North Atlantic to East Asia (not shown), but the wave activity fluxes are much weaker over the Ural Mountains and the Sea of Okhotsk, which is unfavorable to the establishment of blocking high anomalies and precipitation over the MLYRV. The above analyses demonstrate that anomalous circulation types over Eurasia can be attributed to the wave train from the North Atlantic to East Asia, which is aroused by the tri-pole SST anomaly pattern in the North Atlantic and should be considered as a link between the NAO and circulation types over Eurasia. Corresponding to a high TSI, the positive height anomalies over the Ural Mountains and the Sea of Okhotsk increase, leading to more summer precipitation over the MLYRV.

4. Discussion

It should be noted that the coupling between the NAO and the tri-pole SST anomaly pattern is a complicated issue. [40,64,68,69]. Not only can the tri-pole pattern lead to the formation of NAO, but also the NAO plays a key role in the formation of the tri-pole pattern in response to the changes in surface heat fluxes, which depend upon the surface wind-speed distribution [27,64]. Therefore, the SST should be regarded as a factor related to NAO, and further studies are needed to investigate the NAO’s influence on SST and the impact of the air–sea coupling process on anomalous circulation over Eurasia. Additionally, this study puts emphasis on the modulation of North Atlantic SST on the connection between summer NAO and anomalous circulation over Eurasia. Aside from the North Atlantic SST, other extratropical atmospheric dynamic processes can also produce and maintain the NAO mode and variability [70], which also requires further investigation.

5. Conclusions

ERA5 monthly averaged reanalysis data during 1979–2020 are used to analyze the anomalous characteristics of summertime circulation types over Eurasia and their connections with the NAO modulated by North Atlantic SST. A circulation index (CI) is defined to describe the anomalous characteristics of summertime circulation types over the Eurasian mid-high latitude and classify the anomalous circulation into DR-type and DT-type. The main conclusions are as follows.
(1)
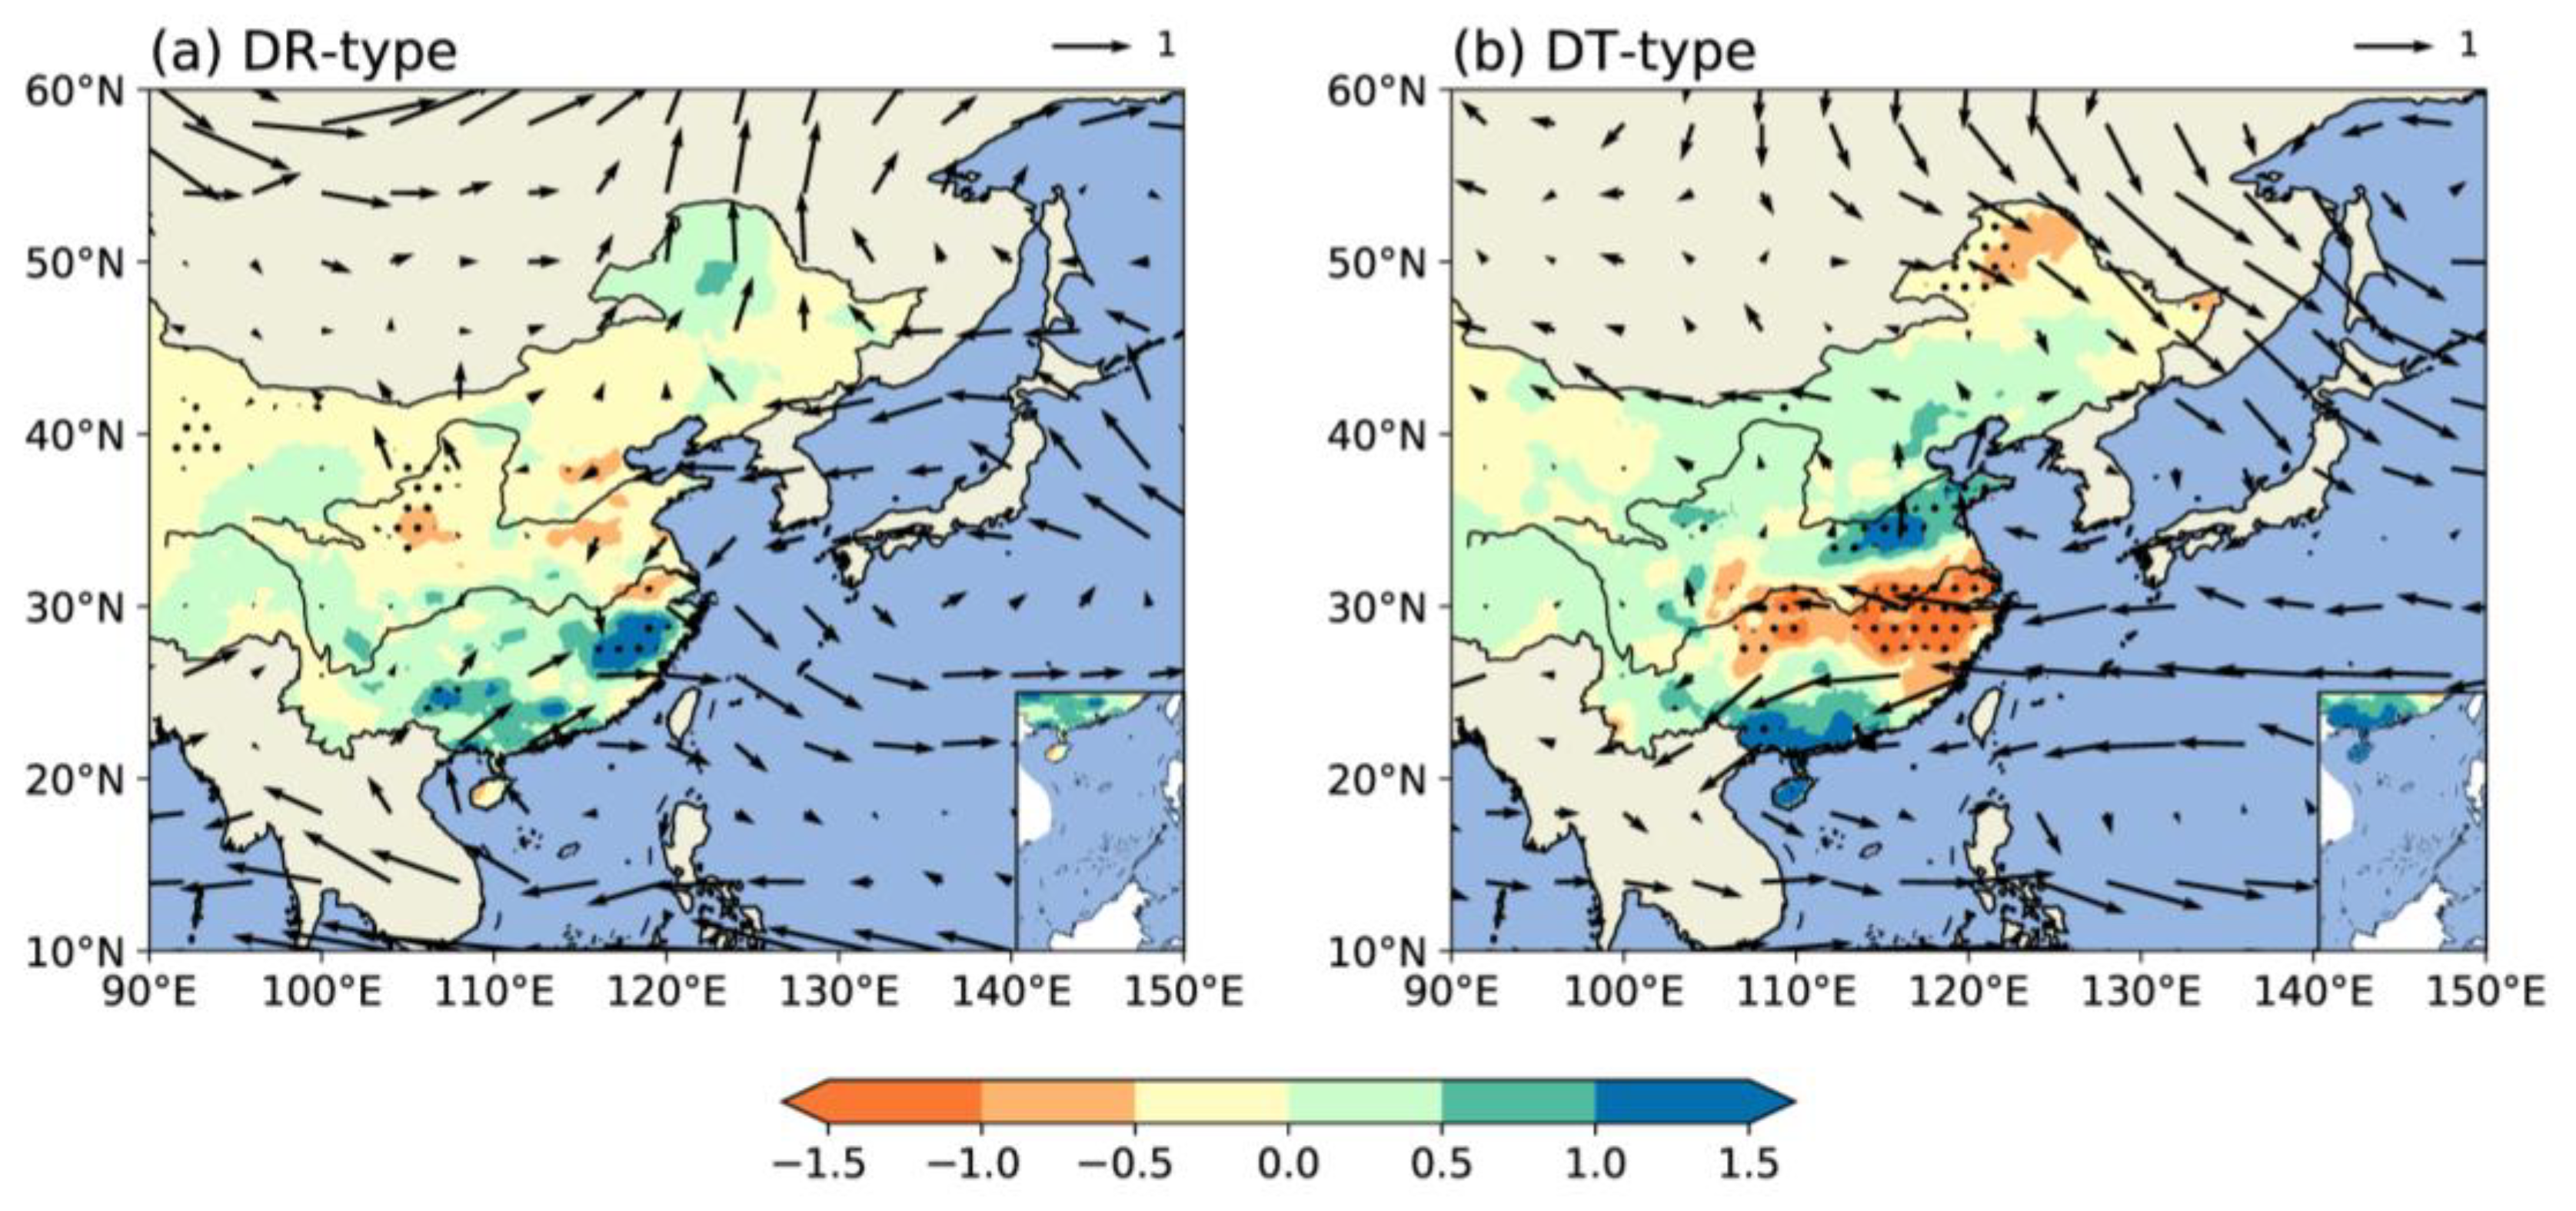
A wave train pattern is shown over the Eurasian mid-high latitude with opposite phases for the DR-type and DT-type. Compared with the DR-type, the WPSH is more intense and northwestward for the DT-type, and the EASJ and SAH expand more westward. Moreover, there exists a close relationship between the anomalous circulation types over Eurasia and precipitation in China. There is more precipitation over north China, and less precipitation over the MLYRV for the DT-type, which is opposite to the DR-type.
(2)
The summertime circulation types over Eurasia are closely connected to the NAO. In positive CI years, the EASJ shifts southward and dominates the MLYRV. With two positive height anomalies over the Ural Mountains and the Sea of Okhotsk, the cold air from the mid-high latitudes invades persistently into the MLYRV and converges with the warm air from the low latitudes. The moisture convergence and a strong ascending motion can be seen over the MLYRV, which is favorable for more precipitation. By contrast, the above patterns are reversed in positive NAO-index years, indicating a significantly negative correlation between summer NAO and circulation types over Eurasia.
(3)
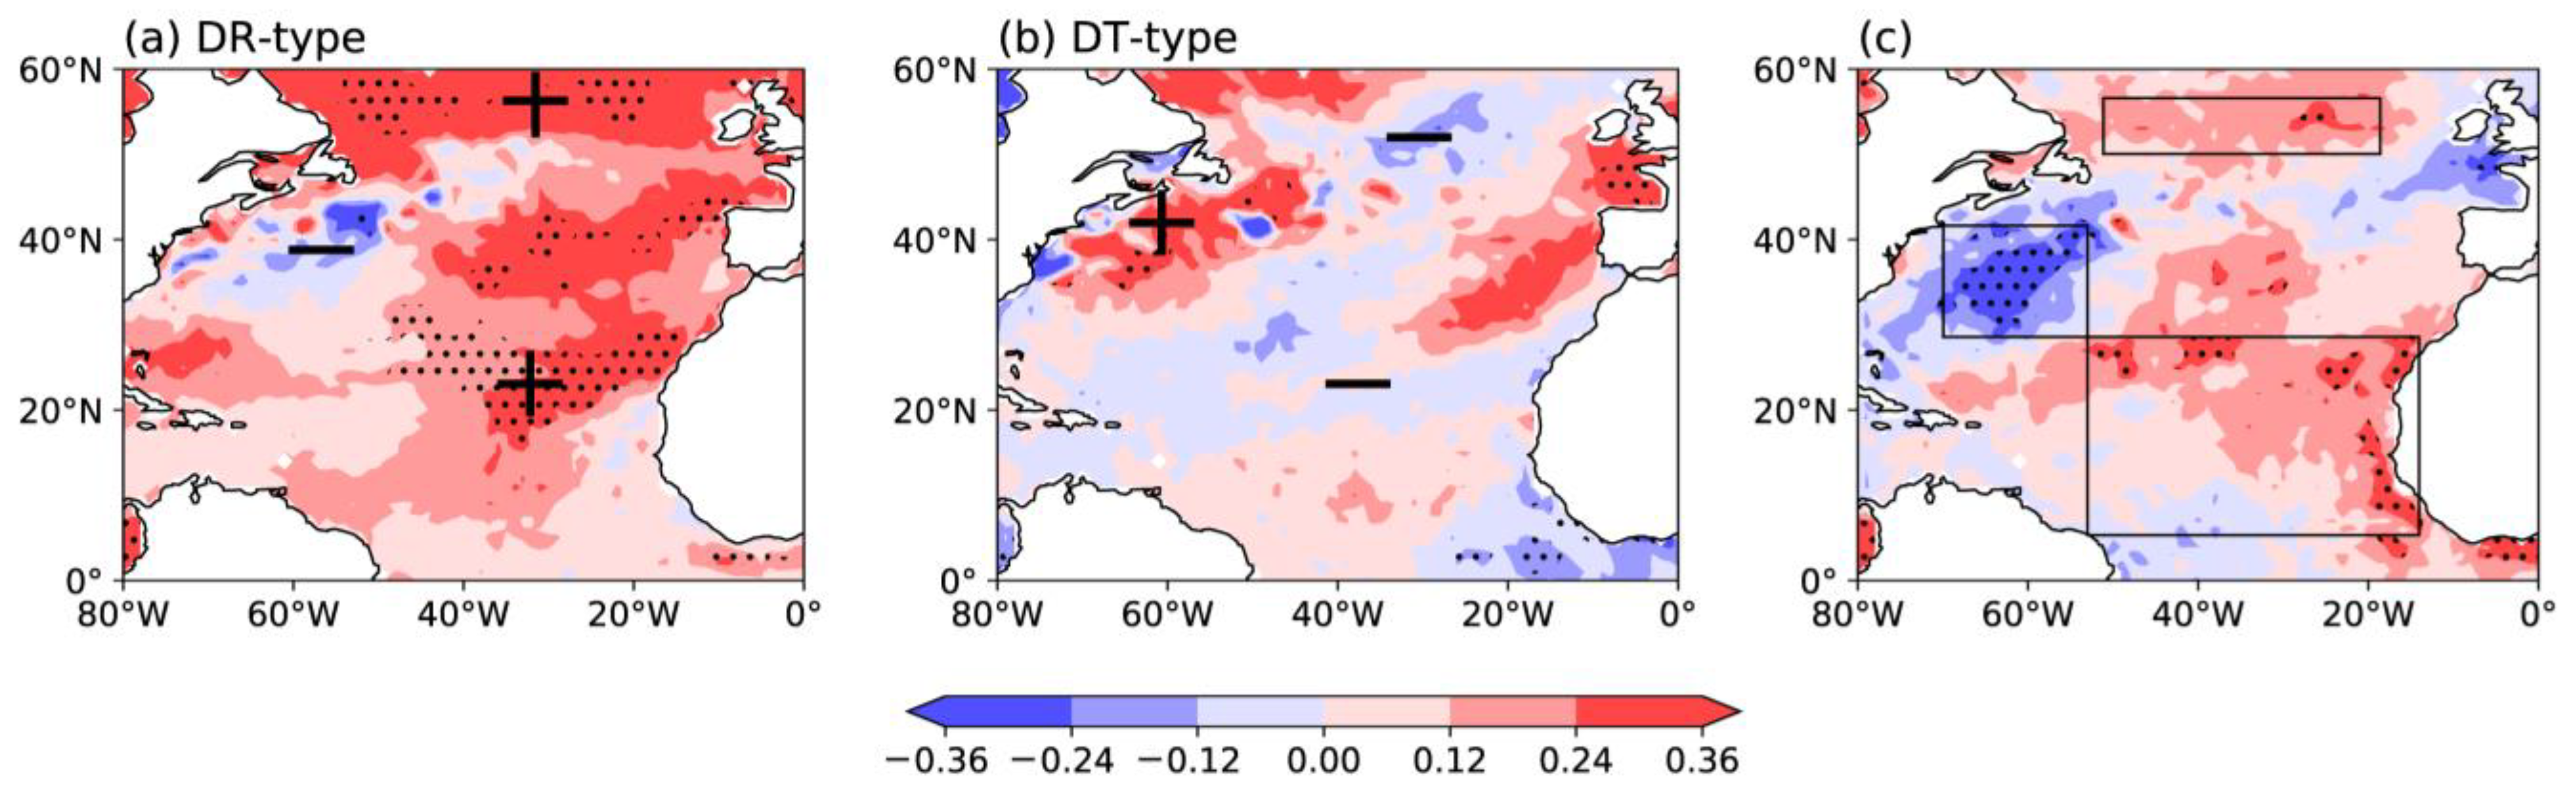
A tri-pole SST anomaly pattern over the North Atlantic can modulate the connection between summer NAO and circulation types over Eurasia. This tri-pole pattern can induce NAO-like atmospheric circulation and strengthen the impacts of the NAO on Eurasian circulation types. Additionally, a wave train that originates from the North Atlantic and propagates eastward to East Asia is the potential mechanism of linking the NAO and summertime circulation types over Eurasia. The wave train is aroused by the tri-pole SST anomaly pattern and is favorable for maintaining and strengthening the anomalous circulation types over the Eurasian mid-high latitude.

Author Contributions

Conceptualization, L.W.; data curation, D.Y.; formal analysis, L.W. and D.Y.; funding acquisition, L.W.; investigation, D.Y.; methodology, L.W. and D.Y.; project administration, L.W.; resources, L.W. and D.Y.; software, D.Y.; supervision, L.W.; validation, L.W.; visualization, D.Y.; writing—original draft, D.Y.; writing—review and editing, L.W. and D.Y. All authors have read and agreed to the published version of the manuscript.

Funding

This research was funded by the National Natural Science Foundation of China (Grant 41975085) and the National Key R&D Program of China (2019YFC1510004).

Institutional Review Board Statement

Not applicable.

Informed Consent Statement

Not applicable.

Data Availability Statement

The data presented in this study are available on request from the corresponding author.

Acknowledgments

We acknowledge the High-Performance Computing Center of Nanjing University of Information Science and Technology for their support of this work.

Conflicts of Interest

The authors declare no conflict of interest.

References

  1. Ionita, M.; Scholz, P.; Lohmann, G.; Dima, M.; Prange, M. Linkages between Atmospheric Blocking, Sea Ice Export through Fram Strait and the Atlantic Meridional Overturning Circulation. Sci. Rep. 2016, 6, 32881. [Google Scholar] [CrossRef] [PubMed] [Green Version]
  2. Matsueda, M. Predictability of Euro-Russian Blocking in Summer of 2010. Geophys. Res. Lett. 2011, 38, L06801. [Google Scholar] [CrossRef]
  3. Chen, S.; Wu, R.; Song, L.; Chen, W. Interannual Variability of Surface Air Temperature over Mid-High Latitudes of Eurasia during Boreal Autumn. Clim. Dyn. 2019, 53, 1805–1821. [Google Scholar] [CrossRef]
  4. Huang, W.; Yang, Z.; He, X.; Lin, D.; Wang, B.; Wright, J.S.; Chen, R.; Ma, W.; Li, F. A Possible Mechanism for the Occurrence of Wintertime Extreme Precipitation Events over South China. Clim. Dyn. 2019, 52, 2367–2384. [Google Scholar] [CrossRef]
  5. Tyrlis, E.; Hoskins, B.J. Aspects of a Northern Hemisphere Atmospheric Blocking Climatology. J. Atmos. Sci. 2008, 65, 1638–1652. [Google Scholar] [CrossRef]
  6. Xu, K.; Lu, R.; Mao, J.; Chen, R. Circulation Anomalies in the Mid–High Latitudes Responsible for the Extremely Hot Summer of 2018 over Northeast Asia. Atmos. Ocean. Sci. Lett. 2019, 12, 231–237. [Google Scholar] [CrossRef] [Green Version]
  7. Liao, Z.; Zhai, P.; Chen, Y.; Lu, H. Atmospheric Circulation Patterns Associated with Persistent Wet-Freezing Events over Southern China. Int. J. Climatol. 2018, 38, 3976–3990. [Google Scholar] [CrossRef]
  8. Wang, Z.; Ding, Y.; Zhou, B.; Chen, L. Comparison of Two Severe Low-temperature Snowstorm and Ice Freezing Events in China: Role of Eurasian Mid-high Latitude Circulation Patterns. Int. J. Climatol. 2020, 40, 3436–3450. [Google Scholar] [CrossRef]
  9. Yu, R.; Zhai, P. Changes in Summer Persistent Precipitation over the Middle–Lower Reaches of the Yangtze River and Associated Atmospheric Circulation Patterns. J. Meteorol. Res. 2021, 35, 9. [Google Scholar] [CrossRef]
  10. Zong, H.; Zhang, Q. A New Precipitation Index for the Spatiotemporal Distribution of Drought and Flooding in the Reaches of the Yangtze and Huaihe Rivers and Related Characteristics of Atmospheric Circulation. Adv. Atmos. Sci. 2011, 28, 375–386. [Google Scholar] [CrossRef]
  11. Samel, A.; Liang, X. Understanding Relationships between the 1998 Yangtze River Flood and Northeast Eurasian Blocking. Clim. Res. 2003, 23, 149–158. [Google Scholar] [CrossRef]
  12. Tian, B.; Fan, K. Factors Favorable to Frequent Extreme Precipitation in the Upper Yangtze River Valley. Meteorol. Atmos. Phys. 2013, 121, 189–197. [Google Scholar] [CrossRef]
  13. Chen, Y.; Zhai, P. Synoptic-scale Precursors of the East Asia/Pacific Teleconnection Pattern Responsible for Persistent Extreme Precipitation in the Yangtze River Valley. Q. J. R. Meteorol. Soc. 2015, 141, 1389–1403. [Google Scholar] [CrossRef]
  14. Chen, W.; Yang, S.; Huang, R.-H. Relationship between Stationary Planetary Wave Activity and the East Asian Winter Monsoon. J. Geophys. Res. Atmos. 2005, 110, D14110. [Google Scholar] [CrossRef]
  15. Wang, L.; Chen, W. Downward Arctic Oscillation Signal Associated with Moderate Weak Stratospheric Polar Vortex and the Cold December 2009. Geophys. Res. Lett. 2010, 37, L09707. [Google Scholar] [CrossRef]
  16. Yao, Y.; Luo, D.; Dai, A.; Feldstein, S.B. The Positive North Atlantic Oscillation with Downstream Blocking and Middle East Snowstorms: Impacts of the North Atlantic Jet. J. Clim. 2016, 29, 1853–1876. [Google Scholar] [CrossRef]
  17. Folland, C.K.; Knight, J.; Linderholm, H.W.; Fereday, D.; Ineson, S.; Hurrell, J.W. The Summer North Atlantic Oscillation: Past, Present, and Future. J. Clim. 2009, 22, 1082–1103. [Google Scholar] [CrossRef]
  18. Hurrell, J.W. Decadal Trends in the North Atlantic Oscillations: Regional Temperatures and Precipitation. Science 1995, 269, 676–679. [Google Scholar] [CrossRef] [Green Version]
  19. Cheung, H.N.; Zhou, W.; Mok, H.Y.; Wu, M.C. Relationship between Ural–Siberian Blocking and the East Asian Winter Monsoon in Relation to the Arctic Oscillation and the El Niño–Southern Oscillation. J. Clim. 2012, 25, 4242–4257. [Google Scholar] [CrossRef]
  20. Qiao, S.; Feng, G. Impact of the December North Atlantic Oscillation on the Following February East Asian Trough. J. Geophys. Res. Atmos. 2016, 121, 10074–10088. [Google Scholar] [CrossRef]
  21. Sung, M.-K.; Lim, G.-H.; Kug, J.-S. Phase Asymmetric Downstream Development of the North Atlantic Oscillation and Its Impact on the East Asian Winter Monsoon. J. Geophys. Res. 2010, 115, D09105. [Google Scholar] [CrossRef] [Green Version]
  22. Yu, R.; Zhou, T. Impacts of Winter-NAO on March Cooling Trends over Subtropical Eurasia Continent in the Recent Half Century. Geophys. Res. Lett. 2004, 31, L12204. [Google Scholar] [CrossRef] [Green Version]
  23. Sung, M.-K.; Kwon, W.-T.; Baek, H.-J.; Boo, K.-O.; Lim, G.-H.; Kug, J.-S. A Possible Impact of the North Atlantic Oscillation on the East Asian Summer Monsoon Precipitation. Geophys. Res. Lett. 2006, 33, L21713. [Google Scholar] [CrossRef]
  24. Piao, J.; Chen, W.; Chen, S.; Wei, K. Intensified Impact of North Atlantic Oscillation in May on Subsequent July Asian Inland Plateau Precipitation since the Late 1970s. Int. J. Climatol. 2018, 38, 2605–2612. [Google Scholar] [CrossRef]
  25. Tian, B.; Fan, K. Relationship between the Late Spring NAO and Summer Extreme Precipitation Frequency in the Middle and Lower Reaches of the Yangtze River. Atmos. Ocean. Sci. Lett. 2012, 5, 455–460. [Google Scholar]
  26. Wu, R.; Yang, S.; Liu, S.; Sun, L.; Lian, Y.; Gao, Z. Northeast China Summer Temperature and North Atlantic SST. J. Geophys. Res. 2011, 116, D16116. [Google Scholar] [CrossRef]
  27. Zheng, F.; Li, J.; Li, Y.; Zhao, S.; Deng, D. Influence of the Summer NAO on the Spring-NAO-Based Predictability of the East Asian Summer Monsoon. J. Appl. Meteorol. Climatol. 2016, 55, 1459–1476. [Google Scholar] [CrossRef]
  28. Hurrell, J.W.; Kushnir, Y.; Ottersen, G.; Visbeck, M. The North Atlantic Oscillation: Climatic Significance and Environmental Impact. Geophys. Monogr. Amer. Geophys. Union. 2003, 134, 279. [Google Scholar]
  29. Yuan, W.; Sun, J. Enhancement of the Summer North Atlantic Oscillation Influence on Northern Hemisphere Air Temperature. Adv. Atmos. Sci. 2009, 26, 1209–1214. [Google Scholar] [CrossRef]
  30. Wang, Z.; Yang, S.; Lau, N.-C.; Duan, A. Teleconnection between Summer NAO and East China Rainfall Variations: A Bridge Effect of the Tibetan Plateau. J. Clim. 2018, 31, 6433–6444. [Google Scholar] [CrossRef]
  31. Linderholm, H.W.; Ou, T.; Jeong, J.-H.; Folland, C.K.; Gong, D.; Liu, H.; Liu, Y.; Chen, D. Interannual Teleconnections between the Summer North Atlantic Oscillation and the East Asian Summer Monsoon. J. Geophys. Res. 2011, 116, D13107. [Google Scholar] [CrossRef]
  32. Chang, C.-P.; Zhang, Y.; Li, T. Interannual and Interdecadal Variations of the East Asian Summer Monsoon and Tropical Pacific SSTs. Part I: Roles of the Subtropical Ridge. J. Clim. 2000, 13, 4310–4325. [Google Scholar] [CrossRef]
  33. Chou, C.; Tu, J.-Y.; Yu, J.-Y. Interannual Variability of the Western North Pacific Summer Monsoon: Differences between ENSO and Non-ENSO Years. J. Clim. 2003, 16, 2275–2287. [Google Scholar] [CrossRef] [Green Version]
  34. Wang, B.; Wu, R.; Fu, X. Pacific–East Asian Teleconnection: How Does ENSO Affect East Asian Climate? J. Clim. 2000, 13, 1517–1536. [Google Scholar] [CrossRef]
  35. Yang, J.; Liu, Q.; Xie, S.-P.; Liu, Z.; Wu, L. Impact of the Indian Ocean SST Basin Mode on the Asian Summer Monsoon. Geophys. Res. Lett. 2007, 34, L02708. [Google Scholar] [CrossRef] [Green Version]
  36. Chen, S.; Wu, R.; Liu, Y. Dominant Modes of Interannual Variability in Eurasian Surface Air Temperature during Boreal Spring. J. Clim. 2016, 29, 1109–1125. [Google Scholar] [CrossRef]
  37. Wang, H.; Liu, G.; Chen, J. Contribution of the Tropical Western Atlantic Thermal Conditions during the Preceding Winter to Summer Temperature Anomalies over the Lower Reaches of the Yangtze River Basin-Jiangnan Region. Int. J. Climatol. 2017, 37, 4631–4642. [Google Scholar] [CrossRef] [Green Version]
  38. Chen, Z.; Wu, R.; Wang, Z. Impacts of Summer North Atlantic Sea Surface Temperature Anomalies on the East Asian Winter Monsoon Variability. J. Clim. 2019, 32, 6513–6532. [Google Scholar] [CrossRef]
  39. Liu, G.; Ji, L.; Wu, R. An East-West SST Anomaly Pattern in the Midlatitude North Atlantic Ocean Associated with Winter Precipitation Variability over Eastern China. J. Geophys. Res. Atmos. 2012, 117, D15104. [Google Scholar] [CrossRef] [Green Version]
  40. Ogi, M.; Tachibana, Y.; Yamazaki, K. Impact of the Wintertime North Atlantic Oscillation (NAO) on the Summertime Atmospheric Circulation. Geophys. Res. Lett. 2003, 30. [Google Scholar] [CrossRef]
  41. Gong, D.-Y.; Yang, J.; Kim, S.-J.; Gao, Y.; Guo, D.; Zhou, T.; Hu, M. Spring Arctic Oscillation-East Asian Summer Monsoon Connection through Circulation Changes over the Western North Pacific. Clim. Dyn. 2011, 37, 2199–2216. [Google Scholar] [CrossRef]
  42. Wu, Z.; Wang, B.; Li, J.; Jin, F.-F. An Empirical Seasonal Prediction Model of the East Asian Summer Monsoon Using ENSO and NAO. J. Geophys. Res. 2009, 114, D18120. [Google Scholar] [CrossRef]
  43. Hersbach, H.; Bell, B.; Berrisford, P.; Hirahara, S.; Horányi, A.; Muñoz-Sabater, J.; Nicolas, J.; Peubey, C.; Radu, R.; Schepers, D.; et al. The ERA5 Global Reanalysis. Q. J. R. Meteorol. Soc. 2020, 146, 1999–2049. [Google Scholar] [CrossRef]
  44. Plumb, R.A. On the Three-Dimensional Propagation of Stationary Waves. J. Atmos. Sci. 1985, 42, 217–229. [Google Scholar] [CrossRef]
  45. An, S.-I. Conditional Maximum Covariance Analysis and Its Application to the Tropical Indian Ocean SST and Surface Wind Stress Anomalies. J. Clim. 2003, 16, 2932–2938. [Google Scholar] [CrossRef]
  46. Liu, G.; Shen, B.; Lian, Y.; Li, S.; Cao, L.; Liu, P. The Sorts of 500 hPa Blocking High in Asia and It’s Relations to Cold Vortex and Aestival Low Temperature in Northeast of China. Sci. Geogr. Sin. 2012, 32, 1269–1274. [Google Scholar]
  47. Park, Y.; Ahn, J. Characteristics of Atmospheric Circulation over East Asia Associated with Summer Blocking. J. Geophys. Res. Atmospheres 2014, 119, 726–738. [Google Scholar] [CrossRef]
  48. Pan, J.; Ji, L.; Cholaw, B. Intraseasonal Climate Characteristics of the Summertime Persistent Anomalous Circulation over Eurasian Middle and High Latitudes. Chin. J. Atmos. Sci. 2009, 33, 300–312. [Google Scholar]
  49. Dole, R.M.; Gordon, N.D. Persistent Anomalies of the Extratropical Northern Hemisphere Wintertime Circulation: Geographical Distribution and Regional Persistence Characteristics. Mon. Wea. Rev. 1983, 111, 1567–1586. [Google Scholar] [CrossRef]
  50. Gao, H.; Jiang, W.; Li, W. Changed Relationships between the East Asian Summer Monsoon Circulations and the Summer Rainfall in Eastern China. J. Meteorol. Res. 2014, 28, 1075–1084. [Google Scholar] [CrossRef]
  51. Zhu, J.; Huang, D.-Q.; Dai, Y.; Chen, X. Recent Heterogeneous Warming and the Associated Summer Precipitation over Eastern China. Theor. Appl. Climatol. 2016, 123, 619–627. [Google Scholar] [CrossRef]
  52. Ronghui, H.; Li, L. Numerical Simulation of the Relationship between the Anomaly of Subtropical High over East Asia and the Convective Activities in the Western Tropical Pacific. Adv. Atmos. Sci. 1989, 6, 202–214. [Google Scholar] [CrossRef]
  53. Huang, G. An Index Measuring the Interannual Variation of the East Asian Summer Monsoon—The EAP Index. Adv. Atmos. Sci. 2004, 21, 41–52. [Google Scholar] [CrossRef]
  54. Sun, J.; Wang, H.; Yuan, W. Decadal Variations of the Relationship between the Summer North Atlantic Oscillation and Middle East Asian Air Temperature. J. Geophys. Res. 2008, 113, D15107. [Google Scholar] [CrossRef]
  55. Li, J.; Wang, J.X.L. A New North Atlantic Oscillation Index and Its Variability. Adv. Atmos. Sci. 2003, 20, 661–676. [Google Scholar]
  56. Wang, S.; Zuo, H.; Yin, Y.; Wang, J.; Ma, X. Asymmetric impact of East Asian jet’s variation on midsummer rainfall in North China and Yangtze River Valley. Clim. Dyn. 2019, 53, 6199–6213. [Google Scholar] [CrossRef]
  57. Zhou, B.; Wang, H. Relationship between the Boreal Spring Hadley Circulation and the Summer Precipitation in the Yangtze River Valley. J. Geophys. Res. 2006, 111, D16109. [Google Scholar] [CrossRef]
  58. Watanabe, M. Asian Jet Waveguide and a Downstream Extension of the North Atlantic Oscillation. J. Clim. 2004, 17, 4674–4691. [Google Scholar] [CrossRef]
  59. Pan, L.-L. Observed positive feedback between the NAO and the North Atlantic SSTA tripole. Geophys. Res. Lett. 2005, 32. [Google Scholar] [CrossRef]
  60. Peng, S.; Robinson, W.A.; Li, S. Mechanisms for the NAO Responses to the North Atlantic SST Tripole. J. Clim. 2003, 16, 1987–2004. [Google Scholar] [CrossRef]
  61. Cassou, C.; Deser, C.; Terray, L.; Hurrell, J.W.; Drévillon, M. Summer Sea Surface Temperature Conditions in the North Atlantic and Their Impact upon the Atmospheric Circulation in Early Winter. J. Clim. 2004, 17, 3349–3363. [Google Scholar] [CrossRef]
  62. Gu, W.; Li, C.; Wang, X.; Zhou, W.; Li, W. Linkage between Mei-Yu Precipitation and North Atlantic SST on the Decadal Timescale. Adv. Atmos. Sci. 2009, 26, 101–108. [Google Scholar] [CrossRef]
  63. Sun, J.; Wang, H.; Yuan, W. Role of the Tropical Atlantic Sea Surface Temperature in the Decadal Change of the Summer North Atlantic Oscillation. J. Geophys. Res. 2009, 114, D20110. [Google Scholar] [CrossRef]
  64. Chen, S.; Wu, R.; Chen, W. Strengthened Connection between Springtime North Atlantic Oscillation and North Atlantic Tripole SST Pattern since the Late 1980s. J. Clim. 2020, 33, 2007–2022. [Google Scholar] [CrossRef]
  65. Nie, Y.; Ren, H.-L.; Zhang, Y. The Role of Extratropical Air–Sea Interaction in the Autumn Subseasonal Variability of the North Atlantic Oscillation. J. Clim. 2019, 32, 7697–7712. [Google Scholar] [CrossRef]
  66. O’Reilly, C.H.; Minobe, S.; Kuwano-Yoshida, A.; Woollings, T. The Gulf Stream influence on wintertime North Atlantic jet variability. Quart. J. Roy. Meteor. Soc. 2017, 143, 173–183. [Google Scholar] [CrossRef]
  67. Sampe, T.; Nakamura, H. Potential Influence of a Midlatitude Oceanic Frontal Zone on the Annular Variability in the Extratropical Atmosphere as Revealed by Aqua-Planet Experiments. J. Meteorol. Soc. Jpn. 2013, 91, 25. [Google Scholar] [CrossRef] [Green Version]
  68. Chen, S.; Wu, R.; Chen, W. The Changing Relationship between Interannual Variations of the North Atlantic Oscillation and Northern Tropical Atlantic SST. J. Clim. 2015, 28, 485–504. [Google Scholar] [CrossRef]
  69. Czaja, A.; Frankignoul, C. Observed Impact of Atlantic SST Anomalies on the North Atlantic Oscillation. J. Clim. 2002, 15, 606–623. [Google Scholar] [CrossRef]
  70. Thompson, D.W.J.; Lee, S.; Baldwin, M.P. Atmospheric Processes Governing the Northern Hemisphere Annular Mode/North Atlantic Oscillation. Wash. DC Am. Geophys. Union Geophys. Monogr. Ser. 2003, 134, 81–112. [Google Scholar]
Figure 1. (a) The normalized time series of the CI for 1979–2020. The horizontal dashed lines indicated ±1.0 standard deviation. Composite summer geopotential height anomalies at 500 hPa (shading, units: dagpm) for (b) DR-type and (c) DT-type. The 500 hPa geopotential height anomalies significant at the 90% confidence level are dotted.
Atmosphere 13 02093 g001
Figure 2. Composite summer geopotential height anomalies at 200 hPa (contours, units: dagpm), zonal wind at 200 hPa (shading, units: m·s−1) and wave activity fluxes (vector, units: m2·s−2) for (a) DR-type and (b) DT-type. The blue solid line (1250 dagpm) indicates SAH and the shading indicates EAJS. The 200 hPa geopotential height anomalies and 200 hPa zonal wind significant at the 90% confidence level are dotted.
Atmosphere 13 02093 g002
Figure 3. Composite summer horizontal wind anomalies at 850 hPa (vector, units: m·s−1) and precipitation anomalies (shading, units: mm) for (a) DR-type and (b) DT-type. The precipitation anomalies significant at the 90% confidence level are dotted.
Atmosphere 13 02093 g003
Figure 4. Composite summer vertical integral of moisture flux anomalies (vector, units: kg·m−1·s−1) and its divergence anomalies (shading, units: 10−6 kg·m−2·s−1) for (a) DR-type and (b) DT-type. The moisture flux divergence anomalies significant at the 90% confidence level are dotted.
Atmosphere 13 02093 g004
Figure 5. Composite summer surface level pressure anomalies (units: hPa) for (a) DR-type and (b) DT-type. The surface level pressure anomalies significant at the 90% confidence level are dotted. The black solid lines (from 80° W to 30° E at 35° N and 65° N) indicate the latitudinal band for calculating NAO index.
Atmosphere 13 02093 g005
Figure 6. The normalized time series of the CI (red line) and the NAO index (black line) for 1979–2020, and their correlation coefficient (R) is −0.49.
Atmosphere 13 02093 g006
Figure 7. Regression of summer (a,b) zonal wind at 200 hPa (units: m·s−1), (c,d) geopotential height at 500 hPa (units: dagpm) and wave activity fluxes (vector, units: m2·s−2), (e,f) vertical integral of moisture flux (vector, units: kg·m−1·s−1) and its divergence (shading, units: 10−6kg·m−2·s−1), (g,h) vertical velocity averaged along 90° E to 120° E (units: 10−3 Pa·s−1) onto (a,c,e,g) the CI and (b,d,f,h) the NAO index. The areas significant at the 95% confidence level are dotted.
Atmosphere 13 02093 g007
Figure 8. Composite summer SST anomalies (unit: ℃) for (a) DR-type and (b) DT-type. (c) Correlation between the CI and summer SST anomalies. The SST anomalies significant at the 90% confidence level are dotted.
Atmosphere 13 02093 g008
Figure 9. The normalized time series of the TSI (blue bar), the CI (red line) and the NAO index (black line) for 1979–2020.
Atmosphere 13 02093 g009
Figure 10. Regression of summer surface level pressure (shading, units: hPa) and horizontal wind at 850 hPa (vector, units: m·s−1) onto the TSI. The surface level pressures significant at the 95% confidence level are dotted.
Atmosphere 13 02093 g010
Figure 11. Regression of summer latent heat flux (shading, units: W·m−2) onto the TSI. The latent heat fluxes significant at the 95% confidence level are dotted.
Atmosphere 13 02093 g011
Figure 12. Composite summer geopotential height at 200 hPa (shading, units: dagpm) and Plumb wave activity fluxes (vector, units: m2·s−2) for positive TSI cases. The 200 hPa geopotential height significant at the 90% confidence level are dotted.
Atmosphere 13 02093 g012
Publisher’s Note: MDPI stays neutral with regard to jurisdictional claims in published maps and institutional affiliations.

