Article

Impact of Human Activities on Hydrological Drought Evolution in the Xilin River Basin

1
Yinshanbeilu National Field Research Station of Desert Steppe Ecohydrological System, China Institute of Water Resources and Hydropower Research, Beijing 100038, China
2
Institute of Water Resource for Pastoral Area Ministry of Water Resources of the People’s Republic of China, Hohhot 010018, China
*
Author to whom correspondence should be addressed.
Atmosphere 2022, 13(12), 2079; https://doi.org/10.3390/atmos13122079
Submission received: 1 November 2022 / Revised: 6 December 2022 / Accepted: 7 December 2022 / Published: 10 December 2022
(This article belongs to the Special Issue Natural Disasters and Hazards in the Geographical Environment)

Abstract

:
The impact of human activities on the hydrological cycle makes hydrological drought no longer a natural disaster in a strict sense, and influences the stationarity of the hydrologic process. In this context, assessment methods that consider nonstationary conditions are more reasonable in the study of hydrological drought. In this study, we used the SWAT (Soil and Water Assessment Tool) model to reconstruct the historical hydrological conditions during the period affected by human activities (1998–2019) of the Xilin River Basin. After calculating the standardized runoff index (SRI) at multiple time scales, we compared the drought characteristics of the basin under natural conditions and under the influence of human activities. The results show that human activities were the main reason for the significant decrease of runoff in the basin (an obvious change-point for runoff series is identified in 1998), which accounted for 68%. Compared with natural conditions, human activities delayed the occurrence of short-term drought in the basin and changed its seasonal distribution characteristics, resulting in an increase in the frequency of severe and extreme droughts in autumn; the corresponding drought frequency increased by 15% and 60%, respectively. Moreover, human activities have also prolonged drought duration, increased drought intensity, and increased the uncertainty of drought in the basin. The proposed method is demonstrated to be efficient in quantifying the effects of human activities on hydrological drought, and the findings of this study provide a scientific basis for water resource management, drought early warning, and forecasting under a changing environment.

1. Introduction

Climate change and human activities are two major factors affecting the hydrological cycle and driving the evolution of water resources. They are also important driving forces for the evolution of regional drought [1,2,3]. With the changing environment in recent decades, drought has shown a trend of widespread and frequent occurrence. The resulting water shortage, food crisis, environmental deterioration, and other problems, have seriously threatened human survival and sustainable economic development [4,5,6]. Currently, drought is classified into four categories: meteorological drought, socioeconomic drought, hydrological and agricultural drought [7]. Hydrological drought is affected by precipitation, infiltration, and runoff, involving the transformation of surface water, soil water and groundwater, and is related to the hydrological cycle and water balance [8]. The processes of its formation and completion are relatively slow, and the mechanism is more complicated than the other three categories of drought [9,10]. With the profound impact of high-intensity human activities on the hydrological cycle, hydrological drought is no longer a natural disaster in a strict sense, but rather a natural-anthropogenic composite disaster [11,12]. To accurately predict the occurrence and development of the hydrological drought and effectively manage it, the formation and development of drought cannot be considered solely from the natural perspective. The role of human activities in the formation and development of hydrological drought needs to be fully considered [13,14,15].
Human activities alter hydraulic connections in the water cycle by changing the underlying surface conditions of the basin, resulting in changes in surface runoff, consumption, discharge conditions, river regulation, and storage functions. These can further affect the occurrence and development of the hydrological drought [16,17,18,19,20]. Scientific evaluation and identification of the hydrological drought events and determination of the main driving factors in their evolution have become the focus of international drought research [21,22,23,24,25]. Based on the threshold method and standardized index method, Rangecroft et al. [26] evaluated the characteristics of drought before and after the completion of the San Juan Dam in northern Chile. They reported that reservoir regulation reduced the frequency, duration, and intensity of drought events but had no significant effect on multi-year drought. By applying the VIC (Variable Infiltration Capacity) model to analyze the attribution of runoff attenuation in the Weihe River Basin, Ren et al. [27] suggested that both climate change and human activities were important factors affecting the evolution of drought and flood in the basin. In particular, human activities were the dominant factor in the occurrence of short-term drought. Su et al. [28] used the SWAT model to reconstruct the historical hydrology of the Daling River Basin under natural conditions. Based on a multi-time scale standardized runoff index, that study compared the evolution of the basin’s drought under changing environments and concluded that human activities have intensified the duration and intensity of seasonal drought and increased the uncertainty of drought events in the basin. By discussing the occurrence and evolution of hydrological drought in the basin from the perspective of water cycle, we can further improve the accuracy and objectivity of drought evaluation.
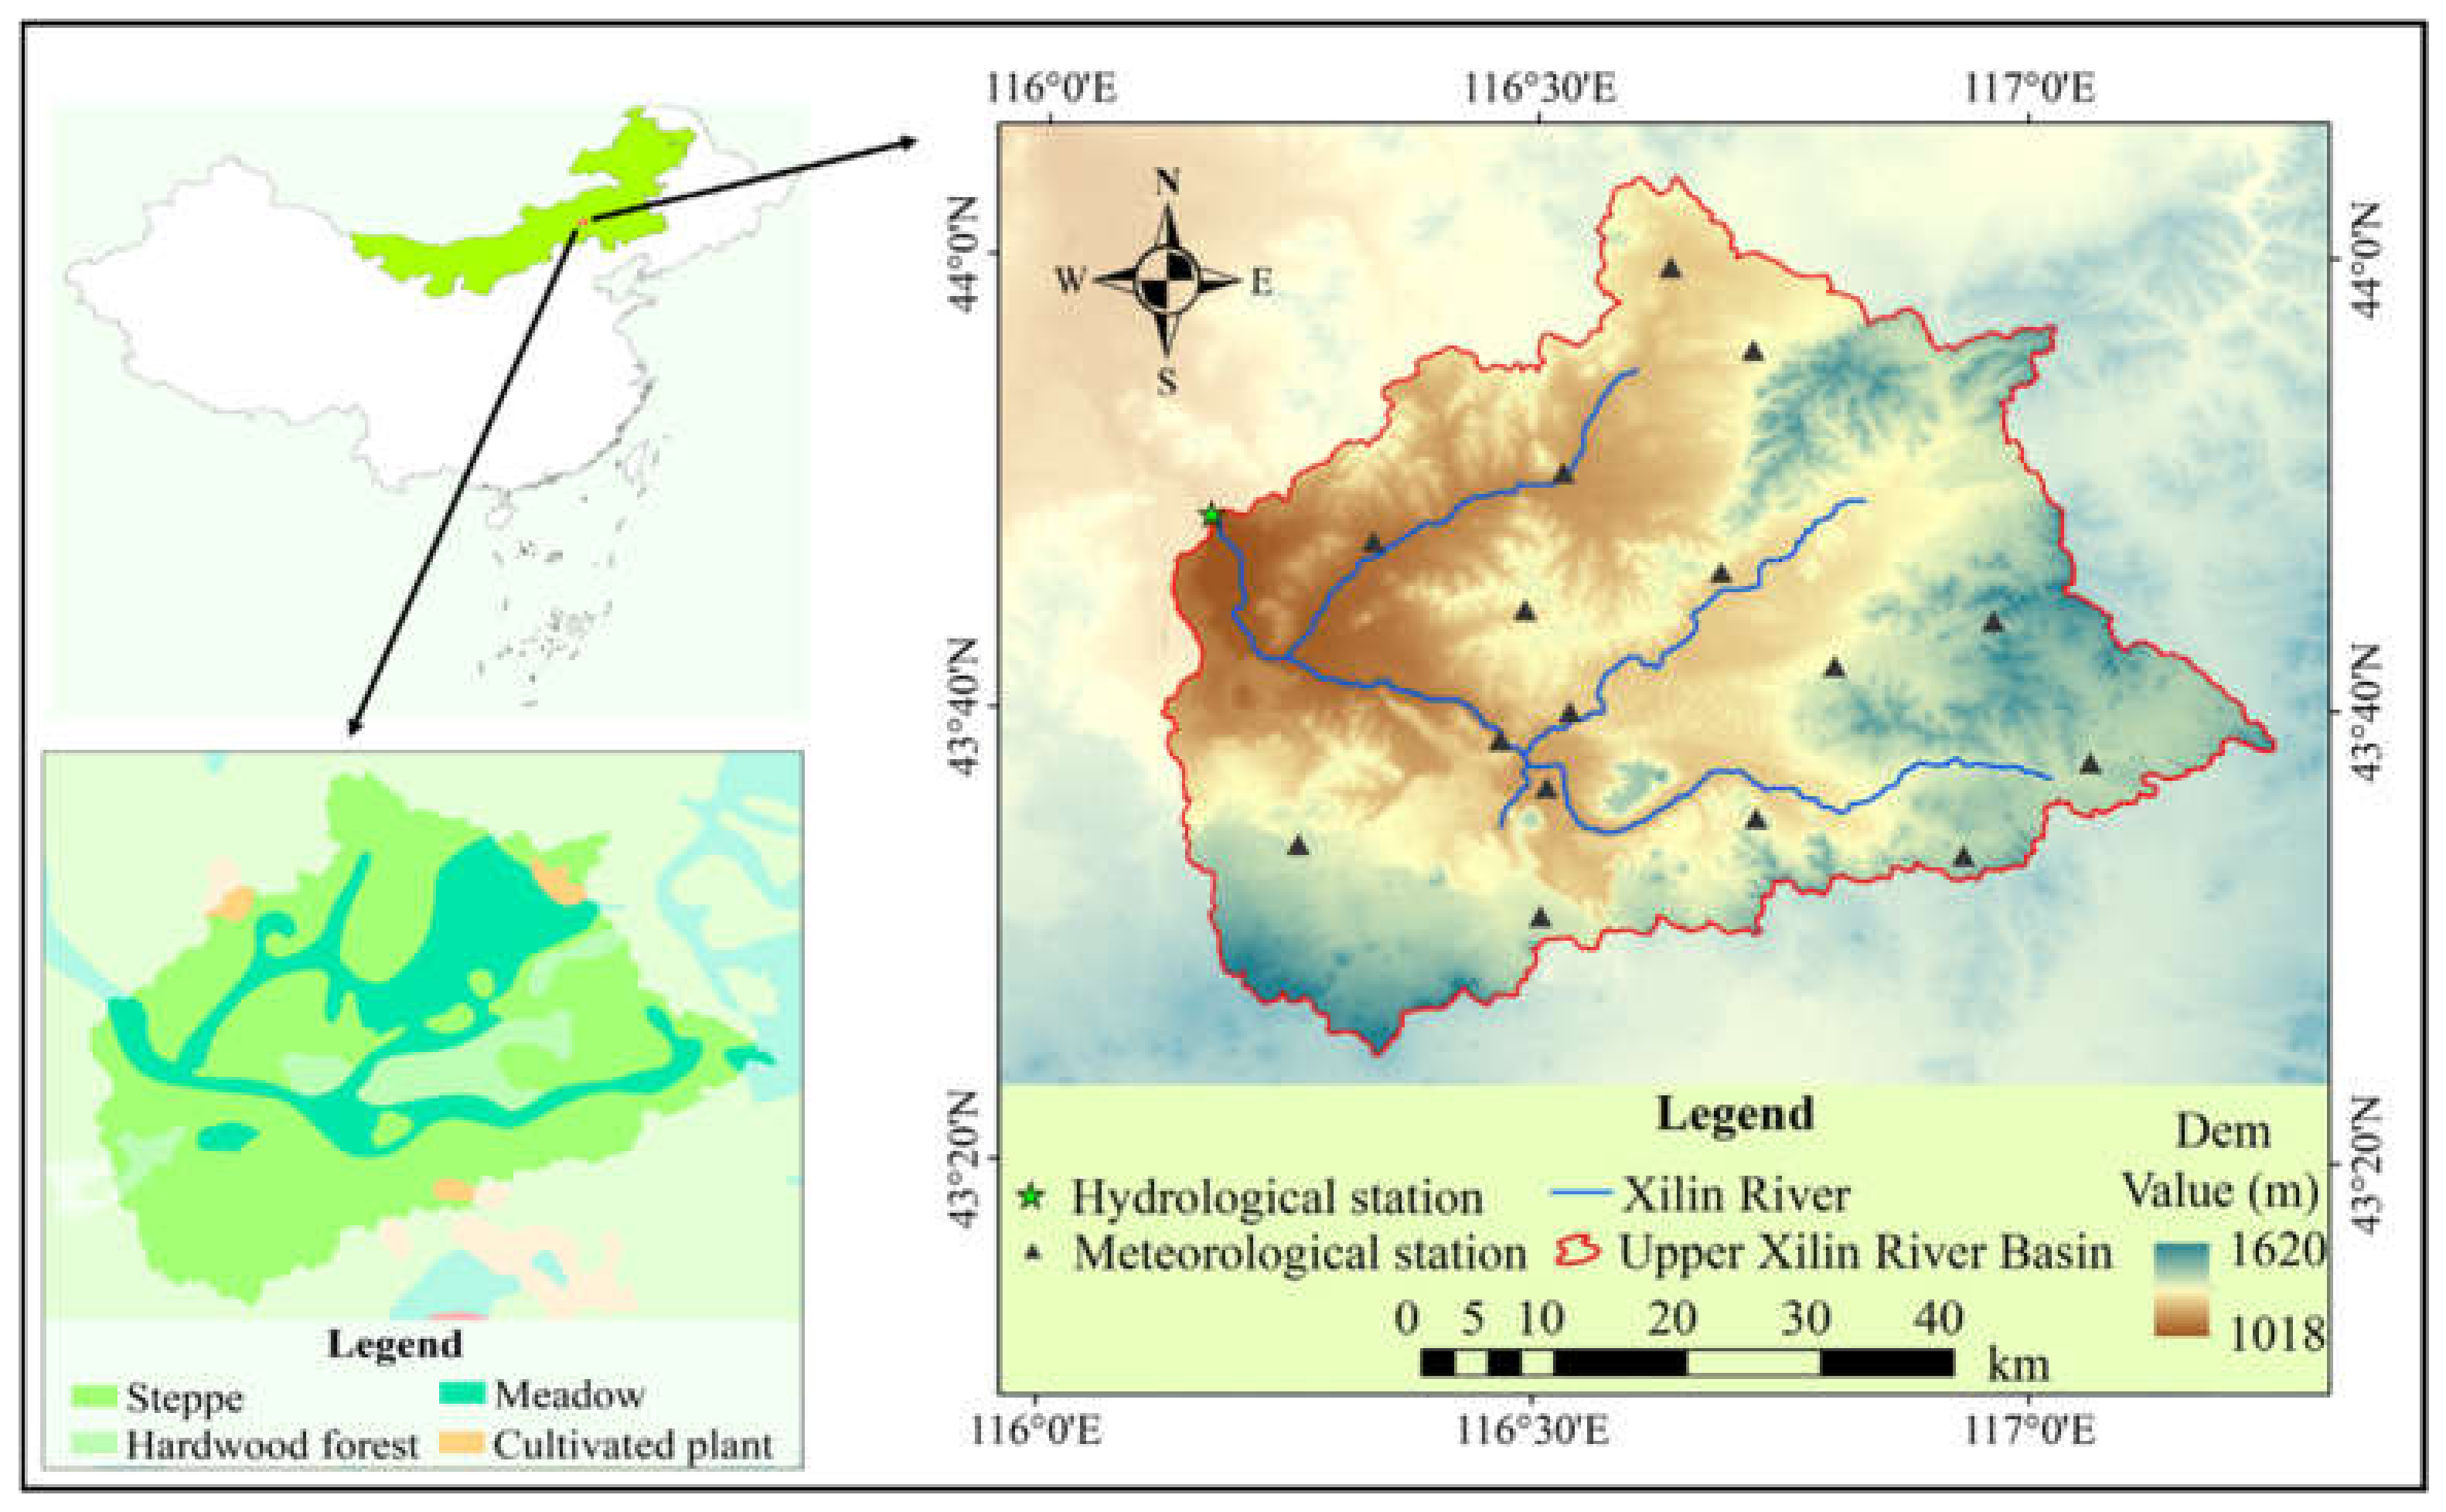
The Xilin River Basin, a typical grassland inland river basin, was selected as the study area. In recent years, the rapid development of regional animal husbandry has doubled the total number of livestock in the study area, and the amount of livestock has far exceeded the carrying capacity of the natural grassland. Meanwhile, with the depletion of energy resources in central and eastern China, China’s coal power development strategy has gradually moved westward. The Xilingol League region (where the study area is located) is rich in energy resources, and is gradually becoming a main source of coal and a national energy strategic base supporting the long-term socioeconomic development of China. Intensive human activities have accelerated soil erosion and aggravated drought in the basin during the past two decades [29,30,31]. In this context, the SWAT model was used to reconstruct the natural runoff of the basin, and on this basis the temporal characteristics of drought and the influence of environmental change on drought evolution were examined. This study should provide a scientific basis for water resources management, drought early warning, and forecasting under a changing environment.

2. Materials and Methods

2.1. Study Area

The Xilin River Basin located in the Inner Mongolia Plateau (43°24’–44°39’ N, 115°25’–117°15’ E), surrounded by the Greater Khingan Mountains and the Yinshan Mountains covers a drainage area of 10,786 km2. It is difficult for warm and humid air flow to enter; thus the climate is characterized by strong evaporation and insufficient precipitation [32,33], the average annual precipitation is about 300 mm, and the evaporation is 1900 mm (measured by an evaporating dish with a diameter of 20 cm). The total length of the main river is 175 km, and the altitude of the basin is 900–1650 m. The terrain slopes gradually from southeast to northwest (Figure 1). The landform has obvious stratification and zoning. The south is a three-stage basalt platform with many small volcanic cones scattered across the landscape. The other areas are occupied by low mountains, hills, and grasslands. More than 90% of the vegetation in the basin is natural pasture, which transitions from upstream meadow characterized by Leymus chinensis and Stipa baicalensis to downstream steppe characterized by Stipa grandis and Stipa krylovii. It is a typical representative temperate grassland basin. Under the dual influences of climate change and human activities, the grassland vegetation has been severely degraded [34]. As a result, loss of the hydrological function of the basin is ongoing and it is extremely sensitive to meteorological disasters (such as drought) [35].

2.2. Data

We collected observation data from one hydrological station, 15 rainfall stations, and one national meteorological station in the upper Xilin River Basin over the past 45 years (1975–2019). The hydrological data included the monthly observed runoff depth at the Xilin River Hydrological Station collected from Inner Mongolia Monitoring Center of Hydrology and Water Resources. The meteorological data included daily precipitation, temperature, wind speed, and relative humidity, collected from Inner Mongolia Weather Bureau.
To construct the SWAT model of the basin we also needed land surface parameters such as a high-resolution digital elevation model (DEM), as well as soil and land use data. The DEM data, which had a spatial resolution of 30 m × 30 m, was obtained from the Geospatial Data Cloud Platform (http://www.gscloud.cn (accessed on 12 June 2021)). Soil data was obtained from the 1:1,000,000 soil data provided by the Food and Agriculture Organization of the United Nations (FAO) (https://www.fao.org/soils-portal/soil-survey/soil-maps-and-databases/harmonized-world-soil-database-v12/en (accessed on 15 June 2021)). The land use data were obtained from the National Geomatics Center of China’s global 30 m land cover data (http://www.globallandcover.com (accessed on 15 June 2021)).

2.3. Methods

2.3.1. Reconstruction of Natural Runoff Based on SWAT Model

The SWAT model [36], developed by the Agricultural Research Center of the United States Department of Agriculture (USDA), was selected to reconstruct the water cycle in the basin under natural conditions. The SWAT model is a semi-distributed hydrological model with physical mechanisms that can simulate different hydrological processes in the basin by using the spatial data information provided by GIS and multiple spatial data sets [37]. Briefly, the SWAT model divides the basin into several sub-basins, then divides them into one or more hydrological response units (HRUs) according to the soil type, land use and slope of the sub-basins. It uses a conceptual model on each unit to calculate the net rainfall, then performs runoff calculation, and finally obtains the outlet section flow. The threshold values of land use, soil type and slope selected in this study were 5, 5, and 10% respectively. Based on this, the study area was divided into seven sub-basins and 214 HRUs. The model has been successfully applied to simulate the water cycle over the past few decades and generate a series of historically consistent long-term water and heat flux data [38,39,40].
We used the daily rainfall, daily maximum and minimum temperatures, wind speed, and relative humidity from 16 rainfall stations as meteorological input for the SWAT model, and the monthly runoff of 23 years (1975–1997) was used for the model construction and parameter calibration; the period 1975–1991 was used as the model calibration period, and the period 1992–1997 was used as the model validation period. The Nash-Sutcliffe efficiency coefficient (NSE), determination coefficient (R2), and relative bias coefficient (PBIAS) were used to evaluate the fitting effect of the model [41,42]. The specific information of the three evaluation indicators is shown in Table 1.
It was necessary to identify the impact period of human activities before reconstructing the natural runoff series. The Mann-Kendall trend test [43,44], Pettitt test [45], and precipitation-runoff double cumulative curve method [46] were used to analyze variability in the hydrometeorological elements in the study area. The precipitation-runoff double cumulative curve method is represented by a straight line, and the change in the gradient of the curve may infer that the characteristics of precipitation or runoff have changed [25]. This was utilized for the auxiliary detection of the changepoint of the runoff series in this study. According to the change point identification results, the study period was divided into two periods, the natural period (before the change point) and the impact period (after the change point). The observed hydrometeorological data for the natural period were used to calibrate the SWAT model, and model parameters obtained reflect the runoff producing conditions under the background of natural conditions of the basin. Then, the meteorological forcing data for the impact period were used as input data for the calibrated model to reconstruct natural runoff during the same period. We considered the simulated runoff during the impact period to be the natural runoff, which is only affected by climate factors.

2.3.2. Attribution Analysis of Runoff Change

Based on the SWAT model, we estimated the impact of climate change and human activities on runoff in the Xilin River Basin with the following assumptions: (1) climate change and human activities are the main factors causing changes in runoff, and (2) the two are independent of each other (meaning we ignored any climate feedbacks and the interaction between human society and the climate system (see the evaluation framework in Figure 2). On this basis, we combined the natural runoff series reconstructed by the model and the measured runoff series to conduct the attribution analysis of runoff changes. This provided a foundation for quantitatively assessing the impact of human activities on drought in the basin. The total amount of runoff change in the basin can be expressed as:
Δ Q t o t = Δ Q c v + Δ Q h a = Q ¯ 2 , o b s Q ¯ 1 , o b s
where Δ Q c v and Δ Q h a can be expressed as:
Δ Q c v = Q ¯ 2 , s i m Q ¯ 1 , s i m
Δ Q h a = Δ Q t o t Δ Q c v = ( Q ¯ 2 , o b s Q ¯ 1 , o b s ) ( Q ¯ 2 , s i m Q ¯ 1 , s i m )
Therefore, the impact of climate change and human activities on runoff can be calculated as:
I c v = Δ Q c v Δ Q t o t × 100 %
I h a = Δ Q h a Δ Q t o t × 100 %
where Δ Q t o t and Δ Q t o t are the total runoff change and its absolute value, respectively, Δ Q c v and Δ Q h a are the runoff changes caused by climate change and human activities, respectively, Q ¯ 1 , o b s and Q ¯ 2 , o b s are the measured annual average runoffs in the base period and change period, respectively, Q ¯ 1 , s i m and Q ¯ 2 , s i m are the simulated annual average runoffs in the base period and change period, respectively, and I c v and Iha are the contribution rates of climate change and human activities to runoff change, respectively.

2.3.3. Identification of the Hydrological Drought Process Based on the Run Theory

(1) Drought index
Currently, the standardized runoff index (SRI) is widely used for hydrological drought identification [47]. The calculation is similar to the standardized precipitation index (SPI). After determining the suitable probability distribution of runoff in a specific time, the normal standardized runoff index can be calculated. The specific method is shown in the following formula [25]:
S R I = ( t C 0 + C 1 t + C 2 t 2 1 + d 1 t + d 2 t 2 + d 3 t 3 ) ,   t = ln ( 1 [ F ( x ) ] 2 ) , 0 < F ( x ) 0.5 t C 0 + C 1 t + C 2 t 2 1 + d 1 t + d 2 t 2 + d 3 t 3 ,   t = ln ( 1 [ 1 F ( x ) ] 2 ) , 0.5 < F ( x ) < 1
where F(x) is a cumulative distribution function, and the coefficients are c0 = 2.515517, c1 = 0.802853, c2 = 0.010328, d1 = 0.432788, d2 = 0.189269, d3 = 0.001308.
This study focused on the change in drought characteristics for a period when the basin was affected by human activities. Thus, we used reconstructed runoff and observed runoff in the periods to calculate the corresponding SRI series, respectively. According to the division of SRI drought levels [25] in Table 2, we can compare and analyze the hydrological drought characteristics from the perspective of drought severity.
(2) Identification of the hydrological drought events
This study applied the run theory to define drought events and their characteristic variables (e.g., duration and intensity) [48,49]. The identification of drought events involved three steps. The first step was preliminary recognition. Three thresholds, R0, R1, and R2 were set. When SRI < R2 in a certain month, the month was preliminarily identified as a drought month (Figure 3b,d). The second step was the removal of non-drought periods. If the initially identified drought process lasted for only a month and SRI > R2 (Figure 3a), the month was treated as a non-drought month and eliminated. If the drought lasted for more than one month, or the drought lasted for a month but its SRI < R2, it was regarded as a drought event (Figure 3c–e). The third step involved combined drought. If two adjacent drought processes were separated by a month, and the interval month SRI < R0 (Figure 3c), then the adjacent drought processes were merged into one drought event. The drought duration was the duration from the beginning to the end of the event. The drought intensity was the sum of the drought intensity of each month. Otherwise, it was considered an independent drought event (Figure 3d,e).

3. Results

3.1. Analysis of the Characteristics of Hydrometeorological Elements in the Basin

The evolution of the runoff and precipitation time series in the Xilin River Basin from 1975 to 2019 were analyzed using the M-K trend test and Pettitt mutation test (Table 3). According to Table 3, the evolution of the runoff and precipitation series in the study area experienced a downward trend in which the runoff change passed the significance test of α = 0.05, showing a significant downward trend. In addition, the runoff showed a significant deviation in 1998, while the precipitation time did not change abruptly.
The double accumulation curve of annual precipitation and annual runoff in the Xilin River Basin (Figure 4) further demonstrates that the annual precipitation in the study area has remained relatively constant while the runoff changed from 1975–1997 to 1998–2019. The runoff decreased significantly, resulting in a significant drop in the runoff coefficient. The above results further indicate that under the premise of no significant change in meteorological elements in the Xilin River Basin, the runoff changed drastically in 1998.
The rapid development of the animal husbandry and coal industry in the study area has promoted local socioeconomic development since the 21st century. According to statistics, the secondary and tertiary industries in the study area have increased by more than ten times over the past two decades [50]. Combined with the historical characteristics of human activities in the Xilin River Basin, 1975–1997 was selected as the natural period when hydrological processes were less disturbed by environmental changes. The period 1998–2019 was selected as the human activities impact period, during which human activities had a significant impact on hydrological processes.

3.2. Attribution Analysis of Runoff Attenuation

The measured monthly runoff data from 1975 to 1997 were used to calibrate the main parameters of SWAT model (Table 4) automatically (by using the SWAT-CUP) during the natural period, in which 1975–1991 was taken as the model calibration period, and 1992–1997 was taken as the model validation period. By comparing the measured and simulated runoffs (Figure 5), it can be seen that the changes in simulated and measured runoffs were basically consistent during the natural period of the basin. Combined with the model simulation accuracy evaluation parameters (Table 5), it can be seen that NSE, R2 and PBIAS in the model calibration period were 0.75, 0.77 and 15.79, respectively, and NSE, R2 and PBIAS in the model verification period were 0.73, 0.68 and 19.72, respectively. Therefore, the calibrated SWAT model can effectively describe the water cycle process in the basin and can be further applied to reconstruct the natural runoff in the basin.
The runoff series of the impact period was reconstructed using meteorological data for the impact period and the model parameters of the natural period. By this method the runoff series for 1998–2019 (the impact period) under natural conditions was obtained (Figure 5). The results show similar changes in the measured and simulated runoffs during the impact period. However, the measured runoff was significantly less than the simulated runoff. The attribution analysis was combined with the corresponding evaluation framework of runoff under a changing environment, and the contribution rates of climate change and human activities to the runoff reduction in the Xilin River runoff were calculated (Table 6). The results suggest that measured runoff in the impact period was 1.01 mm lower than the simulated runoff, and that human activities were the main reason for the runoff reduction in the Xilin River Basin during the impact period. The runoff reduction was 0.69 mm. The contribution rate to the total runoff reduction was 68%.

3.3. Analysis of Hydrological Drought Evolution over Different Time Scales

By calculating the SRI over different time scales, the evolution of the hydrological drought over different time scales in the basin can be described. By comparing the SRI values calculated from measured and model reconstructed values, Figure 6 shows some impact of human activities on the drought over different time scales (1, 3, and 12 months).
The time series comparison results of the SRI1 and SRI3 (Figure 6a,b) shows that in the same period, the occurrence time of the hydrological drought based on the observed values lagged behind, which, based on the simulation values, indicates that the effects of human activities delayed the onset of short-term drought to some extent. In addition, the short time scale drought levels in the two cases were also quite different. The overall variation trends of the long-term drought (SRI12) based on the measured and reconstructed values were similar. The drought and flood conditions reflected by the SRI in the same period were not significantly different from each other, but the drought levels were different (Figure 6c). Thus, human activities had a significant impact on short-term droughts, changing both the onset and magnitude of short-term droughts. For long-term droughts, human activities changed only the drought levels.

3.4. Analysis of Drought Frequency at Different Time Scales

To further analyze the impact of human activities on drought frequency in the basin, we calculated drought frequencies of different levels and months based on hydrological drought indices at different time scales. According to the frequency distribution of drought at different levels based on SRI1 (Figure 7a1), the hydrological drought distribution in the Xilin River Basin was dominated by mild drought under natural conditions. Under these conditions the drought frequency reached about 60%. Under the influence of human activities, the frequency of moderate drought was less than 40%. Human activities have increased the frequency of moderate, severe, and extreme droughts on a monthly scale in the basin. The effect was strongest for extreme drought, whose frequency was more than twice that of extreme drought under natural conditions. In the case of SRI3, mild and severe droughts dominated under natural conditions, with drought frequencies of 52% and 11%, respectively (Figure 7b1). Human activities have also caused the frequencies of moderate and extreme droughts to increase in the basin. In terms of long-term drought, mild drought still dominated under natural conditions (Figure 7c1). However, its frequency was only 3% lower than the frequency under the impact of human activities. Human activities had little effect on the frequencies of moderate, severe, and extreme droughts in the basin.
From the monthly distribution of drought frequency, we can observe the significance of human activities on altering the seasonal distribution of the short-term hydrological drought in the basin under natural conditions (Figure 7a2,b2). Summer and autumn were the seasons with a high incidence of the hydrological drought in the Xilin River Basin, particularly the period from summer to autumn (August-September). Once the flood season had passed, the precipitation in the basin decreased rapidly, and the runoff decreased sharply, allowing the autumn drought to occur easily. Under natural conditions, the autumn drought in the basin was dominated by mild and moderate droughts. However, human activities have led to the occurrence of severe and extreme droughts in autumn, and the corresponding drought frequency increased by 15% and 60%, respectively (Figure 7b2). According to the monthly distribution of drought frequency corresponding to SRI12 (Figure 7c2), human activities caused extreme drought in August and November. On an annual scale, human activities had little effect on the level and frequency of the long-term hydrological drought.

3.5. Analysis of Drought Events Characteristics

To further examine the impact of human activities on the characteristics of the hydrological drought in the basin, we used the run theory to extract drought events and their characteristic variables based on the drought index SRI at different time scales, and analyzed the differences in drought duration and drought intensity under the influence of natural conditions and human activities in the Xilin River Basin (Figure 8). Figure 8a shows that for the short-term droughts SRI1 and SRI3, their average durations under natural conditions were 1.8 and 3.3 months, respectively. Under the impact of human activities, their average durations were 2.2 and 4.3 months, respectively. Human activities also caused the longest short-term drought to extend for another 3–4 months. The duration of long-term drought in the basin under natural conditions was around 6–12 months. Under the impact of human activities, the duration of this type of drought was approximately 7–14 months, and the average duration was 1.2 months longer than that under natural conditions. It can be seen from Figure 8b that the average values of the short-term drought intensity under natural conditions were 1.2 and 2.6. The average values of drought intensity based on SRI1 and SRI3 increased by 1.0 and 1.4, respectively, due to human activities. Likewise, human activities increased the drought intensity of long-term drought by 1.0. In general, human activities have enhanced drought duration and intensity at different time scales, i.e., prolonging drought duration and increasing drought intensity. From the statistical distribution of drought characteristics, human activities have increased the uncertainty of hydrological drought characteristics and expanded the distribution range of drought duration and drought intensity.

4. Discussion

Previous studies on grassland inland river basins in semi-arid regions mostly focused on the impacts of environmental change on precipitation or runoff [51,52], while there have been few studies on the impact of human activities on hydrological drought. In this study, we found the precipitation and runoff in the study area has trended downward over the past 45 years, which is consistent with the findings of many previous studies [29,31,53]. Some studies have shown that in recent decades, a high latitude circulation anomaly has increased the air pressure and weakened the east Asian monsoon, which in turn has reduced the northward transport of water vapor [54,55]. This is one of the main reasons for the decrease in precipitation in the northern China.
Since the 21st century, the development of animal husbandry and the coal industry has driven the rapid development of the economy in the study area. With the growth of GDP, the underlying surface conditions (e.g., land use and land cover) of the basin have also changed. Although climate change and human activities have combined to cause a decrease of runoff in the study area, human activities have played a dominant role; this conclusion is similar to that of Gao et al. [56].
Human activities have a significant impact on short-term hydrological drought, especially in summer and fall. During this period, the study area is in the peak production and peak water use period, and intensive human activities lead to an extension of drought duration and increase of drought intensity [27,28]. The impact of human activities on long-term hydrological drought is not obvious. This phenomenon is determined by the occurrence mechanism of hydrological drought. As we know, meteorological drought is caused by a reduction of precipitation, and the resulting hydrological cycle anomaly may lead to the occurrence of hydrological drought at longer time scales [57]. Since climate change is a long-term process, the propagation process from meteorological drought to hydrological drought is mostly affected by climate change at longer time scales [58].
Quantifying the impact of human activities on hydrological drought was carried out on the basis of the hydrological model simulation in this study, and accurate simulation of the hydrological process directly affected the results of hydrological drought assessment. Due to the limitations of the observation stations, the uncertainty of the model is relatively high; therefore, intensive observations are necessary to obtain more data for calibrating the model. In addition, we can compare the simulation results of multiple hydrological models and use optimization method to reduce uncertainties. It should be pointed out that this study conducted only a generalized evaluation of the impact of various potential human activities (e.g., water withdrawal and changes in underlying surface conditions) on drought. There are still some deficiencies in the fine evaluation of the driving effect of various activities on drought. In the future, the contribution of different human activities to drought should be more accurately and precisely distinguished based on water use and water conservation project monitoring data from human activities.

5. Conclusions

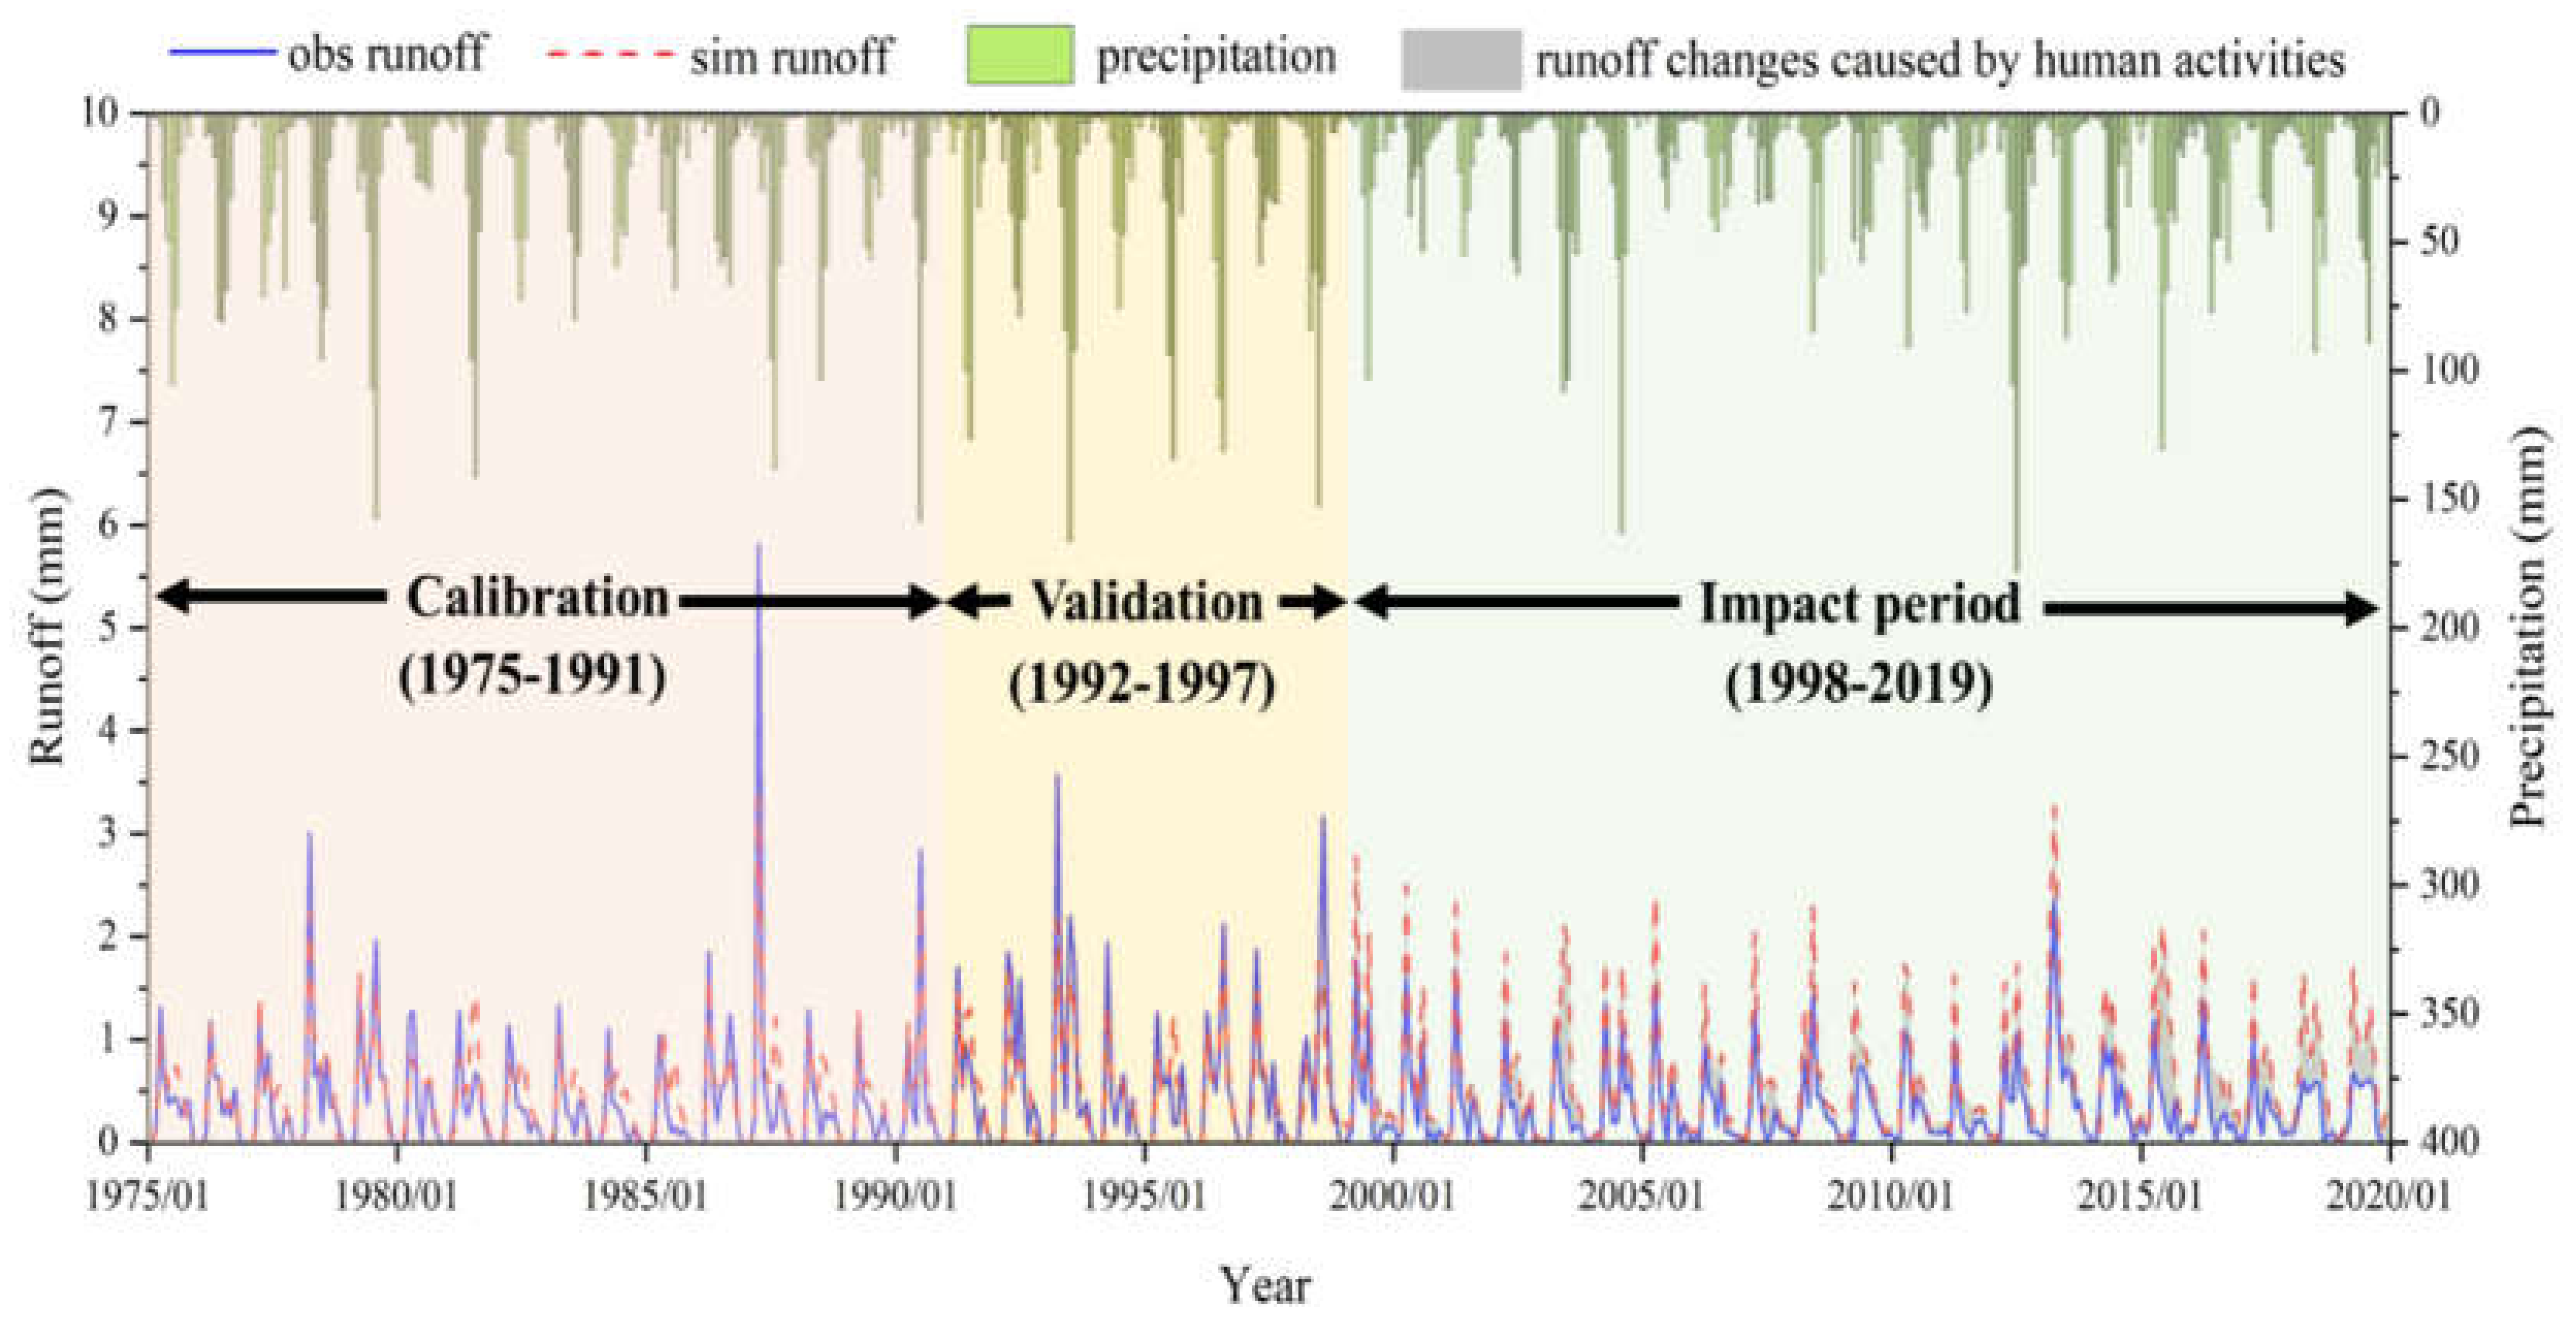
The SWAT model was applied to the Xilin River Basin to reconstruct the historical hydrological series under natural conditions. The multi-time scale standardized runoff index (SRI) was used to compare and evaluate the characteristics of the hydrological drought in the basin under natural conditions and the influence of human activities. This study revealed the impact of human activities on the hydrological drought at different time scales. The main conclusions are as follows:
(1) The runoff and precipitation series in the Xilin River Basin showed a downward trend, and the change in the runoff demonstrated a significant downward trend. The mutation test and the double accumulation curve of precipitation and runoff indicated that runoff in the Xilin River Basin showed a significant change in 1998.
(2) The SWAT model was used to reconstruct the natural runoff of the basin during a period of human influence. We found that human activities caused a significant reduction in runoff, contributing 68% of the reduction in basin runoff.
(3) Using SRI as the drought index, we evaluated the characteristics of the hydrological drought over multiple time scales. The results suggest that human activities had an obvious effect on the short-term drought and certain delaying effect on the onset of drought during the same period. In the case of long-term drought, human activities changed the drought level only slightly.
(4) Analysis of the frequency and characteristic variables of the hydrological drought showed that human activities have increased the frequencies of severe and extreme droughts in the basin over a short time scale. At the same time, human activities have significantly modified the seasonal distribution characteristics of short-term drought under natural conditions, resulting in severe and extreme drought events in autumn. In addition, human activities have increased drought duration and drought intensity at different time scales (i.e., prolonged drought duration and increased drought intensity). Human activities have also increased the uncertainty of the hydrological drought characteristics and expanded the distribution range of drought duration and drought intensity.

Author Contributions

All authors contributed to the study conception and design. W.L. developed the initial and final versions of this manuscript. W.W. and Y.W. contributed their expertise and insights, overseeing all of the analysis and supporting the writing of the final manuscript. Q.Q., S.Z. and W.Z. contributed the data and materials of the manuscript. All authors have read and agreed to the published version of the manuscript.

Funding

This work was financially supported by the Fundamental Research Fund of the China Institute of Water Resources and Hydropower Research (Grant MK2022J06, MK2020J11); the Science and technology plan key project of Inner Mongolia Autonomous Region of China (2021GG0072; 2021GG0020; 2021GG0050; 2020ZD0020); the IWHR Research & Development Support Program (No. MK0145B022021) and the IWHR Internationally-oriented Talents Program.

Institutional Review Board Statement

Not applicable.

Informed Consent Statement

Not applicable.

Data Availability Statement

The datasets generated during and analyzed during the current study are available from the corresponding author on reasonable request.

Conflicts of Interest

The authors have no conflict of interest to declare that are relevant to the content of this article.

References

  1. Zhang, Q.; Liu, J.; Vijay, P.; Gu, X.; Chen, X. Evaluation of impacts of climate change and human activities on stream-flow in the Poyang Lake basin, China. Hydol Process. 2016, 30, 2562–2576. [Google Scholar] [CrossRef]
  2. Veldkamp, T.; Wada, Y.; Aerts, J.; Döll, P.; Gosling, S.; Liu, J.; Masaki, Y.; Oki, T.; Ostberg, S.; Pokhrel, Y.; et al. Water scarcity hotspots travel downstream due to human interventions in the 20th and 21st century. Nat. Commun. 2017, 8, 1–12. [Google Scholar] [CrossRef] [PubMed]
  3. Naumann, G.; Alfieri, L.; Wyser, K.; Mentaschi, L.; Betts, R.; Carrao, H.; Spinoni, J.; Vogt, J.; Feyen, L. Global changes in drought conditions under different levels of warming. Geophys. Res. Lett. 2018, 45, 3285–3296. [Google Scholar] [CrossRef]
  4. Faiz, M.A.; Zhang, Y.; Tian, X.; Tian, J.; Zhang, X.; Ma, N.; Aryal, S. Drought index revisited to assess its response to vegetation in different agro-climatic zones. J. Hydrol. 2022, 614, 128543. [Google Scholar] [CrossRef]
  5. Rivera, J.; Araneo, D.; Penalba, O.; Villalba, R. Regional aspects of streamflow droughts in the Andean rivers of Patagonia, Argentina. Links with large-scale climatic oscillations. Hydrol. Res. 2018, 49, 134–149. [Google Scholar] [CrossRef] [Green Version]
  6. He, S.; Zhang, E.; Huo, J.; Yang, M. Characteristics of Propagation of Meteorological to Hydrological Drought for Lake Baiyangdian in a Changing Environment. Atmosphere 2022, 13, 1531. [Google Scholar] [CrossRef]
  7. Faiz, M.A.; Liu, D.; Fu, Q.; Naz, F.; Hristova, N.; Li, T.; Niaz, M.A.; Khan, Y.N. Assessment of dryness conditions according to transitional ecosystem patterns in an extremely cold region of China. J. Clean. Prod. 2020, 255, 120348. [Google Scholar] [CrossRef]
  8. Wander, N.; Wada, Y. Human and climate impacts on the 21st century hydrological drought. J. Hydrol. 2015, 526, 208–220. [Google Scholar] [CrossRef]
  9. Guo, Y.; Huang, S.; Huang, Q.; Leng, G.; Fang, W.; Wang, L.; Wang, H. Propagation thresholds of meteorological drought for triggering hydrological drought at various levels. Sci. Total Environ. 2020, 712, 136502. [Google Scholar] [CrossRef]
  10. Gu, L.; Chen, J.; Yin, J.; Xu, C.; Chen, H. Drought hazard transferability from meteorological to hydrological propagation. J. Hydrol. 2020, 585, 124761. [Google Scholar] [CrossRef]
  11. He, X.; Wada, Y.; Wanders, N.; Sheffield, J. Intensification of hydrological drought in California by human water management. Geophys. Res. Lett. 2017, 44, 1777–1785. [Google Scholar] [CrossRef] [Green Version]
  12. Yang, Y.; Mcvicar, T.; Donohue, R.; Zhang, Y.; Roderick, M.; Chiew, F.; Zhang, L.; Zhang, J. Lags in hydrologic recovery following an extreme drought: Assessing the roles of climate and catchment characteristics. Water Resour. Res. 2017, 53, 4821–4837. [Google Scholar] [CrossRef]
  13. Van Loon, A.; Gleeson, T.; Clark, J.; Van Dijk, A.; Stahl, K.; Hannaford, J.; Van Lanen, H. Drought in the Anthropocene. Nat. Geosci. 2016, 9, 89–91. [Google Scholar] [CrossRef] [Green Version]
  14. Ahmadi, B.; Ahmadalipour, A.; Moradkhani, H. Hydrological drought persistence and recovery over the CONUS: A multi-stage framework considering water quantity and quality. Water Res. 2019, 150, 97–110. [Google Scholar] [CrossRef]
  15. Wu, J.; Chen, X.; Yu, Z.; Yao, H.; Li, W.; Zhang, D. Assessing the impact of human regulations on hydrological drought development and recovery based on a ‘simulated-observed’ comparison of the SWAT model. J. Hydrol. 2019, 577, 123990. [Google Scholar] [CrossRef]
  16. Lin, Q.; Wu, Z.; Vijay, P.; Sadeghi, S.; He, H.; Lu, G. Correlation between hydrological drought, climatic factors, reservoir operation, and vegetation cover in the Xijiang Basin, South China. J. Hydrol. 2017, 549, 512–524. [Google Scholar] [CrossRef]
  17. Huang, S.; Li, P.; Huang, Q.; Leng, G.; Hou, B.; Ma, L. The propagation from meteorological to hydrological drought and its potential influence factors. J. Hydrol. 2017, 547, 184–195. [Google Scholar] [CrossRef]
  18. Yuan, F.; Wang, B.; Shi, C.; Cui, W.; Zhao, C.; Liu, Y.; Ren, L.; Zhang, L.; Zhu, Y.; Chen, T.; et al. Evaluation of hydrological utility of IMERG Final run V05 and TMPA 3B42V7 satellite precipitation products in the Yellow River source region, China. J. Hydrol. 2018, 567, 696–711. [Google Scholar] [CrossRef]
  19. Zhang, D.; Zhang, Q.; Qiu, J.; Bai, P.; Liang, K.; Li, X. Intensification of hydrological drought due to human activity in the middle reaches of the Yangtze River, China. Sci. Total Environ. 2018, 637, 1432–1442. [Google Scholar] [CrossRef]
  20. Zou, L.; Xia, J.; She, D. Analysis of impacts of climate change and human activities on hydrological drought: A case study in the Wei River Basin, China. Water Resour. Manag. 2018, 32, 1421–1438. [Google Scholar] [CrossRef]
  21. Tijdeman, E.; Hannaford, J.; Stahl, K. Human influences on streamflow drought characteristics in England and Wales. Hydrol. Earth Syst. Sci. 2018, 22, 1051–1064. [Google Scholar] [CrossRef] [Green Version]
  22. Van Loon, A.; Rangecroft, S.; Coxon, G.; Naranjo, J.; Ogtrop, F.; Van Lanen, H. Using paired catchments to quantify the human influence on hydrological droughts. Hydrol. Earth Syst. Sci. 2019, 23, 1725–1739. [Google Scholar] [CrossRef] [Green Version]
  23. Firoz, A.; Nauditt, A.; Fink, M.; Ribbe, L. Quantifying human impacts on hydrological drought using a combined modelling approach in a tropical river basin in central Vietnam. Hydrol. Earth Syst. Sci. 2017, 22, 547–565. [Google Scholar] [CrossRef] [Green Version]
  24. Wang, Y.; Li, J.; Zhang, T.; Wang, B. Changes in drought propagation under the regulation of reservoirs and water diversion. Theor. Appl. Climatol. 2019, 138, 701–711. [Google Scholar] [CrossRef]
  25. Jiang, S.; Wang, M.; Ren, L.; Xu, C.; Yuan, F.; Liu, Y.; Shen, H. A framework for quantifying the impacts of climate change and human activities on hydrological drought in a semiarid basin of Northern China. Hydrol. Process. 2019, 33, 1075–1088. [Google Scholar] [CrossRef]
  26. Rangecroft, S.; Van Loon, A.; Maureira, H.; Verbist, K.; Hannah, D. Multi-method assessment of reservoir effects on hydrological droughts in an arid region. Earth Syst. Dynam. 2016, 11–32. [Google Scholar] [CrossRef] [Green Version]
  27. Ren, L.; Shen, H.; Yuan, F.; Zhao, C.; Yang, X.; Zheng, P. Hydrological drought characteristics in the Weihe catchment in a changing environment. Adv. Water Sci. 2016, 27, 492–500. (In Chinese) [Google Scholar] [CrossRef]
  28. Su, Z.; Ma, M.; Xing, Z.; Lv, J.; Zhang, X.; Yu, Z.; Yi, P. Characterizing the hydrological drought evolutions under human interventions: A case study in the Daling River Basin in Liaoning Province. J. China Inst. Water Resour. Hydropower Res. 2021, 19, 1–9. (In Chinese) [Google Scholar] [CrossRef]
  29. Wang, X.; Yang, X.; Liu, T.; Li, F.; Gao, R.; Duan, L.; Luo, Y. Trend and extreme occurrence of precipitation in a mid-latitude Eurasian steppe watershed at various time scales. Hydrol. Process. 2014, 28, 5547–5560. [Google Scholar] [CrossRef]
  30. Guo, Q.; Hu, Z.; Li, S.; Yu, G.; Sun, X.; Zhang, L.; Mu, S.; Zhu, X.; Wang, Y.; Li, Y.; et al. Contrasting responses of gross primary productivity to precipitation events in a water-limited and a temperature-limited grassland ecosystem. Agric. For. Meteorol. 2015, 214–215, 169–177. [Google Scholar] [CrossRef]
  31. Gao, R.; Li, F.; Wang, X.; Liu, T.; Du, D.; Bai, Y. Spatiotemporal variations in precipitation across the Chinese Mongolian plateau over the past half century. Atmos. Res. 2017, 193, 204–215. [Google Scholar] [CrossRef]
  32. Zhou, Y.; Li, N.; Wu, J. Analysis of drought and its possible causes in Inner Mongolia region for nearly 30 years. J. Catastrophol. 2013, 28, 67–73. (In Chinese) [Google Scholar]
  33. Li, W.; Duan, L.; Luo, Y.; Liu, T.; Scharaw, B. Spatiotemporal Characteristics of Extreme Precipitation Regimes in the Eastern Inland River Basin of Inner Mongolian Plateau, China. Water 2018, 10, 35. [Google Scholar] [CrossRef] [Green Version]
  34. Xue, H.; Yu, R.; Zhang, Z.; Qi, Z.; Lu, X.; Liu, T.; Gao, R. Greenhouse gas emissions from the water–air interface of a grassland river: A case study of the Xilin River. Sci. Rep. 2021, 11, 2659. [Google Scholar] [CrossRef]
  35. Yang, P.; Xia, J.; Zhang, Y.; Zhan, C.; Sun, S. How is the risk of hydrological drought in the Tarim River Basin, Northwest China? Sci. Total Environ. 2019, 693, 133555. [Google Scholar] [CrossRef] [PubMed]
  36. Kumar, S.; Merwade, V. Impact of watershed subdivision and soil data resolution on SWAT model calibration and parameter uncertainty. Water Resour. Assoc. 2009, 45, 1179–1196. [Google Scholar] [CrossRef]
  37. Arnold, J.; Srinivasan, R.; Muttiah, R.; Williams, J. Large area hydrologic modeling and assessment part I: Model development. Water Resour. Assoc. 1998, 34, 73–89. [Google Scholar] [CrossRef]
  38. Shrestha, M.; Recknagel, F.; Frizenschaf, J.; Meyer, W. Future climate and land uses effects on flow and nutrient loads of a Mediterranean catchment in South Australia. Sci. Total Environ. 2017, 590, 186–193. [Google Scholar] [CrossRef] [PubMed]
  39. Guo, T.; Engel, B.; Shao, G.; Arnold, J.; Srinivasan, R.; Kiniry, J. Development and improvement of the simulation of woody bioenergy crops in the soil and water assessment tool (SWAT). Environ. Modell. Softw. 2019, 122, 104295. [Google Scholar] [CrossRef]
  40. Ma, T.; Duan, Z.; Li, R.; Song, X. Enhancing SWAT with remotely sensed LAI for improved modelling of ecohydrological process in subtropics. J. Hydrol. 2019, 570, 802–815. [Google Scholar] [CrossRef] [Green Version]
  41. Zhang, H.; Wang, B.; Liu, D.; Zhang, M.; Leslie, L.; Yu, Q. Using an improved SWAT model to simulate hydrological responses to land use change: A case study of a catchment in tropical Australia. J. Hydrol. 2020, 585, 124822. [Google Scholar] [CrossRef]
  42. Wu, J.; Zheng, H.; Xi, Y. SWAT-Based Runoff Simulation and Runoff Responses to Climate Change in the Headwaters of the Yellow River, China. Atmosphere 2019, 10, 509. [Google Scholar] [CrossRef] [Green Version]
  43. Mann, H. Nonparametric tests against trend. Econometrica 1945, 13, 245–259. [Google Scholar] [CrossRef]
  44. Kendall, M. Rank Correlation Methods; Charles Griffin: London, UK, 1975. [Google Scholar]
  45. Pettitt, A. A non-parametric approach to the change-point problem. Appl. Statist. 1979, 28, 126–135. [Google Scholar] [CrossRef]
  46. Jiang, S.; Ren, L.; Hong, Y.; Yong, B.; Yang, X.; Yuan, F.; Ma, M. Comprehensive evaluation of multi-satellite precipitation products with a dense rain gauge network and optimally merging their simulated hydrological flows using the Bayesian model averaging method. J. Hydrol. 2012, 452–453, 213–225. [Google Scholar] [CrossRef]
  47. Shukla, S.; Wood, A. Use of a standardized runoff index for characterizing hydrologic drought. Geophys. Res. Lett. 2008, 35, 226–236. [Google Scholar] [CrossRef] [Green Version]
  48. Yevjevich, V. An Objective Approach to Definitions and Investigations of Continental Hydrologic Droughts; Hydrology Papers 23; Colorado State University: Fort Collins, CO, USA, 1967. [Google Scholar]
  49. Wu, J.; Chen, X.; Yao, H.; Gao, L.; Chen, Y.; Liu, M. Non-linear relationship of hydrological drought responding to meteorological drought and impact of a large reservoir. J. Hydrol. 2017, 551, 495–507. [Google Scholar] [CrossRef]
  50. Wang, W.; Gao, R.; Wang, X.; Liu, T.; Bai, Y. Quantitative analysis of runoff variations as affected by climate variability and human activity in the Xilin River Basin. Res. Soil Water Conserv. 2018, 25, 347–353. (In Chinese) [Google Scholar] [CrossRef]
  51. Wang, X.; Gao, R.; Yang, X. Responses of soil moisture to climate variability and livestock grazing in a semiarid Eurasian steppe. Sci. Total Environ. 2021, 781, 146705. [Google Scholar] [CrossRef]
  52. Zhang, A.; Gao, R.; Wang, X.; Liu, T.; Fang, L. Historical Trends in Air Temperature, Precipitation, and Runoff of a Plateau Inland River Watershed in North China. Water 2020, 12, 74. [Google Scholar] [CrossRef] [Green Version]
  53. Huang, J.; Sun, S.; Xue, Y.; Zhang, J. Changing characteristics of precipitation during 1960–2012 in Inner Mongolia, northern China. Meteorol. Atmos. Phys. 2015, 127, 257–271. [Google Scholar] [CrossRef]
  54. Han, D.; Wang, G.; Liu, T.; Xue, B.; Kuczera, G.; Xu, X. Hydroclimatic response of evapotranspiration partitioning to prolonged droughts in semiarid grassland. J. Hydrol. 2018, 563, 766–777. [Google Scholar] [CrossRef]
  55. Yuan, R.; Chang, L.; Gupta, H.; Niu, G. Climatic forcing for recent significant terrestrial drying and wetting. Adv. Water Resour. 2019, 133, 103425. [Google Scholar] [CrossRef]
  56. Gao, R.; Bai, Y.; Liu, T.; Wang, X.; Wang, W. Evolution characteristics of runoff in the typical garssland inland river basin of Inner Mongolia Plateau. South-to-North Water Transf. Water Sci. Technol. 2018, 16, 10–17. (In Chinese) [Google Scholar] [CrossRef]
  57. Van Loon, A.F.; Tijdeman, E.; Wanders, N.; Van Lanen, H.A.J.; Teuling, A.J.; Uijlenhoet, R. How climate seasonality modifies drought duration and deficit. J. Geophys. Res. Atmos. 2014, 119, 4640–4656. [Google Scholar] [CrossRef]
  58. Jehanzaib, M.; Shah, S.A.; Yoo, J.; Kim, T.-W. Investigating the impacts of climate change and human activities on hydrological drought using non-stationary approaches. J. Hydrol. 2020, 588, 125052. [Google Scholar] [CrossRef]
Figure 1. Location of the Xilin River Basin and spatial distribution of hydrometeorological stations, and the vegetation types. (Dem is the abbreviation for digital elevation model).
Atmosphere 13 02079 g001
Figure 2. Framework for evaluation of impacts of climate change and human activities on runoff for the decreasing runoff.
Atmosphere 13 02079 g002
Figure 3. Definitions of hydrological drought and drought characteristic variables (a, b, c, d and e indicate whether a drought event occurred).
Atmosphere 13 02079 g003
Figure 4. Double mass curve of the cumulative precipitation and runoff depth.
Atmosphere 13 02079 g004
Figure 5. Observed and simulated monthly runoff for the calibration (1975–1991), the validation (1992–1997) and the impact period (1998–2019) of the Xilin River Basin.
Atmosphere 13 02079 g005
Figure 6. Variation of SRI based on the observed and simulated runoff during the impact period. (a) SRI1; (b) SRI3; (c) SRI12.
Atmosphere 13 02079 g006
Figure 7. Drought frequency based on observed and simulated runoff during the impact period. (a1) Different levels of drought on SRI1; (a2) different levels of drought by month on SRI1; (b1) different levels of drought on SRI3; (b2) different levels of drought by month on SRI3; (c1) different levels of drought on SRI12; (c2) different levels of drought by month on SRI12.
Atmosphere 13 02079 g007
Figure 8. Boxplots of drought duration and drought intensity based on the observed and simulated runoff during the impact period. (a) Drought duration; (b) drought intensity.
Atmosphere 13 02079 g008
Table 1. Expression of NSE, R2 and PBIAS.
ExpressionRangeSatisfactory
NSE N S E = 1 i = 1 N ( Q o b s Q s i m ) 2 i = 1 N ( Q o b s Q ¯ o b s ) 2 −∞–10.5 ≤ NSE ≤ 0.65
R2 R 2 = [ i = 1 N ( Q o b s Q ¯ o b s ) ( Q s i m Q ¯ s i m ) ] 2 i = 1 N ( Q o b s Q ¯ o b s ) 2 i = 1 N ( Q s i m Q ¯ s i m ) 2 0–1R2 ≥ 0.5
PBIAS P B I A S = i = 1 N ( Q s i m Q o b s ) i = 1 N ( Q o b s ) × 100 % −∞–+∞−25% ≤ PBIAS ≤ 25%
Table 2. Drought grades classified with standardized runoff index.
GradeCategorySRI
1No drought−0.5 < SRI
2Mild drought−1.0 < SRI ≤ −0.5
3Moderate drought−1.5 < SRI ≤ −1.0
4Severe drought−2.0 < SRI ≤ −1.5
5Extreme droughtSRI ≤ −2.0
Table 3. Results of Mann-Kendall trend test and Pettitt test for the annual precipitation and runoff series over the Xilin River Basin in the period of 1975–2019.
ElementMann-Kendall TestPettitt Test
ZTrendp-ValueStep Change Year
Runoff−4.14↓↓4.33 × 10−61998
Precipitation−0.170.67
Note: ‘↓’ Indicates a downward trend; ‘↓↓’ Indicates a significant downward trend which significant at the 0.05 level; ‘—’ Indicates no significant abrupt point.
Table 4. Model parameters fitted value during calibration period.
ParameterDefinitionFitted Value
CN2SCS runoff curve number for moisture condition II0.13
ESCOSoil evaporation compensation factor0.60
SOL_AWCAvailable water capacity of soil0.25
SOL_KSaturated permeability coefficient of soil0.10
SOL_BDVolume weight of soil0.10
ALPHA_BNKBaseflow alpha factor for bank storage0.13
CH_K2Effective hydraulic conductivity of main channel99.80
Table 5. Performance of flow simulation for the Xilin River Basin using the SWAT model.
Periodp-FactorR-FactorR2NSEPBIASRMSE
Calibration (1975–1991)0.620.360.770.7515.790.23
Validation (1992–1997)0.510.420.680.7319.720.25
Table 6. Effects of climate change and human activities on runoff reduction over the Xilin River Basin in the period of 1998–2019.
Basin Δ Q t o t / mm Δ Q c v / mm Δ Q h a / mm I c v / % I h a / %
Xilin River Basin−1.01−0.32−0.693268
Publisher’s Note: MDPI stays neutral with regard to jurisdictional claims in published maps and institutional affiliations.

