Article

Soil Respiration and Organic Carbon Response to Biochar and Their Influencing Factors

1
College of Water Conservancy and Civil Engineering, Inner Mongolia Agricultural University, Hohhot 010018, China
2
College of Energy and Environment, Inner Mongolia University of Science & Technology, Baotou 014017, China
3
Inner Mongolia Branch of China Three Gorges New Energy (Group), Hohhot 010018, China
*
Author to whom correspondence should be addressed.
Atmosphere 2022, 13(12), 2038; https://doi.org/10.3390/atmos13122038
Submission received: 14 November 2022 / Revised: 30 November 2022 / Accepted: 1 December 2022 / Published: 4 December 2022
(This article belongs to the Special Issue Greenhouse Gas Emissions from Agricultural Activities)

Abstract

:
Biochar application is an important measure to regulate SOC. However, the effects of biochar application on soil respiration and SOC fraction of the saline soil have been scarcely investigated. Therefore, in this study, we monitored the annual SOC, nutrients, temperature, water content, and respiration rate under three maize-straw-derived biochar application doses (0, 15, and 30 t∙hm−2). Biochar enriched the soil in terms of fast-acting potassium and phosphorus, alkali-hydrolyzable N, NO 3 -N, and NH 4 + -N to varying degrees. One-time biochar application in the trial year continued to fertilizer retention in the following year. Mineral-associated organic carbon and SOC contents increased with time after biochar application, whereas the changes in particulate organic carbon content were the opposite; soil respiration rate was reduced by 7.7–14.7%, and the reduction increased with the dose as well in successive years. The soil respiration rate and soil temperature showed a significant linear correlation, but the application of a high amount of biochar reduced the correlation between the two. Considering the soil respiration rate and physicochemical properties, the best biochar application rate for saline soil is suggested to be 30 t∙hm−2. This study is of great significance for soil carbon sequestration, emission reduction in saline areas, and the realization of a “carbon peak” in the sense of farmland.

1. Introduction

The balance of the soil carbon pool, which is the largest pool among those in terrestrial ecosystems, is approximately 2500 Pg, and the soil organic carbon (SOC) pool is approximately 1550 Pg [1]. SOC particulate organic carbon (POC), mineral-associated organic carbon (MAOC), and changes in their ratio, not only affect the soil structure, water-holding capacity, buffering, and crop-nutrient availability, but also affect the carbon balance between soil and atmosphere [2]. Global warming has been known to result in the release of terrestrial carbon, suggesting positive feedback between global warming and soil respiration [3]; even minor changes in the carbon pool can affect global atmospheric CO2 levels [4]. As agricultural soils participate most actively in the soil carbon pool [5], studying the changes in soil respiration and SOC in agricultural fields has positive implications for soil carbon sequestration, emission reduction, and climate-change mitigation [6].
Biochar is a new environmental functional material that improves soil physicochemical properties, carbon sequestration, and emission reduction, and is widely used in agricultural soils as a tillage measure [7]. Studies have shown that the addition of biochar can improve the effectiveness of soil nutrients and their uptake by plants [8,9,10] and increase the content of fast-acting soil nutrients [11]. Biochar can mitigate climate change by binding organic carbon to soil particles, thereby reducing soil respiration [12], and by increasing the soil carbon sink, or carbon storage [13]. The carbon sequestration capacity depends on the retention of carbon sequestered by biochar after pyrolysis and the stability of carbon sequestration [14]. A short-term application of biochar to soil results in an increase in the forest [15], wetlands [16], and agricultural land [17], and a reduction in soil respiration. However, this short-term effect is influenced by land use and strongly depends on soil moisture and temperature conditions [18]. Additionally, Ge et al. [19] explored the changing patterns of soil respiration in subtropical Moso bamboo plantations at different periods and found that biochar addition reduced soil respiration rates and annual cumulative soil CO2 emissions during both growing and non-growing seasons. Mohan et al. [20] also found that soil respiration rates were reduced to varying degrees after the application of rice-husk and corn-stover biochar for a certain period of time. As far as relevant studies are concerned, the application of biochar to soil can inhibit soil respiration. However, some studies have found that the unstable C input from biochar itself may lead to the decomposition of organic matter in the original soil, thereby increasing the substrate for microbial action and promoting carbon emissions [21]. The function of biochar as a long-term soil carbon reservoir seems to be overestimated, and its function is at least partially offset by its ability to promote the decomposition of native organic matter [22]. It is evident that there is still uncertainty regarding the role of biochar in decomposition, conversion of native SOC, and reduction in soil respiration. These challenges inevitably raise questions about the long-term application of biochar as a carbon-sequestration and emission-reduction material in soils.
The application of biochar is an important measure to regulate SOC, not only because it directly increases carbon input and changes the effectiveness of SOC, but also because it has an important impact on the transformation process of the soil carbon pool, which in turn affects soil carbon fixation and greenhouse gas emissions [23]. Differences in the type of soil and biochar, cropping system, and other conditions can cause changes to the physicochemical properties of soil and thus affect SOC mineralization rates to varying degrees. A previous study reported that biochar application promoted the formation of SOC and enriched soil carbon content [24], and the SOC content increased proportionately with biochar application [25]. Cui et al. [26] found that biochar application increased total soil carbon content by 26% in the presence of apoplankton and, under warmer conditions, increased soil effective phosphorus and organic carbon concentrations. It is generally believed that POC is composed of organic carbon combined with sand particles, which usually include undecomposed or semidecomposed plants, animal residues, etc. It is susceptible to environmental factors, has a fast turnover rate in the soil, and can be used as a sensitive indicator of SOC changes. The effect of biochar addition on the content of these two SOC fractions has rarely been reported.
Recently, studies on the effects of applied biochar on SOC pools have mainly been focused on ecosystems with non-saline soils, such as woodlands, acidic farmlands, wetlands, and paddy fields, and have concentrated on discontinuous experimental cycles, such as crop-growth periods, seeding periods, and indoor trials. Few studies have investigated the effects of applied biochar on annual soil respiration and SOC in saline soils. However, the high degree and wide distribution of soil salinization in Inner Mongolia are directly related to soil physicochemical properties and microbial activity, and affect respiration and soil organic matter, which are exacerbated by the solid freeze–thaw action in the area. Gas emissions from soils during freeze–thaw cycles may account for 20–70% of the total annual amount and are a hot source of atmospheric greenhouse gas emissions [27]. The effects of biochar application on soil respiration and SOC fraction of the saline soil in the irrigation area are unclear. Therefore, in this study, a field trial was conducted on saline soil in the irrigation area in Inner Mongolia to investigate the effects of biochar application on annual soil respiration and SOC. This study provides a scientific basis and technical support for improving the properties of saline soil.

2. Materials and Methods

2.1. Overview of the Study Area

The experiment was conducted between November 2019 and September 2021 in the experimental demonstration project area of “changing salt and increasing grass (forage) to promote herding” in Wuyuan County, Bayannur City, Inner Mongolia Autonomous Region (40°46′30″–41°16′45″ N, 107°35’70″–108°37’50″ E). The site was located in the hinterland of the Inner Mongolia Loop Plain, which has a typical temperate continental climate with a dry climate, long soil-freezing period, and serious soil salt aggregation in winter and spring. According to local weather records, the average multiyear temperature, rainfall, total radiation, and sunshine hours in the study area were 6.1 °C, 177 mm, 153.4 kcal∙cm−2, and 3231 h, respectively. The sunshine hours during the freezing and thawing periods accounted for 44% of the year. The average minimum ground temperature and depth of permafrost were −12.3 °C and 100–130 cm, respectively. The soil entered the freezing period in early November, and all frozen layers melted around the middle of April in the following year.
Five 1 m × 1 m sample squares were selected before the start of the experiment, and soil samples of 0–20 cm were collected using a 50 mm diameter auger to remove surface plants and other debris. The soil samples were mixed uniformly and placed in sealed bags, brought back to the laboratory within 24 h, dried naturally, and sieved through a 2 mm sieve for determination of their basic physical and chemical properties. The soil texture was chalky loam with pH 8.87, conductivity value of 1.88 mS∙m−1, salinity of 3.59 g∙kg−1, cation exchange capacity (CEC) of 7.56 cmol∙kg−1, organic matter of 12.33 g∙kg−1, fast-acting phosphorus of 7.53 mg∙kg−1, fast-acting potassium of 351.50 mg∙kg−1, and alkaline nitrogen 58.91 mg∙kg−1, sand 16.70%, slit 79.03%, and clay 4.27%.

2.2. Experimental Design

Three biochar levels were used in this experiment: 30 t∙hm−2 (B30), 15 t∙hm−2 (B15), and 0 t∙hm−2 (B0). The plots were 40 m long and 4 m wide, with a net area of 160 m2. Three replicates were set up for each treatment, for a total of nine plots. To avoid the lateral transport of water and fertilizer in the soil, each plot was separated by a cofferdam (2.0 m wide and 0.3 m high). Biochar was evenly spread on the test plots on 15 October 2019, and evenly mixed with the 20 cm soil layer using a rototiller, after which no more biochar was applied. Corn-straw biochar from Liaoning Jinhefu Agricultural Development Co., Ltd., was used as the test biochar. The biochar was prepared by pyrolysis at 360 °C under anaerobic conditions, with pH 8.75, fast-acting phosphorus 307.52 mg∙kg−1, fast-acting potassium 786.50 mg∙kg−1, alkali-hydrolyzable N 401.94 mg∙kg−1, carbon content 364.07 g∙kg−1, nitrogen content 7.56 g∙kg−1, phosphorus 0.17 g∙kg−1, and carbon-to-nitrogen ratio 81.57.
Water and fertilizer management were the same for all the experimental plots. The experiment was carried out on 25 April 2020 and 20 April 2021, with two spring irrigations and salt suppression at a water volume of 225 mm in surface irrigation. The test crop was sunflower of variety “902”, which is commonly grown by local farmers. It was planted by mulching and spot-sowing manually at a spacing of 60 cm between rows and 50 cm between plants. Manual ploughing was carried out before sowing to a depth of approximately 30 cm. Diamine phosphate, having N and P mass fractions of 18% and 46%, respectively, was applied at the rate of 450 kg∙hm−2. The base fertilizer, applied at the rate of 337.5 kg∙hm−2, had N, P, and K mass fractions of 15% each. Common urea was applied as a N source at the rate of 75 kg∙hm−2 at the budding, flowering, and filling stages. Other management practices were consistent with local production practices.
The experimental study period was divided into four phases: the freezing and thawing period (FTP1) and crop-growth period (CP1) for the first year, and the freezing and thawing period (FTP2) and crop-growth period (CP2) for the second year. With reference to the meteorological data of previous years, the freeze–thaw period was specifically divided into the first freezing period (FFP), freezing period (FP), and thawing period (TP). For FFP, when the daily minimum temperature starts to reach below 0 °C, the soil surface layer starts to freeze until the daily maximum temperature reaches below 0 °C. For FP, when the daily maximum temperature continues to be below 0 °C, the freezing front moves rapidly downward until the soil reaches the maximum freezing depth, and the snow no longer melts. For TP, when the daily maximum temperature reaches above 0 °C in spring and the snow starts to melt, the soil layer starts to thaw in both directions until the full thawing stage. The specific test phase divisions and dates are listed in Table 1.

2.3. Sample Collection and Index Determination

2.3.1. Soil Respiration Measurement

The soil respiration rate was measured using a PS-3000 (Beijing LICA United Technology Limited, Beijing, China) fully automatic portable respiration system connected to an SC-11 respiration chamber. Fixed points were selected for each treatment at three locations: between rows, between plants, and at the edge of the strips. To reduce disturbance to the soil surface, the burial position of the polyvinyl chloride (PVC) ring (191 mm inner diameter, 200 mm outer diameter, and 10 cm length) was kept constant throughout the test cycle. The chamfered end of the PVC ring was pressed into the soil for approximately 5 cm, and approximately 5 cm of the part was exposed to remove the debris inside the ring. Each PVC ring was measured once, two cycles were set, each treatment was repeated thrice, and the average value was taken as the daily soil respiration value. The collection time was set from 9:00 a.m. to 12:00 p.m., and the collection frequency was set to approximately once every 20 days during the freezing period because of the cold climate and difficulty of sampling. During the first freezing and thawing periods, the soil was in a state of freezing and thawing because of the large temperature differences between day and night in the local climate, and soil greenhouse gas emissions fluctuated greatly during this period. Therefore, the collection frequency was set at approximately once every 10 days. The crop-growth period was sampled according to the growth stages of sunflower (seedling, budding, flowering, filling, and maturity), with minor adjustments according to changes in management measures, rainfall, and other conditions. Total soil respiration for the different treatments were calculated as follows [28]:
D i = R s × 3600 × 24 × 44 × 10 6
C S = i = f i s t i = l a s t 1 [ D i + D i + 1 2 × ( N i + 1 N i 1 ) + D i ] + D l a s t
where C S is the total amount of soil respiration (t·hm−2); Di is the CO2 emission rate on the day of measurement (g·m−2); Rs is the CO2 emission rate on the day of measurement (μmol/m2·s); 44 is the molar mass of CO2 (g·mol−1); 3600, 24, and 10−6 are conversion factors; first and last denote the first and last soil CO2 emission rates, respectively; and Ni+1 and Ni denote the i + 1 and i measurements, respectively.

2.3.2. Soil Hydrothermal Factor Determination

While measuring soil respiration, soil samples were collected at a depth of 0–20 cm following the soil core method by using a hand-held power sampler. Sample collection procedure was repeated three times; a portion of the collected samples was immediately placed in an aluminum box and then oven-dried at 105 °C for 24 h in the laboratory until constant weight. For the soil temperature in the 0–20 cm soil layer, the monitoring interval was set to once every 4 h. Data were recorded at the end of the experiment. The specific soil hydrothermal index determination method is shown in Table 2.

2.3.3. Collection and Determination of Soil Samples

Soil samples and extracted gas were collected simultaneously. When there was snow cover during the freeze–thaw period, the area with consistent snow thickness was selected for sampling. The soil surface layer covered with snow was cleared with a shovel before sampling and covered again with snow after sampling was completed. Mixed soil samples were collected randomly from five sample points in each treatment area, and sufficient samples were taken in quadrature. The soil samples were placed in plastic bags immediately after being cleared of impurities such as plant roots and stones, brought back to the laboratory for natural air-drying, and sieved through 2 mm. The specific soil nutrient index determination method is shown in Table 2.

2.4. Statistical Analyses

The measured soil respiration rate was fitted to the soil temperature in the 0–20 cm soil layer, and the following relationship was obtained:
R = a T + b
where R is the measured soil respiration rate; T is the corresponding 0–20 cm soil temperature; and a and b are characteristic parameters obtained from the fit.
The measured soil respiration rate was fitted to the soil water content in the 0–20 cm soil layer, and the relationship obtained is shown below.
R = A W 2 + B W + C
where R is the measured soil respiration rate; W is the corresponding 0–20 cm soil water content; and A, B, and C are the characteristic parameters obtained by the fit.
One-way analysis of variance (ANOVA) was conducted using SPSS (v22.0, IBM, Chicago, IL, USA) to compare the effects of biochar addition on soil respiration, nutrients, and organic carbon indicators. Correlation analysis was applied to compare the coupling relationship between soil respiration rate and hydrothermal factors using linear regression analysis. Pearson correlation coefficients were calculated to explore the correlation between soil respiration and its physicochemical properties (n = 36), with p < 0.01 being highly significant and p < 0.05 being significant. Finally, plots were created using Microsoft Excel 2021.

3. Results and Analysis

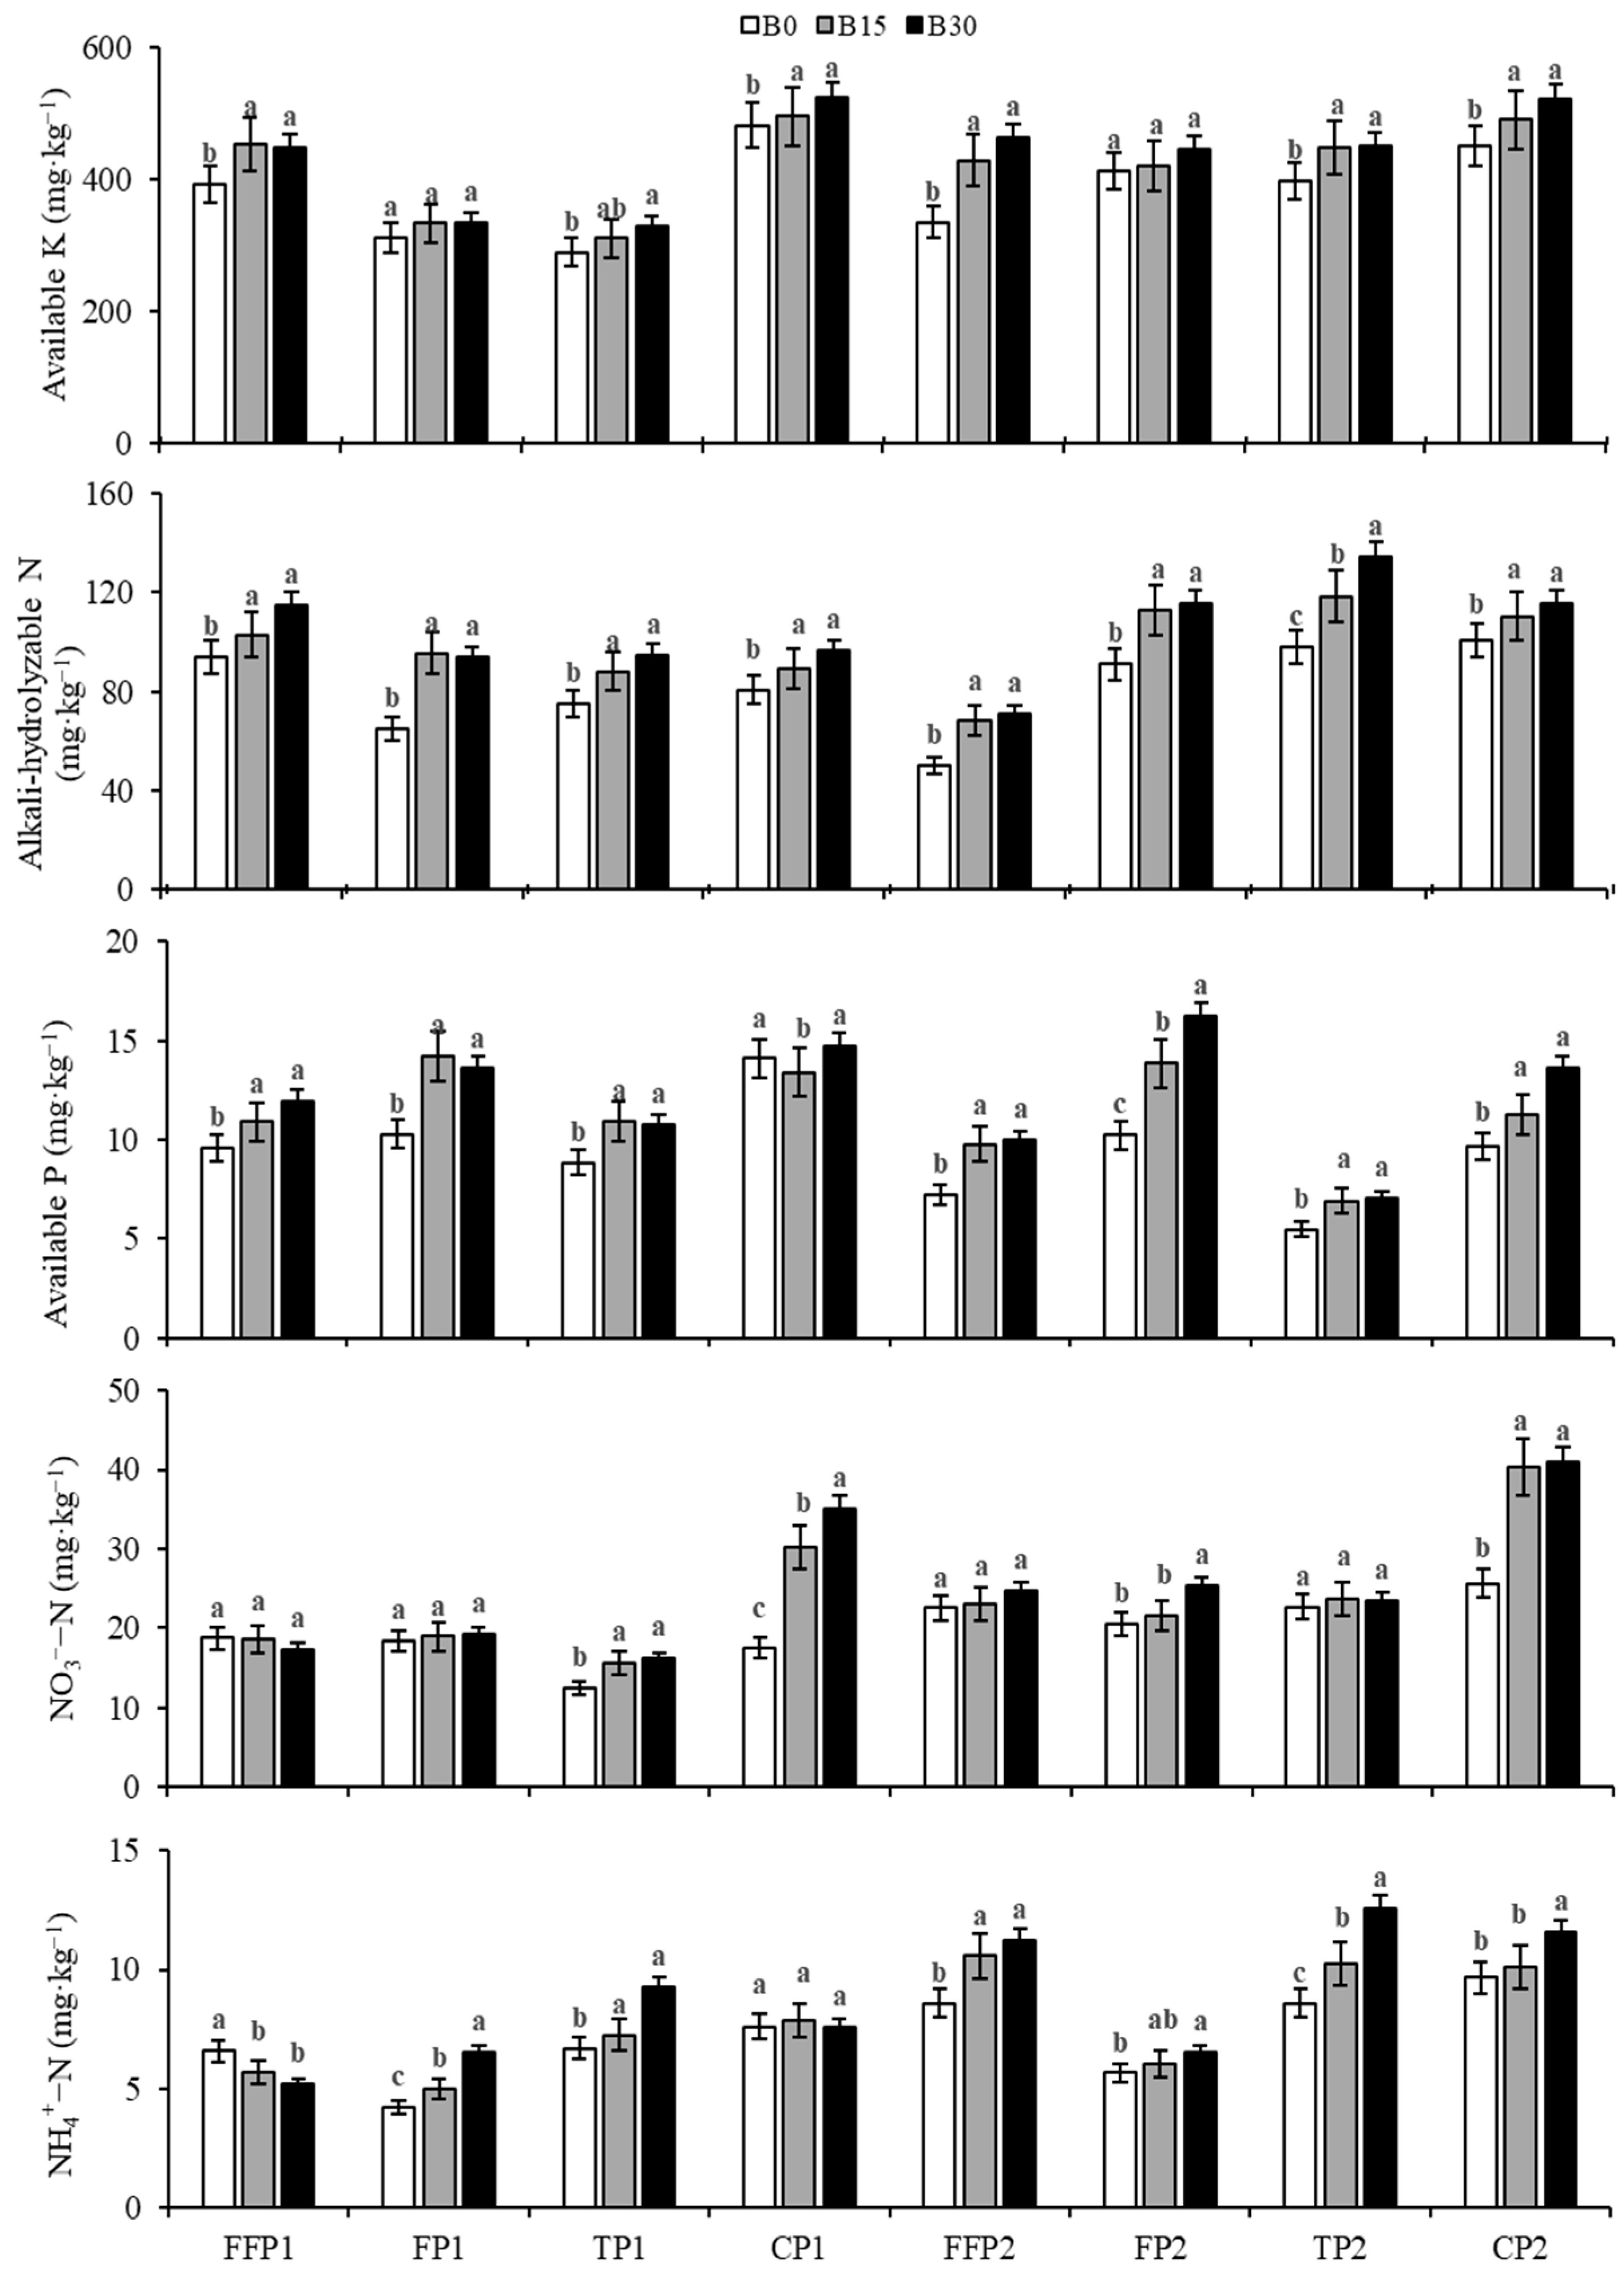
3.1. Soil Nutrient Content Dynamics

As shown in Figure 1, an overall trend of fluctuation in the content of each soil nutrient was observed. Throughout the experimental period, biochar application enriched soil fast-acting potassium, alkali-hydrolyzable N, fast-acting phosphorus, NO 3 -N and NH 4 + -N contents. The contents of each nutrient increased with the increase in biochar application, exhibiting the same performance after 2 years. However, the effects of different treatments on soil nutrients were not consistent across different periods. Compared with the B0 treatment, the B15 and B30 treatments increased soil fast-acting potassium content by ~1.8–27.8% and ~7.7–38.1%, respectively, and showed significant differences between the biochar treatment and the control treatment in all periods except for the 2 year freezing period. The biochar treatments significantly increased the soil alkali-hydrolyzable N content in both the first and second years of the experiment, with the B15 and B30 treatments increasing by ~9.5–47.3% and ~14.9–44.5%, respectively. Except for the B15 treatment, which reduced the soil fast-acting phosphorus in the first year of crop growth, the biochar treatments were significantly different from the control treatment in the rest of the period. The B15 and B30 treatments increased the 2 year average fast-acting phosphorus content by 21.0% and 29.9%, respectively, compared with that of the B0 treatment. The application of biochar promoted the conversion of NH 4 + -N to NO 3 -N and improved nitrogen utilization. Overall, biochar application reduced soil NO 3 -N, and NH 4 + -N contents at the beginning of application, and with the increase in biochar application time, the effect of biochar improved soil inorganic N content gradually. Notably, the average change in NO 3 -N content in the B15 and B30 treatments, compared with that in the B0 treatment, reached 63.1% and 76.1%, and the B15 and B30 treatments increased the NH 4 + -N content by ~3.3–23.3% and ~15.4–23.3%, respectively. It can be seen that the one-time application of biochar in the test year can continue to play a role in the fertilizer retention in the following year and can increase soil fertility to different degrees.

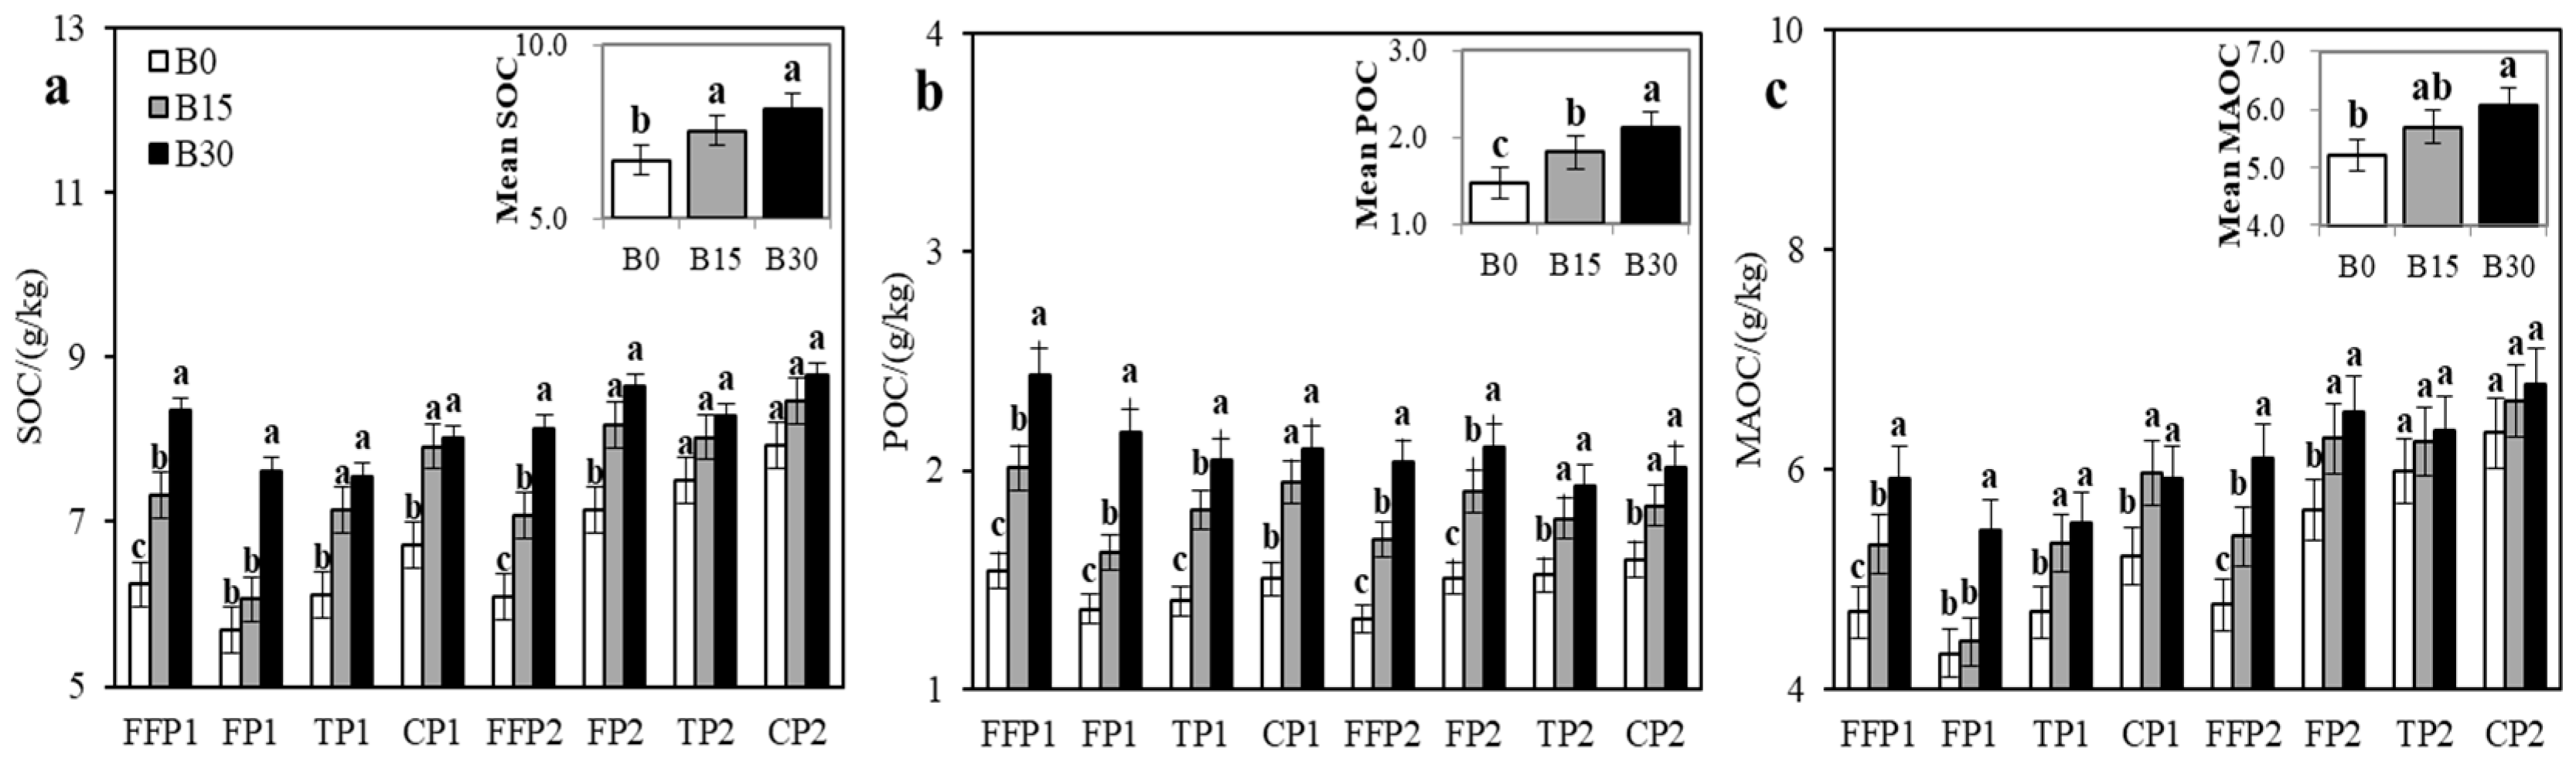
3.2. Soil SOC Fraction Response

SOC and its fractions generally increased with the biochar application rate under the B15 and B30 regimes (Figure 2). As can be seen from the figure, biochar application significantly increased the overall soil surface organic carbon content, and the differences between treatments were more significant in the early stage of the experiment. The mean SOC contents under the B15 and B30 treatments were 7.5 and 8.2 g/kg, respectively, which were 12.7% and 22.4% higher than that of the B0 treatment, respectively. The mean values of POC content under the B0, B15, and B30 treatments were 1.5, 1.8, and 2.1 g/kg, respectively, and the POC contents at the B15 and B30 treatments were 24.4% and 43.3% higher than that in the B0 treatment, respectively. MAOC content increased significantly with the increase in biochar application, and the average MAOC contents for the B15 and B30 treatments were 9.4% and 16.5% higher compared with that of the B0 treatment, respectively. During the experimental period, the MAOC contents under the B0, B15, and B30 treatments fluctuated and increased with time from 4.7, 5.3, and 5.9 g/kg to 6.3, 6.6, and 6.8 g/kg, respectively.

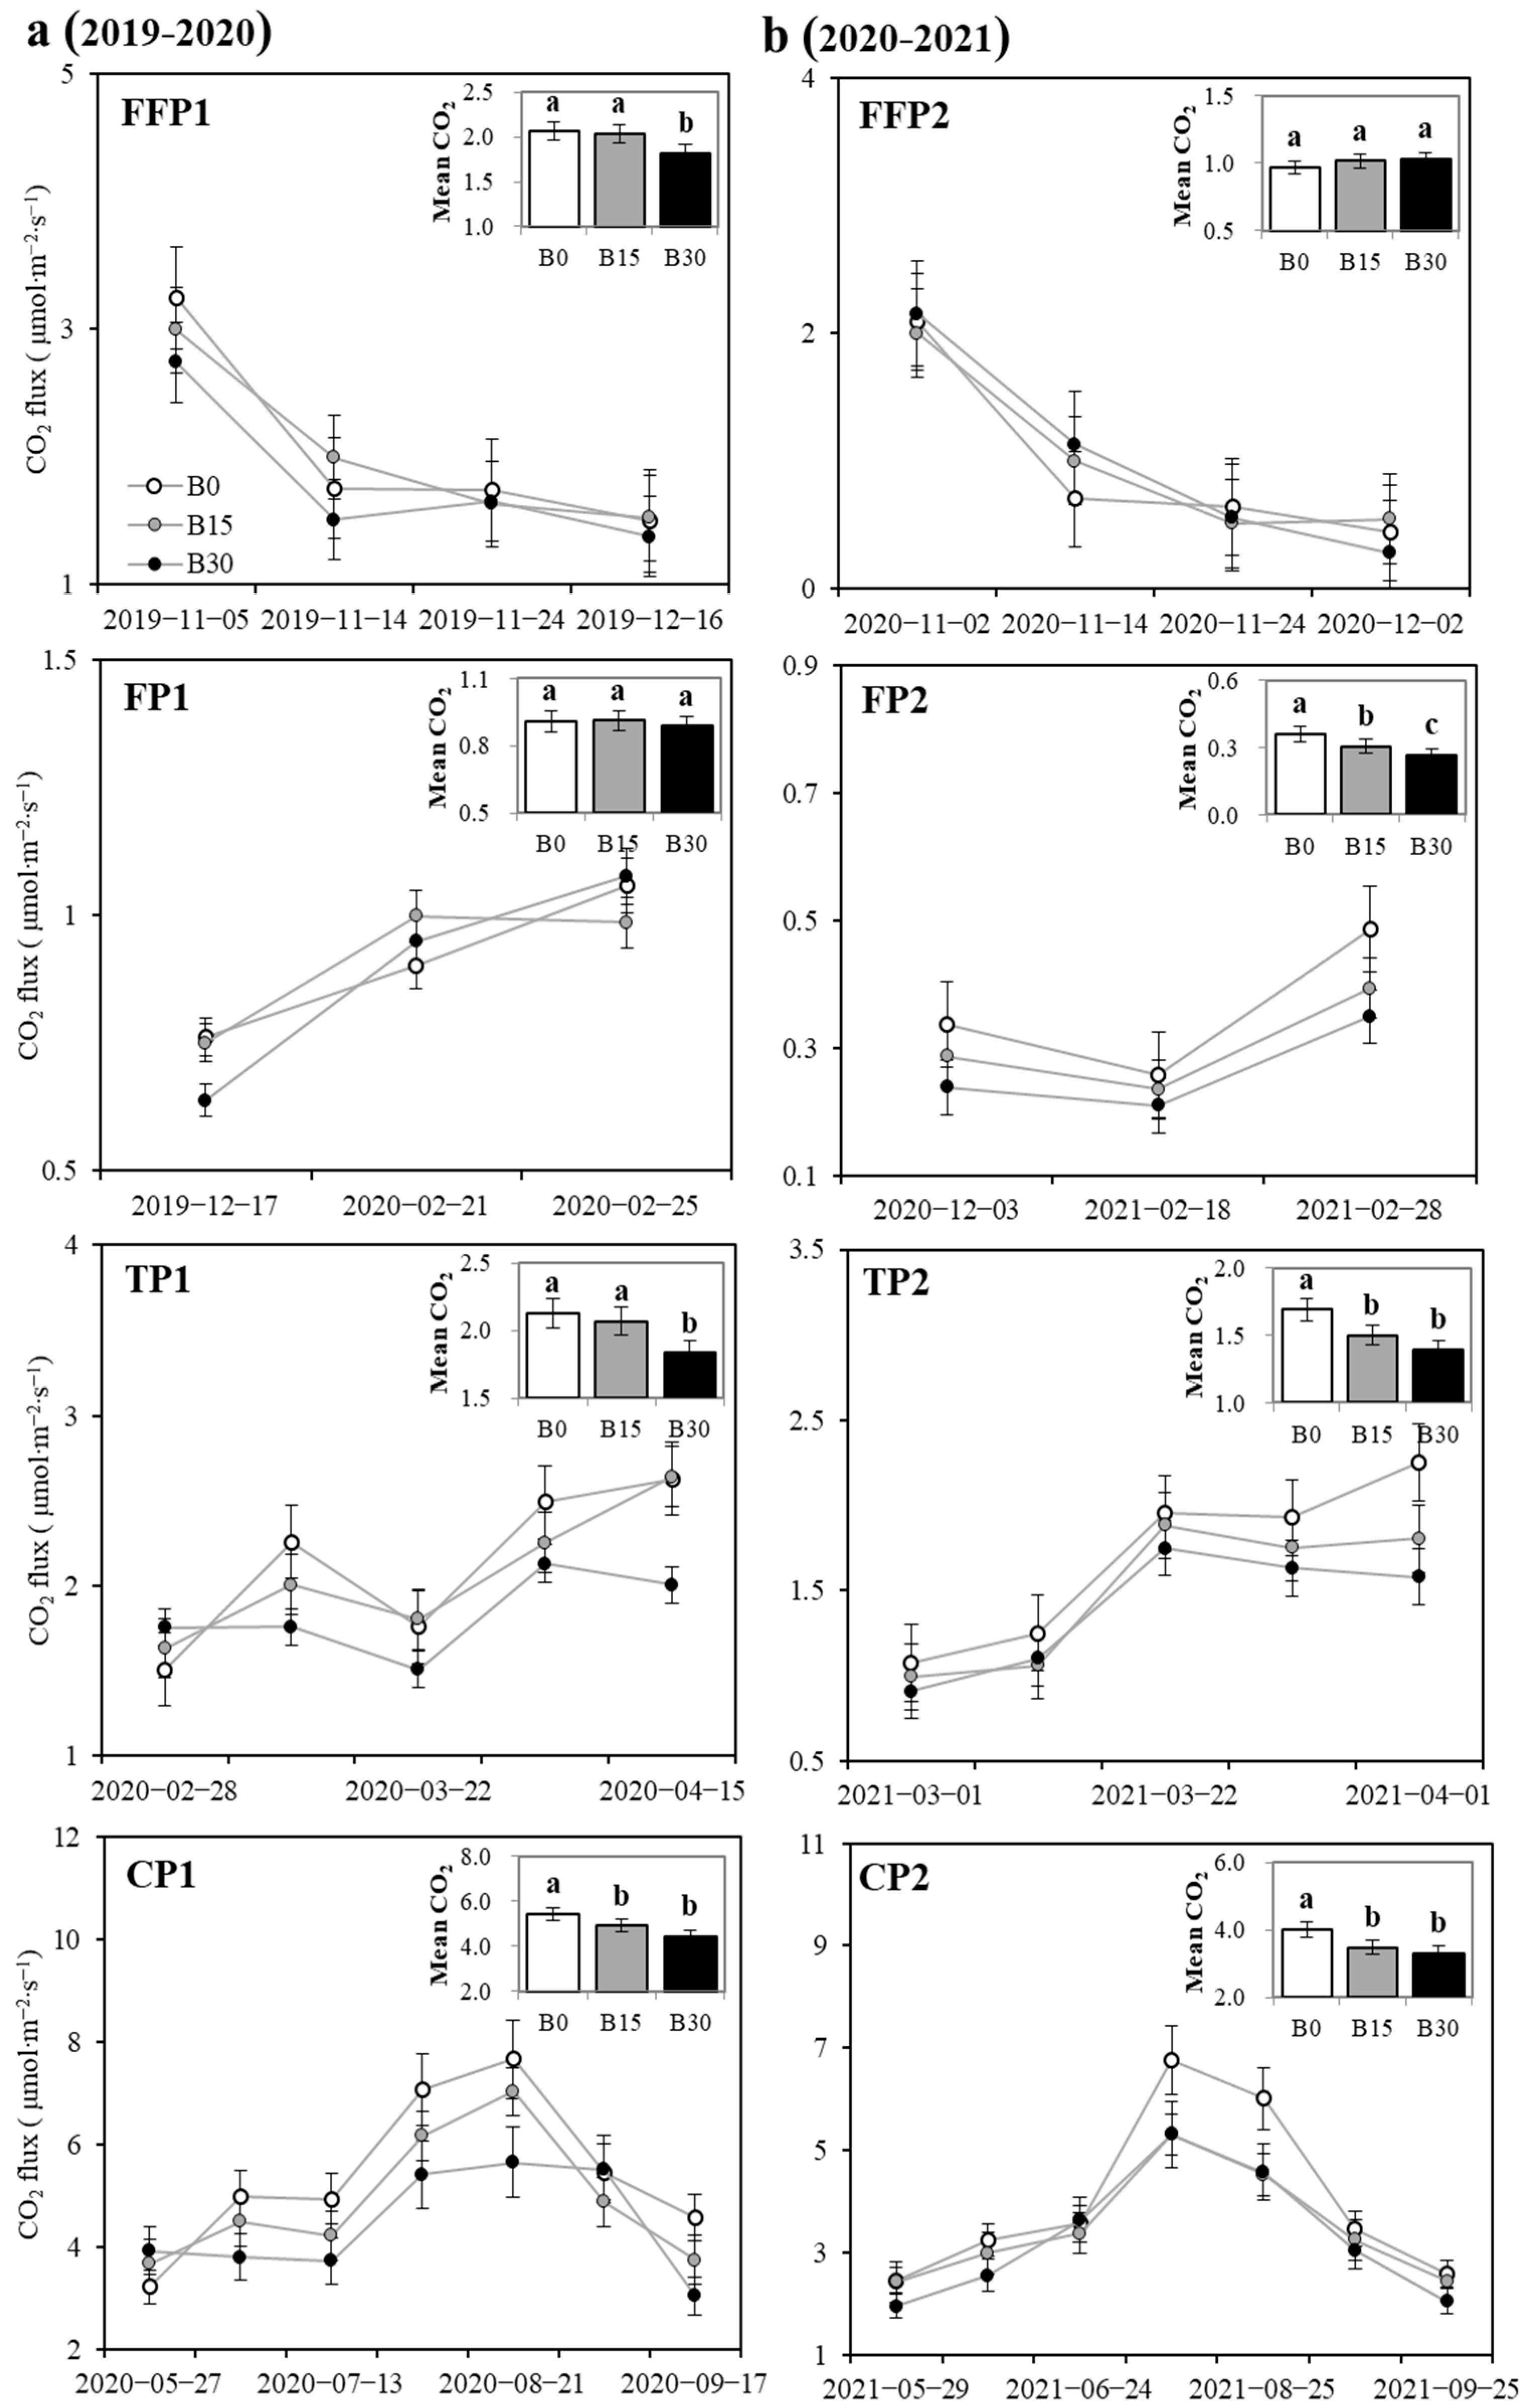
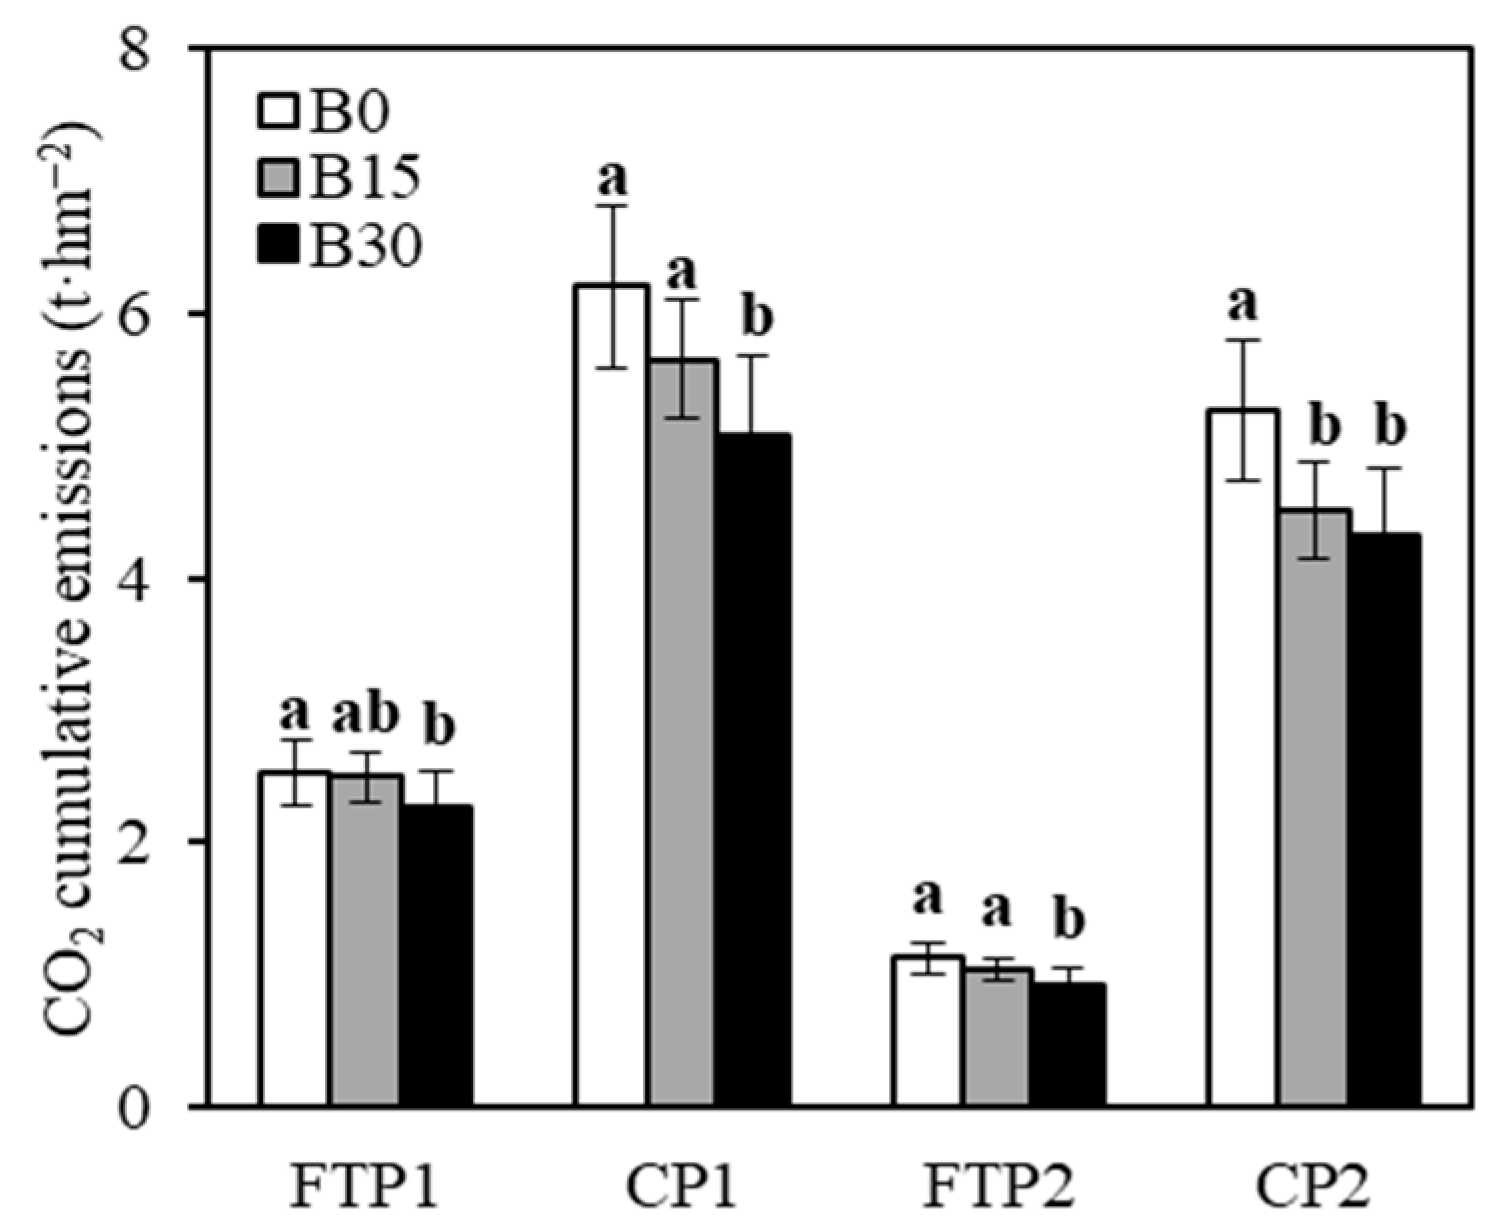
3.3. Annual Variation in Soil Respiration Rate

The annual changes in soil respiration rate under different biochar application conditions showed the same trend as the one shown in Figure 3. During FFP and FP, the CO2 flux is fixed in the frozen layer due to the freezing effect, and the overall level is relatively low. With the rise in temperature during TP and CP, CO2 is released, and the soil CO2 flux is at the peak of emission.
On the whole, compared with other periods, the application of biochar significantly inhibited soil respiration rate during the CP. The soil respiration rate during the CP showed an initial trend of rising up to certain peak and then falling. The soil respiration rate decreased with the extension of the test period. The greater the amount of biochar applied under the same conditions, the lower the soil respiration rate. This can be confirmed by the results, wherein the average soil respiration rates of B15 and B30 were lower than those of B0 treatment by 9.7% and 18.0% in the first year of the test period, and 13.4% and 17.7% lower in the second year of the test period, respectively.
The differences in the cumulative soil respiration rates during the test period are shown in Figure 4. It can be seen from the figure that the application of biochar can significantly reduce the cumulative soil respiration rate in each period, while the effect is more significant during CPs. The cumulative soil respiration rates for B15 and B30 treatments were 8.9% and 18.2% lower in the CP of the first year of CP, and 14.3% and 17.9% lower in the CP of the second year, respectively, as compared to those of the B0 treatment. The response to biochar application during the freeze–thaw period was insignificant. Overall, the freeze–thaw action significantly reduced the soil cumulative respiration rate by an average of 81.7% during the first CP and second freeze–thaw period.

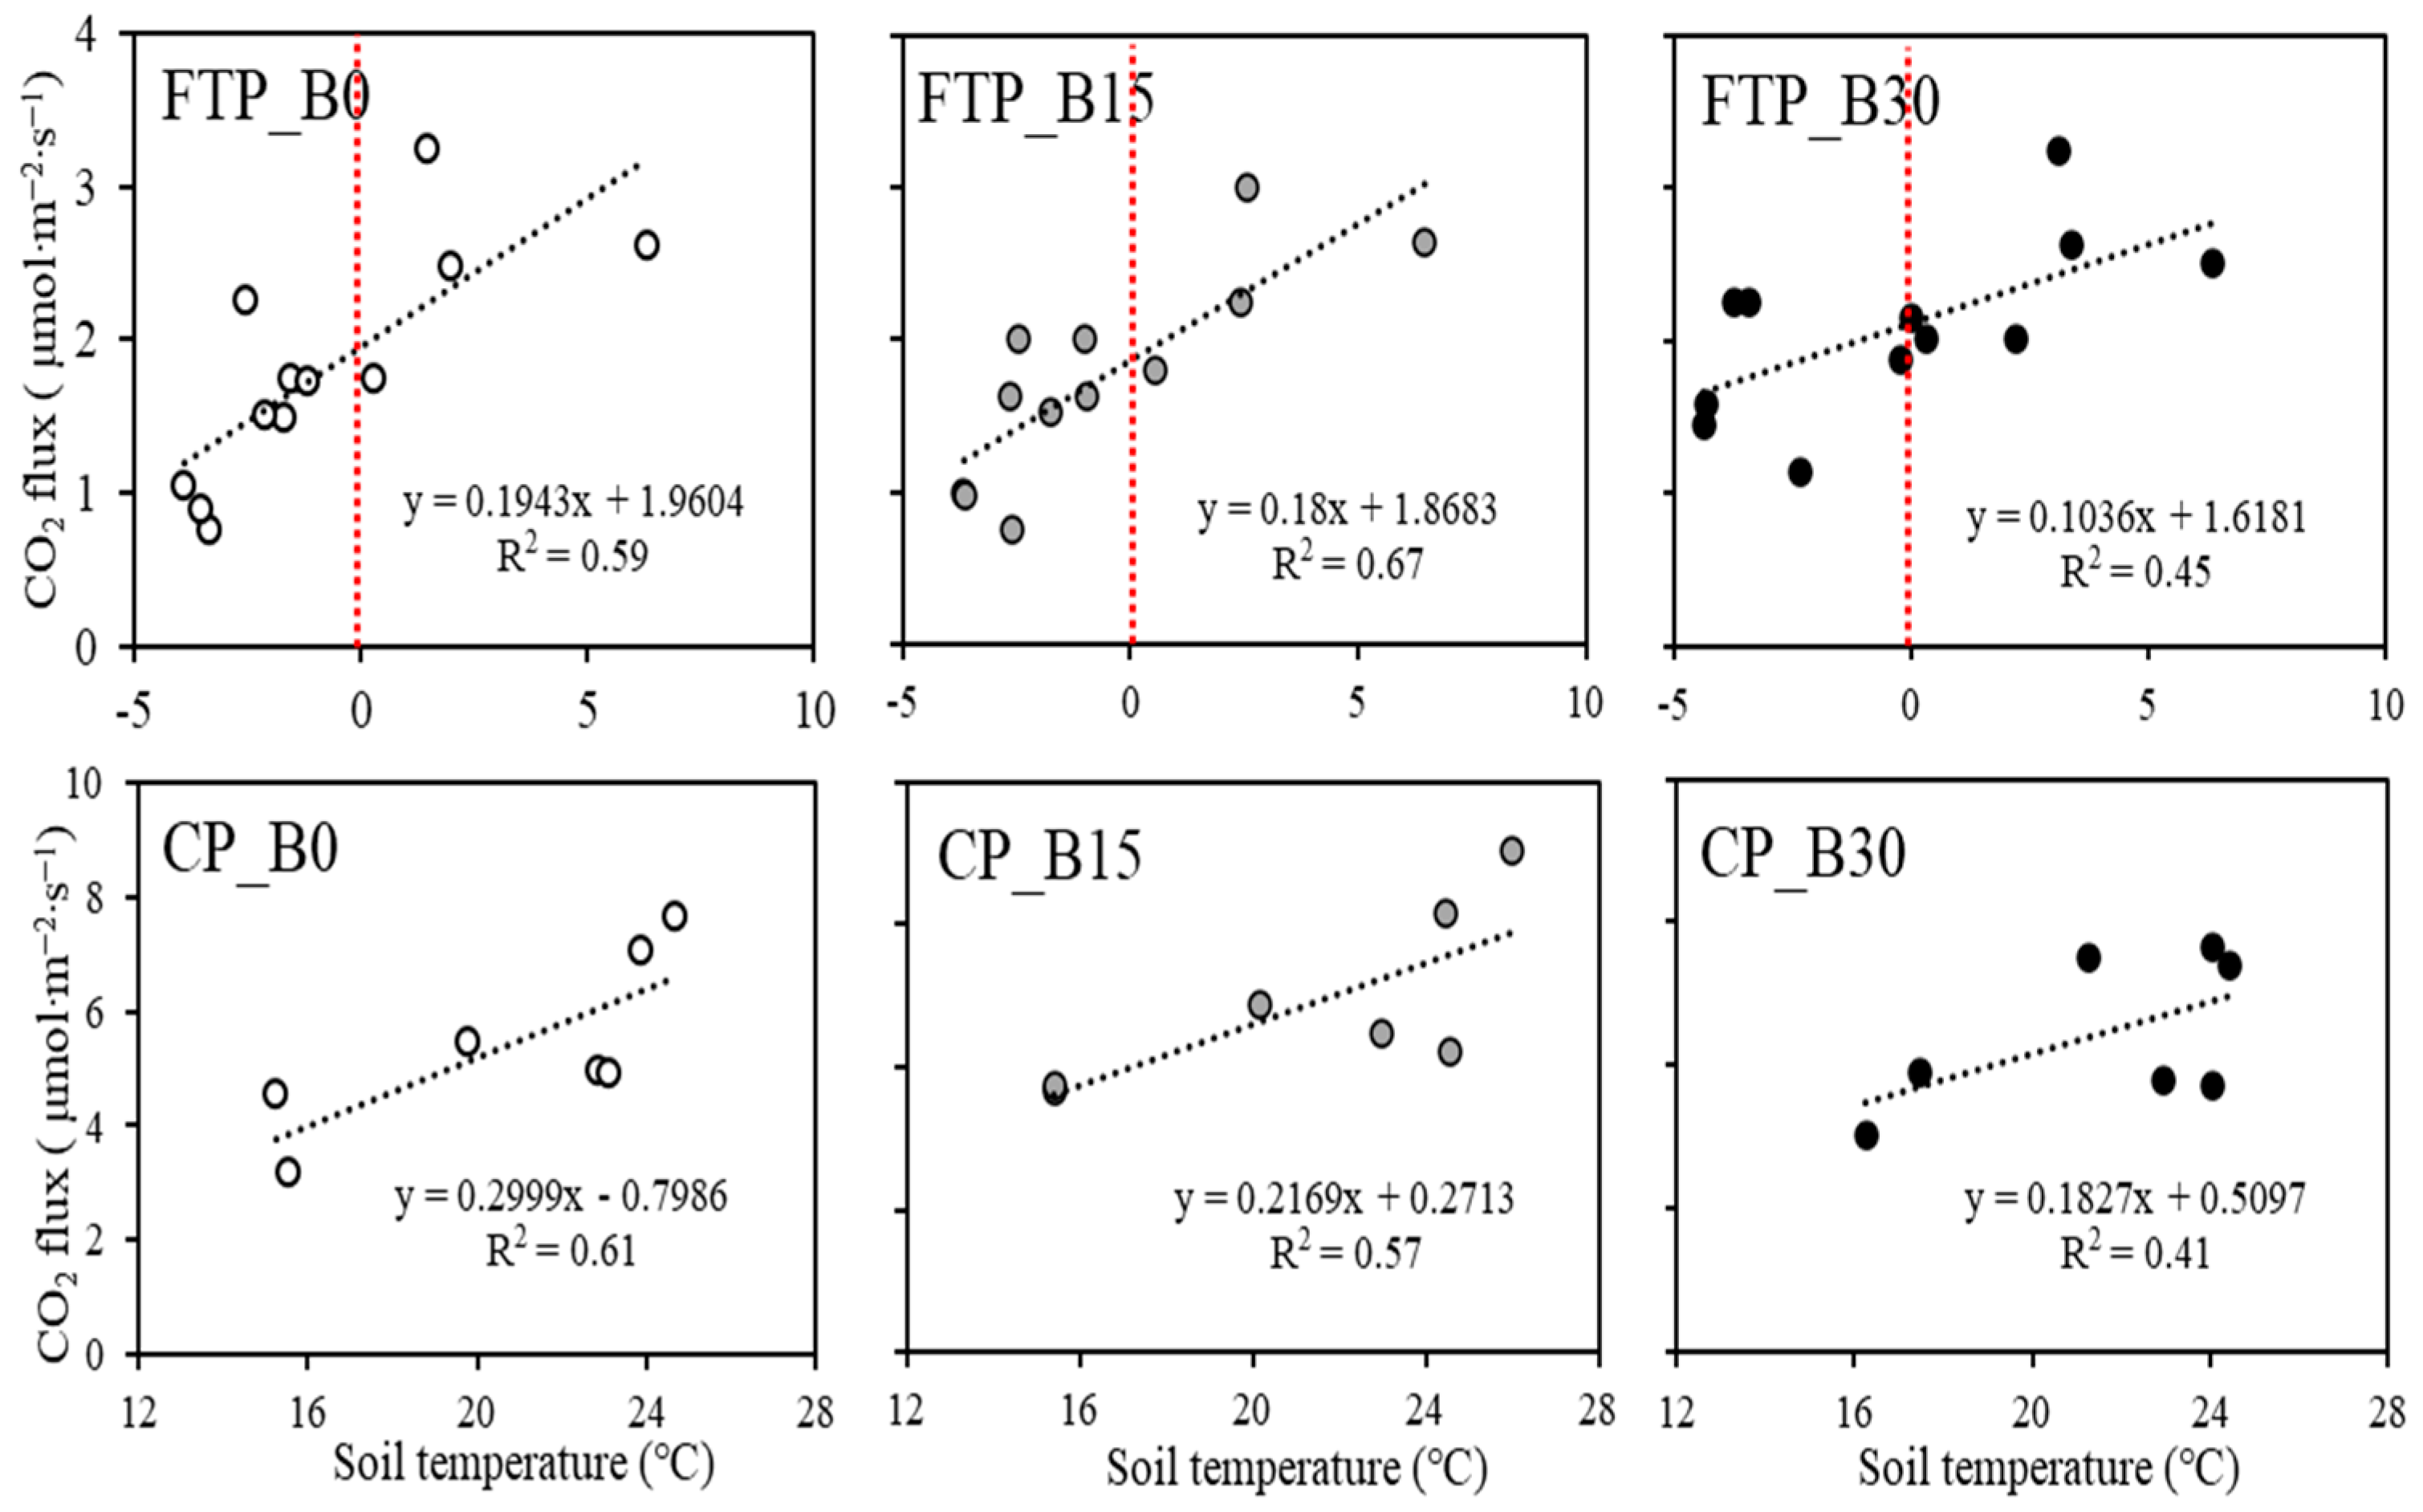
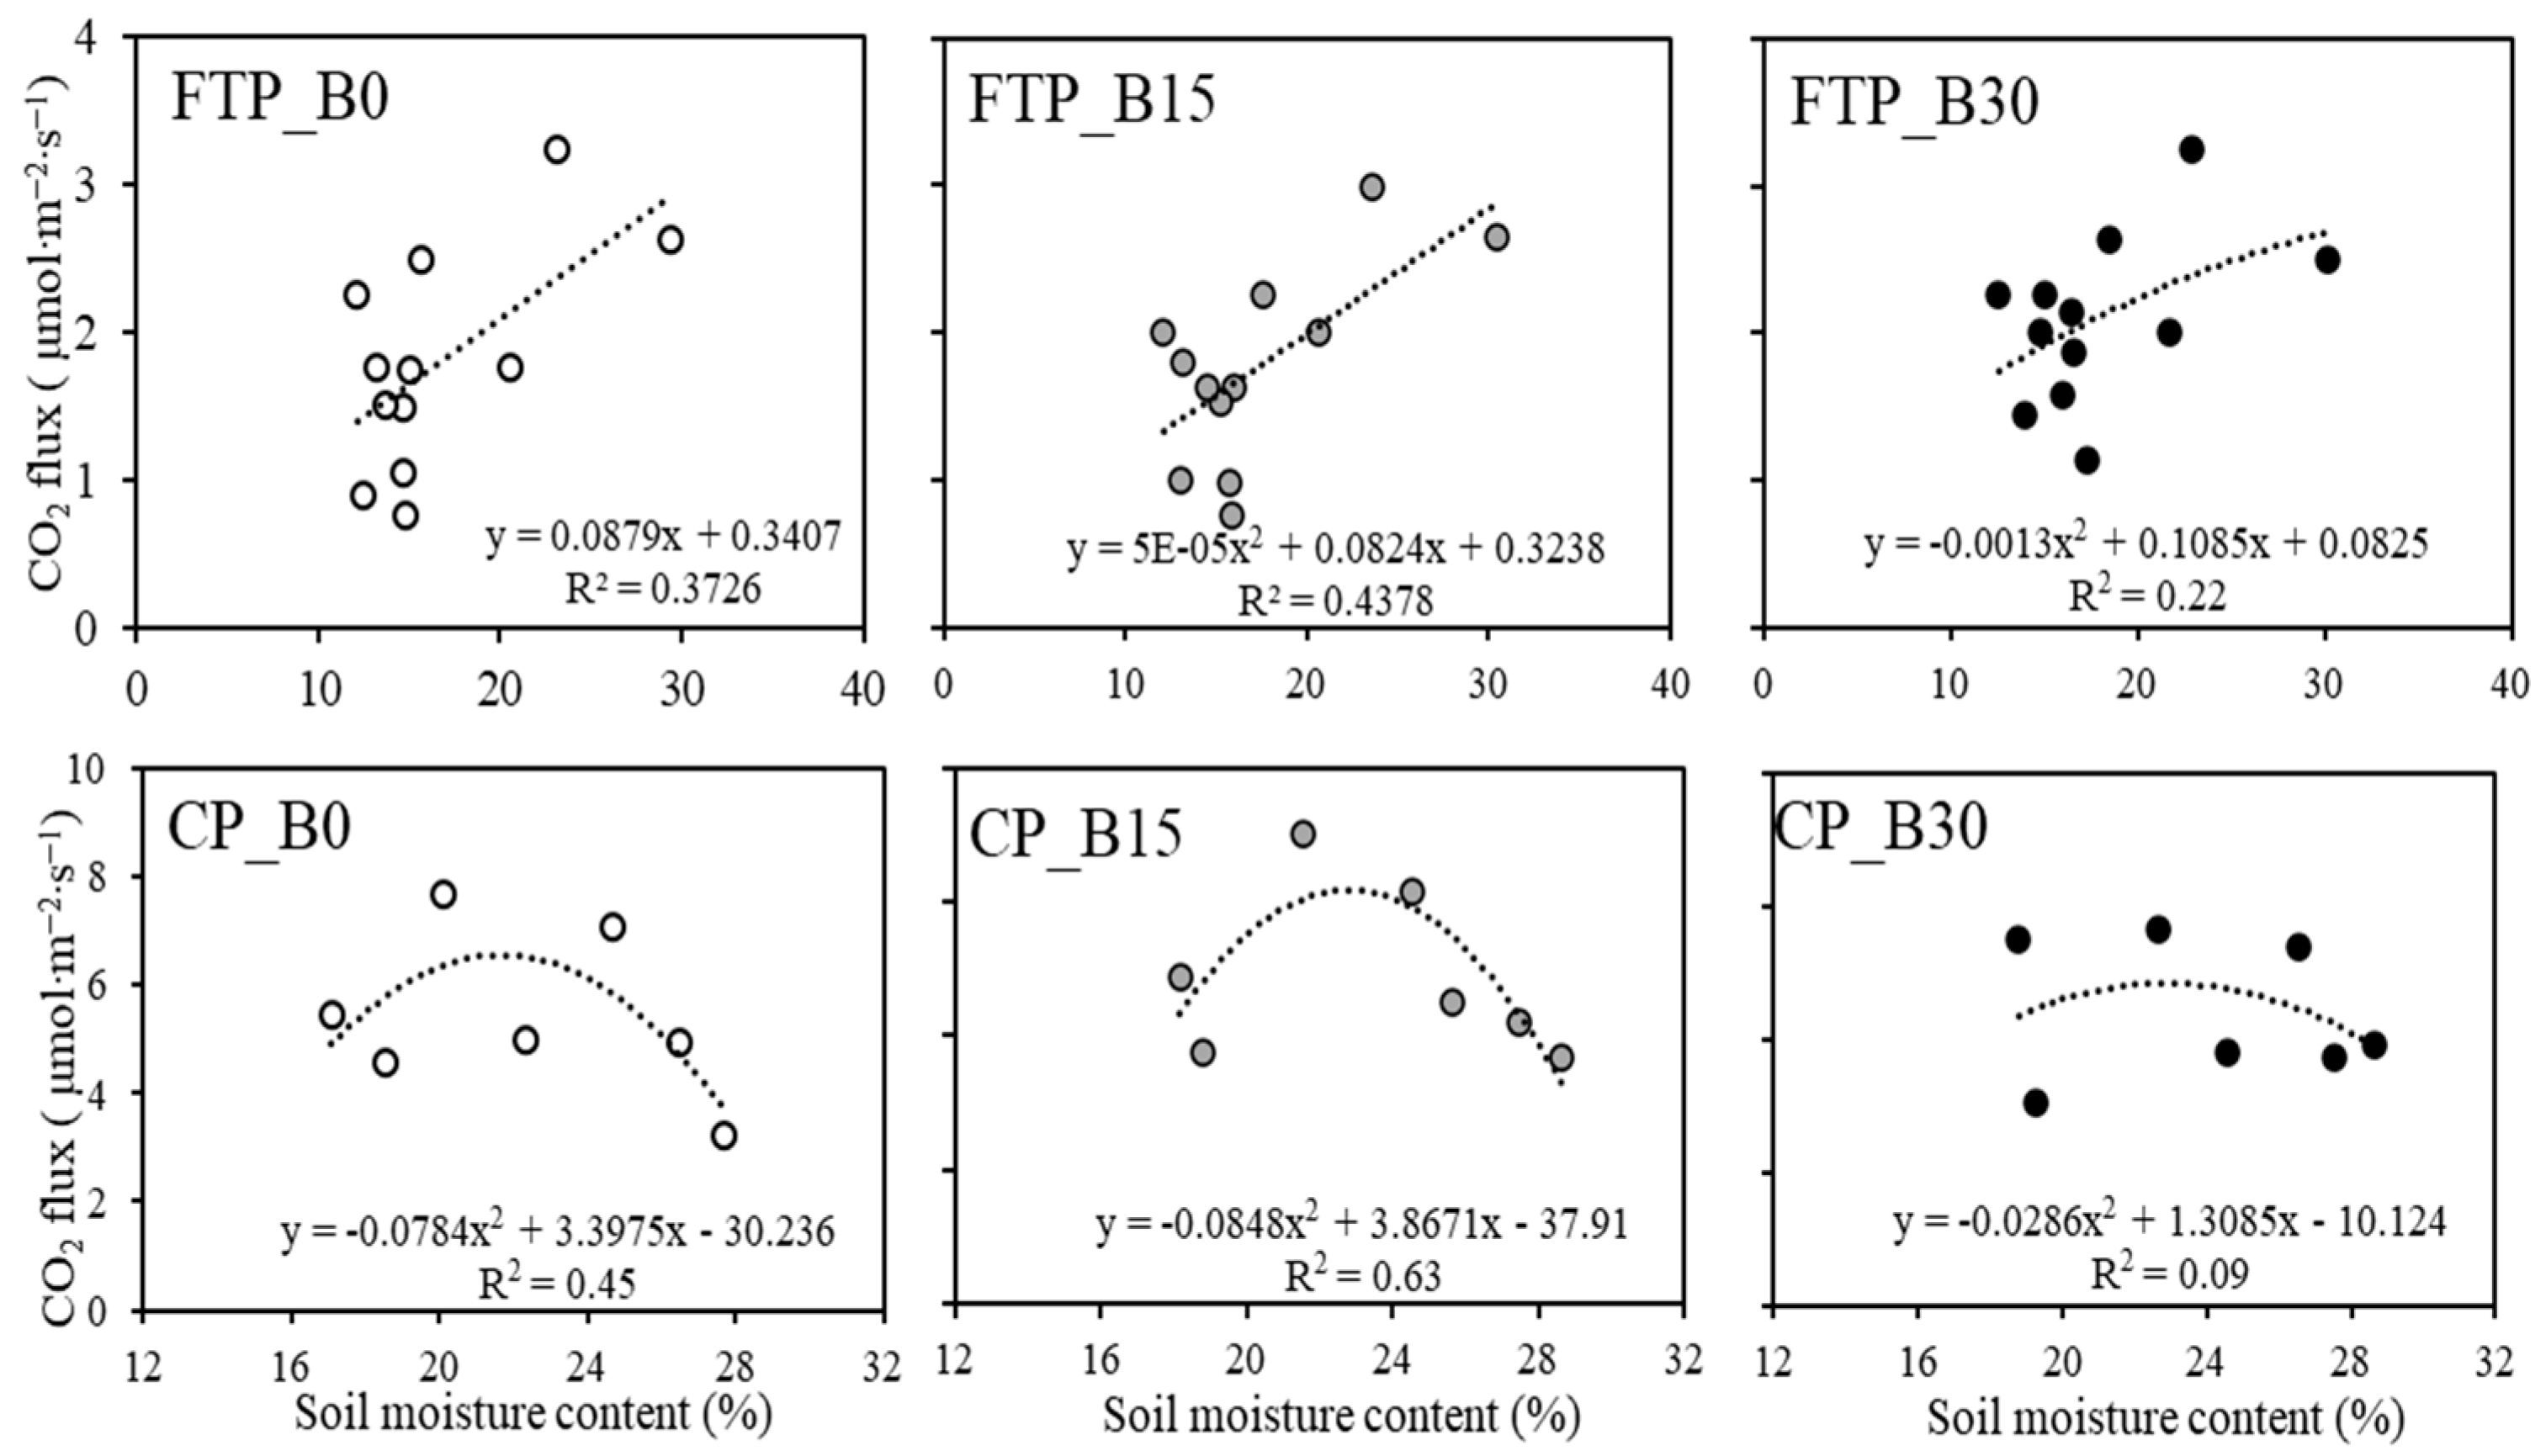
3.4. Fitting Relationship between Soil Respiration Rate and Hydrothermal Factors

As shown in Figure 5, there was a significant linear relationship between soil respiration rate and soil temperature (R2 > 0.41). Under the conditions of biochar treatment, soil respiration rates increased with soil temperature in different periods, but there were differences in their temperature sensitivity. Due to the large difference in soil temperature between the freeze–thaw and crop-growing periods, soil temperature was fitted individually to the soil respiration rate of the two periods. Overall, the correlation coefficients between soil respiration rate and soil temperature were 0.45 and 0.41 for the B30 treatment during the freeze–thaw period and crop-growth periods, respectively. In addition, they were smaller than those of the other treatments, indicating that the correlation between soil respiration rate and surface soil temperature was reduced by applying high amounts of biochar. For the freeze–thaw period, the k values in the fitted equations of soil respiration rate and soil temperature under B0, B15, and B30 treatments were 0.194, 0.180, and 0.104, respectively, indicating that the soil respiration rate of the B0 treatment increased rapidly when the temperature increased. In the CP, the k values in the fitted equations of soil respiration rate versus soil temperature under the B0, B15, and B30 treatments were 0.300, 0.217, and 0.183, respectively, which were 54.3%, 20.5%, and 76.4% higher than the k values of the freeze–thaw period. This indicated that the soil respiration rate increased much faster during the CP than during the freeze–thaw period under the same conditions.
The relationship between the annual soil respiration rate and soil water content is shown in Figure 6. Throughout the period, the soil respiration rate showed a weak quadratic relationship with soil water content for each treatment, with small fitted R2 values. This means that the soil water content explains less of the annual variation in the soil respiration rate. Under the same conditions, the absolute values of the binomial coefficients in the fitted relationship were higher during the CP than during the freeze–thaw period.

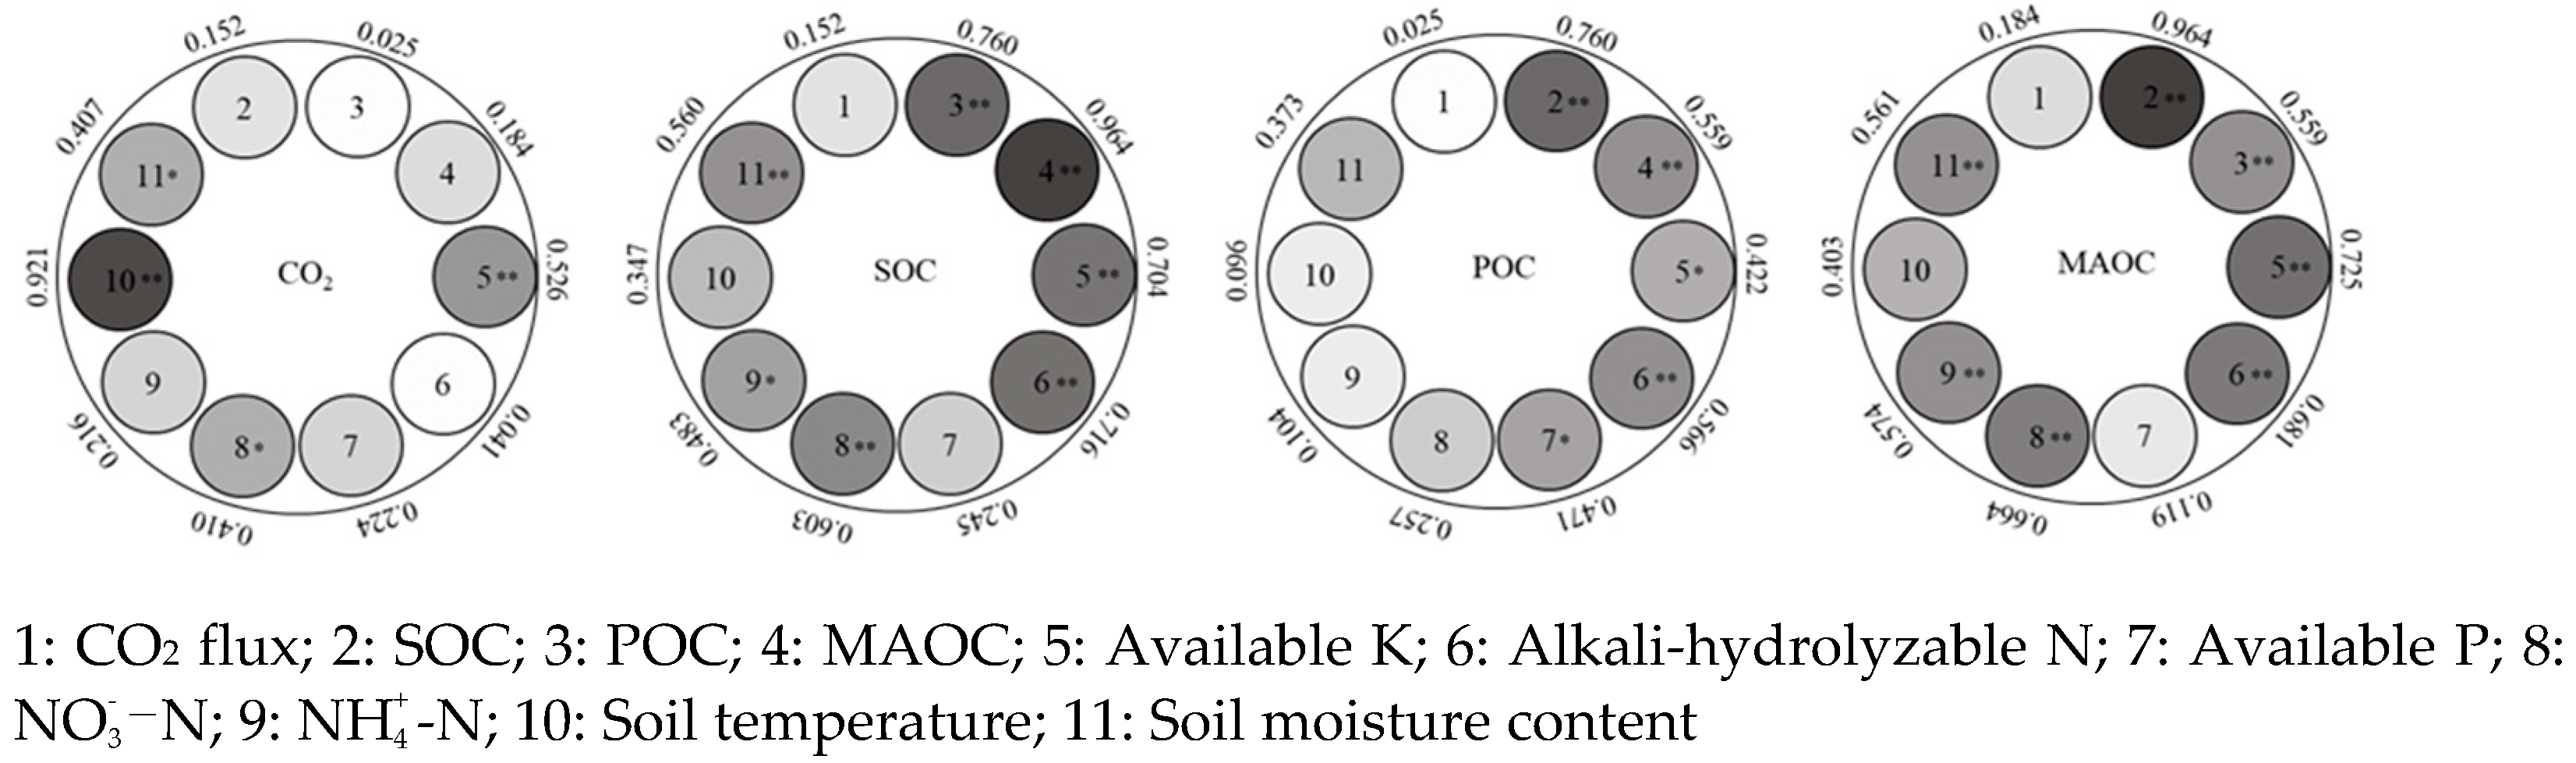
3.5. Correlation Analysis of Soil Respiration and Soil Organic Carbon with Environmental Factors

Figure 7 presents the correlation between soil respiration rate, soil organic carbon, and environmental factors under biochar addition. The activities of available K, NO 3 -N, soil temperature, and soil moisture content in soils showed significantly positive correlations with soil respiration rate (CO2 flux), with the coefficients of 0.526 (p < 0.01), 0.410 (p < 0.05), 0.921 (p < 0.01), and 0.407 (p < 0.05), respectively. The activities of POC, MAOC, available K, alkali-hydrolyzable N, NO 3 -N, soil moisture content, and NH 4 + -N in soils showed significantly positive correlations with SOC, with the coefficients of 0.760, 0.964, 0.704, 0.716, 0.603, 0.560 (p < 0.01), and 0.483 (p < 0.05), respectively. The activities of SOC, MAOC, alkali-hydrolyzable N, available K, and available P in soils showed significantly positive correlations with POC, with the coefficients of 0.760, 0.559, 0.566 (p < 0.01), 0.422, and 0.471 (p < 0.05), respectively. The activities of SOC, POC, available K, alkali-hydrolyzable N, NO 3 -N, NH 4 + -N, and soil moisture content in soils showed significantly positive correlations with MAOC, with the coefficients of 0.964, 0.559, 0.725, 0.681, 0.664, 0.574, and 0.561 (p < 0.01), respectively.

4. Discussion

4.1. Effect of Applying Biochar on Soil Nutrients

The nutrient content of the soil plays an important role in soil fertility, and it is important for crop growth if reasonable improvement measures are applied to reduce the loss of soil nutrients. We investigated the effects of biochar addition on the nutrient content of annually saline soils through field trials on large fields. Biochar was found to be effective in increasing the content of fast-acting nutrients, alkali-hydrolyzable N, and inorganic nitrogen fractions in soil under different conditions (freeze–thaw or crop-growth periods) (Figure 1). This is partly because the biochar used in this study contained high levels of nutrients (fast-acting phosphorus, 307.52 mg/kg; fast-acting potassium, 786.50 mg/kg; and alkali-hydrolyzable N, 401.94 mg/kg) that provided mineral elements such as nitrogen, phosphorus, and potassium to the soil. Palansooriya et al. [30] showed that biochar changes microbial habitats, directly or indirectly affects microbial metabolic activities, and changes soil microbial communities in terms of abundance and structure. Therefore, another reason for the application of biochar to soil is the change it makes to the physicochemical properties of soil by stimulating the number and activity of soil microbial communities and thus promoting the growth of crop roots [31]. The increase in the number of roots indirectly increases the soil nutrient content. Additionally, biochar improves soil structure by increasing its porosity and reducing its bulk, so that organic contents can be adsorbed effectively. In addition, it promotes the aggregation of small molecules into nutrient macromolecules, thus increasing the nutrient uptake capacity of the soil [32].
In this study, the application of biochar increased the content of the inorganic nitrogen fraction in the soil and improved its nitrogen utilization. According to existing studies, this is because biochar has a small volume, a large specific surface area, a more developed pore structure and surface energy, and a large number of positive and negative charges on the surface, which can adsorb and fix more NO3-N and NH4+-N in the soil [33]. The NO3-N and NH4+-N contents in the biochar treatment were lower than those in the control treatment at the beginning of the experiment (at FFP). In contrast, biochar application reduced the soil inorganic N fraction because soil N mineralization is one of the main sources of inorganic N. Moreover, microorganisms need to adapt after biochar application for a short period of time, and the uptake of nutrient sources by microorganisms is inhibited, thus reducing the rate of soil N mineralization and changing its community structure [34]. The addition of biochar can improve soil aggregates, increase the proportion of water-stable aggregates, alter saturated hydraulic conductivity, increase water retention, regulate soil temperature, reduce sudden fluctuations in soil temperature, and affect soil fertility [35]. However, these properties vary with the feedstock type, pyrolysis temperature, particle size, and time after biochar application [36]. Therefore, the study on the effects of biochar application on annual soil fertility needs to be monitored for a longer time to reveal the mechanism of the effect of biochar application years on soil nutrient effectiveness for annually saline soils and to provide a scientific basis for the optimal field management of straw biochar in saline irrigation areas and the efficient utilization of soil nutrient resources.

4.2. Influence of Applied Biochar on SOC Fraction

Biochar is a carbon-rich organic material, and its application to soil not only directly increases SOC content but also improves soil nutrient status, promotes crop growth [37], and thus increases crop primary productivity. In this study, the application of biochar significantly increased the surface organic carbon content of the soil (Figure 2a), mainly because biochar is a highly aromatic carbon-rich organic material, which is an inert organic carbon with high stability and resistance to biochemical degradation [38]. Therefore, biochar can rapidly increase organic carbon in the soil on application, which is conducive to the stable preservation of SOC. Second, the biomass char used in this study was prepared by anaerobic pyrolysis treatment at 360 °C, and some studies have shown [39] that the higher the pyrolysis temperature, the higher the proportion of stable organic carbon in biochar, and the less likely it is to decompose in soil. Moreover, biochar has a porous structure that can adsorb SOC and form a stable complex, which increases the sequestration of SOC. This is apparent because of the special aromatic structure of biochar [40]. Some researchers have observed that straw biochar affects the vertical distribution of SOC, depending on tillage practices [41]. Since our study only analyzed the organic carbon content in the surface layer of the soil (0–20 cm), further long-term studies are needed to determine the vertical distribution in long-term experiments. The organic carbon fraction in the soil also affects microbial biomass and its activity in the soil, which controls the transformation between various carbon fractions and carbon emissions (e.g., organic carbon decomposition and soil respiration) in the soil carbon pool, which in turn affects the carbon stock of the soil carbon pool [42]. Therefore, we need to pay attention not only to the effect of soil amendments on the total organic carbon content, but also to the content of different components that are vulnerable to external factors.
The addition of straw biochar increased the level of POC in soil (Figure 2b). This may be due to the fact that biochar application can promote the formation of soil macroaggregates and increase the internal cohesion through the association of mineral particles with carbon, which improves the antioxidant properties and stability of agglomerates [43], resulting in the formation of stable granular organic matter. Throughout the experimental cycle, POC content in saline soils showed a highly significant positive correlation with SOC content (Figure 7). Wang et al. [44] also found that exogenous organic matter inputs significantly increase the POC content, and POC content had a highly significant positive correlation with SOC content.
MAOC is the end product of organic-matter decomposition that is tightly bound to mucilaginous minerals and stabilized on the mineral surface through various bonding reactions between organic minerals, such as ligand exchange, cation bridges, hydrogen bonding, and van der Waals forces, and accounts for most of the total C in soil with long turnover time [45]. It can reflect changes in soil quality for a relatively short period of time and is considered a component and measure of soil active organic carbon. The interaction of oxidized carboxylic acid groups in biochar with minerals and the adsorption of soil organic matter on biochar can form agglomerates with soil particles and organic–inorganic combinations, promoting the formation of soil agglomerates [46] and enhancing the stability and accumulation of POC [47]. The above study supported the interpretation of the results of this experiment, wherein MAOC content increased significantly with increasing biochar application, and the mean MAOC content increased by 9.4% and 16.5% in the B15 and B30 treatments, respectively, compared to the B0 treatment (Figure 2c). Since cropping systems and different soil environments may lead to changes in unstable organic fractions in the soil [48], this could also explain some differences in each active organic carbon fraction of the soil around 6 months (soil freeze–thaw period) and 12 months (before sunflower harvest) of biochar application. In general, the elevated organic carbon content stabilized on soil minerals after biochar application may lead to long-term carbon sequestration with a longer duration of biochar application, which would have positive effects on SOC fractions (POC and MAOC).

4.3. Influence of Applied Biochar on Soil Respiration

The microbial decomposition of SOC is the main cause of soil respiration, and soil moisture and temperature are important environmental factors for soil respiration. In this experiment, the soil respiration dynamics of the freeze–thaw period and crop-growing period coincided better with the trend of soil temperature and correlated well; the k-values of the crop-growing period were 20.5–76.4% higher than those of the freeze–thaw period, indicating that the soil respiration rate increased much faster during the crop-growing period than during the freeze–thaw period under the same conditions; however, the fitting relationship between soil respiration rate and soil water content was not evident (Figure 5 and Figure 6), indicating that soil water content explains less of the annual variation in soil respiration rate. For the arid zone in northern China, soil moisture is mainly influenced by precipitation, but the low average annual rainfall in the cold arid zone leads to a small interannual variation without apparent seasonal differences, whereas soil temperature becomes the main cause of soil respiration rate. Soil temperature was the main factor affecting the soil respiration rate. Throughout the experimental period, soil respiration showed evident phase differences, with the strongest soil respiration rate during the crop-growth period and weaker soil respiration during the freeze–thaw period. Because of the high soil temperature and moisture during the crop-growth period, soil microorganisms use the nutrients secreted by crop roots and root epidermal abscission to grow and multiply rapidly [49]. Thus, the soil respiration rate increases, while the soil temperature and moisture are lower during the freeze–thaw period, and the microbial activity is weaker, thus slowing down the soil respiration rate.
Although the effect of biochar on soil respiration has been widely studied [50,51], its effect on annual saline soil respiration and its mechanism are not clear. In this study, we found that biochar application to the soil reduced soil respiration in all periods of the experiment (Figure 3 and Figure 4), mainly because biochar adsorbs sediments and enzymes in the soil, inhibiting organic carbon conversion and microbial activity [52]. This is inconsistent with the results of Gao et al. [53], who found that the addition of biochar enhanced the soil respiration rate. The increase in soil respiration is usually attributed to the addition of amendments that increase the concentration of reactive organic carbon and enhance microbial activity in soil [54]. This is because different types of soils have varying complex composition of organic matter and other components, and these differences affect the microbial types and, thus, the soil respiration. Additionally, the enhancement of soil respiration by biochar application has only a short-term effect, as the biochar itself contains a large amount of organic matter, which is primarily used by soil microorganisms at the beginning, thus increasing the activity of soil microorganisms and enhancing soil respiration [55]. However, with time, biochar promotes the formation of macromolecules that are difficult to decompose by soil microorganisms, such as soil humus and carbohydrates, thereby reducing the amount of organic matter available to microorganisms. During the individual sampling periods of the experiment, soil respiration in the biochar treatment was higher than that in the control treatment. Additionally, enhancement of soil respiration enhances the aeration and nutrient status of the soil, and high amounts of biochar also accelerate soil respiration rates [56]. It can be concluded from the findings that biochar application can be an effective way to increase organic carbon stock and reduce greenhouse gas emissions in saline soils.

5. Conclusions

The biochar application rates of 15 and 30 t∙hm−2 in saline soil increased the soil nutrient content (fast-acting potassium, alkali-hydrolyzable N, fast-acting phosphorus, NO 3 -N, and NH 4 + -N) and the organic carbon fraction in the surface layer of soil, and inhibited soil respiration during the 2 year trial period; the effect was directly proportional to the amount of biochar applied. The one-time application of biochar in the test year continued to have an impact in the subsequent year, and the effect was significant year by year. The results showed that biochar applications of 15 and 30 t∙hm−2 increased the average organic carbon fraction by 9.4–24.4% and 16.5–43.3%, respectively. The SOC and MAOC contents decreased during the initial freezing period and then gradually increased with time after biochar application, whereas the changes in POC content were opposite. Biochar applications of 15 and 30 t∙hm−2 reduced the average soil respiration rate by 7.7% and 14.7%, respectively. The freeze–thaw effect significantly reduced the cumulative soil respiration rate. Although soil respiration rate and soil temperature exhibited a significant linear correlation, a higher amount of biochar applications reduced the correlation. Considering the soil respiration rate and soil physicochemical properties, a one-time biochar application rate of 30 t∙hm−2 was found to be optimal. This study is only a 2 year, short-term trial, and biochar can be sequestered in the soil for a long time; therefore, soil fertility and soil respiration monitoring need to be continued locally to understand the long-term effects of biochar applications.

Author Contributions

Experimental design, R.Z. and Z.Q.; data collection, R.Z. and W.Y.; laboratory analysis, L.L., J.L., and D.Z.; statistical analysis, R.Z. and L.W.; supervision, R.Z. and Z.Q.; interpretation of results, R.Z.; writing—original draft preparation, R.Z.; writing—review and editing, R.Z., Z.Q., L.L., W.Y., L.W., J.L., and D.Z. All authors have read and agreed to the published version of the manuscript.

Funding

This research was funded by the National Key Research and Development Plan Key Special Projects (No. 2021YFC3201205) and the National Natural Science Foundation of China (No. 52279037).

Institutional Review Board Statement

Not applicable.

Informed Consent Statement

Not applicable.

Data Availability Statement

Not applicable.

Acknowledgments

The authors greatly acknowledge the Bureau of Agriculture, Animal Husbandry and Science and Technology of Wuyuan County, Bayannur City, for providing the field for the experiment. They also greatly acknowledge the Inner Mongolia Autonomous Region Science and Technology Leading Talent Team (2022LJRC0007) for its support.

Conflicts of Interest

The authors declare no conflict of interest.

References

  1. Fontaine, S.; Bardoux, G.; Abbadie, L.; Mariotti, A. Carbon input to soil may decrease soil carbon content. Ecol. Lett. 2004, 7, 579. [Google Scholar] [CrossRef]
  2. Liang, T.; Zhao, Z.; Liu, Q.; Zou, Y.; Wang, J.; Dai, H.; Wang, A.; Zhang, Y. Effects of organic manure on soil organic carbon composition and CO2 emission in tobacco planting field. Tob. Sci. Technol. 2017, 50, 8–13. [Google Scholar]
  3. Burrell, L.D.; Zehetner, F.; Rampazzo, N.; Wimmer, B.; Soja, G. Long-term effects of biochar on soil physical properties. Geoderma 2016, 282, 96–102. [Google Scholar] [CrossRef]
  4. Luo, Z.; Wang, E.; Sun, O.J. Soil carbon change and its responses to agricultural practices in Australian agro-ecosystems: A review and synthesis. Geoderma 2009, 155, 211–223. [Google Scholar] [CrossRef]
  5. Song, G.; Li, L.; Pan, G.; Zhang, Q. Topsoil organic carbon storage of China and its loss by cultivation. Biogeochemistry 2005, 74, 47–62. [Google Scholar] [CrossRef]
  6. Gao, X.; Zhao, N.; Lu, Y.; Han, X.; Yang, Z. Effects of supplementary irrigation on soil respiration of millet farmland in a semi-arid region in China. Atmosphere 2022, 13, 584. [Google Scholar] [CrossRef]
  7. Wang, Q.; Yuan, J.; Yang, X.; Han, X.; Lan, Y.; Cao, D.; Sun, Q.; Cui, X.; Meng, J.; Chen, W. Responses of soil respiration and C sequestration efficiency to biochar amendment in maize field of Northeast China. Soil Tillage Res. 2022, 223, 105442. [Google Scholar] [CrossRef]
  8. Jeffery, S.; Verheijen, F.G.A.; van der Velde, M.; Bastos, A.C. A quantitative review of the effects of biochar application to soils on crop productivity using meta-analysis. Agric. Ecosyst. Environ. 2011, 144, 175–187. [Google Scholar] [CrossRef]
  9. Suha, U.O.; Babur, E.; Alma, M.H.; Solaiman, Z.M. Walnut shell biochar increases seed germination and early growth of seedlings of fodder crops. Agriculture 2020, 10, 427. [Google Scholar]
  10. Phares, C.A.; Akaba, S. Co-application of compost or inorganic NPK fertilizer with biochar influenced soil quality, grain yield and net income of rice. J. Integr. Agric. 2022, in press. [Google Scholar] [CrossRef]
  11. Wen, Z.; Chen, Y.; Liu, Z.; Meng, J. Biochar and arbuscular mycorrhizal fungi stimulate rice root growth strategy and soil nutrient availability. Eur. J. Soil Biol. 2022, 113, 103448. [Google Scholar] [CrossRef]
  12. Liu, N.; Zhou, J.; Han, L.; Ma, S.; Sun, X.; Huang, G. Role and multi-scale characterization of bamboo biochar during poultry manure aerobic composting. Bioresour. Technol. 2017, 241, 190–199. [Google Scholar] [CrossRef] [PubMed]
  13. Allahyar, K.; Fayez, R.; Hossein, B.; Ali, K.M. The effects of biochar on soil nutrients status, microbial activity and carbon sequestration potential in two calcareous soils. Biochar 2021, 3, 105–116. [Google Scholar]
  14. Nan, H.; Mašek, O.; Yang, F.; Xu, X.; Qiu, H.; Cao, X.; Zhao, L. Minerals: A missing role for enhanced biochar carbon sequestration from the thermal conversion of biomass to the application in soil. Earth-Sci. Rev. 2022, 234, 104215. [Google Scholar] [CrossRef]
  15. Walkiewicz, A.; Kalinichenko, K.; Kubaczyński, A.; Brzezińska, M.; Bieganowski, A. Usage of biochar for mitigation of CO2 emission and enhancement of CH4 consumption in forest and orchard Haplic Luvisol (Siltic) soils. Appl. Soil Ecol. 2020, 156, 103711. [Google Scholar] [CrossRef]
  16. Jiang, B.N.; Lu, M.B.; Zhang, Z.Y.; Xie, B.L.; Song, H.L. Quantifying biochar-induced greenhouse gases emission reduction effects in constructed wetlands and its heterogeneity: A multi-level meta-analysis. Sci. Total Environ. 2022, 855, 158688. [Google Scholar] [CrossRef]
  17. Rittl, T.F.; Canisares, L.; Sagrilo, E.; Butterbach-Bahl, K.; Dannenmann, M.; Cerri, C.E.P. Temperature sensitivity of soil organic matter decomposition varies with biochar application and soil type. Pedosphere 2020, 30, 336–342. [Google Scholar] [CrossRef]
  18. Gogoi, L.; Narzari, R.; Gogoi, N.; Borkotoki, B.; Kataki, R. Effect of biochar on soil respiration from a semi-evergreen, moist deciduous forest soil. Int. J. Geosynth. Ground Eng. 2020, 6, 214. [Google Scholar] [CrossRef]
  19. Ge, X.; Cao, Y.; Zhou, B.; Xiao, W.; Li, M. Combined application of biochar and N increased temperature sensitivity of soil respiration but still decreased the soil CO2 emissions in moso bamboo plantations. Sci. Total Environ. 2020, 730, 139003. [Google Scholar] [CrossRef]
  20. Dinesh, M.; Kumar, A.; Ankur, S.; Manvendra, P.; Prachi, S.; Pittman, C. Biochar production and applications in soil fertility and carbon sequestration—A sustainable solution to crop-residue burning in India. RSC Adv. 2018, 8, 508–520. [Google Scholar]
  21. Cross, A.; Sohi, S.P. The priming potential of biochar products in relation to labile carbon contents and soil organic matter status. Soil Biol. Biochem. 2011, 43, 2127–2134. [Google Scholar] [CrossRef]
  22. Wardle, D.A.; Nilsson, M.-C.; Zackrisson, O. Fire-Derived charcoal causes loss of forest humus. Science 2008, 320, 629. [Google Scholar] [CrossRef]
  23. Zygourakis, K. Biochar soil amendments for increased crop yields: How to design a “designer” biochar. AIChE J. 2017, 63, 870. [Google Scholar] [CrossRef]
  24. Wei, O.; Xiaojun, G.; Wejia, H.; Fanghua, H.; Jinbo, Z. Soil respiration characteristics in different land uses and response of soil organic carbon to biochar addition in high-latitude agricultural area. Environ. Sci. Pollut. Res. Int. 2016, 23, 2279–2287. [Google Scholar]
  25. Xi, Z.; Qianqian, Z.; Liping, Z.; Xintong, X.; Ruiyu, B.; Zhengqin, X. Biochar addition stabilized soil carbon sequestration by reducing temperature sensitivity of mineralization and altering the microbial community in a greenhouse vegetable field. J. Environ. Manag. 2022, 313, 114972. [Google Scholar]
  26. Cui, J.; Glatzel, S.; Bruckman, V.J.; Wang, B.; Lai, D.Y.F. Long-term effects of biochar application on greenhouse gas production and microbial community in temperate forest soils under increasing temperature. Sci. Total Environ. 2021, 767, 145021. [Google Scholar] [CrossRef]
  27. Nielsen, C.B.; Groffman, P.M.; Hamburg, S.P.; Driscoll, C.T.; Fahey, T.J.; Hardy, J.P. Freezing Effects on carbon and nitrogen cycling in Northern Hardwood forest soils. Soil Sci. Soc. Am. J. 2001, 65, 1723–1730. [Google Scholar] [CrossRef] [Green Version]
  28. Li, J.; Tian, D.; Huang, R.; Xu, G.; Li, J.; Gao, M.; Wang, Z. Effects of straw and biochar addition on soil carbon balance and ecological benefits in a rape-maize rotation plantingsystem. Environ. Sci. 2018, 39, 4338–4347. [Google Scholar]
  29. Bradford, M.A.; Fierer, N.; Reynolds, J.F. Soil carbon stocks in experimental mesocosms are dependent on the rate of labile carbon, nitrogen and phosphorus inputs to soils. Funct. Ecol. 2008, 22, 964–974. [Google Scholar] [CrossRef]
  30. Palansooriya, K.N.; Wong JT, F.; Hashimoto, Y.; Huang, L.; Rinklebe, J.; Chang, S.X.; Bolan, N.; Wang, H.; Ok, Y.S. Response of microbial communities to biochar-amended soils: A critical review. Biochar 2019, 1, 3–22. [Google Scholar] [CrossRef] [Green Version]
  31. Sorrenti, G.; Muzzi, E.; Toselli, M. Root growth dynamic and plant performance of nectarine trees amended with biochar and compost. Sci. Hortic. 2019, 257, 108710. [Google Scholar] [CrossRef]
  32. Mukherjee, A.; Zimmerman, A.R. Organic carbon and nutrient release from a range of laboratory-produced biochars and biochar–soil mixtures. Geoderma 2013, 193–194, 122–130. [Google Scholar] [CrossRef]
  33. Wang, X.; Yin, D.; Zhang, F.; Tan, C.; Peng, B. Analysis of effect mechanism and risk of biochar on soil fertility and environmental quality. Trans. Chin. Soc. Agric. Eng. 2015, 31, 248–257. [Google Scholar]
  34. Saleh, M.E.; Mahmoud, A.H.; Rashad, M. In peanut bichar as astable adsorbent for removing NH 4 + -N from wastwater: A preliminary study. Sixt. Int. Water Technol. Conf. Proc. 2012, 16, 1257–1266. [Google Scholar]
  35. Lai, X.; Ren, X.; Zhu, K.; Yan, C.; Yu, J. Effects of tillage systems on labile fractions of soil organic nitrogen of a freeze-thaw agricultural area in northeast China. IOP Conf. Ser. Earth Environ. Sci. 2020, 435, 210–217. [Google Scholar] [CrossRef]
  36. Blanco-Canqui, H. Biochar and soil physical properties. Soil Sci. Soc. Am. J. 2017, 81, 687–711. [Google Scholar] [CrossRef] [Green Version]
  37. Ángela, M.G.; Jorge, P.; Carolina, E. Overview of the use of biochar from main cereals to stimulate plant growth. Front. Plant Sci. 2022, 13, 912264. [Google Scholar]
  38. Lehmann, J.; Rillig, M.C.; Thies, J.; Masiello, C.A.; Hockaday, W.C.; Crowley, D. Biochar effects on soil biota—A review. Soil Biol. Biochem. 2011, 43, 1812–1836. [Google Scholar] [CrossRef]
  39. Ahmad, M.; Lee, S.S.; Dou, X.; Mohan, D.; Sung, J.-K.; Yang, J.E.; Ok, Y.S. Effects of pyrolysis temperature on soybean stover- and peanut shell-derived biochar properties and TCE adsorption in water. Bioresour. Technol. 2012, 118, 536–544. [Google Scholar] [CrossRef]
  40. Kuzyakov, Y.; Bogomolova, I.; Glaser, B. Biochar stability in soil: Decomposition during eight years and transformation as assessed by compound-specific 14 C analysis. Soil Biol. Biochem. 2014, 70, 229–236. [Google Scholar] [CrossRef]
  41. Yang, X.; Drury, C.F.; Wander, M.M. A wide view of no-tillage practices and soil organic carbon sequestration. Acta Agric. Scand. Sect. B Soil Plant Sci. 2013, 63, 523–530. [Google Scholar] [CrossRef]
  42. Wang, Y.; Li, M. Role of biochar amendment on soil carbon mineralization and microbial biomass. J. Geosci. Environ. Prot. 2018, 6, 173. [Google Scholar] [CrossRef] [Green Version]
  43. Sun, F.; Lu, S. Biochars improve aggregate stability, water retention, and pore-space properties of clayey soil. J. Plant Nutr. Soil Sci. 2014, 177, 26–33. [Google Scholar] [CrossRef]
  44. Wang, S.; Yang, Y.; Wang, G.; Zhao, X.; Chen, C.; Huang, X. Effect on long-term fertilization on labile organic carbon in cinnamon soil. Chin. J. Ecol. 2015, 34, 1223–1228. [Google Scholar]
  45. Feng, W.; Plante, A.F.; Aufdenkampe, A.K.; Six, J. Soil organic matter stability in organo-mineral complexes as a function of increasing C loading. Soil Biol. Biochem. 2014, 69, 398–405. [Google Scholar] [CrossRef]
  46. Huang, R.; Tian, D.; Liu, J.; Lv, S.; He, X.; Gao, M. Responses of soil carbon pool and soil aggregates associated organic carbon to straw and straw-derived biochar addition in a dryland cropping mesocosm system. Agric. Ecosyst. Environ. 2018, 265, 576–586. [Google Scholar] [CrossRef]
  47. Alexandra, K.; Balwant, S.; Pal, S.B. Interactive priming of biochar and labile organic matter mineralization in a smectite-rich soil. Environ. Sci. Technol. 2011, 45, 9611–9618. [Google Scholar]
  48. Chen, S.; Xu, C.; Yan, J.; Zhang, X.; Zhang, X.; Wang, D. The influence of the type of crop residue on soil organic carbon fractions: An 11-year field study of rice-based cropping systems in southeast China. Agric. Ecosyst. Environ. 2016, 223, 261–269. [Google Scholar] [CrossRef]
  49. Tang, H.; Xiao, X.; Li, W.; Sun, G.; Chen, K. Effects on long-term different fertilization regimes on the rhizospheric microbial community functional diversity in paddy field. Ecol. Environ. Sci. 2016, 25, 402–408. [Google Scholar]
  50. Sackett, T.E.; Basiliko, N.; Noyce, G.L.; Winsborough, C.; Schurman, J.; Ikeda, C.; Thomas, S.C. Soil and greenhouse gas responses to biochar additions in a temperate hardwood forest. GCB Bioenergy 2015, 7, 1062–1074. [Google Scholar] [CrossRef]
  51. Liu, S.; Zhang, Y.; Zong, Y.; Hu, Z.; Wu, S.; Zhou, J.; Jin, Y.; Zou, J. Response of soil carbon dioxide fluxes, soil organic carbon and microbial biomass carbon to biochar amendment: A meta-analysis. GCB Bioenergy 2016, 8, 265. [Google Scholar] [CrossRef]
  52. Wang, Z.; Li, Y.; Chang, S.X.; Zhang, J.; Jiang, P.; Zhou, G.; Shen, Z. Contrasting effects of bamboo leaf and its biochar on soil CO2 efflux and labile organic carbon in an intensively managed Chinese chestnut plantation. Biol. Fertil. Soils 2014, 50, 1109–1119. [Google Scholar] [CrossRef]
  53. Gao, Y.; Li, T.; Fu, Q.; Li, H.; Liu, D.; Ji, Y.; Li, Q.; Cai, Y. Biochar application for the improvement of water-soil environments and carbon emissions under freeze-thaw conditions: An in-situ field trial. Sci. Total Environ. 2020, 723, 138007. [Google Scholar] [CrossRef]
  54. Chen, J.; Sun, X.; Zheng, J.; Zhang, X.; Liu, X. Biochar amendment changes temperature sensitivity of soil respiration and composition of microbial communities 3 years after incorporation in an organic carbon-poor dry cropland soil. Biol. Fertil. Soils 2018, 54, 175–188. [Google Scholar] [CrossRef]
  55. Bruun, E.W.; Ambus, P.; Egsgaard, H.; Hauggaard-Nielsen, H. Effects of slow and fast pyrolysis biochar on soil C and N turnover dynamics. Soil Biol. Biochem. 2012, 46, 73–79. [Google Scholar] [CrossRef]
  56. Zhang, A.; Liu, Y.; Pan, G.; Hussain, Q.; Li, L.; Zheng, J.; Zhang, X. Effect of biochar amendment on maize yield and greenhouse gas emissions from a soil organic carbon poor calcareous loamy soil from central China plain. Plant Soil 2012, 351, 263–275. [Google Scholar] [CrossRef]
Figure 1. Variation in soil nutrients under biochar treatment during various phases of the study period (Note: Different lowercase letters represent a significant difference between treatments at p < 0.05).
Atmosphere 13 02038 g001
Figure 2. Different fractions of annual SOC in response to biochar addition. (Note: Different lowercase represents significant difference at p < 0.05 between treatments).
Atmosphere 13 02038 g002
Figure 3. Effect of biochar addition on annual soil respiration rate in saline soil. (Note: Different lowercase represents significant difference at p < 0.05 between treatments).
Atmosphere 13 02038 g003
Figure 4. Difference in cumulative soil respiration rate during the experimental period. (Note: Different lowercase represents significant difference at p < 0.05 between treatments).
Atmosphere 13 02038 g004
Figure 5. Relationship between soil respiration rate and soil temperature for different biochar additions.
Atmosphere 13 02038 g005
Figure 6. Relationship between soil respiration rate and soil moisture content for different biochar additions.
Atmosphere 13 02038 g006
Figure 7. Correlation between soil respiration rate, soil organic carbon, and environmental factors. (Note: * indicates significant correlation at p < 0.05 level, ** indicates significant correlation at p < 0.01 level).
Atmosphere 13 02038 g007
Table 1. The stages of the trial period and their corresponding dates.
Stage2019–2020 Freezing and Thawing Period (FTP1)2019–2020 Crop-Growing Period (CP1)2020–2021 Freezing and Thawing Period (FTP2)2020–2021 Crop-Growing Period (CP2)
First Freezing Period (FFP1)Freezing Period (FP1)Thawing Period (TP1) First Freezing Period (FFP2)Freezing Period (FP2)Thawing Period (TP2)
Start time5 November 201916 December 201921 February 202027 May
2020
2 November 20202 December 202028 February 202129 May
2021
End time16 December 201921 February 202015 April
2020
17 September 20202 December 202028 February 202115 April
2021
25 September 2021
Table 2. Methods and equipment for the determination of soil physicochemical properties.
Soil ParameterTest MethodEquipment
Soil moisture contentDryingBlast soil drying oven (101-3)
Soil temperatureNASoil temperature sensor (TM-03)
Fast-acting potassium0.5 mol/L NaHCO3 and molybdenum antimony sulfateUV-Vis spectrophotometer (UV-5300PC)
Alkali-hydrolyzable N1.0 mol/L NaOH alkaline diffusionNA
Fast-acting phosphorusvia ammonium acetate (pH 7.0)Flame photometer (Sherwood M410)
NO 3 -N2 mol/L potassium chloride solutionFlow analyzer (AA3)
NH 4 + -N
Soil organic carbonDigestion method using potassium dichromateNA
Particulate organic carbonUsing a chemical dispersant (sodium hexametaphosphate: NaHMP)
followed by physical fractionation [29]
NA
Mineral-associated organic carbonNA
NA: not available.
Publisher’s Note: MDPI stays neutral with regard to jurisdictional claims in published maps and institutional affiliations.

