Article

Analysis of Vegetation Coverage Evolution and Degradation under Coal Mine Construction in Permafrost Region

1
Lanzhou Institute of Technology, Lanzhou 730000, China
2
State Key Laboratory of Frozen Soil Engineering, Northwest Institute of Eco-Environmental and Resources, Chinese Academy of Sciences, Lanzhou 730000, China
3
Chengdu Vocational & Technical College of Industry, Chengdu 610000, China
*
Author to whom correspondence should be addressed.
Atmosphere 2022, 13(12), 2035; https://doi.org/10.3390/atmos13122035
Submission received: 31 October 2022 / Revised: 30 November 2022 / Accepted: 1 December 2022 / Published: 4 December 2022
(This article belongs to the Special Issue Interactions of Atmosphere and Permafrost)

Abstract

:
The ecological environment in permafrost regions is very sensitive to climate change and human activities. The effects of coal mining on the vegetation in permafrost regions have been poorly studied. Herein, on the basis of a field survey in the Juhugen mining area of Qilian Mountain, China, we investigated and quantified the influence of open-pit coal mining on vegetation coverage degradation in permafrost areas. According to the NDVI and field survey, the vegetation coverage was divided into five levels from low to high in the Arc GIS platform. Compared with the area not affected by coal mining, vegetation degradation was significant in the coal-mining-affected area, especially in the high-vegetation-coverage area. The vegetation coverage in Level 5 decreased from 51.99% to 21.35%. According to the conversion matrix, the transfer-out area in high coverage was larger, while the transfer-in area in low vegetation coverage was larger. The transfer-out area of five levels was significant in levels 2–5, accounting for 36.1% to 62.8% of the total area. The transfer-in area of five levels was significant in levels 1–4, accounting for 55.2% to 75.0% of the total area. Moreover, the ground surface temperature and water change were monitored in the vegetation degradation area. The results showed that the above degradation was related to an increase in the ground surface temperature and a decrease in the ground surface moisture.

1. Introduction

The alpine climate of the Qinghai Tibet Plateau has created a unique ecological environment, which is often characterized by fragility and slow recovery. However, as the origin of major rivers in China, the ecological environment of the Qinghai Tibet Plateau has a profound impact on the conservation and stability of water resources in China. The permafrost associated with the alpine ecosystem has formed a stable cooperative relationship with vegetation in the long-term evolution in Qinghai Tibet Plateau [1,2]. However, influenced by climate change and human activity, the thermal state of permafrost is strongly affected [3,4], which leads to the degradation of permafrost and, consequently, the ecological environment of vegetation [5]. For example, changes in the ground surface hydrothermal conditions can easily lead to vegetation degradation [6,7]. In addition, affected by the degradation of permafrost, alpine meadows tend to transform into alpine steppe, and some mesophytic vegetation is replaced by xerophytic vegetation [8,9], which remarkably affects the vegetation development and distribution [10,11].
In permafrost regions, the construction of roads, railways, and infrastructure and mineral development have a severe impact on permafrost and the environment [12,13]. Among the impacts of human activities on vegetation in permafrost regions, the influence of coal mining is obviously significant. In particular, the mining area of open-pit coal mines is large, and the ground surface destruction is strong. The process of coal mining is bound to directly destroy the vegetation on the ground surface of the mining area, change the ground surface hydrological state [14,15], and then affect the surrounding vegetation growth environment [16], which is particularly significant in permafrost regions. However, at present, there are relatively few studies on the impact of coal mining on vegetation in permafrost regions, with most studies focusing on monitoring the vegetation change in non-permafrost regions. For example, Wang et al. [17] used remote sensing images and Arc-GIS technology to assess the ecological cumulative risk around the coal mine area. Xu Jia [18] used the linear trend to study vegetation cover change and influence factors on the temporal and spatial scales according to the normalized difference vegetation index (NDVI). Hou Jing et al. [19] discussed the driving influence of coal mining and annual precipitation on land degradation in the mining area using Arc-GIS software and linear regression methods. Wang et al. [20] used Pearson correlation analysis to study the relationship between soil physical properties and vegetation biomass. Wang Chao et al. [21] used remote sensing to establish the quantitative relationship between the change in groundwater depth and NDVI before and after mining. In addition, many studies used NDVI as the data source to analyze the natural influencing factors of vegetation coverage change by trend analysis, slope analysis, and other methods [22,23]. It was seen from the above studies that NDVI and mathematical models are often used for research on vegetation coverage change. At present, NDVI, which represents the vegetation growth status, especially the maximum of vegetation NDVI, can effectively reflect the optimal status of annual vegetation growth [24]. The NDVI has a close correlation with biomass [25], which is widely used in the study of spatiotemporal scale changes in vegetation [26,27].
Therefore, this paper used the conversion matrix [21,25] to quantitatively analyze vegetation coverage change characteristics according to NDVI data before and after the coal mine construction. Then, the influencing factors of vegetation degradation around the mining area, in combination with the monitored ground surface hydrothermal data, were explored.

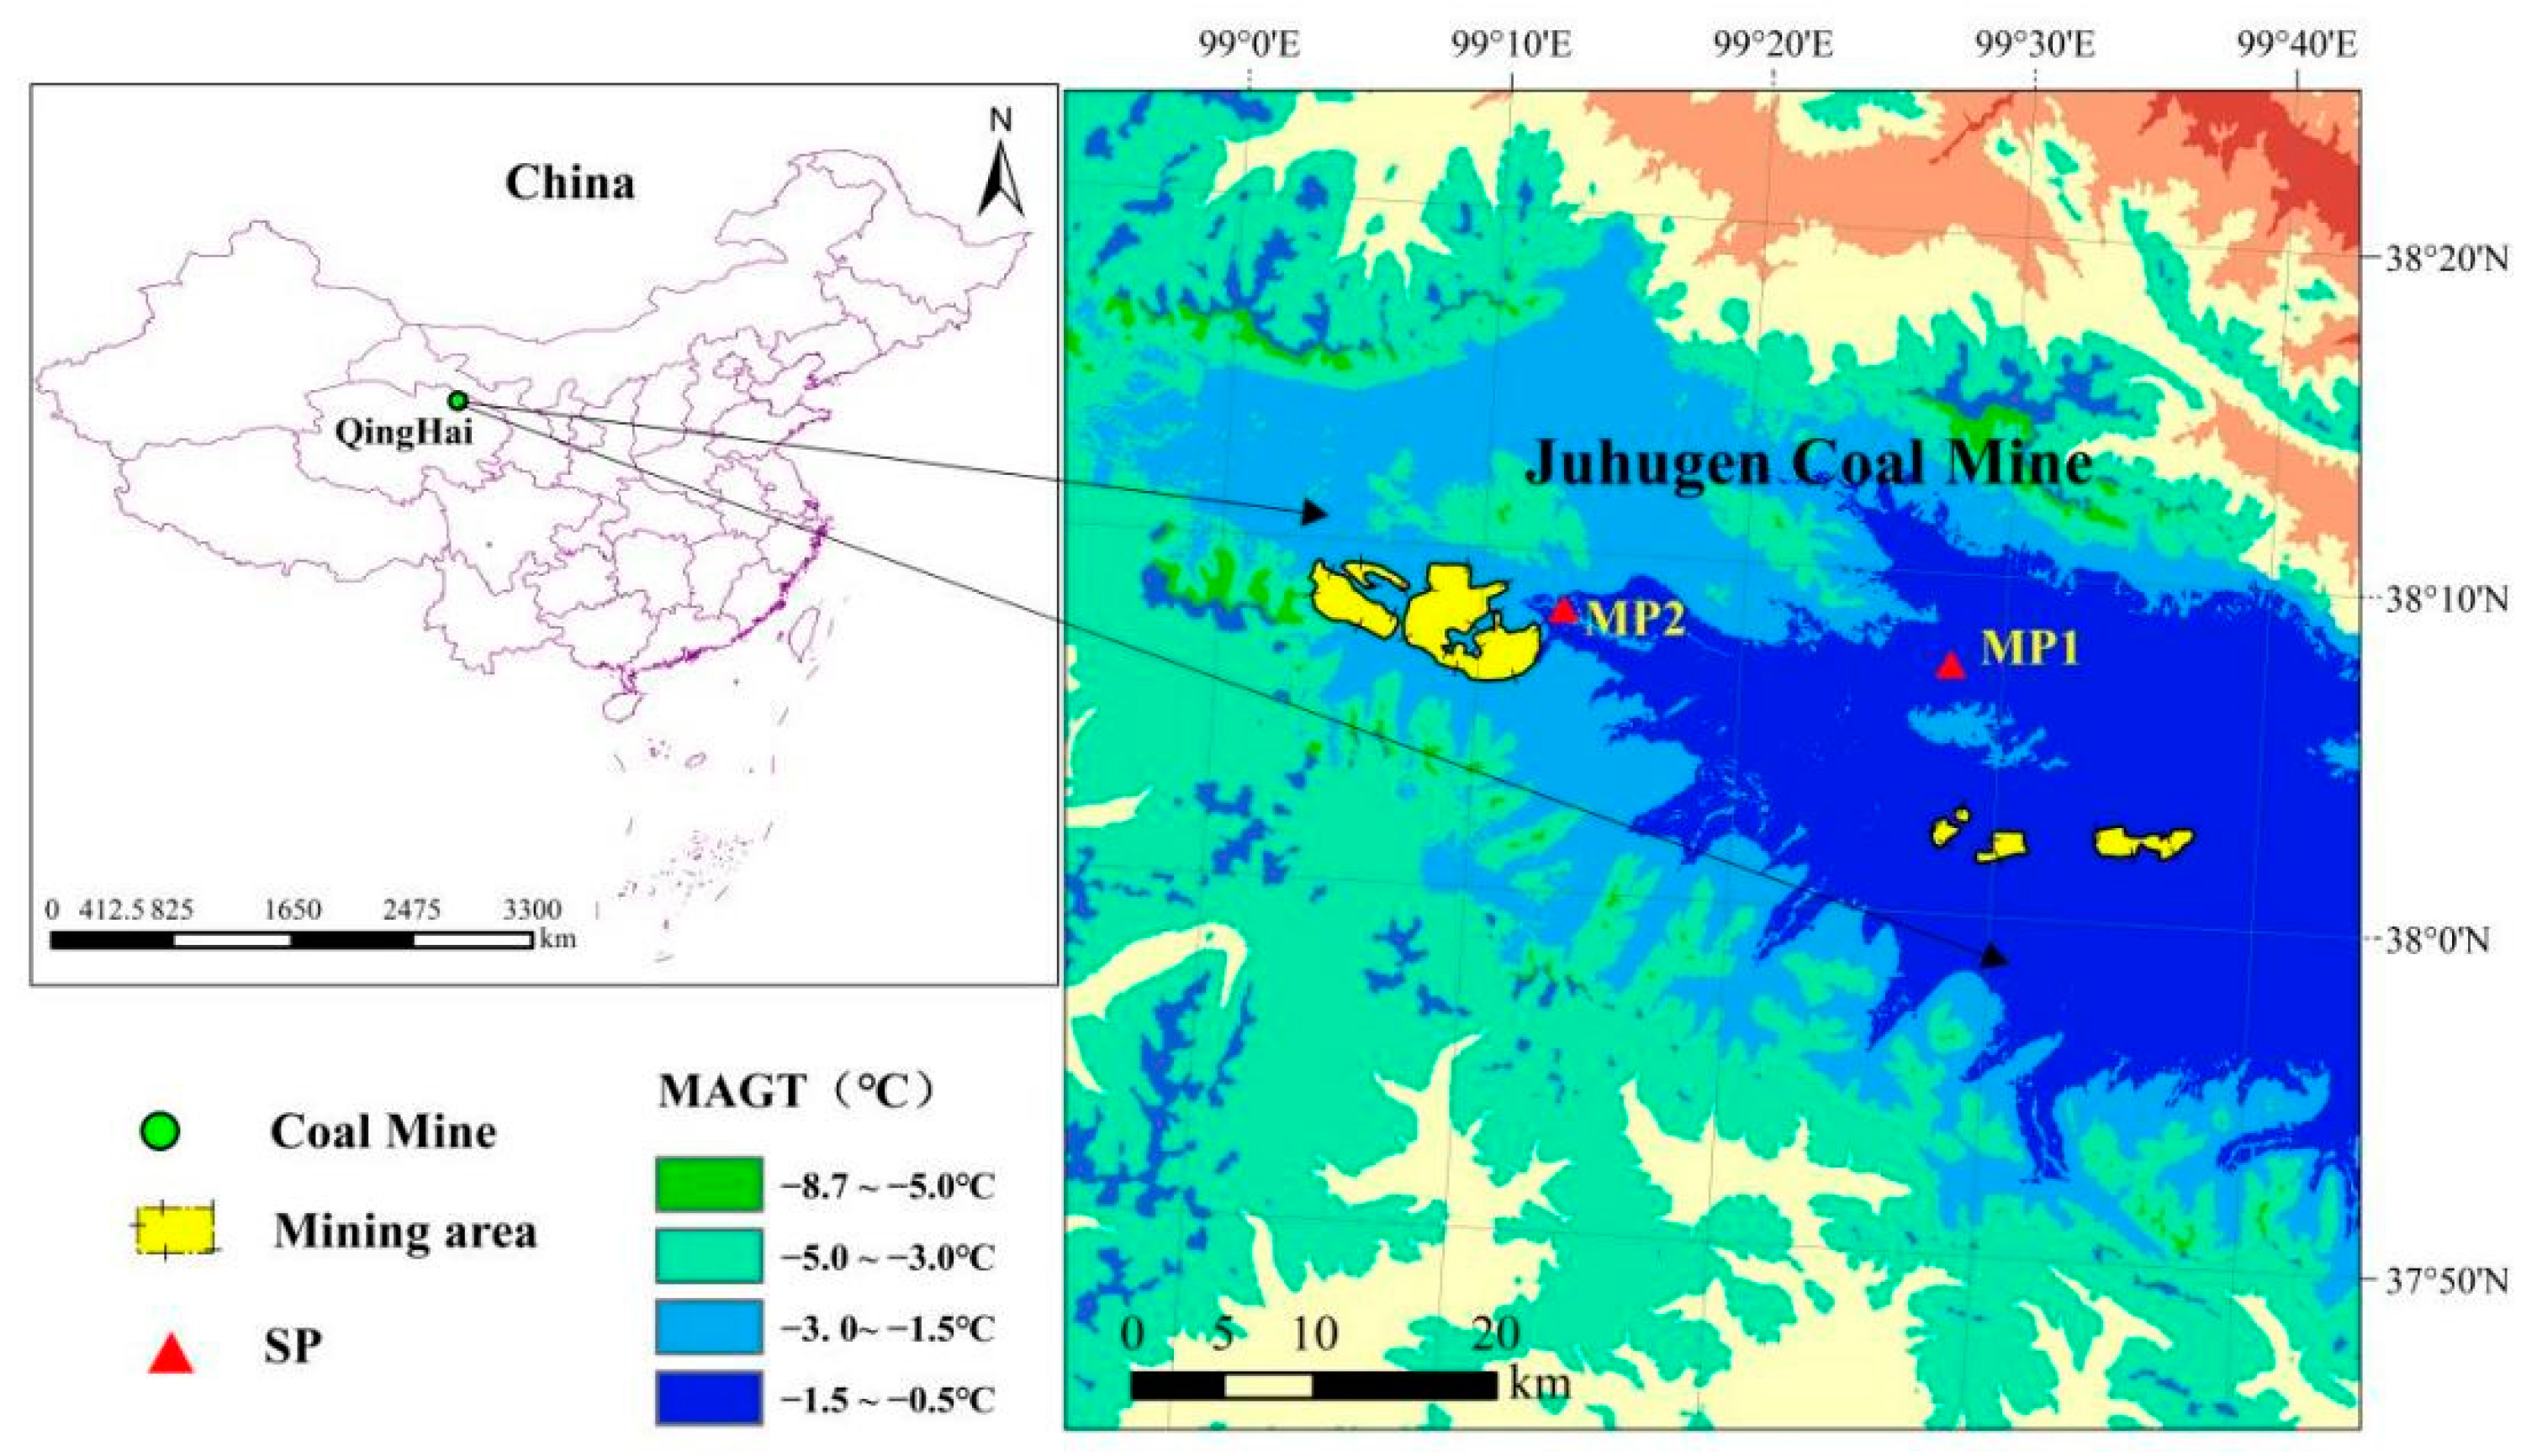
2. Introduction of the Study Area

Juhugen Coal Mine, belonging to the Qilian Mountains, is located in the north of Qinghai Province, China (Figure 1). The regional climate of the Juhugeng mining area is an alpine semihumid climate zone. The average annual temperature is −3.8 to −0.42 °C, and the annual precipitation is about 500 mm, which is mainly concentrated in June to September [28,29]. The meadow type around the mining area is mainly marsh meadow and alpine meadow, with high vegetation coverage [28]. The area around the coal mine is typical alpine permafrost, whose state is unstable [29]. The mean annual ground temperature (MAGT) of permafrost is basically −0.3 to −1.75 °C [30]. Due to its rich coal reserves, it is the main coal mine base of Qinghai Province. Since the construction of the coal mine in 2003, the coal mining area in Juhugen Coal Mine has increased year by year. As of 2016, the direct open-pit mining area reached 47.75 km2.

3. Research Methods

At present, the vegetation indices commonly used for remote sensing monitoring of vegetation coverage include NDVI, PVI, MVI, SAVI, MSAVI, TSAVI, and GEMI. However, the normalized difference vegetation index (NDVI) is the most accurate and commonly used value that can best reflect the vegetation growth state [24,25,26,27]. Therefore, on the basis of the Landsat TM remote sensing images around the coal mine, this paper calculates the NDVI of vegetation around the mine within ~10 km before (2002) and after (2016) the coal mine construction. Then, the vegetation coverage is calculated around the mine within ~10 km through the relationship between the NDVI and vegetation coverage. According to the vegetation coverage changes before (2002) and after (2016) the coal mine construction, the change monitoring of vegetation coverage was realized, and the impact of coal mining on vegetation growth was evaluated quantitatively. The selected Landsat TM images before and after coal mine construction in the paper were in August 2002 and August 2016 for quantitative evaluation. The images in two periods were selected from mid-August of that year to eliminate the impact of seasonal differences on NDVI. The TM images were download from geospatial data cloud (http://www.gscloud.cn/ (accessed on 21 November 2021). The selected TM images were preprocessed by pretreatment and atmospheric correction in ENVI 4.8 before the calculation to improve the accuracy [31].
NDVI is an indicator of vegetation growth status and vegetation spatial distribution density, which is linearly related to vegetation coverage. The value of NDVI generally varies from −1 to +1, and its extent can be calculated in the near-infrared band and red band (Equation (1)). For bare soil areas without vegetation, the NDVI value is low and close to 0; in areas with high vegetation coverage, the NDVI value is large, even greater than 0.7; a negative value indicates that the ground is covered by clouds, water, snow, etc., which is highly reflective of visible light [24,26].
NDVI = (NIR − R)/(NIR + R),
where NIR is the near-infrared band, and R is the red band.
There have been many studies on the conversion of NDVI into vegetation coverage and quantitative remote sensing models. Referring to some current studies, the following model was selected through comparative analysis [32,33]:
fveg = (NDVI − NDVImin)/(NDVImax − NDVImin),
where fveg is the vegetation coverage to be converted, and NDVImin and NDVImax are the minimum and maximum NDVI.
Since the NDVImin and NDVImax actually refer to the NDVI value of the area with the bare soil and highest vegetation coverage, this study could not obtain the specific value of this area. However, ignoring noise and other influencing factors, this paper used an approximate method to obtain the NDVI value. Specifically, the NDVI values corresponding to the 1% and 99% confidence interval of the cumulative frequency were used as the values of NDVImin and NDVImax [24,25].

4. Results and Discussion

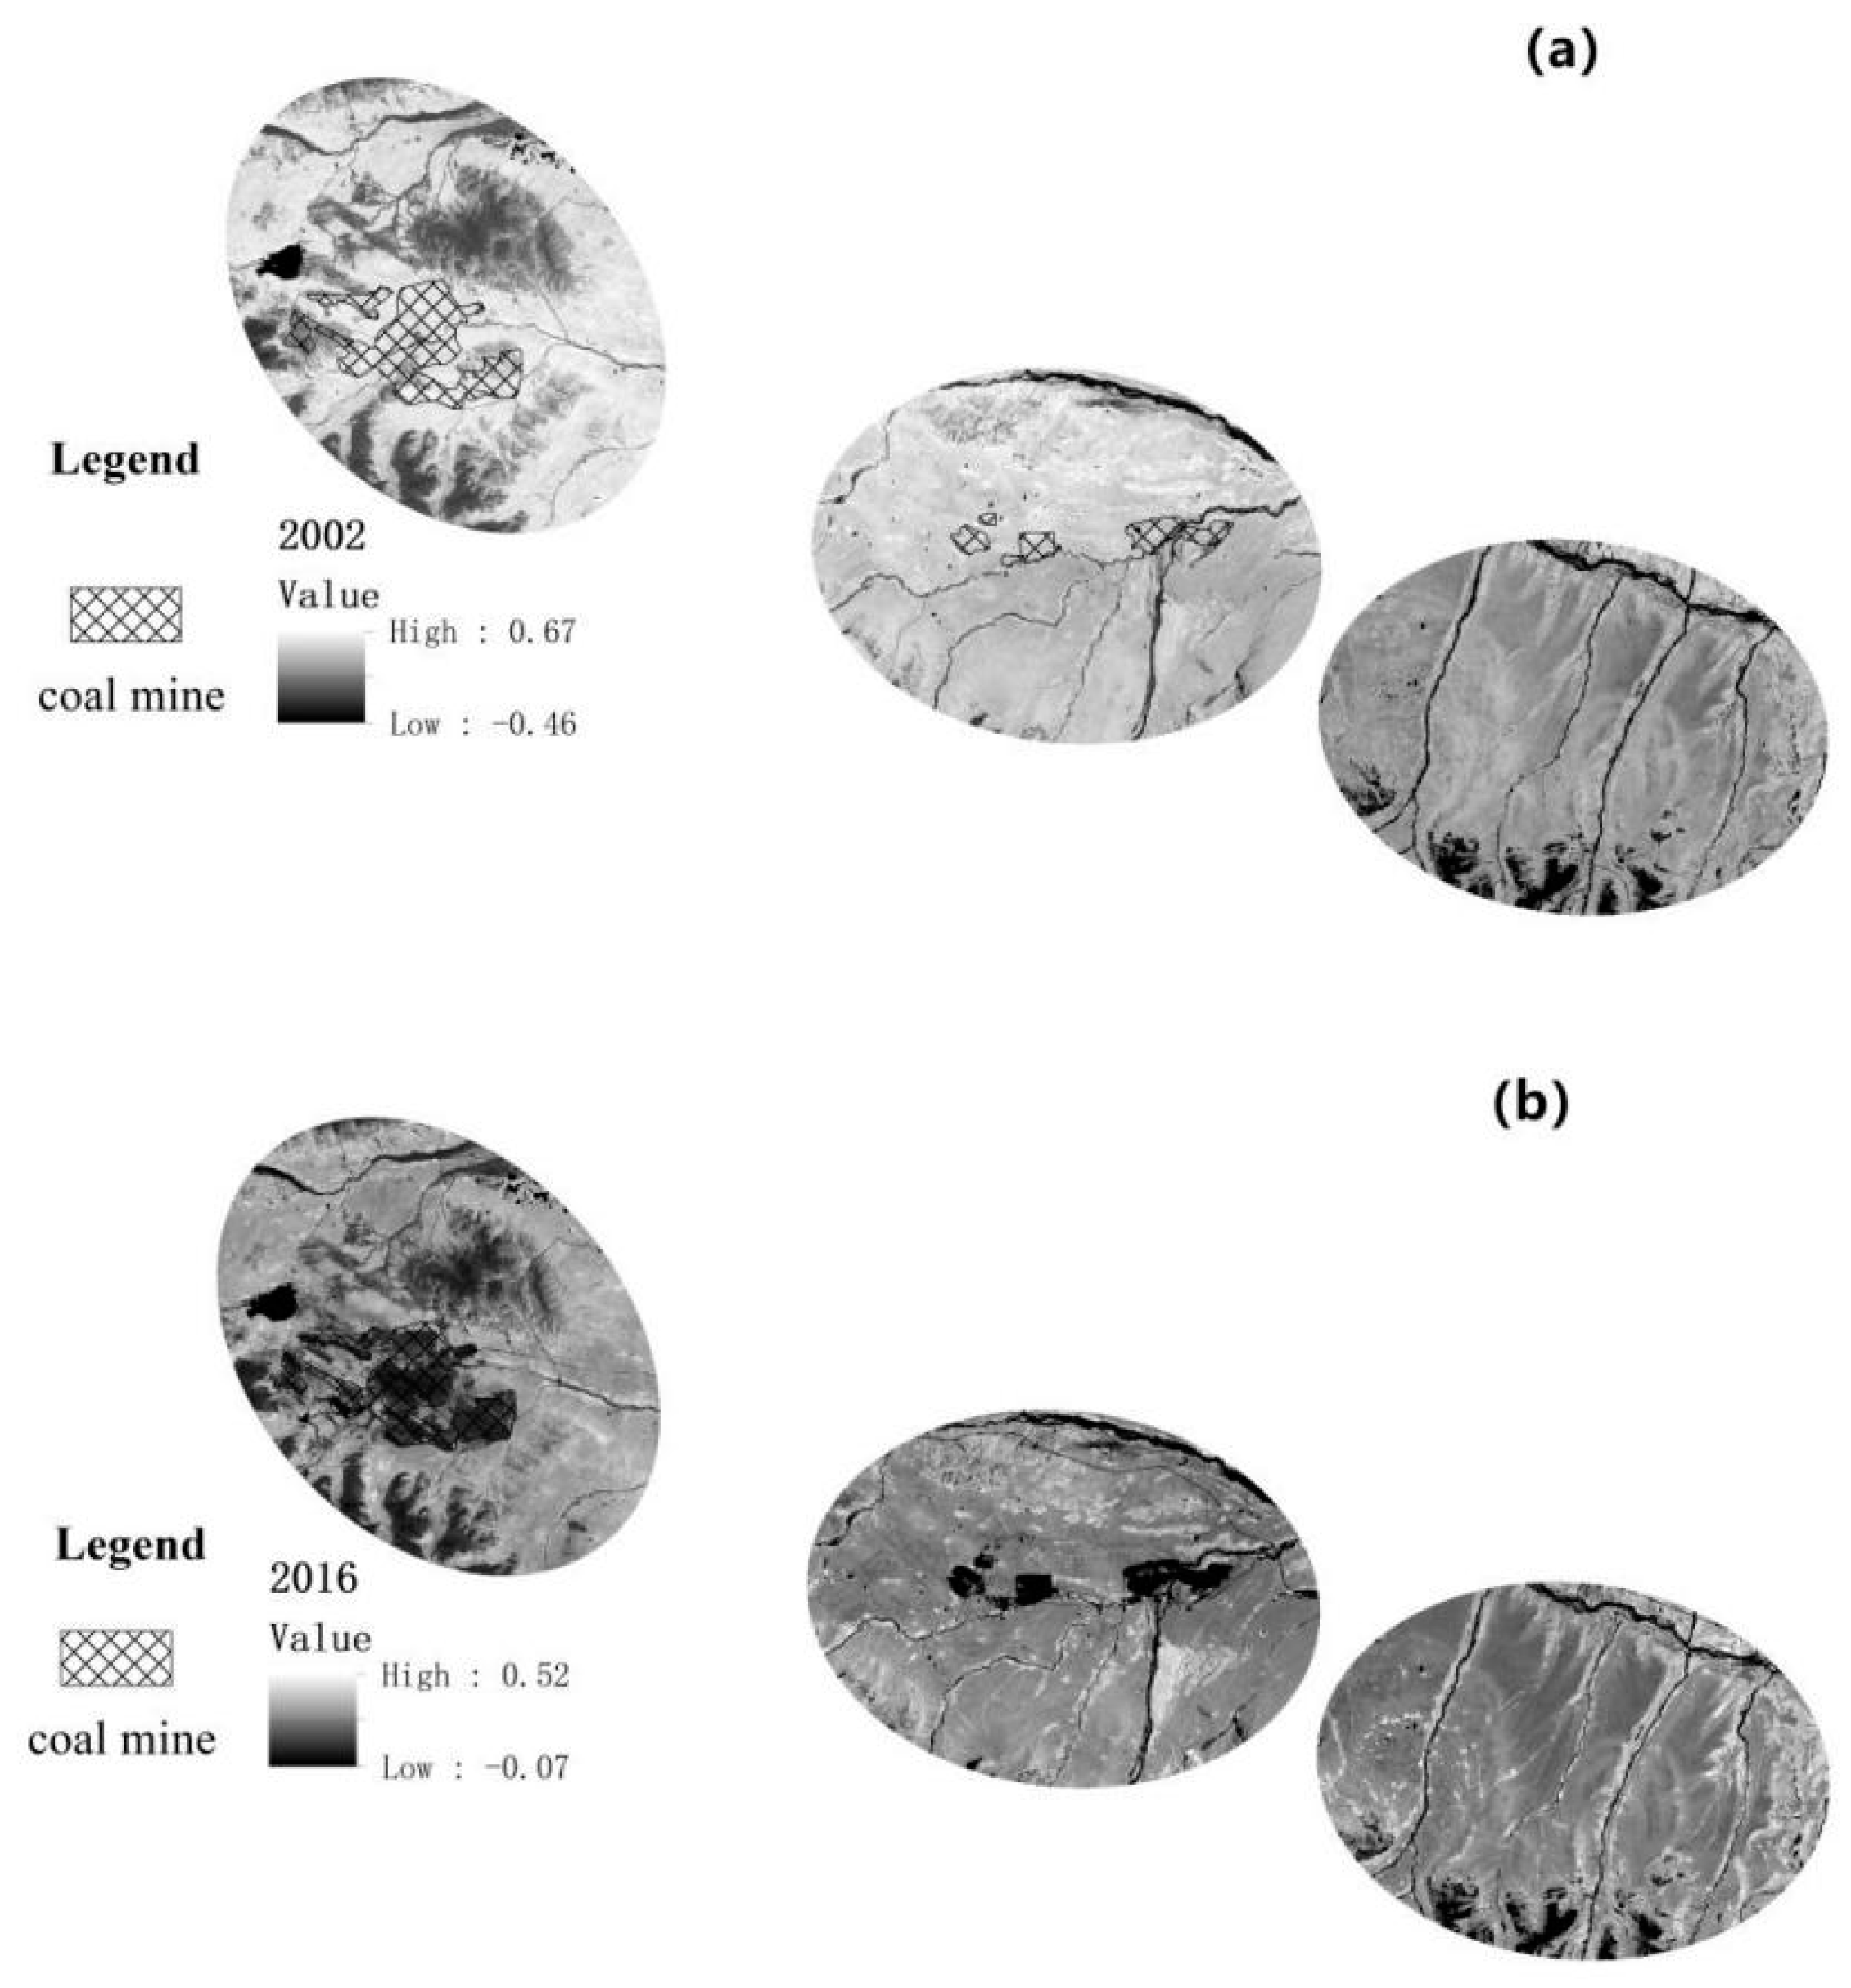
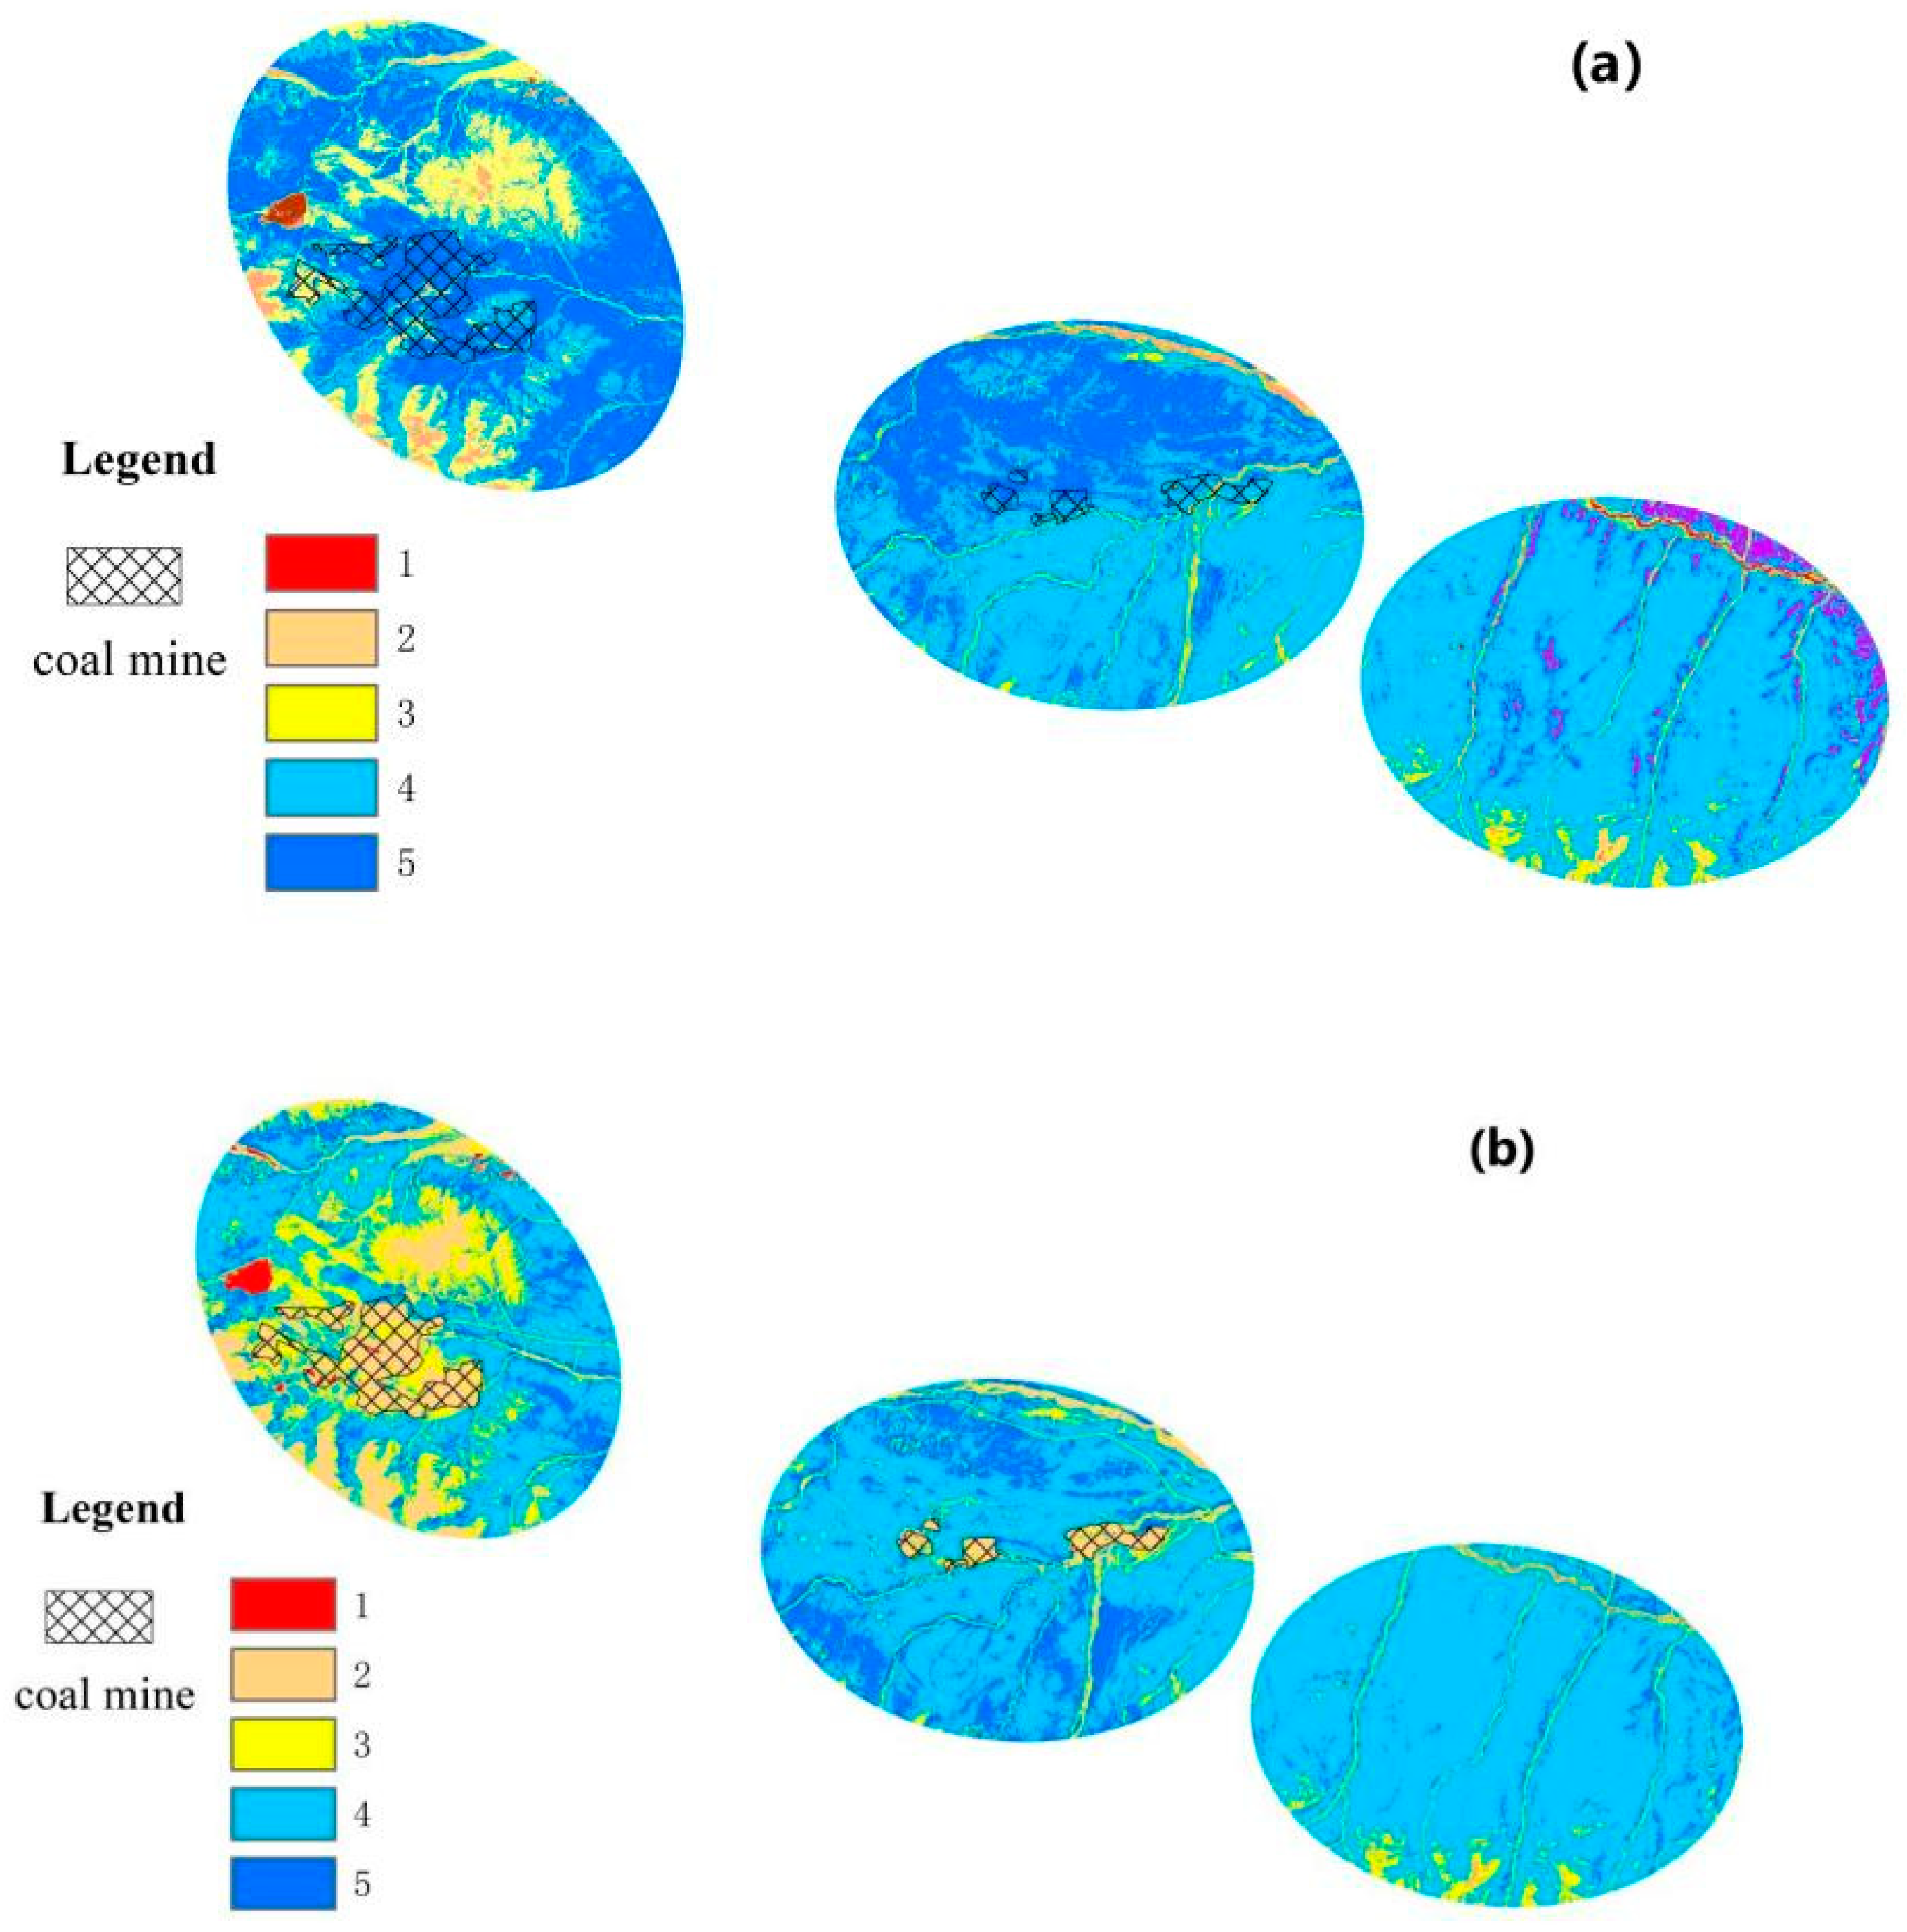
4.1. Classification of Vegetation Coverage Levels

According to the TM images around the mining area in August 2002 and 2016, the NDVI of the vegetation around the mining area was calculated using Equation (1). The calculated results are shown in Figure 2. Then, the vegetation distribution images around the mining area in August 2002 and 2016 were obtained using Equation (2). According to the vegetation distribution images, the vegetation distribution around the mining area was divided into five levels [20,32]. The vegetation coverages from level 1 to level 5 were 0–20%, 20–40%, 40–60%, 60–80%, and more than 80%, respectively. The vegetation coverage reclassification results based on the vegetation distribution images around the mining area are shown in Figure 3.
In Arc-GIS software, the area and proportion of different vegetation coverage levels in 2002 and 2016 were calculated as shown in Table 1. It can be seen from Table 1 that the vegetation around the mining area was significantly affected following coal mine construction. The areas with medium (level 3) and low (level 1–2) vegetation coverage increased significantly. The percentage increases in vegetation coverage area of levels 1–3 were 8.81%, 6.17%, and 5.21% respectively, and the percentage increase in vegetation coverage area of level 4 with higher vegetation coverage also increased by 11.44%. However, the percentage increase in vegetation coverage area of level 5 with the highest vegetation coverage decreased significantly by 30.64%.
The vegetation classification of the control experimental area (Figure 3) in 2002 and 2016 was calculated using Arc-GIS software, as shown in Table 2. It can be seen from Table 2 that, in the area not affected by coal mining, the vegetation classification did not change much in 2002 compared with 2016. Low vegetation coverage classified as level 1, level 2, and level 3 decreased by 0.55%, 0.40%, and 1.77% respectively. However, the highest vegetation coverage, level 5, also decreased by 4.64%. Only the vegetation classified as level 4 increased by 3.83%. Hence, the vegetation in the selected contrast test area did not change much between 2002 and 2016. From 2002 to 2016, the climate of the Juhugen Coal Mine showed a relatively warm and humid trend [34]. For a small change rate of temperature and precipitation, the degree of warming and humidifying development was relatively small around coal mine. Therefore, the climate change trend did not have a strong impact on the development of vegetation. It can be seen from Table 1 and Table 2 that the area affected by the coal mine was the main factor influencing vegetation degradation.
Combined with the data of the above comparison area, it can be analyzed from Table 1 that, since 2002, the vegetation coverage around the coal mines was in a state of significant degradation, especially for level 5 with the highest vegetation coverage, which decreased from 51.99% in 2002 to 21.35% in 2016. In addition, level 1, level 2, and level 4 increased significantly. The area with low vegetation coverage increased more conspicuously. Therefore, it was concluded that the vegetation around the coal mine has been in a rapidly degrading state since the construction of the coal mine.

4.2. Transformation Relationships of Different Vegetation Coverage Levels

In order to further explore the specific vegetation degradation modes, the transformation relationships of vegetation coverage at different levels were calculated using the Raster Calculator and Reclass tool of Arc-GIS software. Moreover, the conversion matrix [11,24,26] was used to explore the specific transformation relationships of different vegetation coverage levels. The conversion matrix can comprehensively and concretely depict the structural characteristics of regional land-use change and the change direction of each land-use type. This method comes from the quantitative description of system state and state transition in system analysis. The calculation results are shown in Table 3.
It can be concluded from the conversion matrix (Table 3) that, from 2002 to 2016, vegetation coverage level 1 mainly transformed to level 2, with a transformation area of 13.98 km2, accounting for 99.1% of the transformation amount. Level 2 vegetation mainly transformed to level 1 and level 3, accounting for 55.1% and 44.3% of the transformation amount, respectively. It mainly transformed into low coverage, and the transfer-out area was significant. Level 3 vegetation mainly transformed into level 1, level 2, and level 4, and the proportions of transformation to low coverage (level 1 and level 2) and high coverage (level 4) were 67.3% and 32.7%, respectively. The area transformed to lower coverage was more obvious. Level 4 vegetation mainly transformed into level 3, with a transformation area proportion of 41.6%, while the transformation proportion to lower levels (levels 1–3) was 79.7%. Level 5 vegetation was mainly transformed into level 4, and the transformation area proportions to levels 1, 2, 3, and 4 were 15.5%, 14.3%, 9.7%, and 60.5%, respectively. Therefore, it was mainly transformed into level 4. Consequently, it can be concluded that the vegetation around the mining area was clearly in a degraded state, and the transformation was mainly from a high vegetation coverage level to a low vegetation coverage level, especially to the adjacent lower coverage level. According to the transformation relationships of different vegetation levels (Table 3), the vegetation coverage in the medium (level 3) and low (level 1–2) areas around the mining area increased conspicuously, while the areas with high vegetation coverage (Level 5) decreased substantially. Vegetation in the areas with medium (level 3) and high (level 4) coverage increased in recent years, and the increase was mainly caused by the transformation of high coverage areas (level 5).

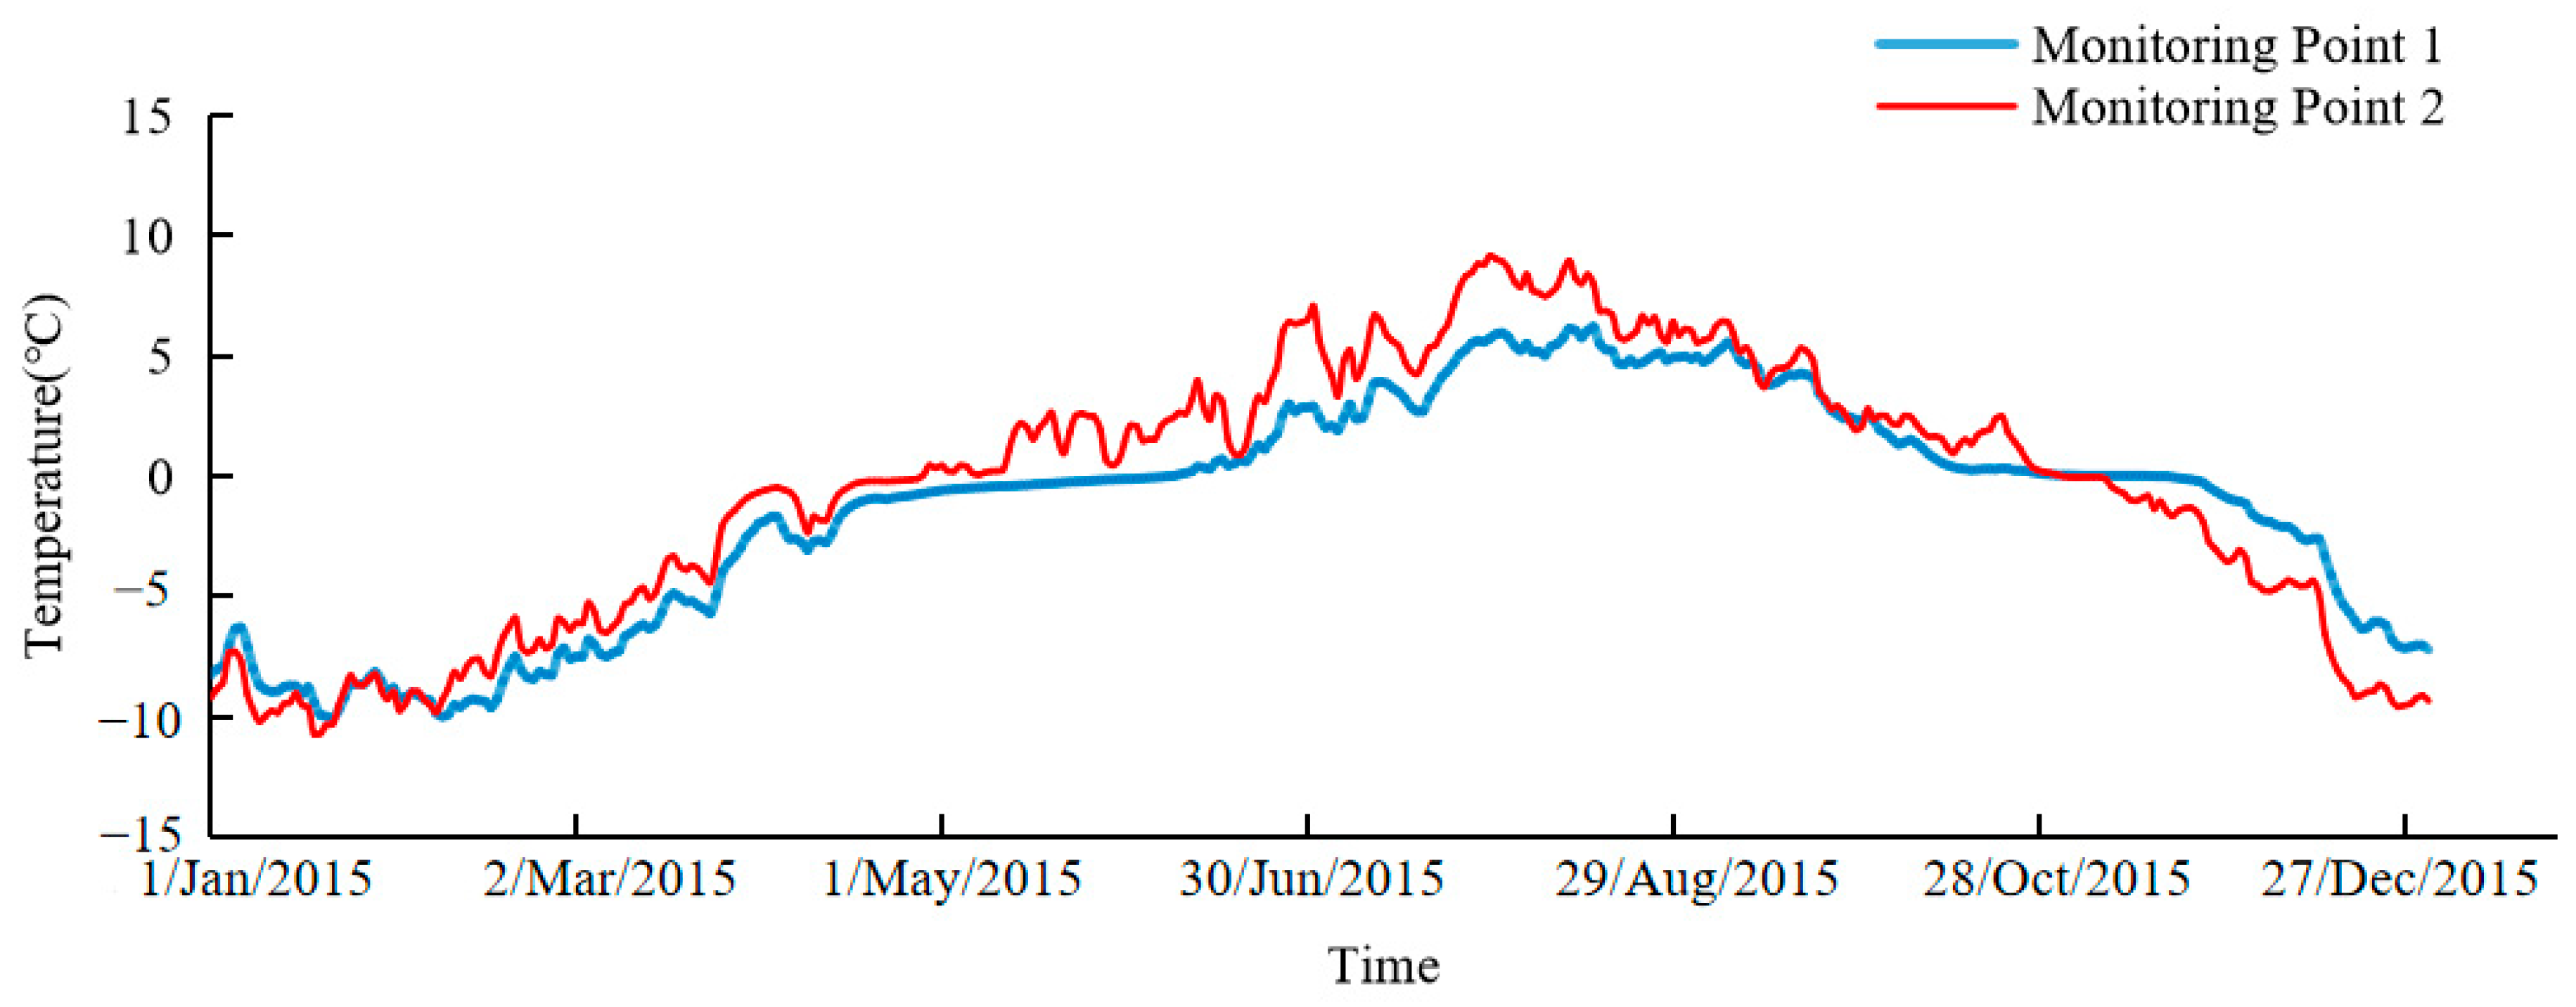
4.3. Factors Influencing Vegetation Degradation

The meadow type surrounding the mining area was mainly marsh meadow, and moisture and temperature were the main factors influencing the vegetation growth [9,10,11]. In order to further explore the causes of vegetation degradation under the influence of coal mining in permafrost regions, the ground temperature and moisture data at a depth of 30 cm in areas with different vegetation coverage around the mining area were selected. The ground temperature and moisture data were monitored using the HOBO data acquisition instrument produced by the American Onset Company. The location of sampling points (SP) is shown in Figure 1. Two monitoring points in the marsh meadow with different vegetation coverage were selected to research the ground temperature and moisture (30 cm depth) in 2015. Monitoring point 1 (MP1) has a vegetation coverage of about 85%, while monitoring point 2 (MP2) had a vegetation coverage of about 65%. The field survey of vegetation coverage data of the two sampling points was conducted in August 2015. Monitoring point 1 was not affected by the coal mine construction, while monitoring point 2 was affected significantly, and the vegetation around monitoring point 2 was in a degraded state. The ground temperature and moisture data in 2015 are shown in Figure 4 and Figure 5. It can be concluded from the values at 30 cm depth (Figure 4) that the ground temperature at monitoring point 2 was significantly lower than that at monitoring point 1 from the initial melting of the 30 cm stratum in spring. In the summer, when the vegetation grows vigorously, e.g., July to August, the temperature difference of the two monitoring points was significant at about 1.2–3 °C. The ground temperature at monitoring point 1 was lower than that ay monitoring point 2. In winter, the ground temperature at 30 cm depth at monitoring point 1 was higher than that at monitoring point 2 in the process of surface freezing. In addition, it can be seen from the moisture data at 30 cm depth at the two monitoring points (Figure 5) that the moisture at monitoring point 1 was evidently higher than that at monitoring point 2 in summer, with a significant difference between the two of ~15–20%. According to the data for the two monitoring points with different vegetation coverage, it could be concluded that moisture and temperature showed different characteristics with the degradation of vegetation.
Therefore, the different characteristics of moisture and temperature were mainly caused by the coal mining activities, leading to the thermal disturbance of the permafrost and active layer. With the ground temperature rising, the upper limit of permafrost as the aquiclude layer declined, with the surface water subsequently decreasing. Combining the TM images and field investigations around the coal mine area, it could be concluded that vegetation with high coverage (level 4–5) mainly occurred in marsh meadow. However, influenced by coal mining, the surface soil hydrous state was changed under the influence of the active layer and the upper limit of permafrost. Accordingly, the marsh meadows with high moisture content and high coverage were severely affected first, which led to their degeneration into areas with low moisture and low vegetation coverage. However, the alpine meadows were mainly level 1–3, and their change was mainly affected by the increase in permafrost temperature, the decline in the permafrost upper limit, and the reduction in moisture content. As a result, the transformation in alpine meadows level 1–3 was from high vegetation coverage to low vegetation coverage. This transformation pattern was also consistent with previous findings describing the vegetation types of marsh meadow and alpine meadow in permafrost regions of the Qinghai Tibet Plateau [2,9,10].
In addition, the above transformation in terms of vegetation coverage mainly occurred around the coal mine can be attributed to climate change factors such as temperature and precipitation.

5. Conclusions

The impact of coal mine construction on vegetation is significant, especially in permafrost regions. From the above analysis, it could be concluded that the vegetation in the area not affected by coal mining changed little from 2002 to 2016. However, in the area affected by coal mining, vegetation degradation was significant, especially in the area with high coverage. For example, the proportion of vegetation coverage area in level 5 decreased from 51.99% in 2002 to 21.35% in 2016. According to the conversion matrix, in the area affected by coal mining, the transfer out related to areas with high vegetation coverage was large, while the transfer in related to areas with low vegetation coverage was large. In level 5, 62.8% of the vegetation was transferred out, whereas, in level 2, 75.0% of the vegetation was transferred in. The main reason for this vegetation change was the thermal disturbance of permafrost caused by coal mining, which led to significant changes in the hydrothermal conditions of permafrost. This effect can be seen from the comparison between monitoring point 1 and monitoring point 2. Due to the different impacts of coal mining on the two monitoring points, the surface vegetation coverage also changed. The corresponding surface hydrothermal conditions were also obviously different. In this paper, the vegetation degradation under the influence of the coal mine was only quantitatively calculated at different levels. The change in hydrothermal conditions under the influence of coal mine construction was analyzed. On this basis, if more detailed hydrothermal data of permafrost active layer and vegetation soil and other relevant data can be obtained, the influencing factors and mechanisms of coal mining underlying vegetation evolution and degradation can be further revealed.

Author Contributions

Conceptualization, S.W. and Y.S.; data curation, S.W. and S.J.; formal analysis, S.W.; funding acquisition, S.W. and T.X.; investigation, S.W., T.X., Y.W. and S.J.; methodology, S.W. and T.X.; project administration, S.W. and Y.S.; resources, S.W. and L.H.; software, S.W., Y.W. and S.J.; supervision, S.W. and Y.S.; validation, S.W., Y.W. and L.H.; visualization, S.W.; writing—original draft, S.W.; writing—review and editing, S.W. and L.H. All authors read and agreed to the published version of the manuscript.

Funding

This research was funded by the Gansu Youth Science and Technology Fund Program (grant number 22JR5RA388), the Gansu Province Young Doctor Fund Program (grant number 2022QB-189), and the Youth Science and Technology Innovation Project of Lanzhou Institute of Technology (grant number 19K-010).

Institutional Review Board Statement

Not applicable.

Informed Consent Statement

Not applicable.

Data Availability Statement

All data presented in this paper are available upon request to Shengting Wang (wangshengting07@163.com) or Tianni Xu (xtn18919081743@163.com).

Conflicts of Interest

The authors declare no conflict of interest.

References

  1. Wu, Q.; Liu, Y. Interaction between frozen soil environment and engineering environment in cold region. J. Eng. Geol. 2000, 8, 281–287. [Google Scholar] [CrossRef]
  2. Wang, G.; Li, F.; Wu, Q. Relationship between permafrost and vegetation and its impact on Alpine Ecosystem in permafrost region of Qinghai Tibet Plateau. Chin. Sci. 2006, 36, 743–754. [Google Scholar] [CrossRef]
  3. Jin, H.; Ma, Q. Impacts of Permafrost Degradation on Carbon Stocks and Emissions under a Warming Climate: A Review. Atmosphere 2021, 12, 1425. [Google Scholar] [CrossRef]
  4. Revich, B.A.; Eliseev, D.O.; Shaposhnikov, D.A. Risks for Public Health and Social Infrastructure in Russian Arctic under Climate Change and Permafrost Degradation. Atmosphere 2022, 13, 532. [Google Scholar] [CrossRef]
  5. Zsoter, E.; Arduini, G.; Prudhomme, C.; Stephens, E.; Cloke, H. Hydrological Impact of the New CMWF Multi-Layer Snow Scheme. Atmosphere 2022, 13, 727. [Google Scholar] [CrossRef]
  6. Walker, D.A.; Epstein, H.E.; Gould, W.A.; Kelley, A.M.; Kade, A.N.; Knudson, J.A.; Krantz, W.B.; Michaelson, G.; Peterson, R.A.; Ping, C.L.; et al. Frost-boil ecosystems: Complex interactions between landforms, soils, vegetation and climate. Permafrost Periglac. 2004, 15, 171–188. [Google Scholar] [CrossRef] [Green Version]
  7. Reynolds, M.K.; Walker, D.A. Circumpolar Relationships Between Permafrost Characteristics, NDVI, and Arctic Vegetation Types. Ninth Int. Conf. Permafr. 2008, 2, 1469–1474. [Google Scholar]
  8. Sun, X.; Chen, J.; Cui, X. Soil Science; China Forestry Press: Beijing, China, 2005; pp. 245–269. [Google Scholar]
  9. Wu, Q.; Shen, Y.; Shi, B. Relationship between Frozen Soil Together with Its Water-Heat Process and Ecological Environment in the Tibetan Plateau. J. Glaciol. Geocryol. 2003, 25, 250–255. [Google Scholar] [CrossRef]
  10. Gao, Z.; Wang, Y.; Liu, G. Response of soil moisture within the permafrost active layer to different alpine ecosystems. J. Glaciol. Geocryol. 2014, 36, 1002–1010. [Google Scholar]
  11. Wang, X.; Yi, S.; Wu, Q. The role of permafrost and soil water in distribution of alpine grassland and its NDVI dynamics on the Qinghai-Tibetan Plateau. Glob. Planet. Chang. 2016, 147, 40–53. [Google Scholar] [CrossRef]
  12. Chen, L.; Lai, Y.; Fortier, D.; Harris, S.H. Impacts of Snow Cover on the Pattern and Velocity of Air Flow in Air Convection Embankments of Sub-Arctic Regions. Renew. Energy 2022, 199, 1033–1046. [Google Scholar] [CrossRef]
  13. Chen, L.; Voss, C.; Fortier, D.; McKenzie, J. Surface Energy Balance of Sub-Arctic Roads with Varying Snow Regimes and Properties in Permafrost Regions. Permafrost Periglac. 2021, 32, 681–701. [Google Scholar] [CrossRef]
  14. Cao, W.; Sheng, Y.; Wu, J. Simulation analysis of the impacts of underground mining on permafrost in an opencast coal mine in the northern Qinghai-Tibet Plateau. Environ. Earth 2017, 76, 711. [Google Scholar] [CrossRef]
  15. Cao, W.; Sheng, Y.; Wu, J. Simulation analysis of the impact of excavation backfill on permafrost recovery in an opencast coal-mining pit. Environ. Earth. 2016, 75, 837. [Google Scholar] [CrossRef]
  16. Askaer, L.; Schmidt, L.B.; Bo, E. Environmental Impact on an Arctic Soil–Plant System Resulting from Metals Released from Coal Mine Waste in Svalbard (78° N). Water Air Soil Poll. 2008, 195, 99–114. [Google Scholar] [CrossRef]
  17. Wang, W.; Yan, Q.; Zhong, X. Research on Ecological cumulative effect of arid and semi-arid coal mining area based on rs-gis: A case study of ordos. Coal Sci. Tech. 2021, 50, 235–241. [Google Scholar] [CrossRef]
  18. Xu, J.; Wang, L.; Wang, Y. Spatiotemporal dynamics of vegetation NDVI in Shendong mining area from 2000 to 2017. Res. Soil Wat. Conserv. 2021, 28, 153–158. [Google Scholar] [CrossRef]
  19. Hou, J.; Yu, H.; Mu, S. Spatial–temporal characteristics of land degradation and its influencing factors in coal mine areas in Western China. Coal Sci. Tech. 2020, 48, 206–216. [Google Scholar] [CrossRef]
  20. Wang, D.; Shang, Z.; She, C. Relationship between typical physical properties and biomass of reconstructed soil in grassland open-pit mining area. Chin. Agric. Bull. 2020, 36, 60–65. [Google Scholar]
  21. Wang, C.; Dong, S.; Jia, Z. Responses of vegetation to depth to the groundwater table in the grassland open-pit coal mine area. Acta. Ecol. Sinica. 2020, 40, 6925–6937. [Google Scholar]
  22. Wang, G.; Bi, R.; Zhang, W. Temporal and spatial distribution characteristics and influencing factors of vegetation coverage in typical mining areas. Acta Ecol. Sin. 2020, 40, 6046–6056. [Google Scholar] [CrossRef]
  23. Fang, J.; Ma, G.; Yu, X. Spatiotemporal variation of NDVI in Qinghai Lake Basin and its relationship with climate Factor. J. Soil Water Conserv. 2020, 34, 105–112. [Google Scholar] [CrossRef]
  24. Peng, W.; Zhang, D.; Luo, Y. Influence of natural factors on vegetation NDVI using geographical detection in Sichuan Province. Acta Geogr. Sin. 2019, 74, 1758–1776. [Google Scholar] [CrossRef]
  25. Fu, G.; Sun, W.; Li, S. Modeling aboveground biomass using MODIS images and climatic data in grasslands on the Tibetan Plateau. J. Res. Ecol. 2017, 8, 42–49. [Google Scholar] [CrossRef]
  26. Rao, P.; Wang, Y.; Wang, F. Analysis on the NDVI change and influencing factors of vegetation cover in the Three-River Headwater Region. Acta Grassl. Sin. 2021, 29, 572–582. [Google Scholar] [CrossRef]
  27. Wang, S. Fractional Vegetation Cover in the Source Area of Yellow River Extraction and Change Analysis Based on Temporal NDVI Data of Landsat and MODIS; China University of Geosciences: Beijing, China, 2020. [Google Scholar]
  28. Li, J.; Sheng, Y.; Wu, J. Variations in the ground temperatures of permafrost in the two watersheds of the interior and eastern Qilian Mountains. Environ. Earth Sci. 2016, 75, 480.1–480.14. [Google Scholar] [CrossRef]
  29. Wang, S.; Sheng, Y.; Wu, J. The characteristics and changing tendency of permafrost in the source regions of the Datong River, Qilian Mountains. J. Glaciol. Geocryol. 2015, 37, 27–37. [Google Scholar]
  30. Li, J.; Sheng, Y.; Wu, J. Variations in Permafrost Temperature and Stability of Alpine Meadows in the Source Area of the Datong River, Northeastern Qinghai-Tibet Plateau, China. Permafrost Periglac. 2014, 25, 307–319. [Google Scholar] [CrossRef]
  31. Katsev, I.; Prikhach, A.; Zege, E.; Kokhanovsky, A. Robust Atmospheric Correction Procedure for Determination of Spectral Reflectance of Terrestrial Surfaces from Satellite Spectral Measurements. Remote Sens. 2021, 13, 1831. [Google Scholar] [CrossRef]
  32. Mo, Y.; Zheng, Y.; Chen, H. Analysis on the vegetation cover change in HHH Zone of China in 1982~2000. Remote Sens. Tech. App. 2007, 22, 397–398. [Google Scholar] [CrossRef]
  33. Carlson, N.; David, A. On the Relation between NDVI fractional vegetation cover and leaf area index. Remote Sens. Environ. 1997, 62, 241–252. [Google Scholar] [CrossRef]
  34. Zhao, M.; Cao, G.; Cao, S.; Liu, F.; Li, Y.; Zhang, Z.; Diao, E.; Chen, Z. Temperature and Precipitation and Their Relationship with Runoff Change in Datong River from 1956 to 2016. Res. Soil Water Conserv. 2021, 28, 111–117+125. [Google Scholar] [CrossRef]
Figure 1. Schematic diagram of study area.
Atmosphere 13 02035 g001
Figure 2. NDVI index around coal mines in 2002 (a) and 2016 (b). In (a) and (b), the left and middle maps are the NDVI distribution of the mining-affected area, while the rightmost map is the contrast test area.
Atmosphere 13 02035 g002
Figure 3. Vegetation coverage levels around coal mines in 2002 (a) and 2016 (b). In (a) and (b), the left and middle maps are the vegetation distribution maps of the mining-affected area, while the rightmost map is the contrast test area.
Atmosphere 13 02035 g003
Figure 4. Variation of ground temperature (30 cm) under different cover conditions.
Atmosphere 13 02035 g004
Figure 5. Variation of surface moisture content (30 cm) under different cover conditions.
Atmosphere 13 02035 g005
Table 1. The area proportion of different vegetation coverage levels in the mining affected area in 2002 and 2016.
Periods20022016
LevelArea (km2)Proportion (%)Area (km2)Proportion (%)
175.47.29%166.616.11%
263.36.12%127.212.29%
379.27.66%122.811.87%
4278.726.94%397.038.38%
5537.851.99%220.921.35%
Total area (km2)1034.3100%1034.3100%
Table 2. The area proportion of different vegetation coverage levels in the contrast test area in 2002 and 2016.
Periods20022016
LevelArea (km2)Proportion (%)Area (km2)Proportion (%)
12.50.61%0.30.06%
24.91.20%3.20.80%
318.74.61%25.96.38%
4347.985.74%363.589.57%
531.87.84%13.03.20%
Total area (km2)405.8100%405.8100%
Table 3. Conversion matrix of different vegetation coverage levels in 2002 and 2016.
PeriodsLevel 2016 (km2)
12345Total AreaTransfer-Out Area
2002
(km2)
161.3113.980.120075.4114.1
217.3731.7413.980.18063.2731.53
314.4516.0933.8214.550.2979.2145.39
421.1817.1341.92178.0420.42278.69100.65
552.3148.2232.9204.18200.15537.76337.61
Total area166.62127.16122.73396.96220.871034.35
Transfer-in area105.3295.4288.92218.9220.72
Publisher’s Note: MDPI stays neutral with regard to jurisdictional claims in published maps and institutional affiliations.

