Article

Impact of the COVID-19 Pandemic on the 2020 Diurnal Temperature Range (DTR) in the Contiguous USA

School of Engineering, University of Guelph, 50 Stone Road East, Guelph, ON N1G 2W1, Canada
*
Author to whom correspondence should be addressed.
Atmosphere 2022, 13(12), 2031; https://doi.org/10.3390/atmos13122031
Submission received: 17 October 2022 / Revised: 21 November 2022 / Accepted: 30 November 2022 / Published: 3 December 2022
(This article belongs to the Special Issue Advances in Air Quality Monitoring)

Abstract

:
Following the emergence of COVID-19, nations around the world implemented effective restrictions that limited people’s movements and economic activity, which reportedly led to environmental improvements. The lowering of air emissions is one environmental indicator that has been connected to the pandemic. The diurnal temperature range (DTR) is one environmental indicator that has been linked to air pollution. In this study, it was hypothesized that because of the pandemic restrictions and slowdowns, the DTR in 2020 for a country that implemented major restrictive measures in reaction to the pandemic would be higher than in previous years, despite or in addition to background climatic forcings. Based on information from weather stations in the contiguous United States of America (USA), the DTR for the year 2020 was compared to the five years before it as a test of this hypothesis. It was verified that the annual mean DTR of 2020 was higher than the three years prior (2017–2019), but lower than the DTR of 2015 and 2016. Compared to historical trends (since 1911), the DTR change in 2020 is within past mean DTR variations that occurred over approx. 12-year cycles, linked to sunspot activity (Schwabe solar cycle). Moreover, climatic effects such as El Niño, La Niña and the prolonged trend of global warming reduce the confidence in the perceived effect of the pandemic. To determine if or how anthropogenic and environmental factors can magnify the impact of the COVID-19 restrictions on the regional mean DTR, five other parameters (annual snowfall quantities, gross domestic product per capita, population density, latitude (northern/southern), and longitude (coastal/inner)) were also examined against changes in DTR from 2015 to 2020. This analysis pointed to the environmental and industrial factors being more strongly correlated with short-term climate changes than societal factors and geographical location.

1. Introduction

COVID-19 disease occurs from the strain of the coronavirus SARS-CoV-2, which stands for severe acute respiratory syndrome coronavirus 2. General coronaviruses have been studied for many years to understand their impact on society and the environment, as they have the potential to turn into a pandemic at any time (El-Kafrawy et al., 2019) [1]. In January 2020, COVID-19 was declared as a public health emergency and, after two months, in March it was declared as a pandemic by the World Health Organization (WHO). Since then, countries have been taking effective measures for controlling the spread of this virus. With its rapid spreading, extensive spatial coverage, and complicated characteristics, this global disaster will be remembered as a unique event in history. If this pandemic is compared with the other large epidemics that took place in the last several decades, those prior pandemics appear insignificant compared to the COVID-19 pandemic in terms of the area of the world affected, the societal effects, and the health and economic consequences (Ali et al., 2020) [2].
The measures that most countries took against this pandemic include social distancing, lockdowns, working from home, and limiting economic activities. Reportedly, these measures have brought about positive and negative changes in the environment of urban areas of different countries. For example, air and water quality of some urban areas have improved, but on the contrary, shoreline pollution has increased due to the disposal of personal protective equipment and other sanitary products (Cheval et al., 2020) [3]. It is very evident that different aspects of the environment have been impacted by this long-lasting pandemic as socio-ecological systems have been challenged by it.
Emissions caused by human activity have greatly impacted air quality and the climate. Different industrial processes and road transportation sectors account for the emission of huge quantities of particulate matter, NOx, SOx, volatile organic compounds, and greenhouse gases (GHG). Countries throughout the world imposed restrictions on travel and business to prevent the spread of COVID-19 throughout 2020 and beyond. As COVID-19 reduced economic activity during those times, it was predicted that there could have been a positive impact on the air quality and a reduction in GHG emissions. Venter et al. (2020) [4] studied data from more than ten thousand monitoring stations and satellites around the world and found out that there was an improved air quality during the lockdown periods compared with the same period in the previous year. Several other studies have been able to conclude that the lockdowns enforced in response to COVID-19 have contributed to a significant improvement in air quality (Berman and Ebisu, 2020; Singh et al. 2020; Higham et al. 2021) [5,6,7]. A recent study by Aboagye et al. (2021) [8], however, concluded that the air quality improvement benefits due to the lockdowns imposed in response to COVID-19 were a temporal phenomenon. In terms of GHG emissions, transport accounts for 26% of CO2 emissions globally (Chapman, 2007) [9], and the number of flights were reduced by more than 50% in 2020 because of COVID-19 (Cheval et al., 2020) [3]. Reduction in mobility and long-range travel was thus one of the factors contributing to reduced GHG emissions in the first half of 2020 (Le Quéré et al., 2020) [10].
It can be concluded that COVID-19′s impact on air quality and pollution, in turn, impacts the DTR; the question is whether this impact is discernable given the other background climatic forcings, and whether it is as discernable over large land masses (continental) versus localized effects (e.g., urban). Observations from Cheng et al. (2020) [11] in the Lanzhou city in China showed that increased air pollution results in a decreased DTR. This study, which looked at the reduction of aerosols during the pandemic, found that temperature increased during the daytime and decreased during the nighttime, thus resulting in a greater DTR (Cheng et al., 2020) [11]. Similarly, another study looked at the impact of aerosol levels on the climate. The study from Hu et al. (2021) [12] specifically looked at the lower aerosol presence during the COVID-19 pandemic and concluded that this resulted in a greater DTR during months with strict lockdowns when compared to the preceding 20-year month-on-month DTR values. This connects to our hypothesis that global lockdowns imposed in response to the COVID-19 pandemic increase the DTR through decreased air pollution caused by a reduction in economic activity and travel.
Notable changes in the climate can take place over a relatively short period of time (compared to the geologic time scale) because of human activity (Karl and Trenberth, 2003) [13]. On the scale of decades to centuries, we can now confidently link the emission of GHG because of human activity with the observed increasing temperature, which we term global warming (IPCC, 2021) [14]. In this study, our main objective is to study annual data of diurnal temperature range (DTR). DTR is the measure of the difference between the maximum temperature (Tmax) and the minimum temperature (Tmin) of a day. A question was raised whether COVID-19 could have an influence on climate change and the DTR. Therefore, to evaluate the popularity and acceptance of the DTR approach in climate studies, and to inspect the potential readership of the present work, we performed a bibliometric analysis using data collected from Web of Science that yielded Figure 1, which illustrates the number of publications regarding DTR over the past 30 years. It is evident that the number of publications about DTR is rising every year. This confirms that DTR is a popular topic and a valid research approach that is useful and worthwhile to consider determining whether COVID-19 had an impact on climate change and CO2 levels or not. Having confirmed this, we crafted our research hypothesis that the DTR can be a possible parameter to showcase the impact of COVID-19 on the environment. To this end, our goal was to collect DTR data from the pandemic year 2020 and compare it with the previous several years, with the aim of inspiring further research on the impacts of the pandemic on the Earth’s climate at regional, continental, and global scales using the DTR approach and more complex climate models.
This study is inspired from the study of Travis et al. (2002) [15] who studied whether contrails from aircrafts impacted the DTR. That study arose when a terrorist attack took place in the United States and there was a three-day ban on all flights. They collected temperature data from weather stations across the United States and compared the data of the 3-day grounding period with data from the period from 1971 to 2000. Travis et al. found out that average DTR was anomalously higher in the 3-day period of aircraft grounding. The mechanism used to explain this finding was that the absence of contrails in the sky changed the atmospheric energy balance; more sunlight could reach the ground during the day (thus increasing the Tmax) and more infrared heat could return to space during the night (thus decreasing the Tmin). Together, these affects were posed to have increased the DTR on days without contrails.
Following the Travis et al. (2002) [15] study, various other studies were published attempting to verify the validity of the result of Travis et al. (2002). Studies from Wijngaarden (2012) [16] and Sandhu and Baldini (2018) [17] investigated the same hypothesis, i.e., that contrails impact the DTR; however, by using higher quality data and considering other factors, both concluded that weather system migration was the cause of the increase in DTR during the grounding period. Hong et al. (2008) [18] also studied the validity of the hypothesis proposed by Travis et al. (2002) [15] and found that the impact of DTR during the grounding period could be attributed to low-altitude clouds, humidity, and wind. A study from Dietmuller et al. (2012) [19] which also investigated the validity of the hypothesis of Travis et al. (2002) [15], concluded that the 3-day anomaly during the grounding period can happen due to natural fluctuations, and stated low-level clouds as the reason for the decreased DTR. One study that agreed with the findings of Travis et al. (2002) [15] looked at contrail outbreaks lowering DTR values when compared to a clear-sky situation. This study concluded that long-lasting jet contrails should be taken in consideration when weather forecasting is done for a short-term period. Although there are several studies that disprove the findings of Travis et al. (2002) [15], it is evident that DTR is a valuable and valid parameter to measure. In addition, these studies bring into question what timeframe should be used when using DTR as a parameter, and whether the timeframe used in the Travis et al. (2002) [15] study was too short to see the full picture and whether a timeline that is closer to a year is more reliable.
Studies performed all over the world have concluded that factors such as aerosols, precipitation, water bodies, sunlight hours, cloud cover, local soil and vegetation conditions, and land use may all impact the DTR (Cheng et al., 2020; Gallo et al., 1996; Roget and Khan 2018) [11,20,21]. This explains why there is spatial and temporal variability in the DTR. For example, a study in Spain from 1950 to 2011 found that the DTR trends decrease on the Mediterranean coast, versus the small changes in northern, Atlantic, and rural areas (Bilbao et al., 2019) [22]. These changes could be attributed to relative humidity and precipitation, with which the DTR values were negatively correlated. In addition, the study found that anthropogenic factors such as increased aerosols in urban stations contributed to a decrease in the DTR (Bilbao et al., 2019) [22]. A study by Liu et al. (2016) [23] noted the impact of aerosols on the DTR in China by comparing observations from big cities with those in nearby mountain regions, and found that aerosols decrease the DTR by lowering the Tmax. Another study looked at the climate in the Aral Sea region (Roget and Khan, 2018) [21] and documented how natural variability can impact the DTR. The results showed that water bodies can have a great impact on DTR dynamics; greater differences between annual DTR’s were observed in stations closest to the sea shoreline. Another natural cause of DTR variability was studied in Iran by looking at the impact of sunshine duration and total cloud cover, showing that from the 1960s into the 1980s, widespread dimming as well as a decrease in the DTR was recorded (Rahimzadeh et al., 2015) [24]. This study also inquired into the potential impact of aerosols on sunshine variations, showing that many of these factors are interconnected.
Cloud cover and its impact on the DTR has been more extensively researched, with Lauritsen and Rogers (2012) [25] finding that it accounts for up to 63.2% of DTR variance. Looking more specifically at DTR changes with temporal variation, a study by Mall et al. (2020) [26] in India from 1991 to 2016 found that the winter season had a decreasing DTR trend, whereas the monsoon and pre-monsoon seasons correlated to an increasing DTR trend. Several more studies have linked DTR changes to climatic changes using simulations/modeling (Lewis and Karoly, 2013 [27]; Selman and Misra, 2015 [28]; Liu et al. 2021 [29]), also attributing natural factors such as precipitation and cloud cover as driving forces. However, the work of Hu et al. (2021) [12], examining precipitation, wind speed, and dewpoint temperature as possible influencing factors on the greater DTR from February to June in 2020 (compared to 2000–2019) in China, found that the national mean values of these climatic parameters followed the historical range, suggesting that climatological variations do not explain, at least as the main driver, the DTR uptick during the early months of the COVID-19 pandemic.

Objectives

In this study, to investigate the impact of the COVID-19 pandemic on DTR changes, we have studied weather data from the contiguous United States of America (USA). These data were collected from several weather stations in 48 states and the District of Columbia (DC). The DTR was calculated daily by determining the difference between the maximum temperature during the day and the minimum temperature during the night. We have compared the DTR data from the year 2020 with the DTR data from the previous 5 years (2015–2019). The data collected were split into three alternative ways to confirm and magnify the effects on the DTR during the COVID-19 pandemic. The data were classified at the state level according to mean annual snowfall amount, GDP (gross domestic product) per capita, and population density. Annual snowfall amount was selected as a classification factor as it is linked to other environmental factors such as temperature, humidity, wind speed, cloud cover, and hours of sunlight, and to geographical factors such as terrain geography and land elevation (Zhang et al., 2019) [30]. Snowfall amount also has long-term links to climate change, and thus acts as both an environmental and climate indicator, especially at higher latitudes and altitudes (Zhang et al., 2020) [31]. The hypothesis is that annual snowfall amount, as an environmental proxy for other climate and geographical factors associated with this state mean parameter, will impact the DTR. The motivation for splitting the data based on GDP per capita is to assess how wealth, which influences anthropogenic and economic behavior, may impact the DTR. The hypothesis for the impact of GDP per capita is that wealthier states may have been affected more greatly by the pandemic due to more restrictions on economic activities. Lastly, data were split based on population density. Population density is known to impact certain environmental factors such as air pollution (Chen et al., 2020) [32]. The hypothesis here is that more densely populated states may have seen a bigger impact from the pandemic as with more COVID-19 transmission and disease, longer lockdowns may have more greatly impacted the DTR.

2. Methodology

2.1. Data Collection

Temperature data were collected from the National Climatic Data Center (NCDC) (NCDC, 2021) [33]. It is considered as the world’s largest archive of data regarding weather. For this study, data were collected from the years of 2015 to 2020. Data were taken from the 48 states of the contiguous USA and DC. For 42 of these states, 4 stations were analyzed per state. For 6 of these states and DC, 3 stations were analyzed from each. In total, data from 189 stations across the USA were collected (Supplementary Materials-Part II illustrates the location of each station on a map). The approaches used for collecting and ordering data from the NCDC website are outlined in the Supplementary Material. Table S1 in the Supplementary Material illustrates a summary of the data collected. Data points were excluded if either one or both of Tmax or Tmin were missing.

2.2. Data Processing

Four different approaches were considered for calculating DTR. The first approach calculated DTR by simply subtracting the minimum temperature from the maximum temperature of each day (i.e., both temperature readings coming from the same 24-h period between 0:00 and 23:59). The second approach found the DTR by subtracting the previous day’s minimum temperature from the maximum temperature of the following day (e.g., the minimum temperature on a Sunday and the maximum temperature on a Monday). The third approach subtracted the next day’s minimum temperature from the maximum temperature of the previous day (e.g., the minimum temperature on a Tuesday and the maximum temperature on a Monday). Lastly, the fourth approach found the average minimum temperature of the previous, current, and next day, and subtracted that from the current day’s maximum temperature. The purpose of considering four different approaches to calculate the daily DTR is to account for the fact that weather events, such as transient warm or cold fronts, can alter the temperature of certain locations more rapidly than others, so by calculating the DTR by multiple ways it is possible to see if the annual trends are significantly affected by underlying effects that occur on a scale of hours to days. That is, the goal is to ascertain that annual DTR trends are unaffected by how DTR is determined at each location each day.

2.3. Data Splitting

In this study a selection of weather stations were used per state to acquire data; thus, the full data set was split randomly into two sets with the intent of analyzing if the used data set is big enough to represent the overall climate in the region of study. The idea of this analysis is that if the split sets show the same annual DTR trends and similar DTR mean annual values to the full set, then the full set is likely a good representation of the overall climate in the region of study (i.e., the contiguous USA).
Data were also split based on other factors including snowfall, population, GDP per capita, latitude, and longitude. This was done so to evaluate how changes in DTR associated to the COVID-19 pandemic may have both environmental and anthropogenic reasonings. The parsing of the data in various ways was used to test different hypotheses and magnify how different factors may impact the annual mean DTR. Data on average snowfall amount in a year, GDP per capita (for 2019), and population density (for 2010) from the 48 states and DC were obtained from World Media Group (2022) [34] and the National Weather Service (2021) [35], Bureau of Economic Analysis (2019) [36], and US Census Bureau (2010) [37], respectively. The data on average latitude and longitude of each state were obtained from Google Maps. The data were split into top and bottom 24 states for each factor, and DC was added to the half that it belonged to.
Data were split based on population density as denser states have shown to have put in place stricter restrictions throughout the COVID-19 pandemic, which we hypothesized would result in greater DTR changes due to decreased economic activity and travel. Many states in the ‘top 24 + DC’ split are also the states that implemented the most restrictions (in terms of strictness and/or duration) in 2020; conversely, many states in the ‘bottom 24’ split correlate with fewer restrictions. Hallas et al. (2021) [38] reported the Stringency Index values for each state; this index takes into account several factors that include school and workplace closures, cancellation of public events, restrictions on internal and international travel, stay-at-home requirements, and public information campaigns. To exemplify how population density correlates with stringency, all eight states that did not issue any state-wide stay-at-home orders also all belonged to the ‘bottom 24’ half (Delbert, 2020) [39]. Furthermore, nine out of the ten states that had that longest stay-at-home orders belong to the ‘top 24’ half (Delbert, 2020) [39]. Most states in the ‘top 24’ half also spent more time between January 2020 and April 2021 under a Stringency Index score of >60 (out of 100), while most of those in the ‘bottom 24’ half spent more time with a score of <60 (Hallas et al., 2021) [38].
For comparison with other countries in the same period, according to Sekar et al. (2021) [40], the north part of India, where very strict COVID-19 measures were implemented, reported a sharp decline in pollution concentration; during the lockdown, there was an average 22% drop in concentration when compared to prior years. East India reported the same dramatic drop in CO content as the northern half of India. Additionally, the O3 content was outstanding, at 77% and 89% greater than it was in 2019 and 2017, respectively. The most populous city in India, Delhi, was examined by Mahato et al. (2020) [41] using the seven pollutants criteria, PM2.5, PM10, NO2, SO2, CO, O3, and NH3. In China, 2020’s overall air quality index (AQI) indicated some air pollution reduction compared to 2019 after China’s Spring Festival; it was noted that lockdown cities saw reductions in AQI and PM2.5 of 18% and 17%, respectively [40].
In addition to the three methods of parsing the data above, data were also split using the average latitude and longitude of each state. Using average latitudes, the data were split into two sets to represent the “24 most northern states” and DC and the “24 most southern states”. This allows for an investigation into whether colder climates (i.e., northern US) faced more significant changes to DTR when compared to warmer climates (i.e., southern US). Using the average longitude of each state, the data were also split into two sets to represent the “24 most coastal states” and DC and the “24 most inner states”. Rather than taking 12 states with the right-most longitude and 12-states with the left more longitude to make up the “coastal states” split, land area was also accounted for, which resulted in using the 18 right-most and 6 left-most states to make up the “coastal states”. All of the remaining states were placed in the “inner states” set.

3. Results and Discussion

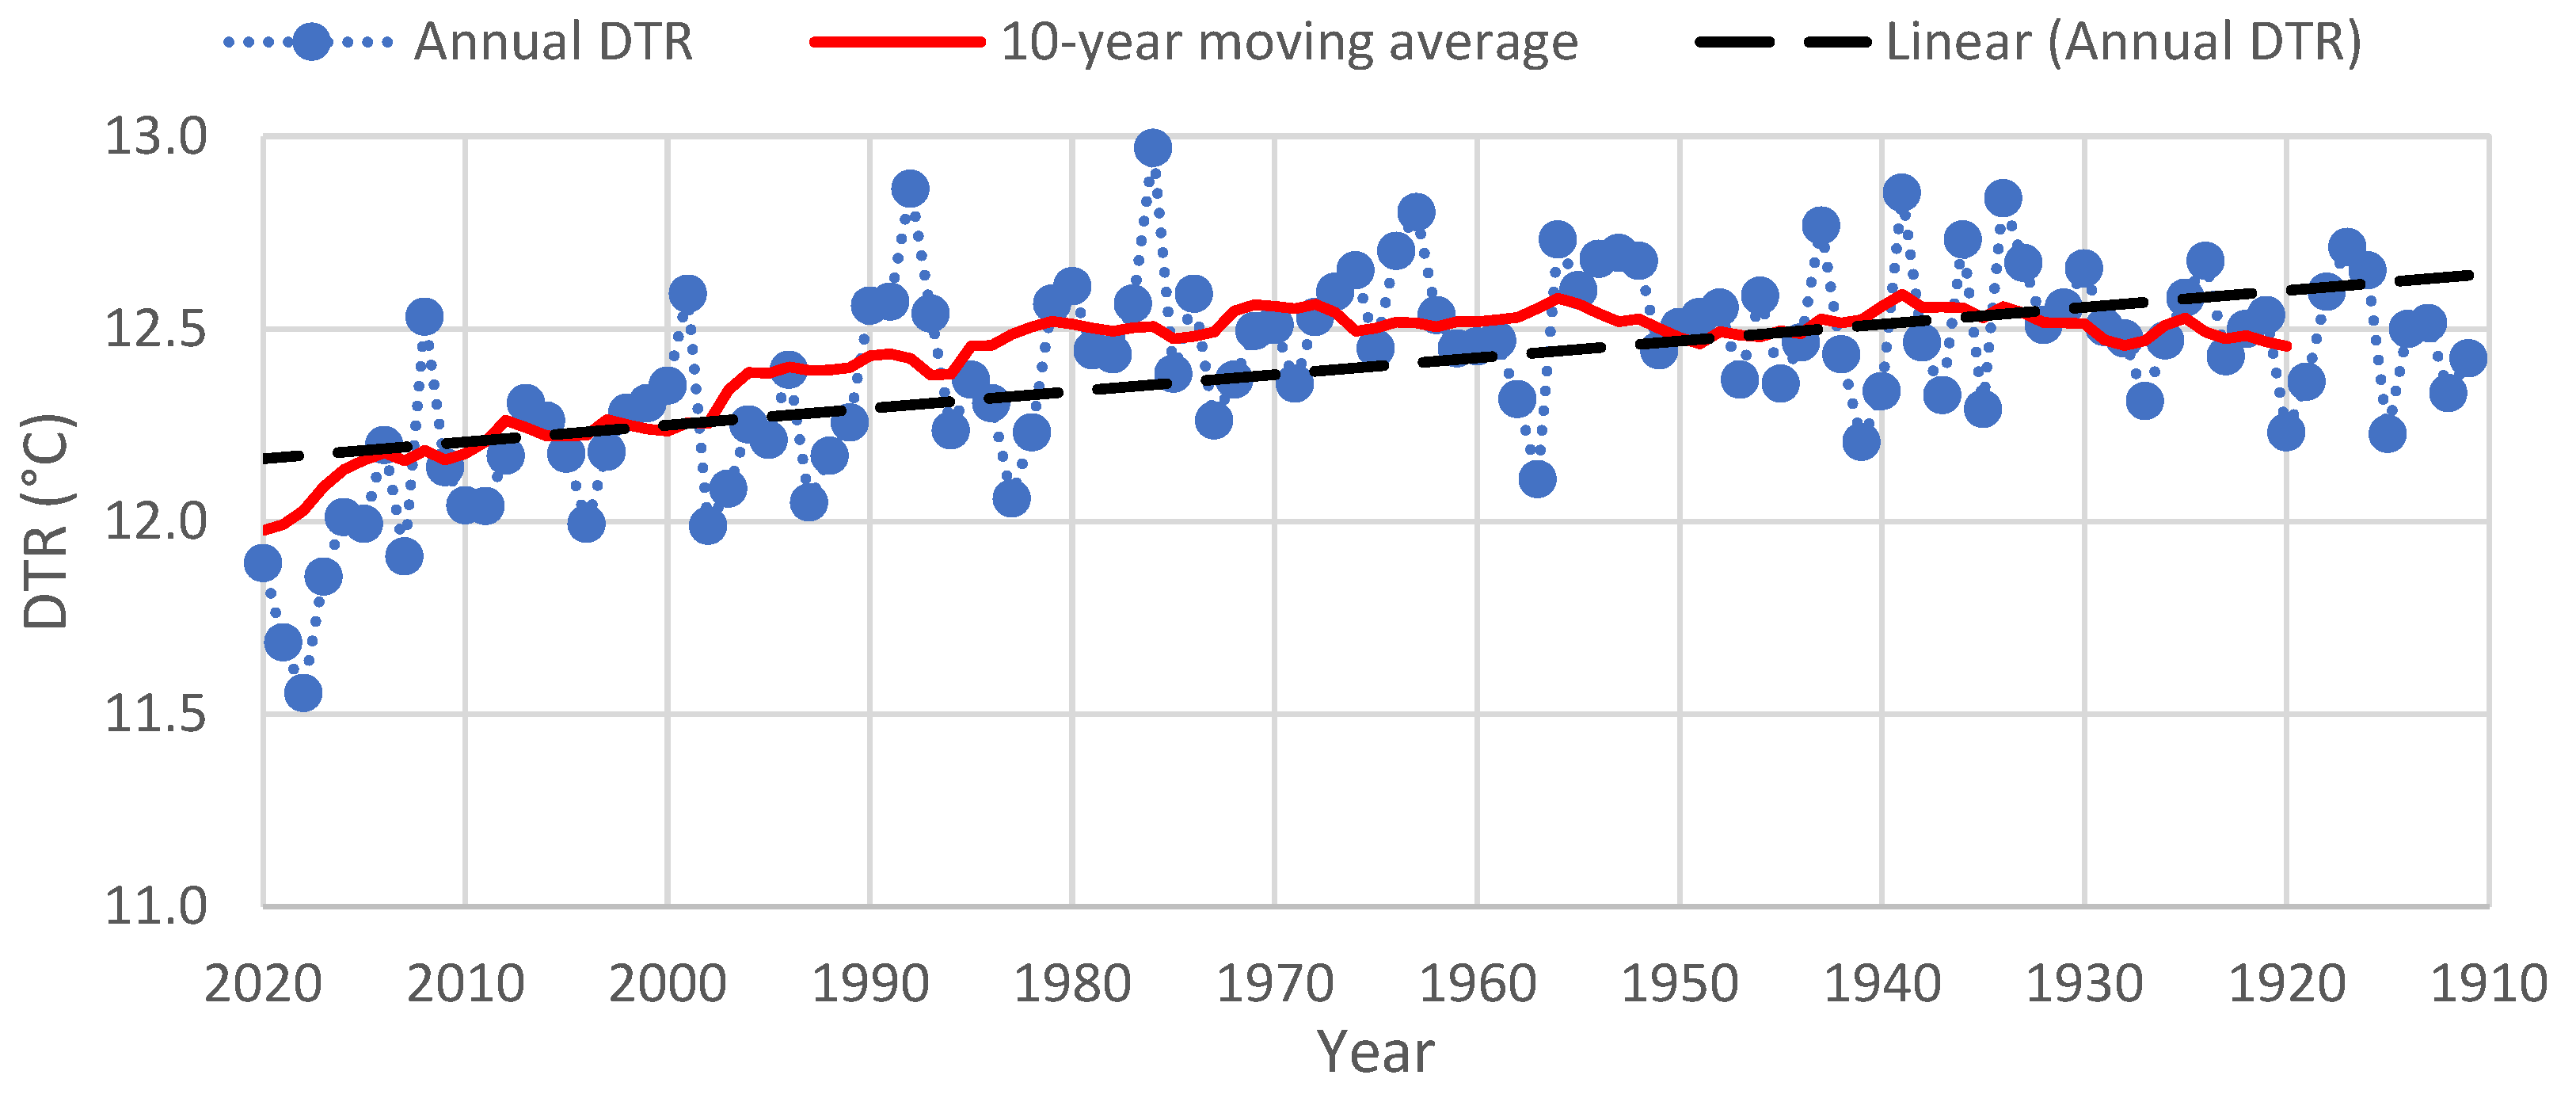
3.1. Analysis of Full Data Set

Figure 2 depicts the yearly average DTR over the 6-year span (from 2015 to 2020). The DTR was calculated using the conventional approach of Tmax minus Tmin of the same day. The highest DTR values were observed in years 2015 and 2016 with a decreasing trend thereafter, up to and including 2018. In the preceding 5 years (from 2010 to 2014), as shown in Figure 3, four of them had a higher DTR than in 2015–2016, indicating a general decadal downward trend in yearly DTR.
The trend of decreasing DTR from 2010 to 2018 may be attributable to global warming, as long-range changes in the DTR have been linked to daily minimum temperatures increasing faster than daily maximum temperatures (Roget and Khan, 2018) [21]. Notably, from 2015 to 2016 and from 2019 to 2020 are considered periods of El Niño, whereas from 2017 to 2018 is considered a period of La Niña (Figure 4). These ENSO phenomena are known to impact regional climates in the contiguous USA differently (Figure 5), so their effect on DTR is also known to be regional. That is, in regions where ENSO leads to drier or warmer weather, the DTR can rise, and conversely colder and wetter regions can see a DTR decline. This is exemplified in the study by Gilford et al. (2013) [43] in the Southeastern USA, who found that in that region higher DTR occurs more frequently in El Niño (due to drier weather) and lower DTR occurs more frequently in La Niña (due to wetter weather). Given that both El Niño and La Niña affect various parts of the contiguous USA differently, their overall impact on the annual mean average DTR is not easily predictable. Possibly either the declining DTR trend we see for 2016 to 2018, or the reversal of this trend pre-pandemic between 2018 and 2019, could be at least in part attributable to the presence or absence of ENSO events.
Furthermore, there is a cycle that occurs approximately every 11 to 12 years that is called the Schwabe solar cycle, which has been shown to have significant impact on climate extremes, DTR excursions, and artic oscillation (You et al., 2013; Walsh and Patterson, 2022a and 2022b) [46,47,48], especially at certain points of each cycle. The cycle results from an oscillation in the annual number of sunspots, which in turns affects the total solar irradiance; the resulting climatic forcing is that sunspot occurrence maxima lead to increases in temperature, and sunspot minima lead to decreases in temperature; hence, the cycle results in various links to rainfall and snowfall-related effects (Walsh and Patternson, 2022c) [49]. One of the factors that could have led to the increase in the DTR in 2020 when compared to 2019 is the Schwabe solar cycle. The 24th solar cycle ended in late 2019, when the 25th cycle started. Between 2010 and 2019, the 24th solar cycle had a maximum in sunspots between 2012 and 2014 and the number of sunspots started to decrease from 2015 to 2019, which coincides with the DTR drop from 2015 to 2018. In 2019 and 2020, however, the cycle was at what is called a solar minimum which means that the sun had the least number of sunspots. As such, it is concluded that the upticks in DTR in 2019 and to a greater extent in 2020 were independent of the solar cycle. Hence, the Schwabe solar cycle is thought to not have masked the effect of the pandemic on DTR, if such an effect were to exist as we will further discuss.
It is important to recognize that global climatic phenomena are significant underlying governing forces throughout the 6-year span of the study and may impact how we can interpret the influence of the COVID-19 pandemic on the DTR. A basic mechanistic understanding of the atmospheric factors that control the space–atmosphere–surface energy balance and thus affecting the DTR, helps to comprehend how changes in atmospheric composition can be linked to human activities, and thus to the activities halted or reduced during the period of the pandemic. This can be accomplished by inspecting the one-dimensional steady-state climate model composed of Equations (1) and (2) (Vanek and Albright, 2008) [50].
Space–Atmosphere 1-D Energy Balance: (1 − αata (1 − αs)) So⁄4 + C (TsTa) + σTs4 (1 − taIRαaIR) − 2σTa4 = 0
Atmosphere–Surface 1-D Energy Balance: ta (1 − αs) So⁄4 − C (TsTa) − σTs4 (1 − αaIR) + σTa4 = 0
where α is the albedo; σ is the Stefan–Boltzman constant; t is the transmissivity; T is the temperature; S is the solar flux; C is the convective heat transfer coefficient; the subscripts s and a stand for surface and atmosphere, respectively; and the superscript IR stands for longwave infrared radiation (parameters without subscript relate to shortwave ultraviolet radiation).
The effect of pollutants on the energy balance, and thus on the surface temperature (Ts) and the DTR, is accounted for changes in the atmosphere’s transmissivity and albedo; gaseous pollutants absorb certain wavelengths of electromagnetic radiation (i.e., the GHG effect), thus altering ta and taIR, and particulate pollutants absorb or reflect electromagnetic radiation (similar to cloud cover effect), thus altering αa and αaIR (Twomey et al., 1984; Jia et al., 2020) [51,52]. Furthermore, several studies have concluded that DTR can be used as an index of climate change as decreases in the DTR have been observed over the twentieth century as a result of global warming (Braganza et al., 2004; Sun et al., 2019; Qu et al., 2014) [42,53,54]. This is illustrated in Figure 3, where data from 1911 to 2020 show that the 10-year moving average has been moving downwards since 1971, and even more so since 1995. There is the presence of slight oscillations in the downward trend, which is indicative that the DTR is susceptible to change when a smaller forcing factor, such as the pandemic, overcomes the overall climate trend.
Fitting with the hypothesis, the DTR spikes in 2020. The increased DTR in 2020 may have COVID-19 related reasons, such as decreased air and land travel and overall economic shutdowns. An important aspect to note is that it is possible that the effect of the COVID-19 pandemic on the DTR may not happen immediately, that is, within the calendar year of 2020, since changes in climate can lag other changes in the environment (Ricke and Caldeira, 2014) [55]. The effect of the pandemic may be shown in later years or be spread over more than a single year.
Error bars depicting the standard deviation of the DTR for each year are added in Figure 2. The aim of this is the show how the upper and lower limits of the error bars follow the same trends as the mean. That is, an overall decreasing trend from 2016 to 2018, and a spike in DTR in 2020. Additionally, the standard deviations give a sense of how variable the DTR values are within a year, which makes sense, given how geographically large the contiguous USA is.
Figure 6 depicts the monthly mean DTR for each of the six years. There is an observable trend that the DTR is higher during summer months and lower during winter months. This trend may be attributed to environmental factors such as sunlight hours and cloud cover, which are factors known to impact DTR (Lauritsen and Rogers, 2012) [25]. These results are fitting with other studies that found the maxima DTR were observed in spring and summer months (Roget and Khan, 2018) [21]. There is a large degree of variability from year to year for any given month, complicating the ability to reach very precise conclusions.
Yet, with respect to the pandemic, it is notable from Figure 6 that the DTR for nine months of 2020 were greater than the same months in 2019; these were February, April, May, June, August, October, November, and December. Furthermore, of these nine months, the largest DTR differences between 2019 and 2020 occurred in February, April, May, November, and December. April and May coincide with the first wave of COVID-19 cases in the USA, and November and December coincide with the much larger third wave of cases that year (Our World in Data, 2021) [56], as illustrated in Figure 7. The various states instituted far more restrictions during these two waves than during the second summer wave that peaked in July, which may explain their magnified DTR difference. November does coincide with the month of most solar flare activity in 2020, as part of the commencement of the Solar Cycle 25 (SpaceWeatherLive, 2020) [57]; hence, that could also partly explain the DTR uptick that month.
In the study by Hu et al. (2021) [12], on a national level in China, the monthly mean DTRs for the months of February, March, April, May, and June of 2020 are all much higher than the values for the years from 2001 to 2019 under the status quo. Considering in that study a 21st century anomaly, DTRs in all five of these months of the COVID-19 pandemic are more than three standard deviations above the climatological mean DTR. For instance, the DTR in April 2020 was 13.74 °C, which is 1.28 °C higher than the maximum value recorded in the past and 2.01 °C higher than the month’s climatological norm (12.46 °C). In contrast, with the exception of December 2019, monthly mean DTRs in the seven months before the COVID-19 pandemic often lay within the climatological range (Hu et al., 2021) [12]. DTRs in the Beijing and Chengdu regions were, during the five months of the shutdown, from two to four standard deviations or more above the climatological mean. DTRs in the Wuhan and Shanghai regions, in contrast, showed a clear increase of two to three standard deviations from February to May of 2020, followed by a significant decline compared to the prior level in June. The easing of limitations when the pandemic eventually got under control was suggested by Hu et al. (2021) [12] to possibly be the cause.
Figure 8 depicts the yearly average DTR from a selection of 14 out of the 189 stations. The graphs for the remaining stations are shown in Figures S1–S12 in the Supplementary Materials. These figures show that spatially, there are clear variabilities in annual mean DTR values across the contiguous USA. For example, in Figure S3, the Aztec Ruins National Monument station in New Mexico has yearly DTR values that are about twice the magnitude as those for the Barrington 3 SW station in Illinois, shown in Figure S1. These station-by-station data do not provide meaningful trends related to the pandemic. For various stations the year 2020 saw a spike in DTR, but for others did not. Therefore, others mean of splitting the full data set according to environmental and anthropogenic factors are further investigated in Section 3.3.

3.2. Analysis of Different DTR Calculation Approaches and Randomly Split Data for Validity Check

Table 1 shows that the two randomly split sets of each year are very similar. This is shown by the column ‘% of the difference compared to yearly average’, which statistically shows there is no meaningful difference between the two sets (i.e., that the uncertainty of the annual DTR values of the full set lies in the second decimal place and is less than ±0.05 °C). This analysis is evidence that the data set utilized, consisting of 189 stations across the contiguous USA, is large enough to represent the true mean DTR of the geographical region with acceptable uncertainty. The standard deviation of the full set and the standard deviation of the split sets are very similar, again confirming that the selected stations represent well the climatic conditions across all states and DC. It is also noted that the percent difference between sets is smaller than the percent deviation of the full set, meaning the variability of the six years is larger than the variability between the two split sets.
Figure 9 is a visual representation of the difference between the two randomly split groups. Both data sets follow a very similar trend compared to Figure 2 over the 6-year span, with similar values for each set in each year. Error bars depicting the standard deviation of each set for each year were also added to Figure 9. Similar to Figure 2, the standard deviation’s upper and lower limits follow the same trends as the mean for each year.
Table 2 demonstrates the annual DTR values calculated by four different approaches, including the conventional method, as described in Section 2.2. The differences between the various DTR values calculated for each year are small, in the range of 0.013 to 0.036 °C, which are smaller changes than the aforementioned estimated level of significance of 0.05 °C. In fact, for the average of all six years, the largest difference between the conventional and alternative approaches is 0.015 °C. This analysis does not lead to a conclusive indication of which DTR method is most accurate (the conventional method, which fits the definition of ‘diurnal’, is sound), but it does serve the purpose of providing additional confidence that the data set trends are robust and differences between years are of the same order of magnitude regardless of how DTR is defined.

3.3. Analysis of Environmental and Anthropogenic Factors

3.3.1. Annual Snowfall Amount

Figure 10a depicts the annual mean average DTR for the 6-year span split into two groups depending on the average annual snowfall amount recorded in each state and DC. The ‘Top 24’ set comprises the 24 states with the most snowfall (for the year of the snowfall record utilized), while conversely the ‘Bottom 24’ set are the 24 states (plus DC) that recorded the least snowfall; Figure 10b maps this classification. Figure 10a shows a positive correlation between snowfall and DTR. This is contrary to what was expected, as in the literature a negatively correlated precipitation with DTR (Bilbao et al., 2019) [22] was found. Furthermore, environmental factors such as temperature and cloud cover are associated with snow and have been shown to reduce DTR (Lauritsen and Rogers, 2012 [25]; Rahimzadeh et al., 2015 [24]) much the same as the contrail effect suggested by Travis et al. (2002) [15]. The opposite trend showed in Figure 10a may be explained by looking at the individual states within each set. For example, Illinois and Indiana, two states in the ‘bottom 24’ half, have low DTRs that brought down the average for the split. Conversely, Colorado and New Mexico, two states in the ‘top 24’ half, have DTRs much higher than the average, which brought up the overall average for this split. Therefore, individual states may have skewed the overall average, changing the trends that may have been expected otherwise.

3.3.2. GDP per Capita

According to Figure 10c, the annual mean average DTR is consistently higher in the ‘bottom 24’ states for GDP per capita, and lower in the ‘top 24’ states and DC. This trend correlates with the findings of studies that link economic activity and resulting air emissions with lower DTR. Additionally, there is a more notable increase of +0.36 °C in the DTR in the ‘top 24’ states from 2019 to 2020, versus a far smaller increase of +0.04 °C in the other group. Wealthier states were likely more affected by the COVID-19 pandemic as a result of more impactful and widespread industrial activity and business shutdowns, more airplanes grounded, and overall, more economic closures. Anecdotally, from Figure 10d, it can also be commented that a larger number of states in the ‘top 24’ group had Democratic party-controlled legislature in 2020, which could be a driving factor in the implementation of more strict pandemic restrictions during 2020; though there are examples, if less frequent, of Republican party-controlled state governments having been stringent with pandemic restrictions. All these factors would contribute to decreased pollution during several months of 2020, and as a result, a rise in the annual mean DTR in those regions.

3.3.3. Population Density

Similar to Figure 10a,c, the population density data split shown in Figure 10e shows significant differences in the annual mean DTR of the ‘top 24’ versus the ‘bottom 24’ (here DC in the ‘top’ group). The group with the most densely populated states has lower DTR values compared to those of the least densely populated states. As population density, economic activity, and air pollution are strongly correlated, this trend is in agreement. The hypothesis, however, was that more densely populated states would observe a greater impact from the pandemic due to increased disease transmission causing longer lockdowns. However, this does not hold true when solely looking at DTR; the ‘top 24’ states and DC did not see a rise in the DTR in year 2020 versus 2019 (–0.14 °C), while the ‘bottom 24’ group experienced a significant rise (+0.53 °C).
To identify correlations among the factors used to split the DTR data, four parameters were additionally calculated: (i) ΔDTR2020–2019 (the difference between the DTR of 2020 and 2019 of each split set); (ii) ΔDTR2020_mean-2020 (the difference between the mean DTR of 2020, 11.88 °C, and the 2020 DTR of each split set); (iii) ΔDTRtop-bottom (the absolute value of the difference between the DTR’s of each split set in each year); and (iv) 5-year (2015–2020) and 4-year (2015–2019) averages of ΔDTRtop-bottom values for each factor. These values are tabulated in Table 3 and shown in Figure 11. Most notably from Figure 11 the factor that splits the data into the most different sets of states is the population density, while the two sets of states based on snowfall amount have the smallest DTR differences. However, from Table 3 it is concluded that snowfall amount and GDP per capita were the two factors that managed to concentrate the DTR uptick states into one set, leaving the other set with nearly constant DTR from 2019 to 2020.
The previous analyses suggest that the environmental and industrial factors, correlated with the annual snowfall amounts and GDP per capita data, are more strongly correlated with short-term climate changes, as indicated by the annual mean DTR, than with societal factors such as population density. It is also possible that the population density data split resulted in more concentrated regions being part of one group than the other. For instance, Figure 10f has groups more evenly split between coastal and inlands regions than Figure 10b,d. Cloud cover and pollution dispersion mechanisms in coastal regions of the USA are expectedly more complex (e.g., affected by oceanic currents, ocean moisture, etc.) than those in the flatter Midwest regions of the USA with fewer major water bodies; hence, the anthropogenic effect on DTR may have been magnified in the latter. Global warming is another important factor to consider. The states in the ‘bottom 24’ group in Figure 10f are also those that have experienced the greatest maximum temperature anomalies in 2020 (versus the 20th century average), as shown in Figure 12. Hence, greater Tmax contributes to a greater DTR in those regions.

3.3.4. Latitude

Figure 10h shows how the US was split into northern and southern regions based on average latitude. Figure 10g illustrates the average DTR for each set over the past 6 years showing that southern states consistently have a greater average DTR compared to the northern states. This is consistent with various other studies that have shown colder weather, which is seen in northern states, is associated with a lower DTR (Mall et al., 2020 [26]; Qu et al., 2014 [42]). Looking specifically at 2020, the northern states showed an increase in DTR from 2019, whereas the southern states’ DTR stayed fairly consistent from 2019 to 2020. This may indicate that northern and typically colder states, faced changes during the pandemic that more greatly impacted the DTR. This trend is similar to the trend of annual snowfall amount, where there is a substantial increase in DTR from 2019 to 2020 in the ‘top 24’ set which may be attributed to the same phenomena. That is, colder states, typically northern states, rely on coal-based heating systems and with the pandemic shutting down businesses and institutions there was a decreased need for heating and coal (He et al., 2020) [60]. Thus, these states faced greater environmental changes that led to an increased DTR. As these results are more consistent with conclusions found in the literature, it may be splitting the data based on latitude is preferable over splitting via annual snowfall amount, which showed the opposite trend. This may be attributed to the fact that annual snowfall amount is less correlated to geographical location.

3.3.5. Longitude

Using the average longitude of each state and DC, the US could be split into two sets, more coastal states and more inner states, to evaluate the impact of large bodies of water on DTR. Figure 10i shows that the inner states consistently have a higher DTR. This is consistent with studies on the maritime influence on DTR that shows coastal regions report the lowest DTR, and the DTR increases with distance from the ocean (Scheitlin, 2013) [61].
Although there is a consistent difference between the average DTR of coastal states versus inner states, there is no significant increase in DTR in the year 2020. This suggests that the geographic location of the state bears little impact on how COVID-19 affects the DTR, and rather environmental and anthropogenic factors have a greater influence.

3.4. Limitations of This DTR Versus Pandemic Study

Although this analysis produces novel and insightful results on the impact of restrictions put in place in response to COVID-19 on regional and continental climates, it is worthwhile acknowledging the limitations and uncertainties that exist and that can be topics for further study. Firstly, only one climatic factor (temperature), and one calculated value (DTR), were used in this analysis, whereas climate and its changes of interest also encompass other factors such as the length of dry or wet seasons, the frequency of floods, hurricanes and tornados, the rate of glacier melt, among many other effects of environmental and societal concern. It is not possible to use DTR alone to understand if the pandemic restrictions had other climatic and environmental impacts, and many studies on various factors are certain to be performed for years to come. Another important limitation of this study is that the temperature data were obtained from weather station data, which is limited to a few locations per state. There is likely remote sensing climate data (Tomlinson et al., 2011) [62] that can be used for the temporal period of interest to investigate more thoroughly if the DTR effects observed from station data matches what real data also recorded. Temperature data collected from the weather stations may have an uncertainty associated with them; however, with the large volume of data collected, these small uncertainties will be insignificant in this analysis. Finally, as discussed earlier, with climate change accelerating, the deconvolution of what changes in DTR are due to ongoing natural and anthropogenic climate change versus other forcing effects becomes more important; thus, data analysis and modeling techniques to enable this discernment accurately are needed.

4. Conclusions

After the emergence of COVID-19, there were significant lockdowns across the world leading to economic closures, limited social gatherings, and decreased travel. Limiting certain economic sectors, such as transport and other heavy industries, can directly affect the environment. Though COVID-19 has had vast negative impacts on the societal and economic lives of people, it has led to some environmental improvement, if only temporary, of scientific interest.
Limited economic and other activities due to COVID-19 in the first six to nine months of 2020 created an opportunity to analyze the DTR during this period, much as Travis et al. (2002) [15] did to study the role of contrails on DTR. In the present study, data from 189 weather stations from 48 states and DC of the contiguous USA were considered. Data from 2020 were primarily compared with identical data from the preceding ten years (with a focus on the preceding five years) and to historical trends since 1911. A data splitting method was employed to show that the data set was large and diverse enough to represent the geographical area of study, seeing as yearly trends of the split sets were in accordance with those of the full set. The results show that there was a noticeable increase in DTR in 2020 compared to the two previous years, reversing a trend of a reducing DTR that started in 2016, linked, at least in part, to the influence of global warming, to the occurrence of La Niña, and to the latter stages of the 24th Schwabe solar cycle with declining solar radio flux. The results of the present study are supportive, even if not conclusive, of the hypothesis that lockdowns and decreased travel increased the DTR as a result of reduced air emissions and thus a reduction in the effect of particulates and aerosols on the atmospheric heat balance. Similar conclusions, with respect to the effect of the pandemic on air emissions in other regions and contexts, have been recently reached by works such as those of Mahato et al. (2020) [41], Aboagye et al. (2021) [8], Hu et al. (2021) [12], and Sekar et al. (2021) [40]. Most notably, Hu et al. [12] found that monthly DTR values between February and June 2020 were greater than the climatological mean DTR by a statistically significant measure. The present work is the first to investigate the link of the pandemic restrictions and slowdown to the DTR in the contiguous USA.
It is known that DTR as a climate indicator can be affected by underlying factors other than anthropogenic impacts (such as the pandemic), most notably environmental (e.g., El Niño, La Niña, and the Schwabe solar cycle) and geographical factors. To identify if 2020 is a particularly notable year in terms of its annual mean average DTR, other methods of data splitting (to generate two data sets for comparison) were used based on annual snowfall amounts, GDP per capita, and population density per state (and DC). This allowed for the opportunity to investigate if the pandemic’s effect on DTR could be magnified in certain regions of the contiguous USA according to their environmental, industrial, or societal classification. Most notably, by looking at the DTR changes from 2019 to 2020, for both annual snowfall amounts and GDP per capita, the ‘bottom 24’ groupings saw much smaller DTR changes than the ‘top 24’ groupings. The reason for the increase in DTR in colder climates in 2020 is theorized to be linked to the pandemic-related economic closures that lowered the need for coal-based heating systems, thus resulting in reduced air emissions. The increase in DTR in wealthier states in 2020 may also be attributed to greater pandemic-related economy and industry shutdowns, leading to less air pollutants and thus a rise in the DTR. Population density was not found to yield meaningful trends due to a strong link of this classification to geographical factors (coastal versus inland location of states).
Nonetheless, considering historical trends since 1911, caution should be exercised when making causal conclusions related to year-on-year changes in the mean DTR over specific areas. The DTR change detected in 2020 is within past mean DTR variations that occurred over approx. 12-year cycles that match the Schwabe solar cycles. Climatic effects such as El Niño, La Niña, and the prolonged trend of global warming reduce the confidence in the perceived effect of the pandemic. A conclusive result can only be obtained with complex climate modeling capable of accounting for various short- and long-order natural and anthropogenic forcings that can drive the mean DTR up or down in any given year.
Notwithstanding its limitations, this study serves to exemplify that the DTR, despite being a simple climate indicator, has a role to play as a tool in sensing major anthropogenic impacts, such as in the case of the COVID-19 pandemic, even if more comprehensive climate modeling is needed to confirm its indications. This study complements others that have verified how the pandemic has had widespread impacts on human society well beyond the healthcare sector and human lives. The pandemic has had environmental impacts, even if only temporary, and the study of these phenomena can help to advance our understanding of the climate, in an age where climate change mitigation will be a major societal challenge for decades to come.

Supplementary Materials

The following supporting information can be downloaded at: https://www.mdpi.com/article/10.3390/atmos13122031/s1, Figures S1 to S12: Station-wise yearly average DTR for the years 2015–2020; Table S1: DTR data points in each year; Supplementary Materials-Part II: Locations of the 189 stations (points are approximate, based on the city or county of the station).

Author Contributions

Conceptualization, R.M.S.; methodology, W.A., T.A.-H. and R.M.S.; formal analysis, W.A. and L.M.H.; writing—original draft preparation, W.A. and L.M.H.; writing—review and editing, T.A.-H. and R.M.S.; supervision, R.M.S. All authors have read and agreed to the published version of the manuscript.

Funding

L.M.H. was supported by an NSERC USRA (Undergraduate Student Research Award) fellowship, and T.A.-H. was supported by a University of Guelph URA (Undergraduate Research Assistantship) fellowship.

Data Availability Statement

The data that support the findings of this study are openly available in Zenodo at https://doi.org/10.5281/zenodo.5542724 (accessed on 20 November 2022).

Conflicts of Interest

There are no conflict of interest.

References

  1. El-Kafrawy, S.A.; Corman, V.M.; Tolah, A.M.; Al Masaudi, S.B.; Hassan, A.M.; Müller, M.A.; Bleicker, T.; Harakeh, S.M.; Alzahrani, A.A.; Alsaaidi, G.A. Enzootic patterns of Middle East respiratory syndrome coronavirus in imported African and local Arabian dromedary camels: A prospective genomic study. Lancet Planet. Health 2019, 3, e521–e528. [Google Scholar] [CrossRef] [PubMed] [Green Version]
  2. Ali, I.; Alharbi, O.M. COVID-19: Disease, management, treatment, and social impact. Sci. Total Environ. 2020, 728, 138861. [Google Scholar] [CrossRef]
  3. Cheval, S.; Adamescu, C.M.; Georgiadis, T.; Herrnegger, M.; Piticar, A.; Legates, D.R. Observed and Potential Impacts of the COVID-19 Pandemic on the Environment. Int. J. Environ. Res. Public Health 2020, 17, 4140. [Google Scholar] [CrossRef] [PubMed]
  4. Venter, Z.S.; Aunan, K.; Chowdhury, S.; Lelieveld, J. COVID-19 lockdowns cause global air pollution declines. Proc. Natl. Acad. Sci. USA 2020, 117, 18984–18990. [Google Scholar] [CrossRef]
  5. Berman, J.D.; Ebisu, K. Changes in U.S. air pollution during the COVID-19 pandemic. Sci. Total Environ. 2020, 739, 139864. [Google Scholar] [CrossRef]
  6. Singh, V.; Singh, S.; Biswal, A.; Kesarkar, A.P.; Mor, S.; Ravindra, K. Diurnal and temporal changes in air pollution during COVID-19 strict lockdown over different regions of India. Environ. Pollut. 2020, 266, 115368. [Google Scholar] [CrossRef] [PubMed]
  7. Higham, J.; Ramírez, C.A.; Green, M.; Morse, A.P. UK COVID-19 lockdown: 100 days of air pollution reduction? Air Qual. Atmos. Health 2020, 14, 325–332. [Google Scholar] [CrossRef] [PubMed]
  8. Aboagye, E.M.; Attobrah, J.; Effah, N.A.A.; Afrane, S.; Mensah, F. “Fortune amidst misfortune”: The impact of COVID-19 city lockdowns on air quality. Sustain. Environ. 2021, 7, 1885185. [Google Scholar] [CrossRef]
  9. Chapman, L. Transport and climate change: A review. J. Transp. Geogr. 2007, 15, 354–367. [Google Scholar] [CrossRef]
  10. Le Quéré, C.; Jackson, R.B.; Jones, M.W.; Smith, A.; Abernethy, S.; Andrew, R.M.; De-Gol, A.J.; Willis, D.R.; Shan, Y.; Canadell, J.G.; et al. Temporary reduction in daily global CO2 emissions during the COVID-19 forced confinement. Nat. Clim. Chang. 2020, 10, 647–653. [Google Scholar] [CrossRef]
  11. Cheng, X.; Lan, T.; Mao, R.; Gong, D.; Han, H.; Liu, X. Reducing air pollution increases the local diurnal temperature range: A case study of Lanzhou, China. Meteorol. Appl. 2020, 27, e1939. [Google Scholar] [CrossRef]
  12. Hu, S.; Wang, D.; Wu, J.; Zhou, L.; Feng, X.; Fu, T.-M.; Yang, X.; Ziegler, A.D.; Zeng, Z. Aerosol presence reduces the diurnal temperature range: An interval when the COVID-19 pandemic reduced aerosols revealing the effect on climate. Environ. Sci. Atmos. 2021, 1, 208–213. [Google Scholar] [CrossRef]
  13. Karl, T.R.; Trenberth, K.E. Modern Global Climate Change. Science 2003, 302, 1719–1723. [Google Scholar] [CrossRef] [PubMed] [Green Version]
  14. IPCC. Climate Change 2021: The Physical Science Basis. In Contribution of Working Group I to the Sixth Assessment Report of the Intergovernmental Panel on Climate Change; Masson-Delmotte, V., Zhai, P., Pirani, A., Connors, S.L., Péan, C., Berger, S., Caud, N., Chen, Y., Goldfarb, L., Gomis, M.I., et al., Eds.; Cambridge University Press: Cambridge, UK, 2021; in press. [Google Scholar]
  15. Travis, D.J.; Carleton, A.M.; Lauritsen, R.G. Contrails reduce daily temperature range. Nature 2002, 418, 601. [Google Scholar] [CrossRef] [PubMed]
  16. van Wijngaarden, W.A. Examination of diurnal temperature range at coterminous U.S. stations during Sept. 8–17, 2001. Arch. Meteorol. Geophys. Bioclimatol. Ser. B 2012, 109, 1–5. [Google Scholar] [CrossRef]
  17. Sandhu, A.S.; Baldini, J.U.L. Evaluating the Significance of the Contrail Effect on Diurnal Temperature Range Using the Eyjafjallajökull Eruption-Related Flight Disruption. Geophys. Res. Lett. 2018, 45, 13090–13098. [Google Scholar] [CrossRef] [Green Version]
  18. Hong, G.; Yang, P.; Minnis, P.; Hu, Y.X.; North, G. Do contrails significantly reduce daily temperature range? Geophys. Res. Lett. 2008, 35, L23815. [Google Scholar] [CrossRef] [Green Version]
  19. Dietmüller, S.; Ponater, M.; Sausen, R.; Hoinka, K.-P.; Pechtl, S. Contrails, Natural Clouds, and Diurnal Temperature Range. J. Clim. 2008, 21, 5061–5075. [Google Scholar] [CrossRef] [Green Version]
  20. Gallo, K.P.; Easterling, D.R.; Peterson, T.C. The Influence of Land Use/Land Cover on Climatological Values of the Diurnal Temperature Range. J. Clim. 1996, 9, 2941–2944. [Google Scholar] [CrossRef]
  21. Roget, E.; Khan, V.M. Decadal differences of the diurnal temperature range in the Aral Sea region at the turn of the century. Tellus A Dyn. Meteorol. Oceanogr. 2018, 70, 1513290. [Google Scholar] [CrossRef]
  22. Bilbao, J.; Román, R.; De Miguel, A. Temporal and Spatial Variability in Surface Air Temperature and Diurnal Temperature Range in Spain over the Period 1950–2011. Climate 2019, 7, 16. [Google Scholar] [CrossRef] [Green Version]
  23. Liu, L.; Li, Z.; Yang, X.; Gong, H.; Li, C.; Xiong, A. The long-term trend in the diurnal temperature range over Asia and its natural and anthropogenic causes. J. Geophys. Res. Atmos. 2016, 121, 3519–3533. [Google Scholar] [CrossRef] [Green Version]
  24. Rahimzadeh, F.; Sanchez-Lorenzo, A.; Hamedi, M.; Kruk, M.C.; Wild, M. New evidence on the dimming/brightening phenomenon and decreasing diurnal temperature range in Iran (1961–2009). Int. J. Clim. 2015, 35, 2065–2079. [Google Scholar] [CrossRef] [Green Version]
  25. Lauritsen, R.G.; Rogers, J.C. U.S. Diurnal Temperature Range Variability and Regional Causal Mechanisms, 1901–2002. J. Clim. 2012, 25, 7216–7231. [Google Scholar] [CrossRef]
  26. Mall, R.K.; Chaturvedi, M.; Singh, N.; Bhatla, R.; Singh, R.S.; Gupta, A.; Niyogi, D. Evidence of asymmetric change in diurnal temperature range in recent decades over different agro-climatic zones of India. Int. J. Clim. 2021, 41, 2597–2610. [Google Scholar] [CrossRef]
  27. Lewis, S.C.; Karoly, D.J. Evaluation of Historical Diurnal Temperature Range Trends in CMIP5 Models. J. Clim. 2013, 26, 9077–9089. [Google Scholar] [CrossRef] [Green Version]
  28. Selman, C.; Misra, V. Simulating diurnal variations over the southeastern United States. J. Geophys. Res. Atmos. 2015, 120, 180–198. [Google Scholar] [CrossRef]
  29. Liu, L.; Chen, W.; Guo, J.; Wu, R.; Wang, L.; Wang, S.; Huo, Y.; Tao, W. Large-scale pattern of the wintertime diurnal temperature range variations over North America during 1979–2018. Atmos. Res. 2021, 257, 105614. [Google Scholar] [CrossRef]
  30. Zhang, X.; Li, X.; Li, L.; Zhang, S.; Qin, Q. Environmental factors influencing snowfall and snowfall prediction in the Tianshan Mountains, Northwest China. J. Arid Land 2019, 11, 15–28. [Google Scholar] [CrossRef] [Green Version]
  31. Zhang, L.; Wang, C.; Li, Y.; Huang, Y.; Zhang, F.; Pan, T. High-latitude snowfall as a sensitive indicator of climate warming: A case study of Heilongjiang Province, China. Ecol. Indic. 2020, 122, 107249. [Google Scholar] [CrossRef]
  32. Chen, J.; Wang, B.; Huang, S.; Song, M. The influence of increased population density in China on air pollution. Sci. Total Environ. 2020, 735, 139456. [Google Scholar] [CrossRef] [PubMed]
  33. NCDC. Climate Data Online. 2021. Available online: https://ncdc.noaa.gov/cdo-web (accessed on 29 September 2021).
  34. World Media Group. USA.com—Search Rankings. 2022. Available online: http://www.usa.com/rank (accessed on 31 January 2022).
  35. National Weather Service. Climate. 2021. Available online: https://www.weather.gov/wrh/climate (accessed on 30 September 2022).
  36. Bureau of Economic Analysis. Gross Domestic Product (GDP) by State (Millions of Current Dollars). 2019. Available online: https://apps.bea.gov/iTable/index_nipa.cfm (accessed on 29 September 2021).
  37. US Census Bureau. Resident Population Data. 2010. Available online: https://web.archive.org/web/20111028061117/http://2010.census.gov/2010census/data/apportionment-dens-text.php (accessed on 29 September 2021).
  38. Hallas, L.; Hatibie, A.; Koch, R.; Majumdar, S.; Pyarali, M.; Wood, A.; Hale, T. Variation in US States’ COVID-19 Policy Responses. BSG Working Paper Series. BSG-WP-2020/034 Version 3. 2021. Available online: https://www.bsg.ox.ac.uk/research/publications/variation-us-states-responses-covid-19 (accessed on 30 January 2022).
  39. Delbert, C. States that Have Been Locked Down the Longest. Stacker. 2020. Available online: https://stacker.com/stories/4218/states-have-been-locked-down-longest (accessed on 5 January 2022).
  40. Sekar, M.; Kumar, T.P.; Kumar, M.S.G.; Vaníčková, R.; Maroušek, J. Techno-economic review on short-term anthropogenic emissions of air pollutants and particulate matter. Fuel 2021, 305, 121544. [Google Scholar] [CrossRef]
  41. Mahato, S.; Pal, S.; Ghosh, K.G. Effect of lockdown amid COVID-19 pandemic on air quality of the megacity Delhi, India. Sci. Total Environ. 2020, 730, 139086. [Google Scholar] [CrossRef]
  42. Qu, M.; Wan, J.; Hao, X. Analysis of diurnal air temperature range change in the continental United States. Weather Clim. Extremes 2014, 4, 86–95. [Google Scholar] [CrossRef] [Green Version]
  43. Gilford, D.M.; Smith, S.R.; Griffin, M.L.; Arguez, A. Southeastern U.S. Daily Temperature Ranges Associated with the El Niño–Southern Oscillation. J. Appl. Meteorol. Clim. 2013, 52, 2434–2449. [Google Scholar] [CrossRef]
  44. Leamon, R.J.; McIntosh, S.W.; Marsh, D.R. Termination of Solar Cycles and Correlated Tropospheric Variability. Earth Space Sci. 2021, 8, e2020EA001223. [Google Scholar] [CrossRef] [PubMed]
  45. Climate. El Niño & La Niña (El Niño-Southern Oscillation)—U.S. Impacts. 2021. Available online: https://www.climate.gov/enso (accessed on 30 September 2021).
  46. You, Q.; Ren, G.; Fraedrich, K.; Kang, S.; Ren, Y.; Wang, P. Winter temperature extremes in China and their possible causes. Int. J. Clim. 2013, 33, 1444–1455. [Google Scholar] [CrossRef]
  47. Walsh, C.R.; Patterson, R.T. Attribution of Observed Periodicity in Extreme Weather Events in Eastern North America. Earth Space Sci. 2022, 9, e2022EA002359. [Google Scholar] [CrossRef]
  48. Walsh, C.R.; Patterson, R.T. Regional impact of large-scale climate oscillations on ice out variability in New Brunswick and Maine. PeerJ 2022, 10, e13741. [Google Scholar] [CrossRef] [PubMed]
  49. Walsh, C.R.; Patterson, R.T. Precipitation and Temperature Trends and Cycles Derived from Historical 1890–2019 Weather Data for the City of Ottawa, Ontario, Canada. Environments 2022, 9, 35. [Google Scholar] [CrossRef]
  50. Vanek, F.M.; Albright, L.D. Energy Systems Engineering: Evaluation and Implementation; McGraw Hill: New York, NY, USA, 2008. [Google Scholar]
  51. Twomey, S.A.; Piepgrass, M.; Wolfe, T.L. An assessment of the impact of pollution on global cloud albedo. Tellus B Chem. Phys. Meteorol. 1984, 36, 356–366. [Google Scholar] [CrossRef]
  52. Jia, A.; Liang, S.; Wang, D.; Jiang, B.; Zhang, X. Air pollution slows down surface warming over the Tibetan Plateau. Atmos. Chem. Phys. 2020, 20, 881–899. [Google Scholar] [CrossRef] [Green Version]
  53. Braganza, K.; Karoly, D.J.; Arblaster, J.M. Diurnal temperature range as an index of global climate change during the twentieth century. Geophys. Res. Lett. 2004, 31, L13217. [Google Scholar] [CrossRef]
  54. Sun, X.; Ren, G.; You, Q.; Ren, Y.; Xu, W.; Xue, X.; Zhan, Y.; Zhang, S.; Zhang, P. Global diurnal temperature range (DTR) changes since 1901. Clim. Dyn. 2019, 52, 3343–3356. [Google Scholar] [CrossRef]
  55. Ricke, K.L.; Caldeira, K. Maximum warming occurs about one decade after a carbon dioxide emission. Environ. Res. Lett. 2014, 9, 124002. [Google Scholar] [CrossRef]
  56. Our World in Data. United States: Coronavirus Pandemic Country Profile. 2021. Available online: https://ourworldindata.org/coronavirus/country/united-states (accessed on 29 September 2021).
  57. SpaceWeatherLive. The Aurora and Solar Activity Archive—November 2020. 2020. Available online: https://www.spaceweatherlive.com/en/archive/2020/11.html (accessed on 19 November 2022).
  58. Centers for Disease Control and Prevention: COVID Data Tracker—Wastewater Suveillance (2021). Available online: https://covid.cdc.gov/covid-data-tracker/#wastewdatatracker-home (accessed on 11 April 2022).
  59. NCEI. National Temperature and Precipitation Maps. 2021. Available online: https://www.ncdc.noaa.gov/temp-and-precip/us-maps/ (accessed on 30 September 2021).
  60. He, G.; Pan, Y.; Tanaka, T. The short-term impacts of COVID-19 lockdown on urban air pollution in China. Nat. Sustain. 2020, 3, 1005–1011. [Google Scholar] [CrossRef]
  61. Scheitlin, K. The Maritime Influence on Diurnal Temperature Range in the Chesapeake Bay Area. Earth Interact. 2013, 17, 1–14. [Google Scholar] [CrossRef]
  62. Tomlinson, C.J.; Chapman, L.; Thornes, J.E.; Baker, C. Remote sensing land surface temperature for meteorology and climatology: A review. Meteorol. Appl. 2011, 18, 296–306. [Google Scholar] [CrossRef]
Figure 1. Number of indexed publications on DTR as a topic in the last 30 years; data sourced from the Web of Science and collected using the ‘topic’ search string {“diurnal temperature va*” OR “diurnal temperature ra*” OR “diurnal temperature di*”}.
Atmosphere 13 02031 g001
Figure 2. Yearly mean average DTR for the years 2015–2020; error bars reflect the variation of DTR values in each yearly data set and are meant to be used for comparison of end-values rather than for evaluation of statistical significance of DTR changes (see Section 3.2).
Atmosphere 13 02031 g002
Figure 3. Yearly mean average DTR for years 1911–2020; data from 2010 to 2020 is collected by this study, and data from 1911 to 2009 is scaled (by factor: 0.6043*DTR + 4.3184, to account for difference in stations and number of stations per state used in the two studies) from data presented by Qu et al. (2014) [42] based on data collected by this study from 2010 to 2012.
Atmosphere 13 02031 g003
Figure 4. Comparing more than five decades of solar evolution and activity proxies. From top to bottom: (a) the total (black) and hemispheric sunspot numbers (north—red, and blue—south); (b) the latitude–time variation of sunspot locations; (c) the Oulu cosmic-ray flux; (d) the Penticton F10.7 cm radio flux; (e) a data-motivated schematic depiction of the sun’s 22-year magnetic activity cycle; and (f) the variability of the Oceanic Niño Index (ONI) over the same epoch (ONI values of ≥+0.5 indicate El Niño and values ≤ –0.5 indicate La Niña). The black dashed lines mark the cycle terminators (Leanon et al., 2021) [44]. Reprinted with permission from John Wiley and Sons (5432760949440).
Atmosphere 13 02031 g004
Figure 5. North American impacts of ENSO events (El Niño and La Niña). Source: National and Oceanic and Atmospheric Association (Climate, 2021) [45] (public domain).
Atmosphere 13 02031 g005
Figure 6. Monthly mean average DTR for the years 2015–2020.
Atmosphere 13 02031 g006
Figure 7. Correlation between month change in DTR between 2020 and 2019, and monthly total number of COVID-19 cases in the USA in 2020 (Source: Centers for Disease Control and Prevention (CDC, 2021) [58]).
Atmosphere 13 02031 g007
Figure 8. Station-wise yearly average DTR for the years 2015–2020 from 14 out of 189 stations; other stations data are provided in the Supplementary Materials.
Atmosphere 13 02031 g008
Figure 9. Yearly mean average DTR for the years 2015–2020 randomly split into two sets; error bars reflect the variation of DTR values in each yearly data set and are meant to be used for comparison of end-values rather than for evaluation of statistical significance of DTR changes (see Section 3.2).
Atmosphere 13 02031 g009
Figure 10. (a) Yearly mean average DTR split according to annual snowfall amounts; (b) US map illustrating the top 24 and bottom 24 states for annual snowfall amounts; (c) Yearly mean average DTR split according to GDP per capita; (d) US map illustrating the top 24 and bottom 24 states for GDP per capita; (e) Yearly mean average DTR split according to population density; (f) US map illustrating the top 24 and bottom 24 states for population density; (g) Yearly mean average DTR split according to mean state latitude; (h) US map illustrating the 24 most northern and 24 most southern states (according to mean state latitude); (i) Yearly mean average DTR split according to coastal distance of mean state longitude; (j) US map illustrating the 24 most coastal and 24 most inner states (according to coastal distance of mean state longitude).
Atmosphere 13 02031 g010aAtmosphere 13 02031 g010b
Figure 11. ΔDTRtop-bottom values for each factor, and the 5-year (2015–2020) and 4-year (2015–2019) averages of ΔDTRtop-bottom values for each factor.
Atmosphere 13 02031 g011
Figure 12. Maximum temperature anomaly (°F) in the contiguous USA in the year 2020 versus the 20th century average. Source: National Centers for Environmental Information (NCEI, 2021) [59] (public domain).
Atmosphere 13 02031 g012
Table 1. DTR calculations of random data splitting; the ratios of set difference to yearly average are substantially smaller than the ratios of yearly average to 6-year standard deviation, indicating that DTR changes from year to year are more significant than the uncertainty of the DTR values.
YearAverage (°C)Set 1 (°C)Set 2 (°C)Difference1
(Avg.—Set 1) (°C)
Difference2
(Avg.—Set 2) (°C)
Set Difference
(Set 1–Set 2) (Absolute) (°C)
Ratio Set
Difference: Yearly Avg. (%)
202011.8811.9011.87−0.0180.0180.0370.308%
201911.6911.7111.67−0.0210.0210.0420.356%
201811.5611.5711.55−0.0110.0110.0220.192%
201711.8511.8611.85−0.0030.0030.0050.046%
201612.0112.0311.98−0.0220.0220.0430.362%
201511.9912.0111.97−0.0220.0220.0440.371%
6-yr avg.11.8311.8511.81
6-yr std. dev.0.1760.1760.176
Ratio yearly avg.:
6-yr std.dev. (%)
1.49%1.49%1.49%
Table 2. Calculations of four approaches to determine daily DTR (°C).
YearConventionalPrevious TminNext Tmin3-Day Avg. TminLargest Difference vs. Conventional
(°C Absolute)
202011.8811.8911.8911.890.014
201911.6911.7011.6911.700.013
201811.5611.5911.5311.570.036
201711.8511.8311.8911.870.032
201612.0112.0212.0112.020.015
201511.9912.0111.9912.010.022
6-yr avg.11.8311.8411.8311.850.015
Table 3. Correlations of split factors and factor sets in terms of year-over-year DTR differences (ΔDTR2020–2019) and intra-year differences between factor set mean and contiguous USA mean (ΔDTR2020_mean-2020).
Split FactorsFactor SetsΔDTR2020–2019ΔDTR2020_Mean-2020
Snowfall amountTop 240.410.25
Bottom 24 and DC−0.01−0.23
GDP per capitaTop 24 and DC0.36−0.10
Bottom 240.030.11
Population densityTop 24 and DC−0.14−0.96
Bottom 240.530.99
Latitude24 Most Northern States0.48−0.22
24 Most Southern States and DC−0.090.24
Longitude24 Most Coastal States and DC0.02−0.48
24 Most Inner States0.360.47
Publisher’s Note: MDPI stays neutral with regard to jurisdictional claims in published maps and institutional affiliations.

