Article

Burden of Natural-Cause and Cause-Specific Mortality Associated with Long-Term Exposure to PM2.5: A Case Study in Attica Region, Greece

Laboratory of Meteorology and Climatology, Department of Physics, University of Ioannina, GR-45110 Ioannina, Greece
*
Author to whom correspondence should be addressed.
Atmosphere 2022, 13(12), 2026; https://doi.org/10.3390/atmos13122026
Submission received: 10 October 2022 / Revised: 27 November 2022 / Accepted: 28 November 2022 / Published: 2 December 2022

Abstract

:
In this study, the AirQ+ software proposed by the World Health Organization (WHO) was applied in order to assess the health endpoints associated with the long-term exposure to PM2.5 in Attica Region, Greece. For this purpose, we analyzed the daily average concentrations of PM2.5 registered by the air quality monitoring stations in the region, from 1 January 2007 to 31 December 2018. Although there was a decreasing trend in PM2.5 concentrations levels, the levels of PM2.5 exceeded the AQG (Air Quality Guidelines) limit value (annual value: 5 μg/m3) established by the WHO. The findings revealed that the burden of mortality (from all-natural causes) at people above 30 years old associated with PM2.5 exposure was 4752 [3179–6152] deaths in 2007 and 2424 [1598–3179] deaths in 2018. In general, the attributable mortality from specific causes of deaths (e.g., lung cancer, IHD (ischemic heart diseases) and stroke) in people above 25 years old decreased between the years, but the mortality from COPD (chronic obstructive pulmonary diseases) was stable at 146 [79–220] deaths in 2007 and 147 [63–244] deaths in 2018. We also found differences in mortality cases from IHD and stroke among the age groups and between the years 2007 and 2018.

1. Introduction

Air pollution constitutes one of the most pressing environmental health issues facing contemporary societies [1,2]. Among ambient air pollutants, particulate matter (PM) is considered to be the air pollutant with the greatest health concern [3]. PM is a complex mixture of solid and/or liquid particles suspended in the air and varies in size and composition. The sources of PM may be anthropogenic or natural. The anthropogenic sources of PM include residential heating and biomass combustion, industrial emissions and combustion byproducts from incinerators, road transport and exhaust emissions from the internal combustion engines in motor vehicles as well as emissions from energy (power plants and refineries) and manufacturing industries [4]. As for natural sources, PM is emitted from volcanic eruptions, wild-land fires, windblown dust from arid and semi-arid regions [4]. Additionally, PM may include biological organisms (e.g., pollen, spores, bacteria, and fungi) [5].
PM comes in a wide range of sizes, including particles with aerodynamic diameter less than or equal to 10 μm (PM10) and particles with aerodynamic diameter less than or equal to 2.5 μm (PM2.5). The smaller size fractions have a large reactive surface area and the ability to penetrate deep into the alveoli of the lungs and potentially into the bloodstream, activating the molecular mechanisms of epithelial and defense cells [6,7]. The primary intake route of PM in the body is the respiratory tract, via the nose or mouth, while there are specific factors that affect the penetration of particles into the lower respiratory tract (beyond the larynx) and the deposition in different parts of the human body [8]. These factors include the size, shape, and density of the inhaled particles, as well as the airways’ size and structure, breathing pattern (flow and volume), route of breathing (nose vs. mouth) [7,8].
A substantial body of evidence regarding disease burden from air pollution comes from epidemiological studies [9,10,11]. Dockery et al. (1993) and Pope et al. (1995) established the first cohort studies of PM air pollution and mortality in the mid-1990s [12,13]. In the last decades, particulate matter–induced health effects have been widely investigated in numerous epidemiological studies providing evidence of highly statistically significant associations between PM exposure and various health endpoints, such as all-cause mortality, cardiopulmonary, cardiovascular, respiratory diseases and lung cancer [10,14,15]. Both short-term and long-term exposure to PM can have serious health impacts. In Seoul, Korea, the short-term exposure to PM2.5 has been associated with emergency hospital admissions for mental diseases, such as schizophrenia and depression [16]. In a study that included 104 counties in China, it was found that the estimated county-specific mortality burden attributable to short-term PM2.5 exposure contributed significantly to the death burden [17]. Additionally, it was found that the daily concentrations of PM2.5 have an extensive range of values fluctuating from very low to extremely high (above 100 μg/m3). Additionally, positive associations between PM and mortality were found from various studies [18,19]. In a systematic review and meta-analysis conducted by Ciabattini et al. (2021), it was suggested that the association between exposure to PM2.5 or PM10 and risk of lung cancer might be higher than previously estimated, while the risk is higher in East Asia than in Europe and North America [20]. In another systematic review and meta-analysis, the long-term effect of exposure to PM and the incidence of myocardial infarction (MI) was confirmed [21]. The short-term impact of PMX concentrations on cardiovascular and respiratory hospital admissions was examined in 31 Polish cities based on the daily PM10 and PM2.5 concentrations [22]. They found significant associations, especially during the winter period which was characterized by higher daily numbers of hospital admissions [22]. Stafoggia et al. (2022) performed a multicenter longitudinal study, analyzing seven population-based cohorts of adults (age ≥30 years) from European countries [23]. They found that the long-term exposure to concentrations of PM2.5 lower than 10 μg/m3 was associated with non-accidental (natural cause of deaths), cardiovascular, non-malignant respiratory, and lung cancer mortality [23]. In addition, epidemiological studies have shown a positive association between air pollution and allergic diseases such as asthma, allergic rhinitis and eczema [24]. Li et al. (2022) found a positive association between the exposure to various air pollutants (including PM2.5 and PM10) and the prevalence of allergic rhinitis, and children and adolescents were more sensitive to air pollution exposure than adults [25]. Generally, children, the elderly and people with pre-existing diseases are recognized as a high-risk group. Age could affect both susceptibility and exposure to air pollution through underlying disease and activity patterns [26]. For instance, Danesh Yazdi et al. (2021) found that long-term exposure to air pollutants (PM2.5, O3 and NO2) poses a significant risk to cardiovascular and respiratory health among people who were 65 years of age or older in the U.S., even at low levels [27].
In order to evaluate the risks and impacts of air pollutants on human health, there are different approaches, statistical models and tools. The quantification of these adverse health effects has been feasible due to AIRQ software developed by the WHO European Centre for Environment and Health, Bilthoven Division [28]. Worldwide, several authors have used the AirQ software in order to perform a health impact assessment due to air pollution exposure, such as Samek (2016) in Poland [29], De Marco et al. (2018) in Italy [30], Pala et al. (2021) in Turkey [31], Brito et al. (2022) in Portugal [32] and Ravindra et al. (2022) at the rural district of Punjab, India [33]. The AirQ+ was used by Orru et al. (2022) in order to estimate the health impacts of PM2.5 originating from residential wood combustion in four studied city areas in Sweden, Finland, Norway, and Denmark [34]. Soleimani et al. (2022) implemented the AirQ+ to evaluate the health impacts due to vehicular PM2.5 emissions in Isfahan, Iran [35]. In Greece, Moustris et al. (2015) [36], Ntourou et al. (2017) [37] and Moustris et al. (2017) [38] recently employed the AirQ 2.2.3 software to assess the annual number of hospital admissions for respiratory diseases due to the exposure to PM10.
The impact of air pollution on mortality have been previously investigated in Greece by several authors, including Touloumi et al. (1996) [39], Economopoulou and Economopoulos (2002) [40] and Tzima et al. (2018) [41]. Recently, Kasdagli et al. (2021) [42] and Kasdagli et al. (2022) [43] studied the association of long-term exposure to air pollution and greenness with mortality based on health and covariate data in Greece. Their analyses revealed that the long-term exposure to air pollution, especially PM2.5, is associated with increased risk of mortality from cardiometabolic, chronic obstructive pulmonary diseases and diseases of the central nervous system.
The present study focuses on the Region of Attica because it is the capital of Greece and the most densely populated region with almost 40% of the population of the country. Although the air quality in Attica Region has improved in the last decades, the concentrations of air pollutants are still at high levels, compromising residents’ health. The continuous exposure to air pollutants even at low or moderate levels has an impact on the population, and this can be quantified by using the AIRQ+ software. Therefore, we assessed the burden of mortality associated with the exposure to PM2.5 based on the available PM2.5 data in Attica Region and the annual number of deaths due to natural cause and cause-specific mortality at regional level for the years 2007–2018.

2. Materials and Methods
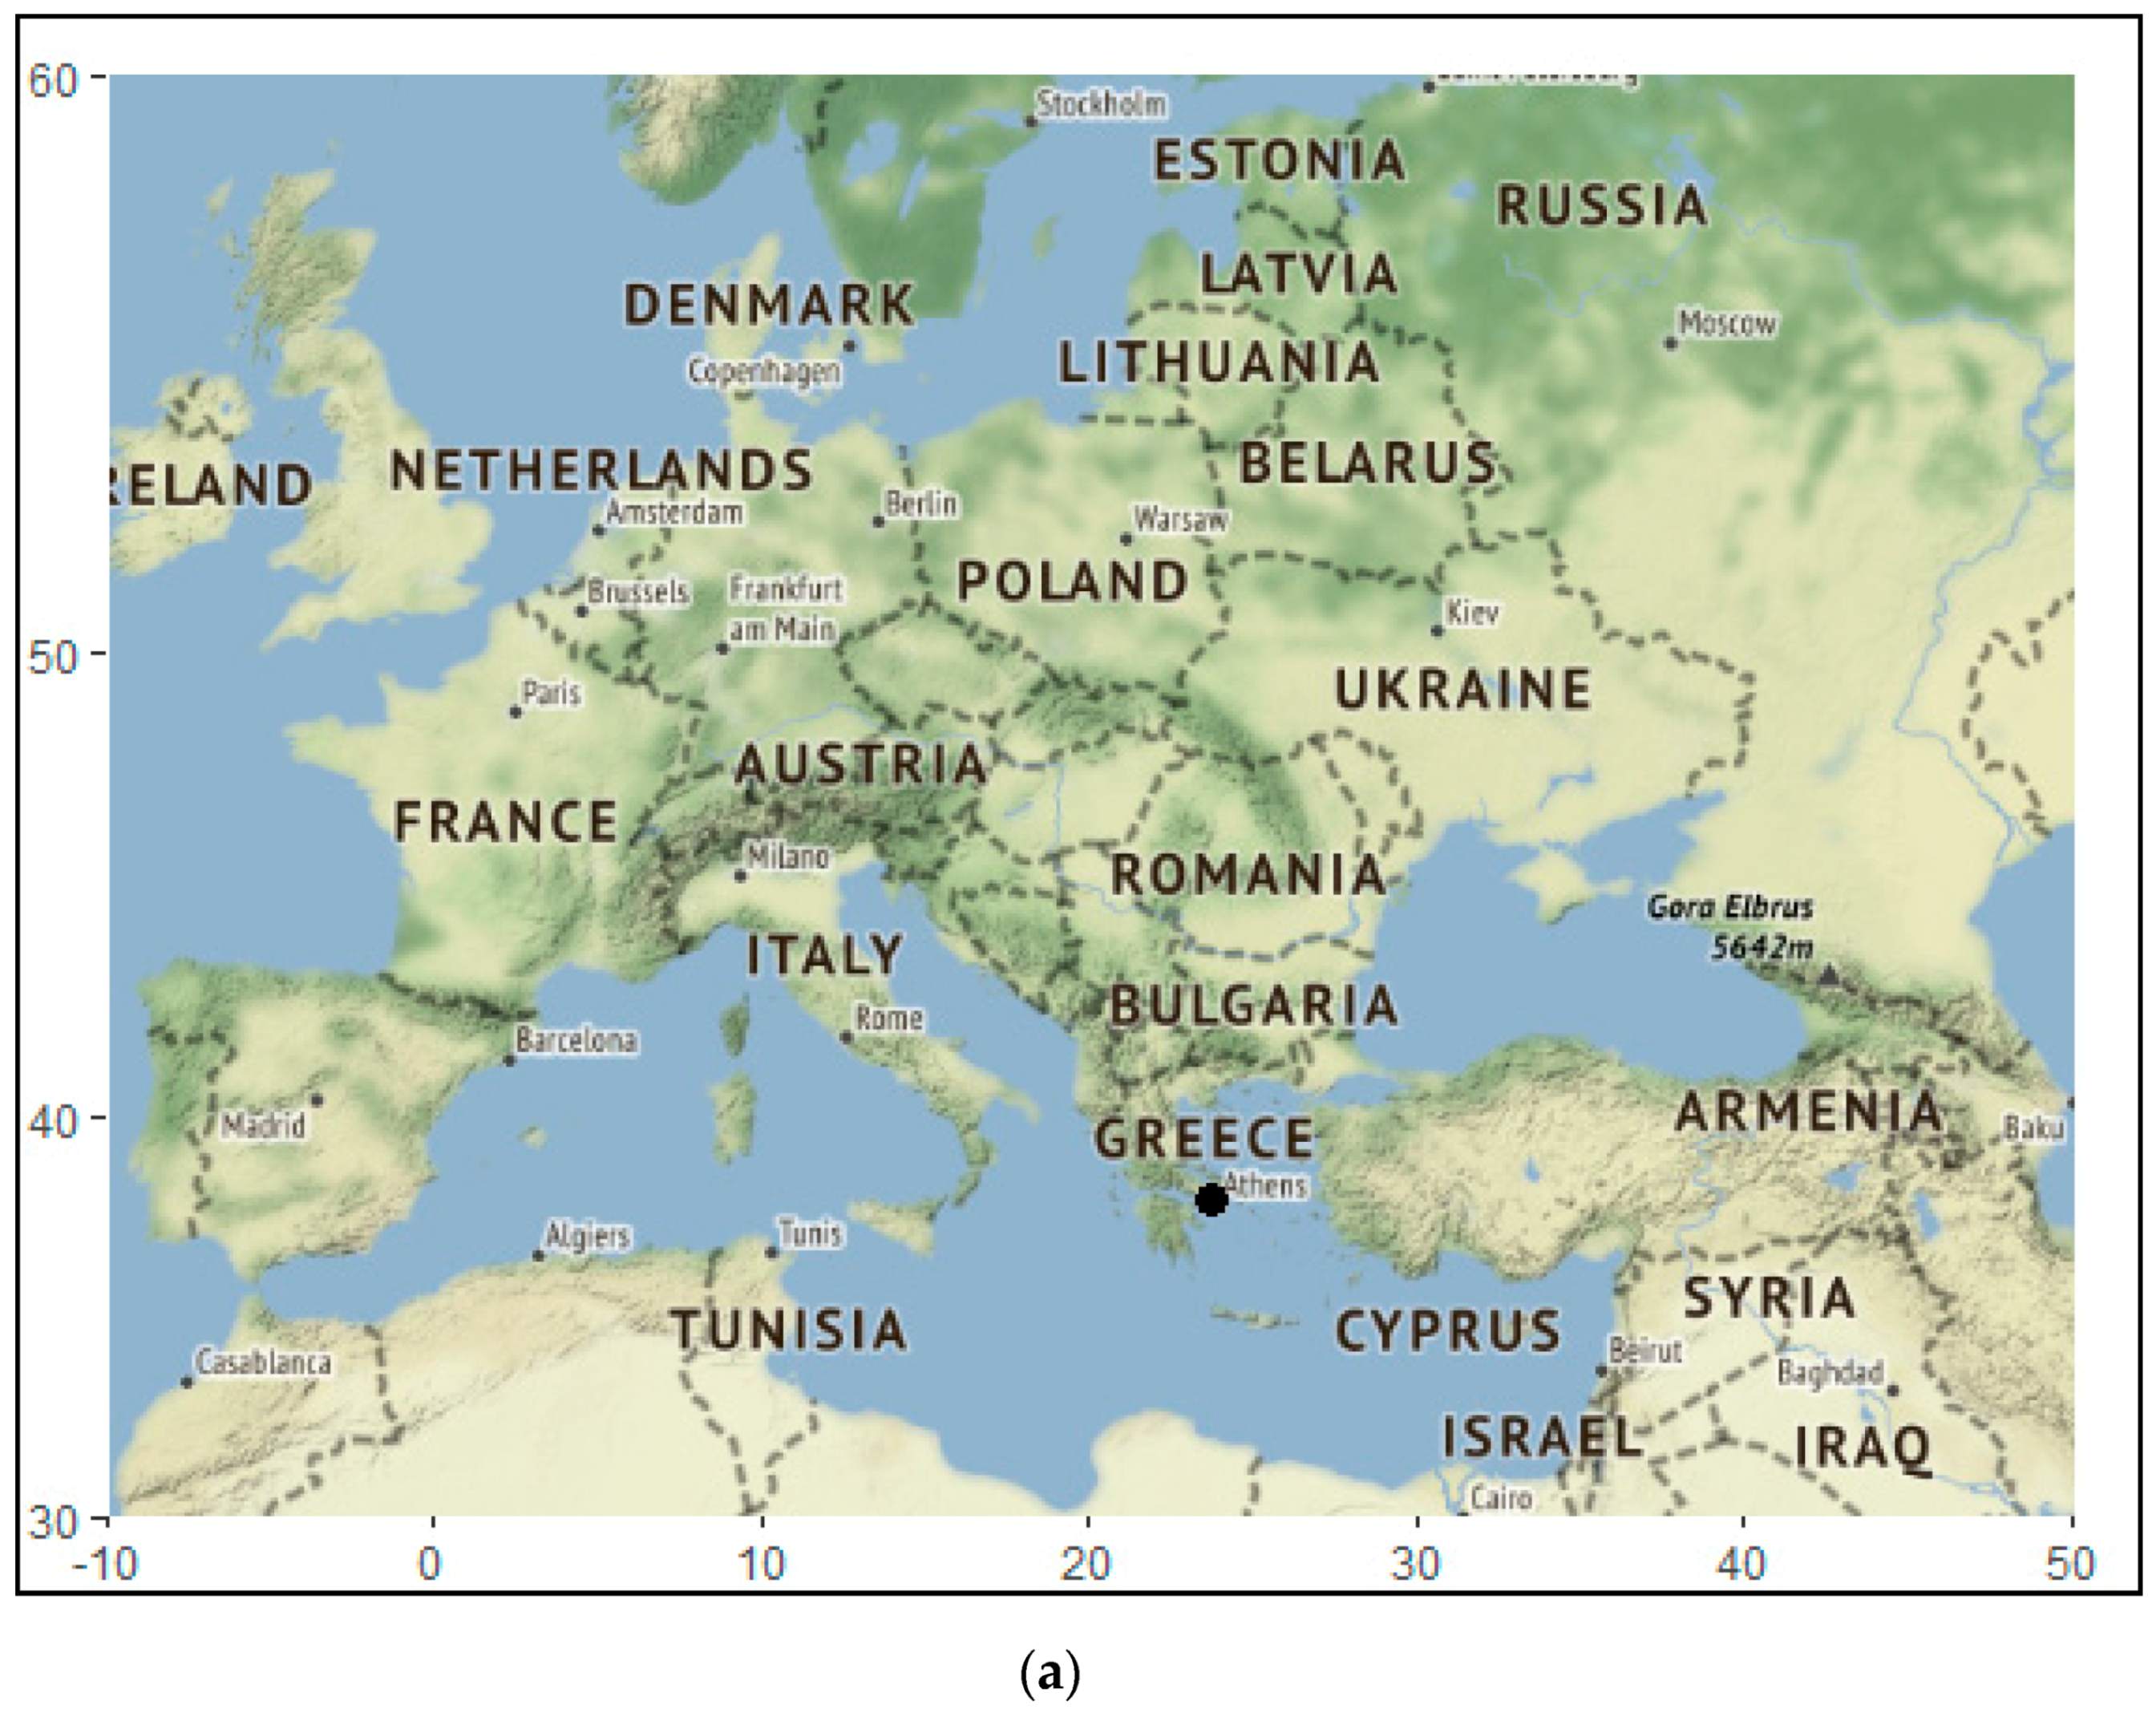
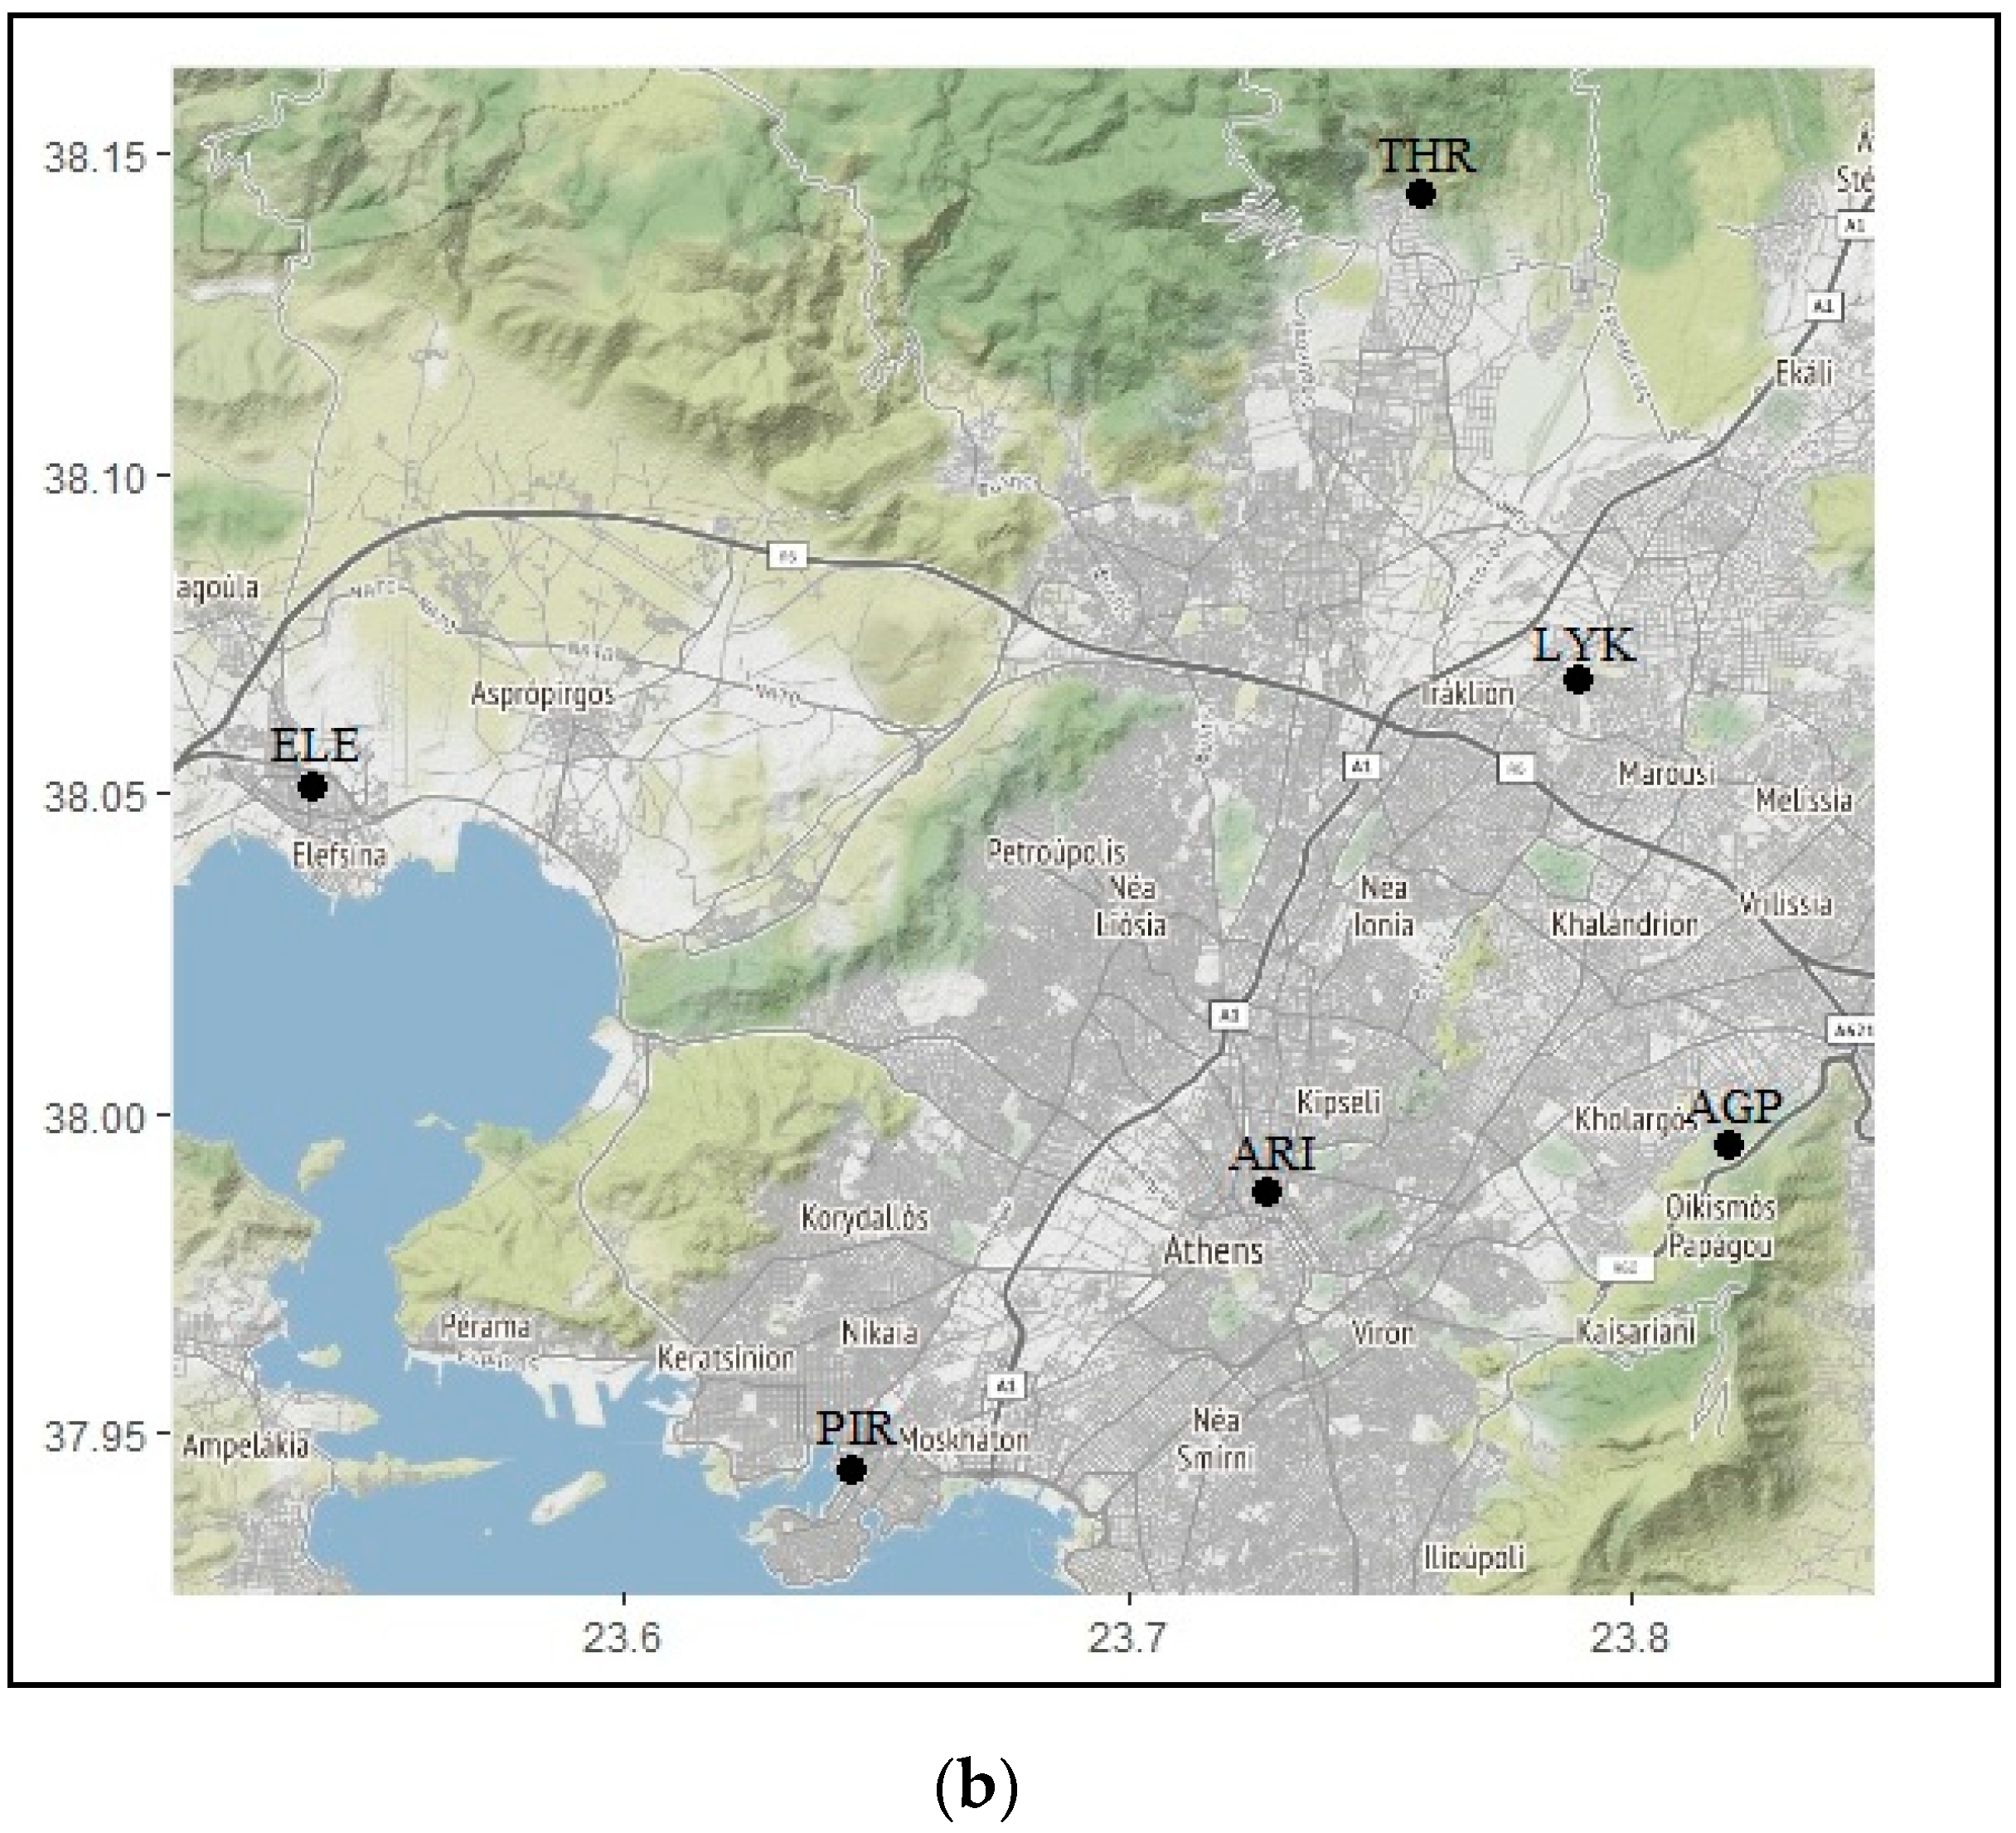
2.1. Study Area

The Attica Region is densely populated with a population of 3,792,469 inhabitants according to the national census data of 2021 (https://www.statistics.gr/, accessed on 1 October 2022). The capital of Greece, Athens, is located in an area of complex topography within the Athens basin, has an elongated shape in the NE-SW direction, and is surrounded by the mountains (Hymettus, Penteli, and Parnitha) with heights ranging from 400 to 1500 m in the western, northern and eastern sides and the sea called the Saronikos Gulf, at the south. The ventilation of the basin is poor during the prevalence of the local circulation systems, such as sea/land-breezes along the major NE-SW geographical axes of the basin [44,45]. The complex terrain of the basin influences the local meteorology and concentration levels of air pollutants [46]. In Athens, there are mainly two types of air pollution that have been recognized—particulate matter pollution and photochemical smog—mainly from road traffic emissions and central heating [47]. As regards the industry activity within the Attica Region, the industrial zone of the Athens basin is located S/SSW of the city center, in the Thriassion plain [48]. However, the urban traffic represents the main source of atmospheric pollution in the Attica. In accordance with the Hellenic Statistical Authority (ELSTAT), the total number of registered passenger cars in circulation in Attica Region during 2018 was 2,916,923 vehicles, that of motorcycles was 690,453, that of trucks was 284,615 and that of buses was 12,185. It should be noted that the majority of the passenger cars’ fuel in Greece are petrol (88%) and diesel (8.5%) powered engines, while only a small share of the fleet of passenger cars are hybrid (0.7%) and electric or with natural gas engines (almost 0%) [49].

2.2. Environmental Data

The air pollution data analyzed in this study were derived by six air quality monitoring stations of the National Air Pollution Monitoring Network (NAPMN). Table 1 lists the air quality monitoring stations (AQMS) along with their geographical coordinates. The spatial coverage of the AQMS in Attica Region is illustrated in Figure 1b.
The NAPMN is operated by the Air Quality Department of the Greek Ministry of Environment, Energy and Climate Change, and the air pollution data are available online in the Ministry’s official website (www.ypeka.gr, accessed on 1 October 2022). It should be noted that the selection of the AQMS was based on the availability of PM2.5 data. Additionally, we assume that the levels of PM2.5 concentrations in the selected AQMS are representative for the total area, in order to represent the population exposure.

2.2.1. Data Collection

In Europe, the standardized method for the measurement of the ambient PM concentrations was established by the EU Directive on the air quality and cleaner air for Europe (2008/50/EC) [50]. The references methods for the sampling and measurement of PM were carried out following the standard measurement techniques and procedures described in EN 14,907:2005 (for PM2.5). Additionally, both macroscale and microscale sitting of the sampling points in Attica Region were employed in accordance to the EU Directive 2008/50/EC on ambient air quality and cleaner air in Europe. The sampling points are representative of similar locations not in their immediate vicinity, and the air quality monitoring stations are kept away from the direct pollution sources and obstacles. At each air quality monitoring station, the PM2.5 concentration levels were measured by the beta-attenuation monitoring method. Beta attenuation (beta gauge method) is a widely used air monitoring method employing the absorption of beta radiation by solid particles extracted from the air flow.

2.2.2. Data Calculation

PM2.5 data are collected regularly on an hourly or daily basis. The hourly values of PM2.5 concentrations were averaged so as to obtain daily values. Then, the daily average values were rounded to two digits after decimal point. Thus, an approximate value was obtained with the desired accuracy and according to the data collection conditions. Unfortunately, for the years 2007–2014, there are time periods with missing values at the AQMS, so the years with more than 75% of available daily data were used [50].
As for the calculation of regional-level data for the Attica region, the data were determined by calculating the daily mean pollutant’s concentrations amongst the air quality monitoring stations in a specific area. This method aims at capturing values broadly representative of human exposure [51]. Following this procedure, the annual average PM2.5 concentrations across the available AQMS was used to calculate the annual average values in Attica Region for each year for the period 2007–2018.

2.3. Health Data

In order to estimate the burden of disease attributable to PM2.5, the annual number of deaths was obtained by the Hellenic Statistical Authority. The data set includes the annual number of deaths and cause of death per age group and sex, at a regional level. The annual number of deaths were counted due to the following causes of death: all-natural-cause mortality (ICD-10 code: A00-R99), ischemic heart diseases (IHDs) (ICD-10 code: I20-I25), chronic lower respiratory diseases (ICD-10 code: J40-J47) (defined as chronic obstructive pulmonary disease (COPD) in this study in order to be consistent with the AIRQ software definitions), cerebrovascular diseases (ICD-10 code: I60-I69) (defined as stroke in this study in order to be consistent with the AIRQ software definitions), and lung cancer diseases (ICD-10 code: C33-C34). In Table 2 are reported the health endpoints handled by the AIRQ+ and used in this study along with the ICD-10 classification codes.

2.4. Health Impact Assessment in AirQ Software

The WHO Regional Office for Europe developed the AirQ software within its activities on air quality and health. This software is a valid and reliable model to estimate the potential health effects of various air pollutants on human health [52]. The program was designed to evaluate the magnitude of the impact of both long-term and short-term exposure to air pollutants on morbidity and mortality in an exposed population, over a specified time period and geographical region. The calculations performed by the AirQ are based on the methodologies and concentration–response functions recommended by the HRAPIE (Health risks of air pollution in Europe) project. The concentration–response functions and the relevant health outcomes were expressed as a relative risk (RR) per 10 μg/m3 increase in pollutants’ concentration. The RR values based on the defined formulas or ranges of values are available from studies and the meta-analysis. Additionally, the software provides integrated exposure–response function (IER) based on the recent developments in the methodology that can be employed to estimate the health impact. The health endpoints considered by the Air Q software include disease symptoms or mortality (e.g., all-cause and specific-cause mortality and morbidity outcomes or hospitalizations due to specific causes) resulting from the exposure to an air pollutant.
The relative risk (RR) values and attributable proportion (AP) for defined pollutants were provided by the software, while the baseline incidence rates and the air pollution data were provided by the user. In this study, the baseline incidence rates for mortality were provided by the Hellenic Statistical Authority.
The attributable proportion (AP) is the fraction of the health outcome which can be attributed to the exposure in a given population for certain time period. The AP can be calculated using Equation (1):
AP = [ ( R R ( c ) 1 ) × P ( c ) ] [ R R ( c ) × P ( c ) ]  
where RR(c) is the relative risk for the health outcome in category c of exposure and P(c) is the proportion of the population in category c of exposure.
In general, the RR is the ratio of the probability of an outcome in an exposed group to the probability of an outcome in an unexposed group. Hence, the RR can be defined by Equation (2):
RR = I e I c f
where Ie is the incidence rate in the exposed population and Icf is the incidence rate in the counterfactual population (i.e., the population that is comparable in composition to the exposed population but is not exposed itself to the risk factor).
The RRs due to air pollution are usually modeled with a log-linear function (Equation (3)):
RR = exp [ β ( X X o ) ]
where X denotes the pollutant concentration (in μg/m3), and Xo (μg/m3) denotes the cut-off value or the counterfactual level of the pollutant where no pollution-related health effect is reported. The coefficient β denotes the change in the RR for one unit change in the concentration X (μg/m3).
For pollution-related health endpoints, the RR values are associated with an increase of 10 μg/m3 of a considered air pollutant concentration. The RRs for the pollutant–health outcome pairs are pre-defined by the program, along with a 95% confidence interval (CI), but this can be changed by the user.
The rate of health outcome (or number of cases) per unit population (BE) attributed to exposure E in the population, can be calculated using Equation (4):
B E = B × A P
where B indicates the population baseline incidence (per 100,000 inhabitants) of a considered health endpoint.
The number of excess cases (or deaths) attributed to the exposure can be estimated using Equation (5):
N E = B E × N
where N is the given size of a population.

3. Results and Discussion

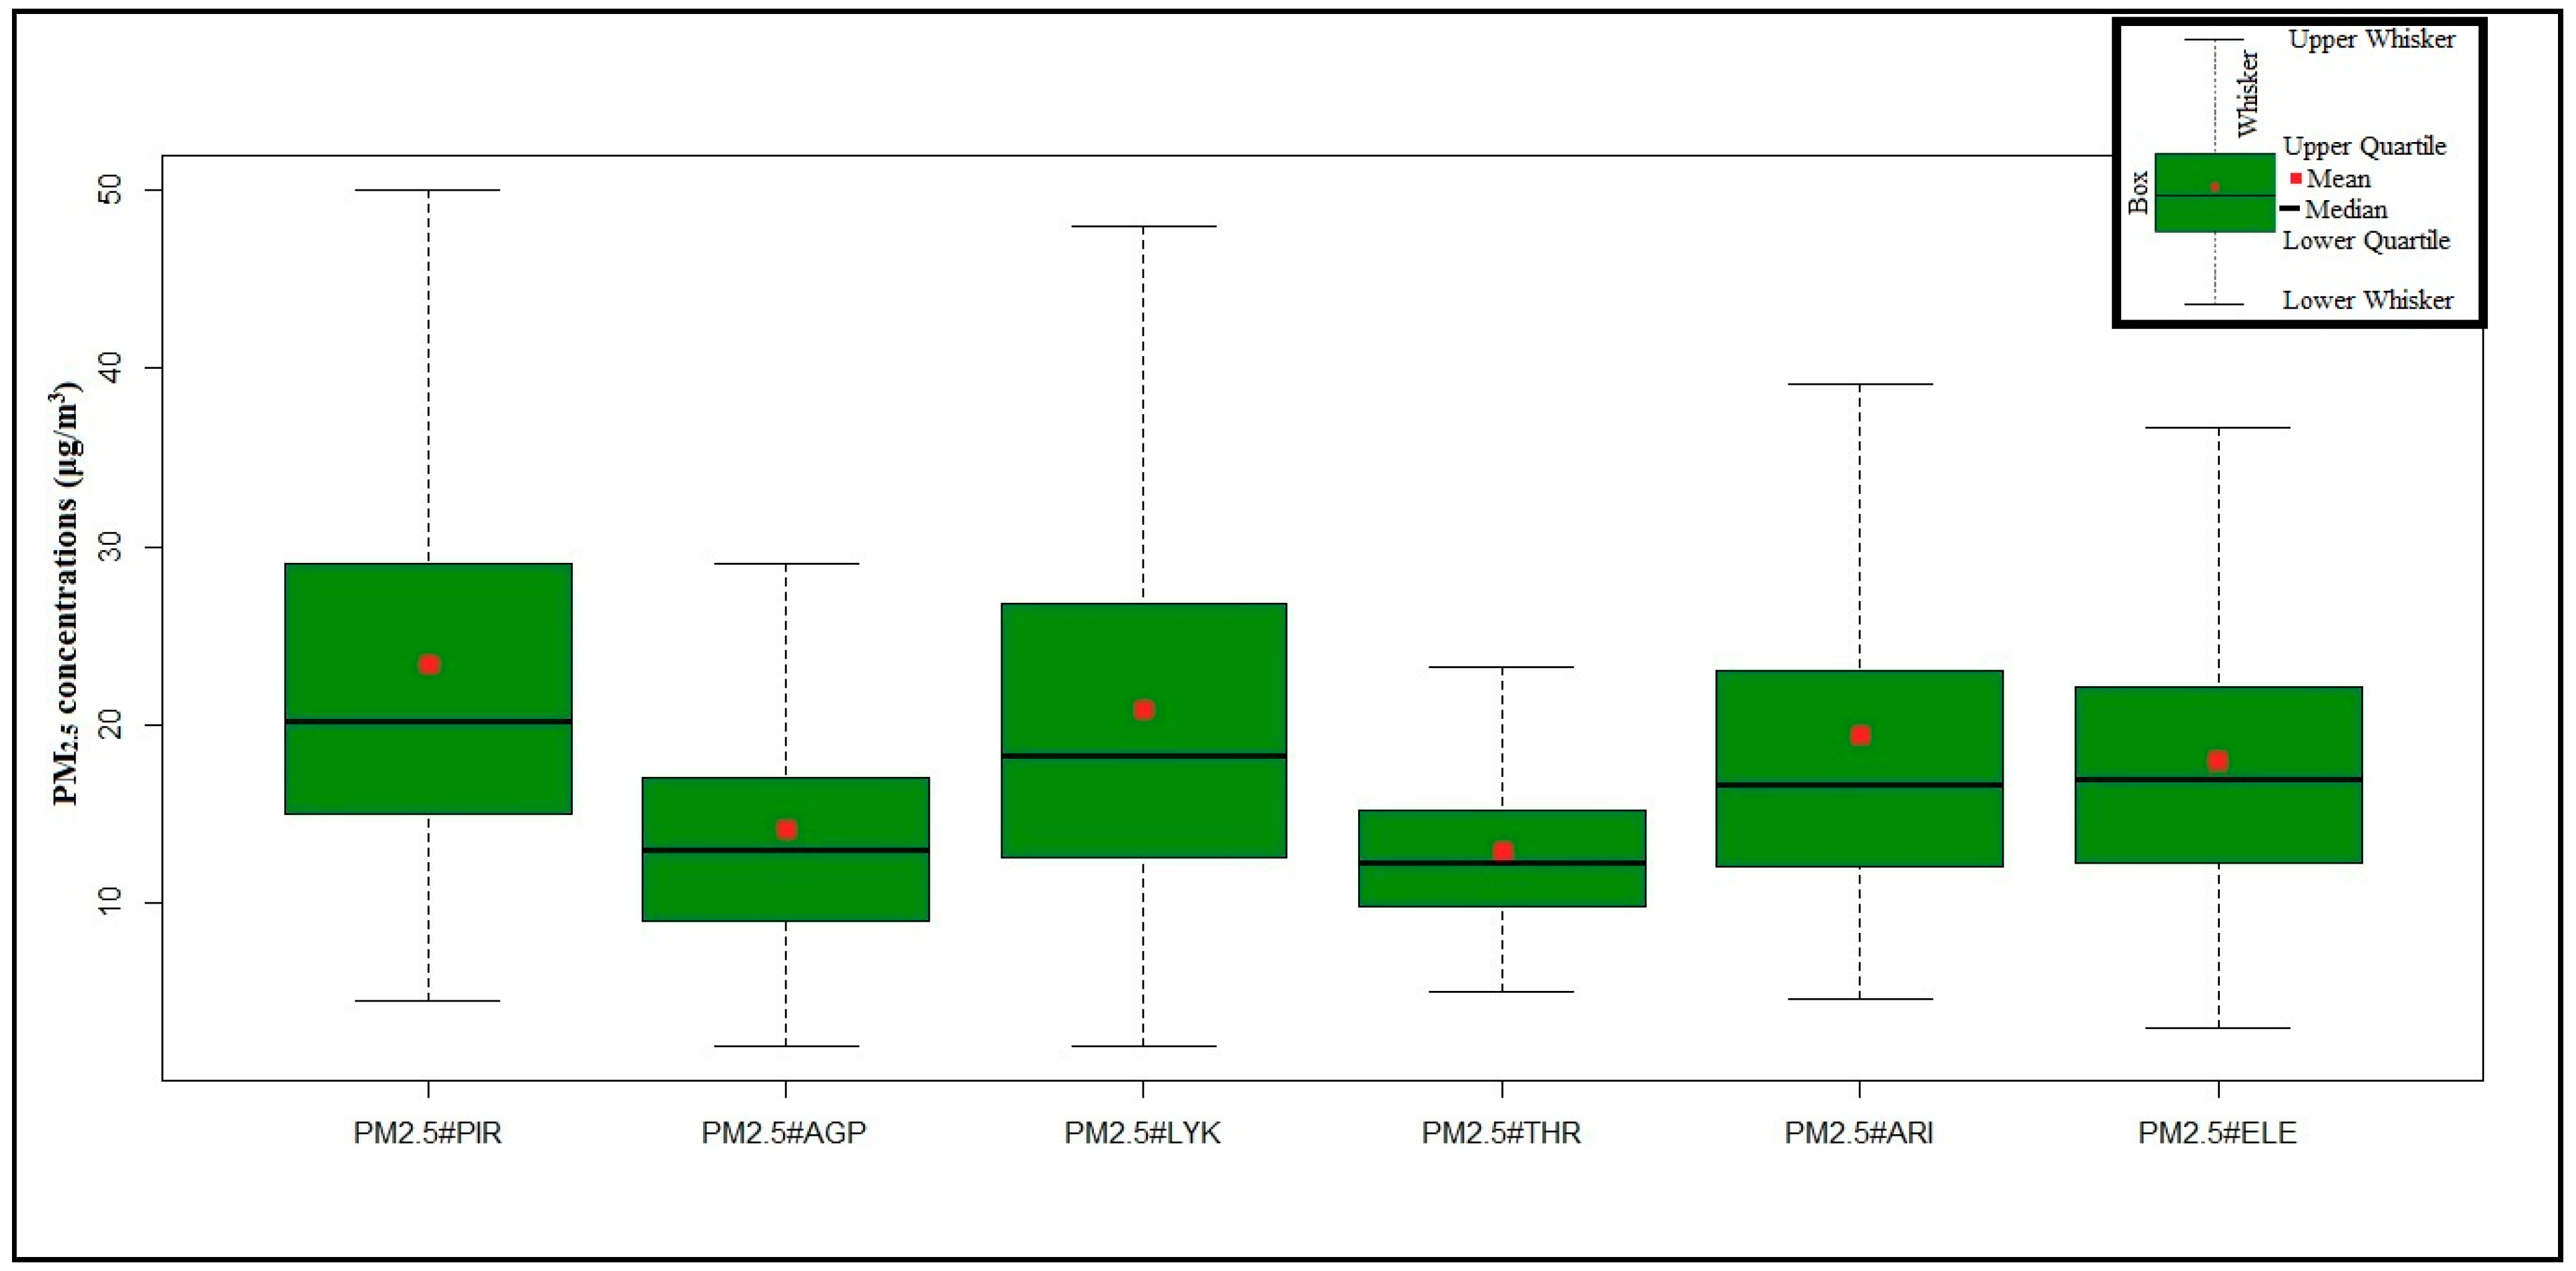
3.1. Temporal Variations of PM2.5 Concentrations

Figure 2 shows the box and whisker plots with the mean, median and the interquartile range (IQR) of the daily 24 h average concentrations of PM2.5 at the six AQMS over the periods with available data. As expected, a relatively strong spatial variation in 24 h average concentrations of PM2.5 is observed among the different zone/station type AQMS. The mean and median concentrations of PM2.5 at traffic-type AQMS exhibit the highest values. For instance, the mean and median values of the daily 24 h average concentrations during the period 2007–2018 at PIR AQMS are 23.35 μg/m3 and 20.21 μg/m3, respectively. At ARI AQMS, for the period 2015–2018, the abovementioned statistic values are 19.53 μg/m3 (mean) and 16.63 μg/m3 (median). At the suburban–industrial AQMS (i.e., ELE AQMS), the mean and median values of the daily 24 h average concentrations during the period 2015–2018 are 17.97 μg/m3 and 16.92 μg/m3, respectively. Lower values exhibit the suburban-background AQMS (i.e., AGP and THR AQMS) with these statistic values estimated at 14.09 μg/m3 (mean) and 13.00 μg/m3 (median) for the period 2007–2018 at AGP AQMS, and 12.98 μg/m3 (mean) and 12.29 μg/m3 (median) for the period 2015–2018 at THR AQMS. However, these statistic values at LYK AQMS are 20.87 μg/m3 (mean) and 18.21 μg/m3 (median). Although the mean and median values mentioned here might be underestimated values due to the unavailability/lack of data through the study period, the concentrations of PM2.5 in the Attica Region are relatively high. This means that the residents in the Attica Region are constantly exposed to considerably high levels of particulate matter air pollution.
Table 3 shows the annual average values and standard deviations of the daily 24 h average concentrations of PM2.5 at the six AQMS over the study periods. For the entire study period 2007–2018 the PIR, AGP and LYK AQMS were operated continuously, while from the year 2015, PM2.5 measurements began at the ARI, THR, and ELE AQMS. The annual mean values of PM2.5 concentrations were above the recommended annual limit value of 5 μg/m3 which was set by the 2021 WHO Air Quality Guidelines (AQG) [53]. However, there was a decreasing trend in PM2.5 concentrations levels following the global economic crisis of 2007–2008 and the Greek government-debt crisis, which started in late 2009. After these turning points in the history of the country, many scientific studies found decreasing trends in air pollution levels [47,54]. Valavanidis et al. (2015) [47] reported that the economic crisis increased the prices of heating oil during the period 2010–2015 and influenced consumers’ choices regarding heating appliances. They used low-cost wood, biomass or waste as fuels for fire places and stoves [47,55]. A study wintertime sampling campaign performed in Thessaloniki indicated a 2−5-fold increase in the concentration of wood smoke tracers in PM2.5, while the concentrations of fuel oil tracers declined by 20–30% during 2013 compared with 2012 [56]. A questionnaire survey comprised of 598 households in the spring and summer of 2012 gathered data for the heating energy consumption the winter of 2010–2011 (milder winter) and the winter of 2011–2012 (harsher winter) showed that inhabitants consumed less energy during the winter of 2011–2012 because of the rapid economic crisis [57]. Importantly, they found that the energy consumption of the households during the harsh winter 2011–2012 was 37% less than expected. Gratsea et al. (2017) found that CO concentrations during the morning traffic peak hours in Athens have decreased since 2000 during both summer and winter, which can be attributed to the decrease in fossil fuel combustion during the last years due to the gradual renewal of vehicle fleets, the EU regulations for air pollutant emissions, and the economic crisis [55]. Moreover, satellite observations showed that the tropospheric NO2 columns over Athens reduced in the range of 30–40% and the local concentrations of NO decreased due to an increase in ozone, which can be attributed to reduced titration by NO [58].
Over the period 2007–2018, the highest annual average PM2.5 concentrations were recorded in PIR AQMS, ranging from 37.26 ± 15.27 μg/m3 in 2007 to 18.03 ± 8.97 μg/m3 in 2018. The lowest annual average PM2.5 concentrations, for the period 2007–2018, were recorded in AGP AQMS, with the highest value (19.69 ± 15.27 μg/m3) in 2007 and the lowest value (10.02 ± 3.79 μg/m3) in 2013. At LYK AQMS, the annual average PM2.5 concentrations were at high levels (32.80 ± 16.64 μg/m3) in 2007, while in 2018, they dropped at 15.28 ± 7.81 μg/m3. For the period 2015–2018, the highest annual average PM2.5 concentrations were recorded at ELE AQMS (21.24 ± 8.76 μg/m3) in 2016. At ARI AQMS, the annual average PM2.5 concentration was constantly at approximate values ranging from 19 μg/m3 to 20 μg/m3. At THR AQMS, the annual average PM2.5 concentrations were at the lowest levels compared with the other AQMS, with values ranging from 12.80 ± 4.05 μg/m3 in 2015 to 13.44 ± 5.19 μg/m3 in 2018.
Specifically, PIR AQMS registered considerably high values of PM2.5 during the study period. The air pollution in Piraeus Port is considerably high due to the numerous and complex activities hosted in the area such as freight shipping, commercial and tourism activities as well as industrial activities, including storage and processing of petroleum and other fuels [59]. Apart from the combustion of marine fuels, PM could originate from the constant heavy traffic from road transport as well as from the other commercial and residential activities within the Municipality Piraeus. Additionally, ARI AQMS is located in a commercial road close to historic center of Athens. This area experiences high traffic flow and volume from private cars and public transport. Another important problem is the traffic congestion in this area because it increases fuel consumption, and in combination with the low speed of the vehicle, it was found that exhaust gas and PM emissions increase [60].
On the other hand, LYK and AGP AQMS are located in residential areas in the northern suburb municipalities of the Attica Region. However, the PM2.5 concentrations are relatively high, as was also reported by other authors [61,62]. For example, Theodosi et al. (2011) found high levels of PM2.5 (average value: 23.5 μg/m3) at Lykovrisi during a measurement period from September 2005 to August 2006 [61]. At an experimental campaign of PM levels in Agia Paraskevi from June 2003 to December 2008, Pateraki et al. (2010) found high annual average levels of PM2.5 ranging from 22.2 μg/m3 in 2003 to 16.9 μg/m3 in 2008 [62]. As for the THR AQMS, Thrakomakedones is a town located 16 km north of the Athens city center in a slightly urbanized area. So, the relatively low PM2.5 concentrations could be explained due to the absence of the intense anthropogenic activities.
Furthermore, ELE AQMS is located in the residential area of Elefsina, approximately 20 km to the west of Athens. Although this area is located in the industrialized basin of Thriassion Plain, which is a hub for the country’s industrial development with several industries and factories [63], the air pollution levels registered at ELE AQMS are relatively low compared to the other AQMS. This could be explained by the fact the AQMS is placed away from direct emission sources from the industries.

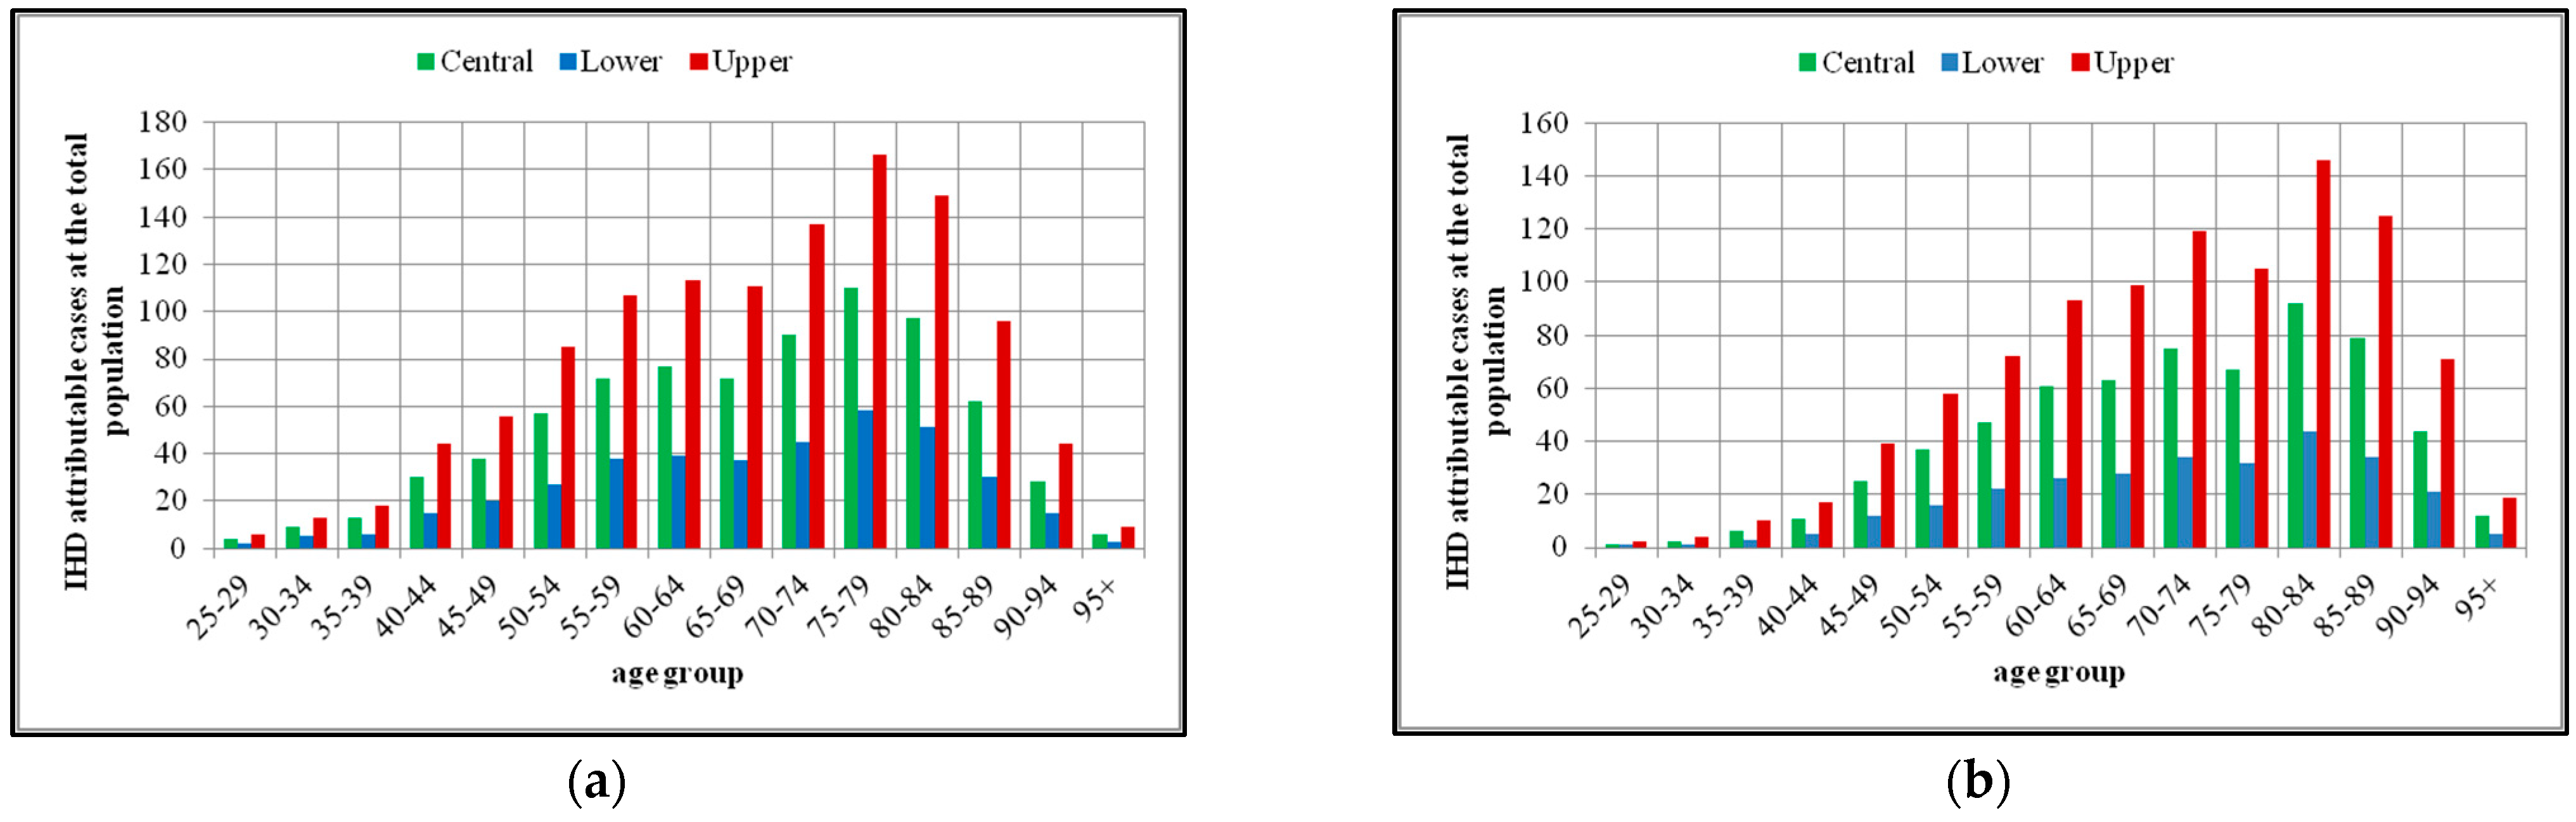
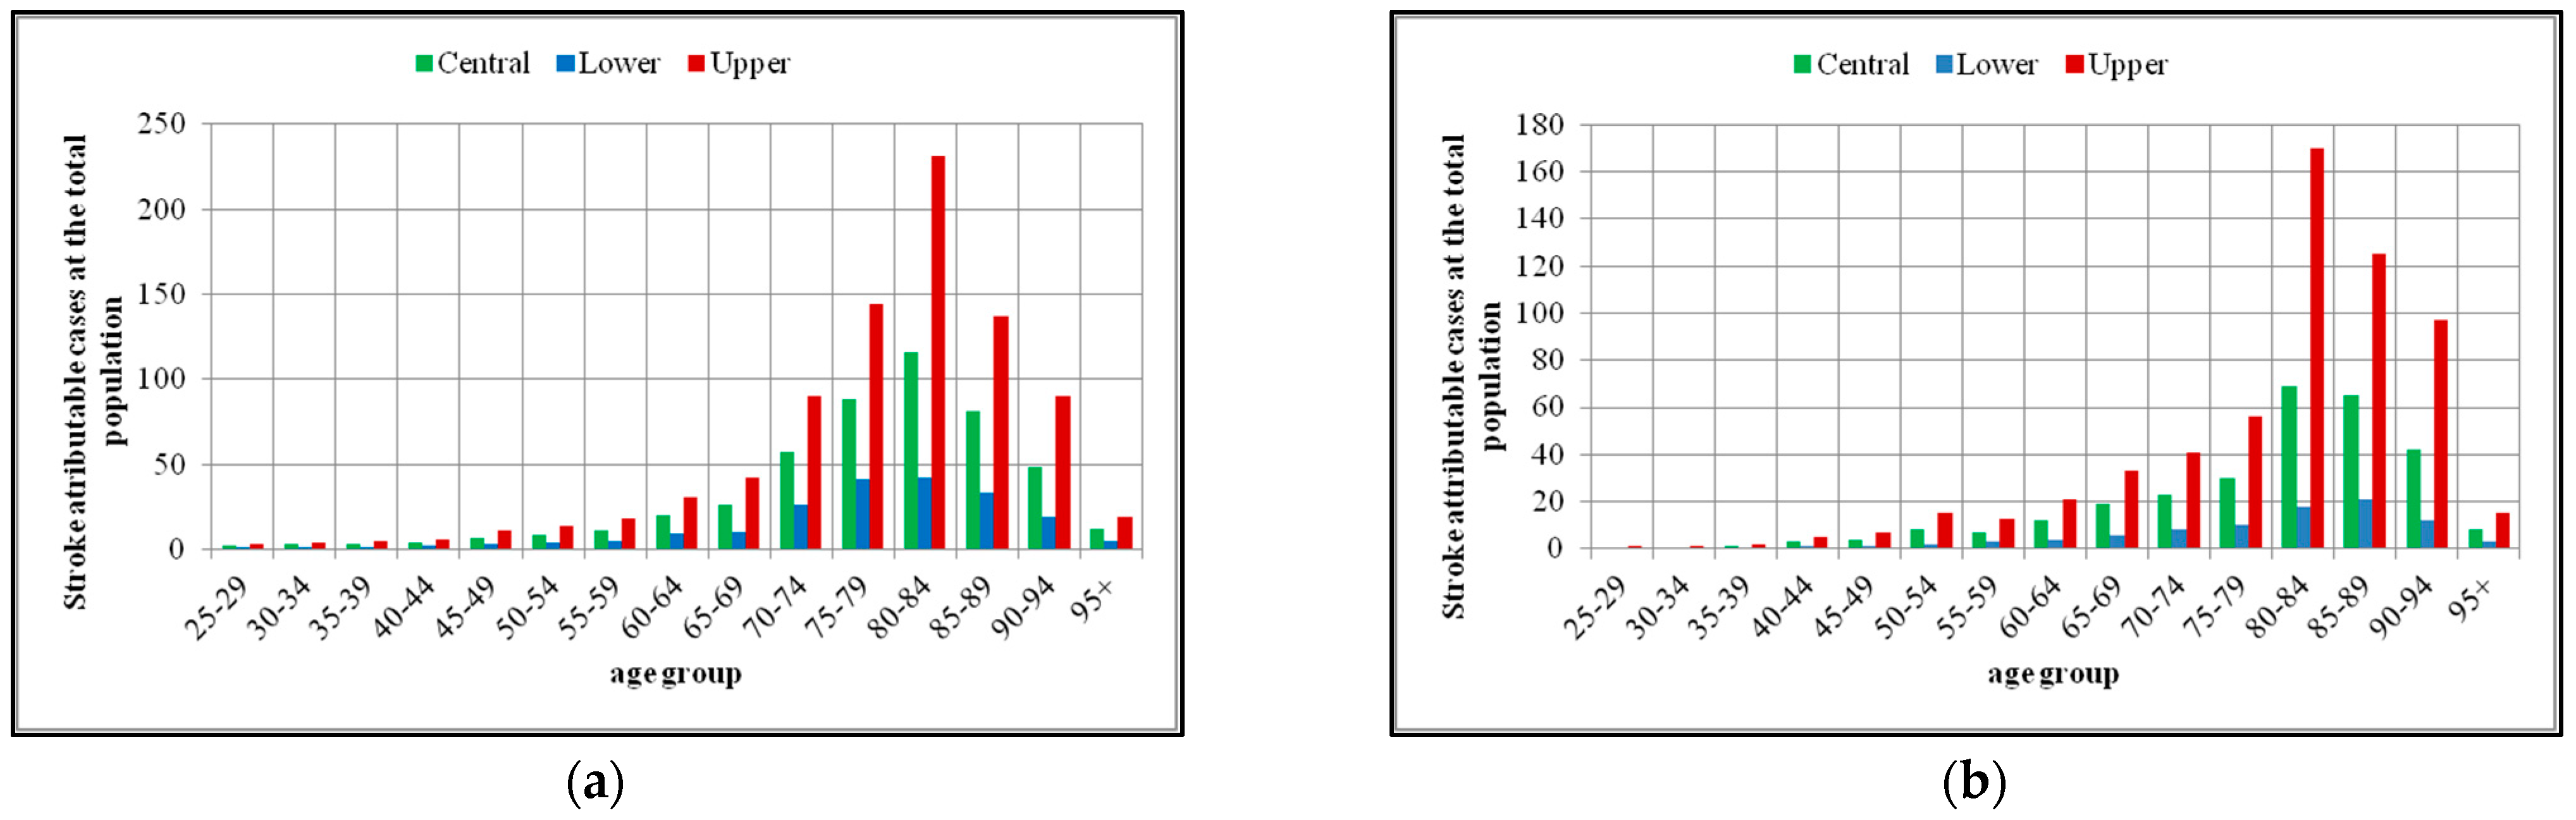
3.2. Mortality Attributed to the Exposure to PM2.5

The burden of mortality due to the exposure to PM2.5 were estimated by the AIRQ+ software considering the default RR values for the all-cause natural mortality cases and the integrated GBD 2015/2016 function for the COPD, lung cancer, IHD and stroke. Specifically, in the case that the cut-off value can be defined by the user, we used the value of 5 μg/m3, which represents the WHO annual mean PM2.5 AQG 2021 limit value. As for the GBD 2015/2016 function, the cut-off value is defined at 2.4 μg/m3 [64]. On the GBD study, a theoretical minimum risk exposure level (counterfactual level) is defined, which is the distribution of risk comprising the levels of exposure that minimize risk for each individual in the population. In the case of the exposure to PM2.5 concentrations, a uniform distribution between 2.4 and 5.9 μg/m³ was considered [64].
The total population and the population at risk in Attica Region was based on the demographic data for the estimated population on the 1st January for the years 2007 and 2018. The estimated total population was 3,982,602 inhabitants in 2007 and 3,756,453 inhabitants in 2018. Based on the national census data of 2011, the population above 25 years old and 30 years old is estimated at 75.44% and 68.22% of the total population, respectively. In general, there has been a decline over the study years in the total population in Attica Region, while the number of deaths has increased.
Table 4 displays the estimated health endpoints associated with the long-term exposure (annual exposure) to PM2.5 in Attica Region for the years 2007 and 2018. The annual-averaged concentration of PM2.5 for the Attica Region for each year was estimated by joining the annual mean PM2.5 concentrations recorded by the available AQMS (Table 3). In particular, the annual-averaged concentrations of PM2.5 for 2007 was 29.9 μg/m3 and 15.9 μg/m3 for 2018.
As we can see in Table 4, the mortality burden from all natural causes for the population above 30 years old attributed to PM2.5 exposure is 4752 [3179–6152] deaths in 2007 and 2424 [1598–3179] deaths in 2018. The attributable cases per 100,000 population at risk is 174.92 [117.00–226.43] deaths in 2007 and 94.59 [62.37–124.06] deaths in 2018. The attributable mortality burden decreased almost two-fold in 2018 compared with 2007 as the mean annual PM2.5 concentrations in Attica Region decreased from 29.9 to 15.9 μg/m3 in 2018. However, the total number of deaths from natural causes increased over the years, though the population in Attica Region declined. As for the specific causes of death, the total COPD annual deaths increased over the years, ranging from 630 deaths in 2007 to 916 deaths in 2018. It is worth mentioned that an increasing COPD prevalence rate and contradictory patterns in respiratory mortality are apparent in Greece during the last two decades which are associated with the economic crisis, the socioeconomic status and the smoking habits as well as the indoor and outdoor air pollution [65]. Although the annual mean PM2.5 concentrations decreased over the study years, the estimated number of COPD attributable cases to PM2.5 exposure (at the total population) are 146 [79–220] deaths in 2007 and 147 [63–244] deaths in 2018. For the population at risk (people above 25 years old), the attributable cases are 4.87 [2.64–7.33] deaths in 2007 and 5.20 [2.24–8.60] in 2018.
In addition, the total number of deaths from lung cancer increased over the years, with a baseline incidence in mortality rates from lung cancer (for people above 25 years old) ranging from 2010 deaths in 2007 to 2472 deaths in 2018. The attributed cases of lung cancer to PM2.5 exposure (at the total population) are 327 [189–477] deaths in 2007 and 238 [121–381] deaths in 2018, whereas at the population at risk the cases are 10.89 [6.28–15.86] deaths in 2007 and 8.40 [4.28–13.43] deaths in 2018. Generally, lung cancer is the most common cause of cancer-related deaths in Europe; in Greece, it is the leading cause of cancer-related deaths among men and the second leading cause of cancer-related deaths among women [66]. It is well-known that the air pollution is one of the risk factors of lung cancer with studies conducted in Athens, Greece, showing strong associations among air pollution, smoking and lung cancer incidence [67].
As for the mortality from IHD, there is relative increase in baseline mortality in Attica Region. In general, Greece is one of the European Union member states that is at the top of the list of deaths due to ischemic heart disease, which can be attributed to independent factors, such as the prevalence of hypertension or even the economic crisis [68]. As we can see from Table 4, the IHD attributable cases to PM2.5 exposure are 765 [391–1154] deaths in 2007 and 622 [284–979] deaths in 2018 in the total population. As for the IHD attributable cases at the population at risk, 25.46 [13.01–38.41] deaths are attributed to PM2.5 exposure in 2007 and 21.95 [10.02–34.55] deaths are attributed to PM2.5 exposure in 2018. There is a relative decrease in the attributable deaths at the total population, but there is a substantial increase in death rates in people above 85 years old (Figure 3).
Regarding the mortality from stroke associated with the long-term exposure to PM2.5, the analysis revealed a considerable decline in deaths ranging from 486 [202–845] deaths in 2007 to 291 [89–602] deaths in 2018. For the population at risk, the mortality cases are 16.18 [6.72–28.12] deaths in 2007 and 10.27 [3.14–21.24] deaths in 2018 that are attributed to PM2.5 exposure. The decrease in attributable deaths is also obvious in different age groups, especially for the age groups from 70 to 84 years old (Figure 4). The decline could not merely be attributed to the lower levels of particle pollution because the baseline incidence in mortality from stroke has greatly decreased over the 12-year study period. Specifically, the total mortality from stroke (in population above 25 years old) in Attica Region was 4425 deaths in 2007 and 3560 deaths in 2018. The decline in mortality seems to be apparent in the age groups below 79 years old, while above 80 years old, the mortality rates are relatively constant. Prior studies have found a decline in stroke mortality at the global level with the major decline in stroke mortality seen among people <65 years of age [69]. Lackland et al. (2014) mentioned several factors (e.g., technological advances, medical treatment and control, the use of aspirin and other antiplatelet drugs) that contribute to the decline in stroke mortality rates, as well as highlighting the role of air pollution [69]. In particular, with reference to the United States, they mentioned that the Clean Air Act and the implementation and periodic revision of ambient air quality standards have greatly decreased the levels of PM which is well-known to be linked with cardiovascular diseases [69]. The decline in stoke was also reported in Southern Greece based on data from first-ever stroke cases from the years 1993–1995, 2004 and 2015–2016 [70].
A number of scientific studies, worldwide, have investigated the mortality and morbidity associated with exposure to air pollutants by using the AirQ 2.2.3 software or AirQ+ software [52]. In Greece, the AirQ 2.2.3 software has been used by Moustris et al. (2016) [36], Ntourou et al. (2017) [37] and Moustris et al. (2017) [38]. Specifically, Moustris et al. (2016) found that the excess number of hospital admissions due to respiratory diseases attributed to PM10 exposure (mean annual PM10 concentration: 41.2 μg/m3) in Volos City, Greece, were 32 cases per 100,000 inhabitants [36]. Additionally, the study performed in the Greater Athens Area, Greece, revealed that the mean annual hospital admissions due to respiratory diseases associated with the exposure to PM10 exposure ranged between 20 cases (in suburban areas) and 40 cases (in the city centre of Athens) per 100,000 population at risk [38].
Amoatey et al. (2020) estimated the number of excess mortality cases attributed to the long-term exposure to PM2.5 in Rome, Italy, during the year 2014 [71]. Their analysis shows that the corresponding number of deaths for ischemic heart disease, chronic obstructive pulmonary disease, lung cancer and stroke was 55.1 (25.8–81.43), 16.8 (7.2–30), 2.1 (1.1–3.3) and 13.9 (4.5–23.9) deaths per 100,000 inhabitants, respectively [71]. Another study performed by the AirQ+ software estimated the non-accidental, cardiovascular and respiratory mortality attributed to PM10 in three cities in Serbia during a 5-year period from 2011–2015 [72]. For instance, in Novi Sad, Serbia, the annual mortality rate associated with the exposure to PM10 (PM10(annual average) = 34.8 μg/m3) was 16 (10–20) deaths per 100,000 inhabitants [72]. Moreover, the AirQ+ software was applied by Rovira et al. (2020) in Catolonia, Spain, for a 13-year period, from 2005 to 2016 [73]. They found that the number of excess deaths from all natural causes due to the exposure to PM2.5 ranged from 297 excess deaths in 2005 to 23 excess deaths in 2016 [73]. A study conducted in Bengaluru, India, studied the health impacts due to long-term PM2.5 exposure using the AirQ+ software and found 3393 [1466–5095] deaths from IHD and 1016 [463–1605] deaths from stroke indicating age differences in mortality rates [74]. Additionally, PM2.5 exposure was responsible for 3413 [1888–5035] deaths from COPD [74].
The results of this study are consistent with the aforementioned published research works. There are some limitations that must be noted. Firstly, there are only available data for PM2.5 from six AQMS in Attica Region and only three AQMS recorded the concentration levels of PM2.5 from 2007. Secondly, the RR values and the GBD function used in order to estimate the health outcomes were derived from epidemiological studies conducted in other countries. However, the RR values were obtained from meta-analyses of various studies, so this reduces the population-specific variations. Thirdly, there are methodological differences in the exposure assessment used amongst the epidemiological research, and the model calculations do not account for multiple exposure cases or multipollutant scenarios [75]. On the other hand, in this study, regional-level and age-specific baseline mortality data were used. So, this is one of its strengths because the mortality rates may vary across regions within the same country, from year to year and among different age groups.

4. Conclusions

In this study, an analysis of the impact of PM2.5 on specific causes of mortality in Attica Region was performed. The assessment of the burden of mortality from the long-term exposure to PM2.5 was based on the annual average concentrations. The analysis was performed with the AIRQ+ software, which is one of the most suitable tools for the quantification of the deterministic effects of air pollution on human health. The statistical analysis shows that the annual average concentrations of PM2.5 levels for the period 2007–2018 constantly exceeded the AQG limit values established by the WHO in 2021 in order to protect human health. Therefore, the health impact assessment revealed a considerable burden of mortality cases attributed to long-term exposure to PM2.5. With respect to the results of this study, the burden of mortality (from all-natural causes) associated with PM2.5 exposure was 4752 [3179–6152] deaths in 2007 and 2424 [1598–3179] deaths in 2018. These results can be used by policy makers to improve public health in terms of environmental health management. It is well-known that air quality management plays a key role in shaping country’s environmental policy, especially in the era of global environmental crisis. Nowadays, most countries have environmental policies and government structures to address environmental problems, but their success depends on several factors. Not only the environmental monitoring of the air quality and the knowledge of the current state of air pollution can be used to alleviate the problem, but also the implementation of air pollution health impact assessment should be incorporated in these policies, plans or programs. This can prevent air pollution and reduce or even minimize the burden of related diseases.

Author Contributions

P.B.: Methodology, Software, Data curation, Formal analysis, Writing—original draft, Review and Editing. P.K.: Supervision. All authors have read and agreed to the published version of the manuscript.

Funding

This research received no external funding.

Institutional Review Board Statement

Not applicable.

Informed Consent Statement

Not applicable.

Data Availability Statement

The datasets generated during and/or analyzed during the current study are available from the corresponding author on reasonable request.

Conflicts of Interest

The authors declare no conflict of interest.

References

  1. Manisalidis, I.; Stavropoulou, E.; Stavropoulos, A.; Bezirtzoglou, E. Environmental and Health Impacts of Air Pollution: A Review. Front. Public Health 2020, 8, 14. [Google Scholar] [CrossRef] [PubMed] [Green Version]
  2. Fuller, R.; Landrigan, P.J.; Balakrishnan, K.; Bathan, G.; Bose-O’Reilly, S.; Brauer, M.; Caravanos, J.; Chiles, T.; Cohen, A.; Corra, L.; et al. Pollution and health: A progress update. Lancet Planet. Health 2022, 6, e535–e547. [Google Scholar] [CrossRef] [PubMed]
  3. Rajagopalan, S.; Al-Kindi, S.G.; Brook, R.D. Air Pollution and Cardiovascular Disease: JACC State-of-the-Art Review. J. Am. Coll. Cardiol. 2018, 72, 2054–2070. [Google Scholar] [CrossRef]
  4. Guevara, M. Emissions of Primary Particulate Matter. In Airborne Particulate Matter: Sources, Atmospheric Processes and Health; Royal Society of Chemsitry: London, UK, 2016; pp. 1–34. [Google Scholar] [CrossRef]
  5. Singh, K.; Tripathi, D. Particulate Matter and Human Health. In Environmental Health; IntechOpen: London, UK, 2021. [Google Scholar] [CrossRef]
  6. Miller, M.R.; Newby, D.E. Air pollution and cardiovascular disease: Car sick. Cardiovasc. Res. 2020, 116, 279–294. [Google Scholar] [CrossRef]
  7. Espitia-Pérez, L.; Jiménez-Vidal, L.; Espitia-Pérez, P. Particulate Matter Exposure: Genomic Instability, Disease, and Cancer Risk. In Environmental Health—Management and Prevention Practices; IntechOpen: London, UK, 2019. [Google Scholar] [CrossRef] [Green Version]
  8. Brown, J.S.; Gordon, T.; Price, O.; Asgharian, B. Thoracic and respirable particle definitions for human health risk assessment. Part. Fibre Toxicol. 2013, 10, 12. [Google Scholar] [CrossRef] [PubMed] [Green Version]
  9. Pope, C.A., 3rd; Coleman, N.; Pond, Z.A.; Burnett, R.T. Fine particulate air pollution and human mortality: 25+ years of cohort studies. Environ. Res. 2020, 183, 108924. [Google Scholar] [CrossRef]
  10. Wu, X.; Zhu, B.; Zhou, J.; Bi, Y.; Xu, S.; Zhou, B. The epidemiological trends in the burden of lung cancer attributable to PM2.5 exposure in China. BMC Public Health 2021, 21, 737. [Google Scholar] [CrossRef]
  11. Strak, M.; Weinmayr, G.; Rodopoulou, S.; Chen, J.; de Hoogh, K.; Andersen, Z.J.; Atkinson, R.; Bauwelinck, M.; Bekkevold, T.; Bellander, T.; et al. Long term exposure to low level air pollution and mortality in eight European cohorts within the ELAPSE project: Pooled analysis. BMJ 2021, 374, n1904. [Google Scholar] [CrossRef]
  12. Dockery, D.W.; Pope, C.A., 3rd; Xu, X.; Spengler, J.D.; Ware, J.H.; Fay, M.E.; Ferris, B.G., Jr.; Speizer, F.E. An association between air pollution and mortality in six U.S. cities. New Engl. J. Med. 1993, 329, 1753–1759. [Google Scholar] [CrossRef] [Green Version]
  13. Pope, C.A., 3rd; Thun, M.J.; Namboodiri, M.M.; Dockery, D.W.; Evans, J.S.; Speizer, F.E.; Heath, C.W., Jr. Particulate air pollution as a predictor of mortality in a prospective study of U.S. adults. Am. J. Respir. Crit. Care Med. 1995, 151, 669–674. [Google Scholar] [CrossRef]
  14. Colonna, K.J.; Koutrakis, P.; Kinney, P.L.; Cooke, R.M.; Evans, J.S. Mortality Attributable to Long-Term Exposure to Ambient Fine Particulate Matter: Insights from the Epidemiologic Evidence for Understudied Locations. Environ. Sci. Technol. 2022, 56, 6799–6812. [Google Scholar] [CrossRef] [PubMed]
  15. Yu, Y.; Sun, Q.; Li, T.; Ren, X.; Lin, L.; Sun, M.; Duan, J.; Sun, Z. Adverse outcome pathway of fine particulate matter leading to increased cardiovascular morbidity and mortality: An integrated perspective from toxicology and epidemiology. J. Hazard. Mater. 2022, 430, 128368. [Google Scholar] [CrossRef] [PubMed]
  16. Lee, S.; Lee, W.; Kim, D.; Kim, E.; Myung, W.; Kim, S.-Y.; Kim, H. Short-term PM2.5 exposure and emergency hospital admissions for mental disease. Environ. Res. 2019, 171, 313–320. [Google Scholar] [CrossRef] [PubMed]
  17. Li, T.; Guo, Y.; Liu, Y.; Wang, J.; Wang, Q.; Sun, Z.; He, M.Z.; Shi, X. Estimating mortality burden attributable to short-term PM2.5 exposure: A national observational study in China. Environ. Int. 2019, 125, 245–251. [Google Scholar] [CrossRef] [PubMed]
  18. Orellano, P.; Reynoso, J.; Quaranta, N.; Bardach, A.; Ciapponi, A. Short-term exposure to particulate matter (PM10 and PM2.5), nitrogen dioxide (NO2), and ozone (O3) and all-cause and cause-specific mortality: Systematic review and meta-analysis. Environ. Int. 2020, 142, 105876. [Google Scholar] [CrossRef] [PubMed]
  19. Sawada, N.; Nakaya, T.; Kashima, S.; Yorifuji, T.; Hanibuchi, T.; Charvat, H.; Yamaji, T.; Iwasaki, M.; Inoue, M.; Iso, H.; et al. Long-term exposure to fine particle matter and all-cause mortality and cause-specific mortality in Japan: The JPHC Study. BMC Public Health 2022, 22, 466. [Google Scholar] [CrossRef] [PubMed]
  20. Ciabattini, M.; Rizzello, E.; Lucaroni, F.; Palombi, L.; Boffetta, P. Systematic review and meta-analysis of recent high-quality studies on exposure to particulate matter and risk of lung cancer. Environ. Res. 2021, 196, 110440. [Google Scholar] [CrossRef]
  21. Khosravipour, M.; Safari-Faramani, R.; Rajati, F.; Omidi, F. The long-term effect of exposure to respirable particulate matter on the incidence of myocardial infarction: A systematic review and meta-analysis study. Environ. Sci. Pollut. Res. 2022, 29, 42347–42371. [Google Scholar] [CrossRef]
  22. Adamkiewicz, Ł.; Maciejewska, K.; Rabczenko, D.; Drzeniecka-Osiadacz, A. Ambient Particulate Air Pollution and Daily Hospital Admissions in 31 Cities in Poland. Atmosphere 2022, 13, 345. [Google Scholar] [CrossRef]
  23. Stafoggia, M.; Oftedal, B.; Chen, J.; Rodopoulou, S.; Renzi, M.; Atkinson, R.W.; Bauwelinck, M.; Klompmaker, J.O.; Mehta, A.; Vienneau, D.; et al. Long-term exposure to low ambient air pollution concentrations and mortality among 28 million people: Results from seven large European cohorts within the ELAPSE project. Lancet Planet. Health 2022, 6, e9–e18. [Google Scholar] [CrossRef]
  24. Heinrich, J. Air pollutants and primary allergy prevention. Allergo J. Int. 2019, 28, 5–15. [Google Scholar] [CrossRef] [Green Version]
  25. Li, S.; Wu, W.; Wang, G.; Zhang, X.; Guo, Q.; Wang, B.; Cao, S.; Yan, M.; Pan, X.; Xue, T.; et al. Association between exposure to air pollution and risk of allergic rhinitis: A systematic review and meta-analysis. Environ. Res. 2022, 205, 112472. [Google Scholar] [CrossRef]
  26. Makri, A.; Stilianakis, N.I. Vulnerability to air pollution health effects. Int. J. Hyg. Environ. Health 2008, 211, 326–336. [Google Scholar] [CrossRef] [PubMed]
  27. Yazdi, M.D.; Wang, Y.; Di, Q.; Wei, Y.; Requia, W.J.; Shi, L.; Sabath, M.B.; Dominici, F.; Coull, B.A.; Evans, J.S.; et al. Long-Term Association of Air Pollution and Hospital Admissions Among Medicare Participants Using a Doubly Robust Additive Model. Circulation 2021, 143, 1584–1596. [Google Scholar] [CrossRef] [PubMed]
  28. Available online: https://www.who.int/europe/tools-and-toolkits/airq---software-tool-for-health-risk-assessment-of-air-pollution (accessed on 1 March 2022).
  29. Samek, L. Overall human mortality and morbidity due to exposure to air pollution. Int. J. Occup. Med. Environ. Health 2016, 29, 417–426. [Google Scholar] [CrossRef]
  30. De Marco, A.; Amoatey, P.; Khaniabadi, Y.O.; Sicard, P.; Hopke, P.K. Mortality and morbidity for cardiopulmonary diseases attributed to PM2.5 exposure in the metropolis of Rome, Italy. Eur. J. Intern. Med. 2018, 57, 49–57. [Google Scholar] [CrossRef]
  31. Pala, K.; Aykac, N.; Yasin, Y. Premature deaths attributable to long-term exposure to PM2.5 in Turkey. Environ. Sci. Pollut. Res. 2021, 28, 51940–51947. [Google Scholar] [CrossRef]
  32. Brito, J.; Bernardo, A.; Gonçalves, L.L. Atmospheric pollution and mortality in Portugal: Quantitative assessment of the environmental burden of disease using the AirQ+ model. Sci. Total Environ. 2022, 815, 152964. [Google Scholar] [CrossRef] [PubMed]
  33. Ravindra, K.; Singh, T.; Mor, S. Preventable mortality attributable to exposure to air pollution at the rural district of Punjab, India. Environ. Sci. Pollut. Res. 2022, 29, 32271–32278. [Google Scholar] [CrossRef] [PubMed]
  34. Orru, H.; Olstrup, H.; Kukkonen, J.; López-Aparicio, S.; Segersson, D.; Geels, C.; Tamm, T.; Riikonen, K.; Maragkidou, A.; Sigsgaard, T.; et al. Health impacts of PM2.5 originating from residential wood combustion in four nordic cities. BMC Public Health 2022, 22, 1286. [Google Scholar] [CrossRef]
  35. Soleimani, M.; Akbari, N.; Saffari, B.; Haghshenas, H. Health effect assessment of PM2.5 pollution due to vehicular traffic (case study: Isfahan). J. Transp. Health 2022, 24, 101329. [Google Scholar] [CrossRef]
  36. Moustris, K.P.; Proias, G.T.; Larissi, I.K.; Nastos, P.T.; Koukouletsos, K.V.; Paliatsos, A.G. Health impacts due to particulate air pollution in Volos City, Greece. J. Environ. Sci. Health. Part A Toxic/Hazard. Subst. Environ. Eng. 2016, 51, 15–20. [Google Scholar] [CrossRef] [PubMed]
  37. Ntourou, K.; Moustris, K.P.; Giannouli, M.; Nastos, P.T.; Paliatsos, A.G. Estimation of Hospital Admissions Respiratory Disease Attributed to PM10 Exposure Using the AirQ Model Within the Greater Athens Area. In Perspectives on Atmospheric Sciences. Springer Atmospheric Sciences; Karacostas, T., Bais, A., Nastos, P., Eds.; Springer: Cham, Switzerland, 2017. [Google Scholar] [CrossRef]
  38. Moustris, K.P.; Ntourou, K.; Nastos, P.T. Estimation of Particulate Matter Impact on Human Health within the Urban Environment of Athens City, Greece. Urban Sci. 2017, 1, 6. [Google Scholar] [CrossRef] [Green Version]
  39. Touloumi, G.; Samoli, E.; Katsouyanni, K. Daily mortality and "winter type" air pollution in Athens, Greece--a time series analysis within the APHEA project. J. Epidemiology Community Health 1996, 50 (Suppl. 1), s47–s51. [Google Scholar] [CrossRef] [PubMed] [Green Version]
  40. Economopoulou, A.A.; Economopoulos, A.P. Air pollution in Athens basin and health risk assessment. Environ. Monit. Assess. 2002, 80, 277–299. [Google Scholar] [CrossRef]
  41. Tzima, K.; Analitis, A.; Katsouyanni, K.; Samoli, E. Has the risk of mortality related to short-term exposure to particles changed over the past years in Athens, Greece? Environ. Int. 2018, 113, 306–312. [Google Scholar] [CrossRef]
  42. Kasdagli, M.-I.; Katsouyanni, K.; de Hoogh, K.; Lagiou, P.; Samoli, E. Associations of air pollution and greenness with mortality in Greece: An ecological study. Environ. Res. 2021, 196, 110348. [Google Scholar] [CrossRef]
  43. Kasdagli, M.-I.; Katsouyanni, K.; de Hoogh, K.; Lagiou, P.; Samoli, E. Investigating the association between long-term exposure to air pollution and greenness with mortality from neurological, cardio-metabolic and chronic obstructive pulmonary diseases in Greece. Environ. Pollut. 2022, 292, 118372. [Google Scholar] [CrossRef]
  44. Paliatsos, A.G.; Nastos, T.P. Relation between air pollution episodes and discomfort index in the greater Athens area, Greece. Glob. Nest J. 1999, 1, 91–97. [Google Scholar] [CrossRef]
  45. Larissi, I.K.; Koukouletsos, K.V.; Moustris, K.P.; Antoniou, A.; Paliatsos, A.G. PM10 concentration levels in the Greater Athens area, Greece. Fresenius Environ. Bull. 2010, 19, 226–231. [Google Scholar]
  46. Sindosi, O.A.; Katsoulis, B.D.; Bartzokas, A. An objective definition of air mass types affecting athens, greece; The corresponding atmospheric pressure patterns and air pollution levels. Environ. Technol. 2003, 24, 947–962. [Google Scholar] [CrossRef] [PubMed]
  47. Valavanidis, A.; Vlachogianni, T.L.S.; Fiotakis, C. Atmospheric Pollution in Urban Areas of Greece and Economic Crisis. Trends in Air Quality and Atmospheric Pollution Data, Research and Adverse Health Effects; Department of Chemistry, University of Athens: Athens, Greece, 2015; Volume 1, pp. 1–27. Available online: www.chem.uoa.gr (accessed on 1 March 2022).
  48. Manalis, N.; Grivas, G.; Protonotarios, V.; Moutsatsou, A.; Samara, C.; Chaloulakou, A. Toxic metal content of particulate matter (PM10), within the Greater Area of Athens. Chemosphere 2005, 60, 557–566. [Google Scholar] [CrossRef] [PubMed]
  49. ACEA Report. Vehicles in use Europe 2022. Available online: https://www.acea.auto/files/ACEA-report-vehicles-in-use-europe-2022.pdf (accessed on 1 October 2022).
  50. Directive 2008/50/EC of the European Parliament and of the Council of 21 May 2008 on Ambient Air Quality and Cleaner Air for Europe. Available online: https://eur-lex.europa.eu/eli/dir/2008/50/oj?locale=en (accessed on 9 October 2022).
  51. Krzyzanowski, M.; Apte, J.; Bonjour, S.P.; Brauer, M.; Cohen, A.J.; Prüss-Ustun, A.M. Air Pollution in the Mega-cities. Curr. Environ. Health Rep. 2014, 1, 185–191. [Google Scholar] [CrossRef] [Green Version]
  52. Conti, G.O.; Heibati, B.; Kloog, I.; Fiore, M.; Ferrante, M. A review of AirQ Models and their applications for forecasting the air pollution health outcomes. Environ. Sci. Pollut. Res. 2017, 24, 6426–6445. [Google Scholar] [CrossRef] [PubMed]
  53. World Health Organization. WHO Global Air Quality Guidelines: Particulate Matter (PM2.5 and PM10), Ozone, Nitrogen Dioxide, Sulfur Dioxide and Carbon Monoxide; World Health Organization: Geneva, Switzerland, 2021; Available online: https://apps.who.int/iris/handle/10665/345329 (accessed on 1 October 2022).
  54. Moustris, K.P.; Petraki, E.; Ntourou, K.; Priniotakis, G.; Nikolopoulos, D. Spatiotemporal Evaluation of PM10 Concentrations within the Greater Athens Area, Greece. Trends, Variability and Analysis of a 19 Years Data Series. Environments 2020, 7, 85. [Google Scholar] [CrossRef]
  55. Gratsea, M.; Liakakou, E.; Mihalopoulos, N.; Adamopoulos, A.; Tsilibari, E.; Gerasopoulos, E. The combined effect of reduced fossil fuel consumption and increasing biomass combustion on Athens’ air quality, as inferred from long term CO measurements. Sci. Total. Environ. 2017, 592, 115–123. [Google Scholar] [CrossRef]
  56. Saffari, A.; Daher, N.; Samara, C.; Voutsa, D.; Kouras, A.; Manoli, E.; Karagkiozidou, O.; Vlachokostas, C.; Moussiopoulos, N.; Shafer, M.M.; et al. Increased Biomass Burning Due to the Economic Crisis in Greece and Its Adverse Impact on Wintertime Air Quality in Thessaloniki. Environ. Sci. Technol. 2013, 47, 13313–13320. [Google Scholar] [CrossRef]
  57. Santamouris, M.; Paravantis, J.A.; Founda, D.; Kolokotsa, D.; Michalakakou, P.; Papadopoulos, A.M.; Kontoulis, N.; Tzavali, A.; Stigka, E.K.; Ioannidis, Z.; et al. Financial crisis and energy consumption: A household survey in Greece. Energy Build. 2013, 65, 477–487. [Google Scholar] [CrossRef]
  58. Vrekoussis, M.; Richter, A.; Hilboll, A.; Burrows, J.P.; Gerasopoulos, E.; Lelieveld, J.; Barrie, L.; Zerefos, C.; Mihalopoulos, N. Economic crisis detected from space: Air quality observations over Athens/Greece. Geophys. Res. Lett. 2013, 40, 458–463. [Google Scholar] [CrossRef]
  59. Liakakou, E.; Panopoulou, A.; Grivas, G.; Kritikou, T.; Panagopoulos, P.; Maggos, T.; Gerasopoulos, E.; Sauvage, S.; Mihalopoulos, N. Variability and sources of NMHCs at a coastal urban location in the Piraeus Port, Greece. Atmospheric Pollut. Res. 2022, 13, 101386. [Google Scholar] [CrossRef]
  60. Requia, W.J.; Higgins, C.; Adams, M.D.; Mohamed, M.; Koutrakis, P. The health impacts of weekday traffic: A health risk assessment of PM2.5 emissions during congested periods. Environ. Int. 2018, 111, 164–176. [Google Scholar] [CrossRef] [PubMed]
  61. Theodosi, C.; Grivas, G.; Zarmpas, P.; Chaloulakou, A.; Mihalopoulos, N. Mass and chemical composition of size-segregated aerosols (PM1, PM2.5, PM10) over Athens, Greece: Local versus regional sources. Atmospheric Chem. Phys. 2011, 11, 11895–11911. [Google Scholar] [CrossRef] [Green Version]
  62. Pateraki, S.; Asimakopoulos, D.; Maggos, T.; Vasilakos, C. Particulate matter levels in a suburban Mediterranean area: Analysis of a 53-month long experimental campaign. J. Hazard. Mater. 2010, 182, 801–811. [Google Scholar] [CrossRef]
  63. Mavrakis, A.; Lykoudis, S.; Christides, A.; Dasaklis, S.; Tasopoulos, A.; Theoharatos, G.; Kyvelou, S.; Verouti, E. Air quality levels in a closed industrialized basin (Thriassion Plain, Greece). Fresenius Environ. Bull. 2008, 17, 443–454. [Google Scholar]
  64. GBD 2016 Risk Factors Collaborators. Global, regional, and national comparative risk assessment of 84 behavioural, environmental and occupational, and metabolic risks or clusters of risks, 1990–2016: A systematic analysis for the Global Burden of Disease Study 2016. Lancet 2017, 390, 1345–1422. [Google Scholar] [CrossRef] [Green Version]
  65. Kotsiou, O.S.; Zouridis, S.; Kosmopoulos, M.; Gourgoulianis, K.I. Impact of the financial crisis on COPD burden: Greece as a case study. Eur. Respir. Rev. 2018, 27, 170106. [Google Scholar] [CrossRef] [Green Version]
  66. Syrigos, K.N.; Georgoulias, V.; Zarogoulidis, K.; Makrantonakis, P.; Charpidou, A.; Christodoulou, C. Epidemiological Characteristics,EGFRStatus and Management Patterns of Advanced Non-small Cell Lung Cancer Patients: The Greek REASON Observational Registry Study. Anticancer Res. 2018, 38, 3735–3744. [Google Scholar] [CrossRef]
  67. Katsouyanni, K.; Trichopoulos, D.; Kalandidi, A.; Tomos, P.; Riboli, E. A case-control study of air pollution and tobacco smoking in lung cancer among women in Athens. Prev. Med. 1991, 20, 271–278. [Google Scholar] [CrossRef]
  68. Michas, G.; Karvelas, G.; Trikas, A. Cardiovascular disease in Greece; the latest evidence on risk factors. Hell. J. Cardiol. HJC = Hell. Kardiol. Ep. 2019, 60, 271–275. [Google Scholar] [CrossRef]
  69. Lackland, D.T.; Roccella, E.J.; Deutsch, A.; Fornage, M.; George, M.G.; Howard, G.; Kissela, B.M.; Kittner, S.J.; Lichtman, J.H.; Lisabeth, L.D.; et al. Factors influencing the decline in stroke mortality: A statement from the American Heart Association/American Stroke Association. Stroke 2014, 45, 315–353. [Google Scholar] [CrossRef] [Green Version]
  70. Karantali, E.; Vemmos, K.; Tsampalas, E.; Xynos, K.; Karachalia, P.; Lambrou, D.; Angeloglou, S.; Kazakou, M.; Karagianni, A.; Aravantinou-Fatorou, K.; et al. Temporal trends in stroke incidence and case-fatality rates in Arcadia, Greece: A sequential, prospective, population-based study. Int. J. Stroke 2022, 17, 37–47. [Google Scholar] [CrossRef] [PubMed]
  71. Amoatey, P.; Sicard, P.; De Marco, A.; Khaniabadi, Y.O. Long-term exposure to ambient PM2.5 and impacts on health in Rome, Italy. Clin. Epidemiology Glob. Health 2010, 8, 531–535. [Google Scholar] [CrossRef] [Green Version]
  72. Todorović, M.N.; Radenković, M.B.; Rajšić, S.F.; Ignjatović, L.M. Evaluation of mortality attributed to air pollution in the three most populated cities in Serbia. Int. J. Environ. Sci. Technol. 2019, 16, 7059–7070. [Google Scholar] [CrossRef]
  73. Rovira, J.; Domingo, J.L.; Schuhmacher, M. Air quality, health impacts and burden of disease due to air pollution (PM10, PM2.5, NO2 and O3): Application of AirQ+ model to the Camp de Tarragona County (Catalonia, Spain). Sci. Total. Environ. 2020, 703, 135538. [Google Scholar] [CrossRef] [PubMed]
  74. Prabhu, V.; Singh, P.; Kulkarni, P.; Sreekanth, V. Characteristics and health risk assessment of fine particulate matter and surface ozone: Results from Bengaluru, India. Environ. Monit. Assess. 2022, 194, 211. [Google Scholar] [CrossRef] [PubMed]
  75. Hopke, P.K.; Nazari, S.S.H.; Hadei, M.; Yarahmadi, M.; Kermani, M.; Yarahmadi, E.; Shahsavani, A. Spatial and Temporal Trends of Short-Term Health Impacts of PM2.5 in Iranian Cities—A Modelling Approach (2013–2016). Aerosol Air Qual. Res. 2018, 18, 497–504. [Google Scholar] [CrossRef]
Figure 1. (a) Location map of Greece and (b) spatial coverage of the AQMS in Attica Region.
Atmosphere 13 02026 g001aAtmosphere 13 02026 g001b
Figure 2. Box and whisker plots with the mean, median and the interquartile range (IQR) of the daily 24 h average concentrations of PM2.5 at the six AQMS over the study periods.
Atmosphere 13 02026 g002
Figure 3. IHD mortality cases (at the total population) per age group attributable to PM2.5 exposure for (a) 2007 and (b) 2018.
Atmosphere 13 02026 g003
Figure 4. Stoke mortality cases (at the total population) per age group attributable to PM2.5 exposure for (a) 2007 and (b) 2018.
Atmosphere 13 02026 g004
Table 1. List of the air quality monitoring stations (AQMS) along with their geographical coordinates.
AQMS NameGeographical CoordinatesHeight (m a.s.l.) *Zone/Station Type
ARI
(Aristotelous)
37,98806675Urban-Traffic
23,727617
LYK
(Lykovrisi)
38,067793234Suburban-Background
23,788986
PIR
(Piraeus)
37,9446564Urban-Traffic
23,645230
AGP
(Agia Paraskevi)
37,995110290Suburban-Background
23,819421
ELE
(Elefsina)
38,05132220Suburban-Industrial
23,538432
THR
(Thrakomakedones)
38,143521550Suburban-Background
23,758195
* (m a.s.l.: meters above mean sea level).
Table 2. Health endpoints (mortality) handled by the AIRQ+ and used in this study.
Health Outcome DefinitionICD-10 Classification Codes Included
Mortality, all (natural) causes (adults 30+)A00-R99
Mortality, Chronic Obstructive Pulmonary Disease (COPD) (adults 30+)J40-J47
Mortality, Ischemic Heart Disease (IHD) (adults 25+)I20-I25
Mortality, Lung Cancer (LC) (adults 25+)C33-C34
Mortality, Stroke (adults 25+)I60-I69
Table 3. The annual average values and standard deviations of the daily 24 h average concentrations of PM2.5 at the six AQMS over the study periods (with (*) indicated the years with less than 59% of PM2.5 data capture).
YearPM2.5-PIRPM2.5-AGPPM2.5-LYKPM2.5-THRPM2.5-ARIPM2.5-ELE
200737.26 ± 15.2719.69 ± 9.6932.80 ± 16.64---
200828.52 ± 12.8219.10 ± 7.7229.54 ± 12.15---
200927.56 ± 11.4215.95 ± 7.8724.09 ± 10.01---
201022.21 ± 8.2214.56 ± 7.81 *22.59 ± 9.63---
201126.59 ± 11.31 *17.02 ± 5.7120.41 ± 8.79---
201223.42 ± 10.66 *14.61 ± 4.6022.11 ± 10.03---
201324.89 ± 7.76 *10.02 ± 3.7911.79 ± 7.59 *---
201419.83 ± 8.7811.18 ± 5.55 *15.73 ± 7.28 *---
201521.23 ± 14.5010.35 ± 4.6016.49 ± 13.9612.80 ± 4.0519.64 ± 15.2016.06 ± 7.89
201620.07 ± 10.6412.23 ± 5.9917.24 ± 9.8612.91 ± 6.0919.98 ± 11.4921.24 ± 8.76
201717.96 ± 9.7910.72 ± 3.9216.42 ± 9.2012.73 ± 4.4619.49 ± 10.4116.32 ± 6.23
201818.03 ± 8.9711.58 ± 5.3015.28 ± 7.8113.44 ± 5.1919.03 ± 9.9117.84 ± 7.28
Table 4. Health impact assessment for PM2.5 (all-natural causes, COPD, lung cancer, IHD and stroke).
Mortality, All-Natural Causes (30+ Years Old)Study Year
20072018
Population at risk2,716,9312,562,652
Baseline incidence34,16438,194
Estimated attributable proportion (at the total population)13.91% [9.30–18.01%]6.35% [4.18–8.32%]
Estimated number of attributable cases (at the total population)4752 [3179–6152]2424 [1598–3179]
Estimated number of attributable cases (per 100,000 population at risk)174.92 [117.00–226.43]94.59 [62.37–124.06]
Mortality, Chronic Obstructive Pulmonary Disease (COPD) (25+ years old)Study year
20072018
Population at risk3,004,4752,833,868
Baseline incidence630916
Estimated attributable proportion23.22% [12.60–34.93%]16.07% [6.92–26.62%]
Estimated number of attributable cases (at the total population)146 [79–220]147 [63–244]
Estimated number of attributable cases (per 100,000 population at risk)4.87 [2.64–7.33]5.20 [2.24–8.60]
Mortality, Lung Cancer (LC) (25+ years old)Study year
20072018
Population at risk3,004,4752,833,868
Baseline incidence20102472
Estimated attributable proportion16.28% [9.39–23.71%]9.63% [4.91–15.4%]
Estimated number of attributable cases (at the total population)327 [189–477]238 [121–381]
Estimated number of attributable cases (per 100,000 population at risk)10.89 [6.28–15.86]8.40 [4.28–13.43]
Mortality, Ischemic Heart Disease (IHD) (25+ years old)Study year
20072018
Population at risk3,004,4752,833,868
Baseline incidence45735062
Estimated attributable proportion20.89% [10.71–30.90]16.93% [7.66–25.95]
Estimated number of attributable cases (at the total population)765 [391–1154]622 [284–979]
Estimated number of attributable cases (per 100,000 population at risk)25.46 [13.01–38.41]21.95 [10.02–34.55]
Mortality, Stroke (25+ years old)Study year
20072018
Population at risk3,004,4752,833,868
Baseline incidence44253560
Estimated attributable proportion16.53% [7.19–26.56]15.07% [4.17–23.17]
Estimated number of attributable cases (at the total population)486 [202–845]291 [89–602]
Estimated number of attributable cases (per 100,000 population at risk)16.18 [6.72–28.12]10.27 [3.14–21.24]
Publisher’s Note: MDPI stays neutral with regard to jurisdictional claims in published maps and institutional affiliations.

