Article

Net Ecosystem CO2 Exchange in Mountain Grasslands Is Seriously Endangered by the Temperature Increase in the Eastern Pyrenees

by
Mercedes Ibañez
1,2,* and
Maria Teresa Sebastià
1,2
1
Laboratory of Functional Ecology and Global Change (ECOFUN), Forest Science and Technology Centre of Catalonia (CTFC), Ctra. de Sant Llorenç de Morunys, km 2, 25280 Solsona, Spain
2
GAMES Group, Department of Horticulture, Botany and Landscaping, School of Agrifood and Forestry Science and Engineering, University of Lleida (UdL). Avinguda Alcalde Rovira Roure, 191, 25198 Lleida, Spain
*
Author to whom correspondence should be addressed.
Atmosphere 2022, 13(12), 1980; https://doi.org/10.3390/atmos13121980
Submission received: 10 October 2022 / Revised: 23 November 2022 / Accepted: 23 November 2022 / Published: 27 November 2022
(This article belongs to the Special Issue Greenhouse Gas Emissions from Agricultural Activities)

Abstract

:
Mediterranean mountain grasslands, including the Pyrenees, are highly vulnerable to climate change, due to the increasing temperatures and heat weaves frequency, among other factors. However, the effects of the increased temperatures on CO2 fluxes in those ecosystems have been barley explored. To address this gap of knowledge, we established the FLUXPYR-ECOFUN micrometeorological flux network, which included three eddy covariance flux stations in grasslands along a management and a climatic gradient (montane to subalpine) at the Pyrenees; we aimed at assessing interactions among environmental and phenological drivers on CO2 fluxes, with special attention at the role of temperature as CO2 flux driver under the different climatic and management conditions across the studied gradient. Our results showed that temperature drove CO2 dynamics along the studied gradient in different ways. At the subalpine grassland net CO2 uptake was linearly enhanced by temperature and CO2 fluxes had not reached a temperature shifting point yet (according to the segmented linear models) at which the net uptake would become CO2 emissions. This suggests that in the short term, and under the incoming enhanced temperatures, sub-alpine grasslands in the Pyrenees might increase their net CO2 uptake, although the mid long-term uptake may be compromised. On the contrary, the montane grasslands already presented CO2 emissions at the highest temperatures, most likely driven by a decrease in the greenness and photosynthesis, which suggests that montane grasslands are expected to reduce their CO2 sink capacity under the increasing temperatures. Overall, mountain grasslands in the mid- to long-term in the Pyrenees may experience a reduction in their net CO2 uptake capacity under the current climate change scenario.

1. Introduction

Globally, two-thirds of agricultural lands are grasslands devoted to forage crops and/or direct grazing by livestock [1]. Nevertheless, the range of management and climatic conditions encompassed under the term grasslands is extremely wide, as well as the CO2 dynamics associated with each grassland type [2,3]. Similarly, the magnitude of the climate change effects may be widely heterogeneous, and the effects of the temperature increase on the CO2 fluxes will be particularly different for each grassland type.
In this regard, ecosystem scale CO2 fluxes of Mediterranean mountain grasslands, including those in the Pyrenees, have been barley explored, even though this a is a highly vulnerable area to climate change [4]. The mean annual temperature in the Pyrenees has already increased above the global average, and there has been an increase in the heatwave frequency [5]. Furthermore, the productivity of Mediterranean grasslands is already among the lowest in Europe [6], due to important water constraints in combination with the high temperatures [7], which are specially accused during the summer. All these factors are threatening the ecosystem services of Mediterranean mountain grasslands, especially those related to productivity, CO2 net uptake, and carbon storage [8,9].
However, while information on ecosystem scale CO2 fluxes of grasslands [2,10,11] and forage crops [12,13,14] of central and northern Europe is rather abundant, such information is very scarce in the context of Mediterranean mountains [4]. Indeed, the studies that have reported ecosystem scale CO2 fluxes from Mediterranean grasslands are generally from the lowland, dry grasslands, or oak savannas [15,16,17,18,19,20]. Those studies have highlighted the relevance of high temperatures and water availability as constrainers of CO2 fluxes in these systems, by decreasing both gross primary production but also ecosystem respiration. Mediterranean mountain grasslands are a priori less constrained by water availability and extremely high temperatures than lowland systems, but might be quite sensitive to temperature increases [21].
In this context, we aim at (1) assessing interactions among environmental and phenological drivers on CO2 fluxes along a climatic (from montane to sub-alpine) and management (intensive and extensive) gradient, with special attention to (2) unravelling the role of temperature as driver of the CO2 fluxes under the different climatic and management conditions across the studied gradient. For this, we used data from three eddy covariance flux stations of the Pyrenees, within the FLUXPYR project (https://ecofun.ctfc.cat/fluxpyr/eng/, accessed on 9 October 2022). The FLUXPYR project (2009–2012) established a European cross-border micrometeorological flux network for the determination and management of water, carbon and energy fluxes, and stocks in agricultural and grassland ecosystems of the Pyrenees. It is here that we present the first long-term (27 site years) dataset of ecosystem-scale CO2 fluxes from eddy covariance flux stations of the Pyrenees.

2. Materials and Methods

2.1. Study Sites

The study sites are three mountain grasslands distributed along a climatic (altitudinal) and a management gradient in the Eastern Pyrenees (Figure 1). Our study sites range from the montane (RIART, 1003 m a. s. l, and BERT, 1275 m a. s. l), to the sub-alpine (CAST 2000 m a. s. l.) zones. Traditionally, the montane sites are under a sub-Mediterranean climate, with warm summers and relatively mild winters, while the subalpine site has typical boreal climate, with rainy summers and cold winters (Figure 2 and Table 1). However, the climate is rapidly changing in the region. During the study period, which is approximately one decade, mean annual temperatures have already increased around 1.5 °C in our study sites, and although there is a certain interannual variability, the increasing tendency is clear (Figure 3).
Management regimes range from intensively to extensively managed (Table 1). RIART is the most intensively managed site, holding a mixed crop-livestock farming system, which combines the growth of annual forage crop species with direct grazing of beef cattle during the fallow period. Sown forage crop species alternate cereals grown in monoculture and cereal-legume mixtures, all of them sown and harvested annually [22]. On the other hand, BERT and CAST are extensively managed grasslands [23], seasonally grazed by cattle (BERT), and by cattle and sheep (CAST).

2.2. Eddy Covariance Measurements

The study sites were equipped with eddy covariance flux stations running since 2011 and we included in this study 27 site years. The eddy covariance flux stations continuously measured the concentration of CO2 (mmol m–3) and H2O (mmol m−3) using an open path CO2 and H2O gas analyser (LI-7500, LI-COR Inc., Lincoln, NE, USA) at the RIART study site, and a closed path CO2 and H2O gas analyser (LI-7200, LI-COR Inc., Lincoln, NE, USA) at BERT and CAST. The gas analysers were placed 2.35 m above the ground in the case of RIART, at 2.31 m in the case of BERT, and at 2.05 in the case of CAST. Turbulent flux components, including wind direction and wind speed, were measured at high-frequency (10 Hz) using a 3D sonic anemometer (CSAT-3, Campbell Scientific Inc., Logan, UT, USA) to calculate CO2, H2O, and energy exchange at the ecosystem level.
These stations record ancillary meteorological variables, including incoming and outgoing shortwave and longwave radiation (NR01, Hukseflux, Delft, The Netherlands), air temperature and relative humidity (CS215, Campbell Scientific Inc, Logan, UT, USA), photosynthetically active radiation (SKP215, Skye Instruments Ltd., Powys, UK), and normalized difference vegetation index. They are calculated as NDVI = (NIR − Red)/(NIR + Red), where “Red” and “NIR” are the spectral reflectance measurements acquired in the red and near infrared regions, respectively, measured with an NDVI sensor (S2-412-SS, Apogee Instruments, Inc., Logan, UT, USA).
We processed raw data provided by the sensors and calculated water fluxes and net ecosystem CO2 exchange (NEE) at 30 min averages using the EddyPro software (Eddy-Pro- 7.0.8, LI-COR Inc., Lincoln, NE, USA). The calculation of the fluxes involves the high-frequency data of wind speed and scalar atmospheric concentration. Fluxes are computed within a finite averaging time (30 min) from the covariance estimates between instantaneous deviations in vertical wind speed and gas concentration from their respective mean values Negative values refer to the flux from the atmosphere to the biosphere and positive values correspond to the flux from the biosphere to the atmosphere (micrometeorological sign convention). We applied frequency response corrections [25,26], density fluctuation corrections [27], and determination of data quality using the Foken et.al. (2004) approach [28]. The Foken et al. (2004) approach suggests a quality scale ranging from 1 (highest data quality) to 9 (poorest data quality), and we excluded records with quality 7 or higher [29]. Additionally, we rejected CO2 fluxes outside a physically realistic range of ±50 µmol m–2 s–1 [30].
We inspected the night-time (photosynthetically active radiation < 5 µmol photons m–2 s–1) NEE, as fluxes tend to be underestimated under low turbulence [31], a condition that can be frequent at night. We carefully examined the possibility of a low turbulence effect assessing the existence of an u* threshold at all recorded soil temperature classes in 1 °C intervals [32]. Relevant u* thresholds were not detected. In addition, we inspected night-time CO2 fluxes to detect possible outliers and calculated the 0.025, 0.25, 0.5, 0.75, and 0.975 quantiles for each soil temperature class. Data below the lowest (0.025) or the highest (0.975) quantile were excluded from further analysis.
The eddy covariance stations recorded net CO2 fluxes according to the corresponding footprints. The footprint was calculated based on the Kljun model [33] and we filtered the data according to the dimensions of the study areas, including all the fluxes in which more than 80% of the contribution came from the area of interest [34]. That footprint length (80%) was mostly within 250 m in RIART, within 150 m in BERT, and within 200 m in CAST. Afterwards, we gap-filled the NEE data using the sMDSGapFill function [32] of the REddyProc package [35] for R software (R version 4. 2.2, R Core Team, 2022, Vienna, Austria). Gap filled NEE data were also partitioned into gross primary production (GPP) and ecosystem respiration (Reco), according the night-time based partitioning approximation, using the SMRFLuxPartition equation, which also comes from the REddyProc package.

2.3. Data Analysis

We present interannual dynamics of daily accumulated CO2 fluxes of each studied site, including gap filled NEE and partitioned GPP and Reco along the studied years. Additionally, for each study site, we present and describe the intra-annual dynamics of mean daily cumulative NEE, environmental variables including ambient temperature (Ta), albedo, vapour pressure deficit (VPD), and the normalized vegetation index (NDVI), the latter as a proxy of phenological dynamics. Moreover, we assess the site-specific role of temperature as a driver of CO2 fluxes, of NDVI, and of evapotranspiration (ET, calculated using the high frequency data of wind speeds and water vapor mixing ratio) as an indicative of water availability. For that, we plotted the corresponding relationship among variables, and we modelled each specific relationship among the variables for each site. The selection of these study variables is supported by the literature and preliminary analysis showed that they were significant predictors of CO2 fluxes (Table S1). However, an inspection one by one of each predictive variable indicated that the relationships between the predictive and the response variables are linear, but there is a threshold at which the direction of the relationship shifts. Thus, we used segmented linear models to model those relationships using the segmented function of the segmented R package [33]. The modelling was done on the weekly averaged data. All the plots and analysis were done using R software (R version 4. 2.1, R Core Team, 2022, Vienna, Austria).

3. Results

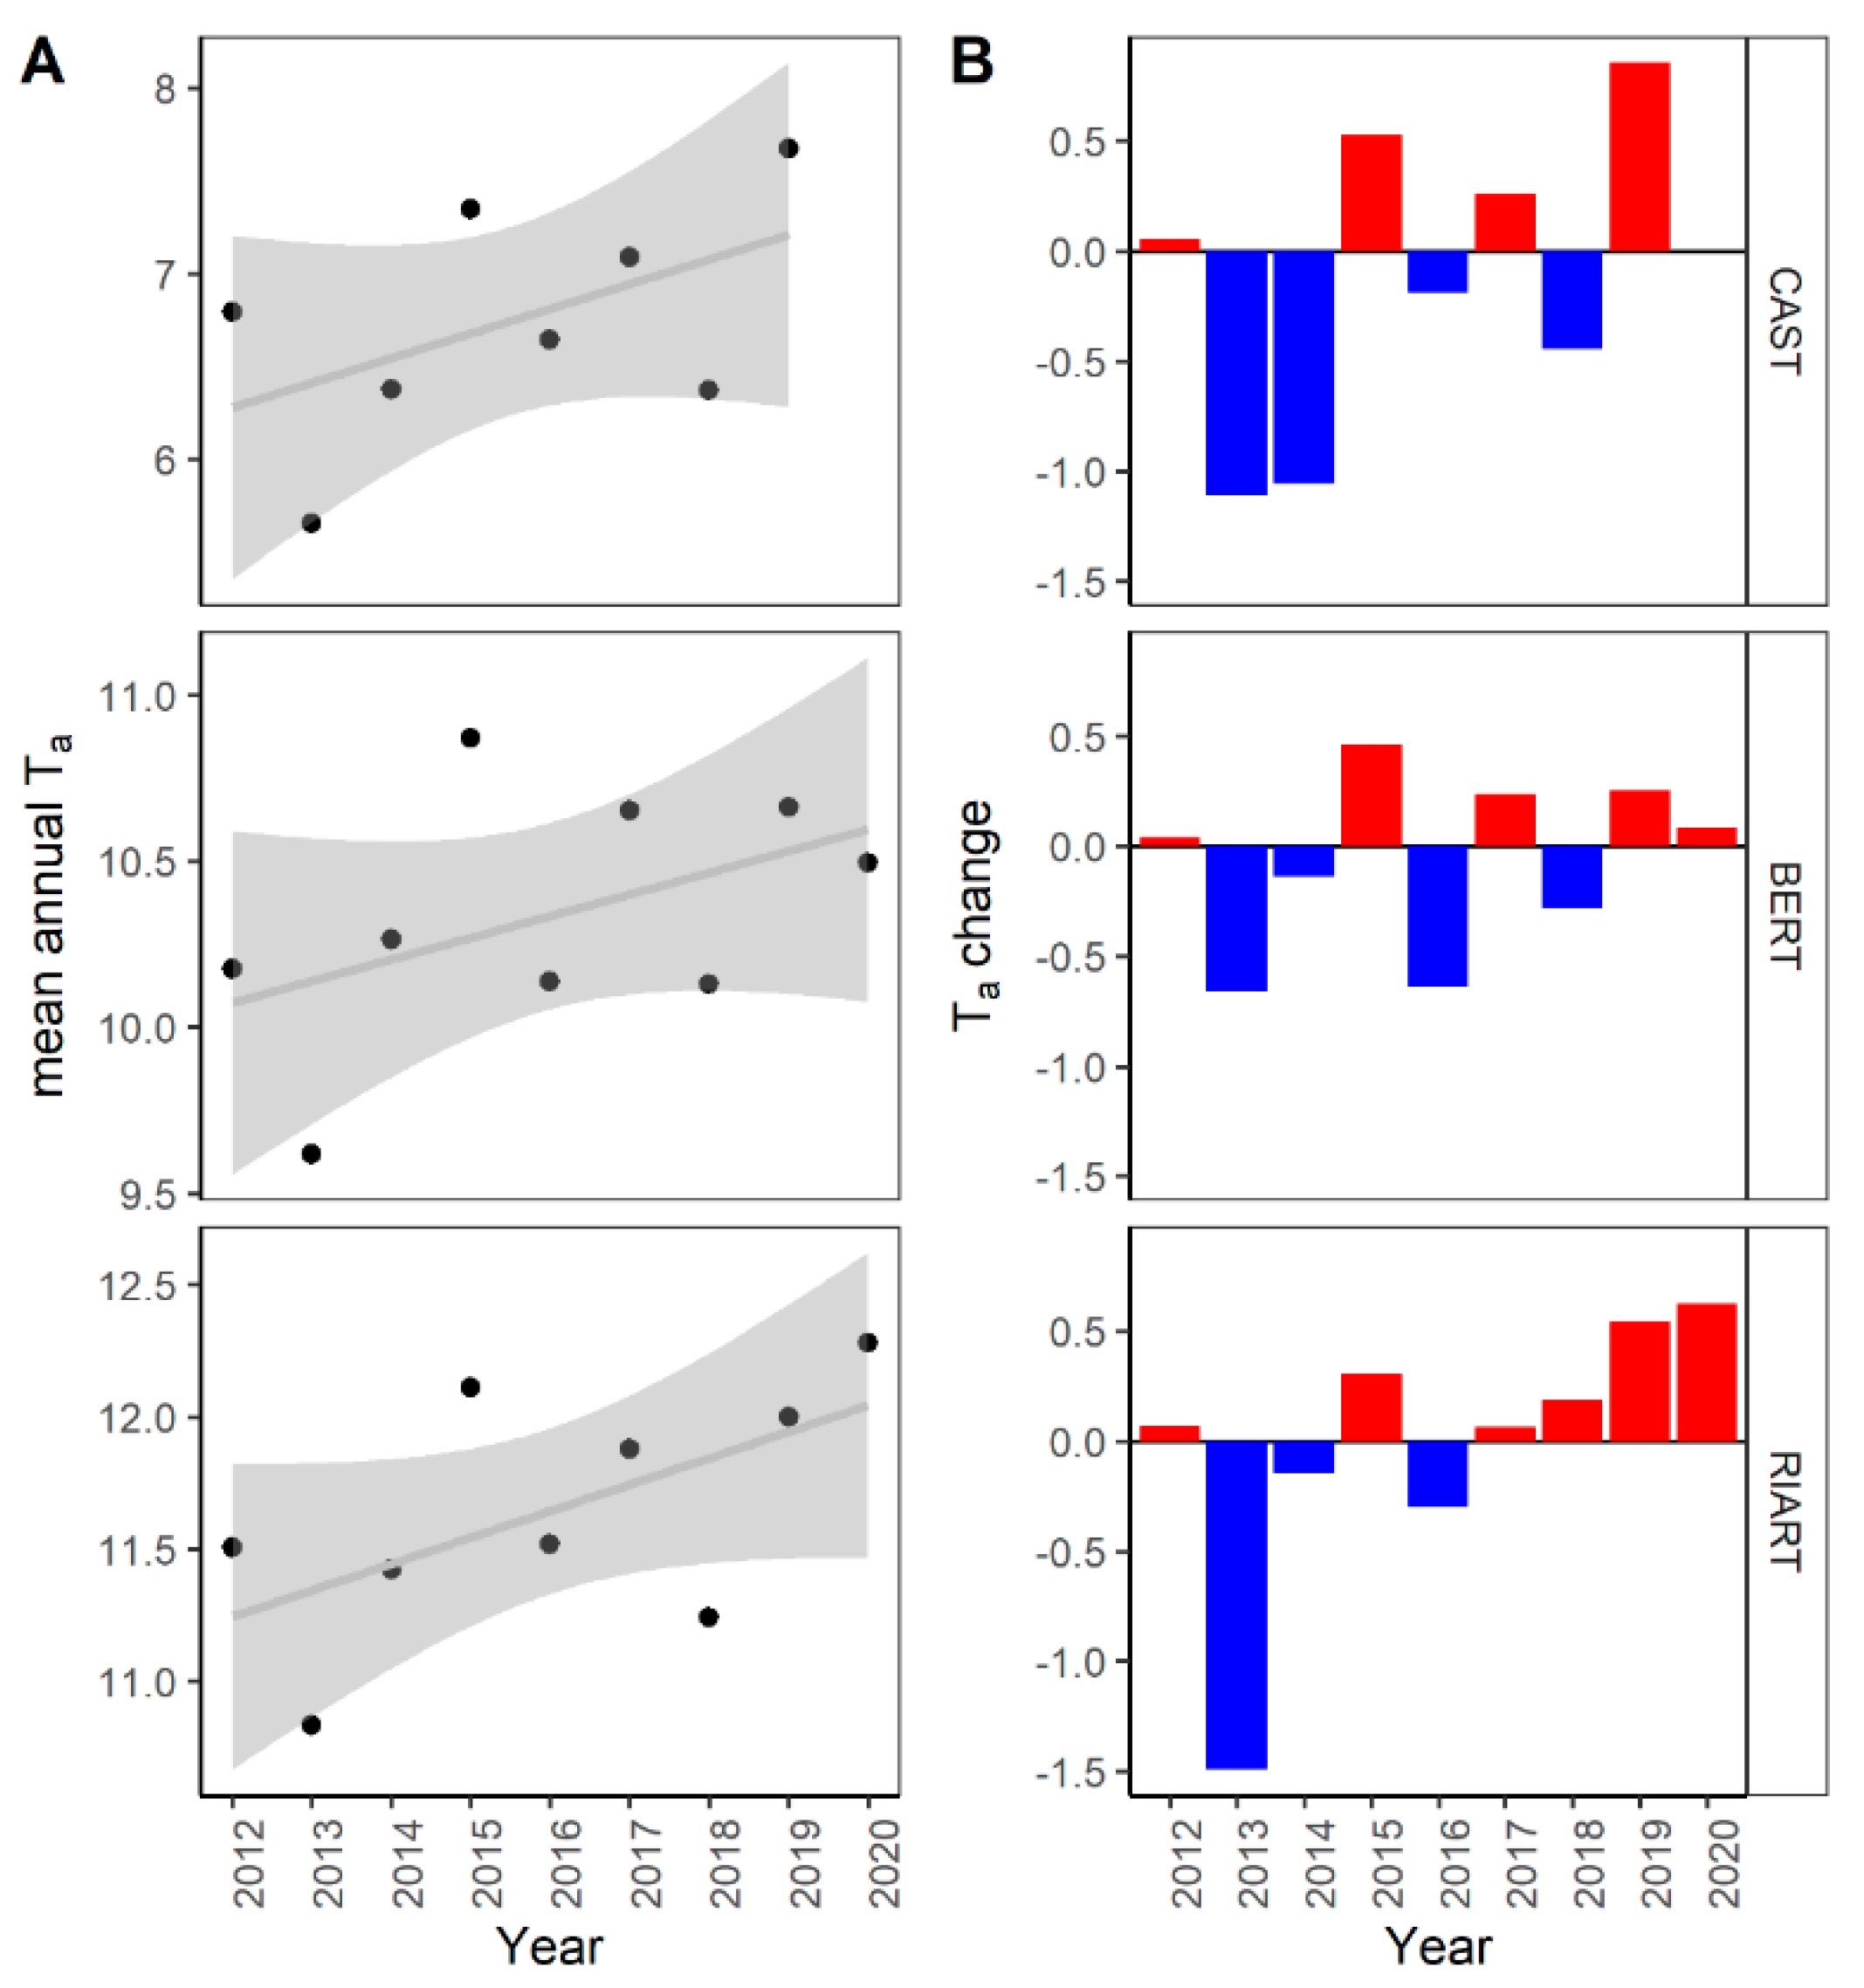
3.1. CO2 Flux Inter-Annual Dynamics

Along the studied years and sites (Figure 4), the subalpine grassland of CAST was the site with highest CO2 fluxes. The intensively managed grassland of RIART also presented peaks of very high CO2 fluxes, but this was the site with most heterogeneous flux dynamics. There were some site-specific intra-annual particularities on the CO2 flux dynamics, driven by environmental and phenological dynamics (Section 3.2).

3.2. Intra-Annual CO2 Fluxes and Environmental and Phenological Dynamics

At an intra-annual scale, CO2 fluxes performed the highest values and the highest net uptake during spring and summer, while CO2 fluxes decreased during winter, with small net CO2 uptake or emissions (Figure 5A). The subline grassland (CAST) presented a shorter period of net CO2 uptake than the montane grasslands (RIART and BERT, Figure 5A). The period of net uptake at the subalpine grassland (CAST) was concentrated in summer, while on at the montane grasslands (RIART and BERT), there were two net CO2 uptake periods: spring and autumn, the autumn peak being much less pronounced than the spring one. The subalpine grassland (CAST) is coldest among the studied grasslands with the lowest air temperatures (Ta, Figure 5B) along the year, and the longest period of snow cover during winter, as shows the albedo data (Figure 5C). The subalpine grassland also presents the lowest vapor pressure deficit (VPD, Figure 5D), and the highest peak of vegetation development as indicates the NDVI (Figure 5E). On the other side, at the montane grasslands (BERT and RIART) the environmental conditions are warmer and drier, with higher Ta, much less snow presence, and higher VPD (Figure 5). This results in a longer period of vegetation development and of net CO2 uptake but is less pronounced. It is characterized by two vegetation growing peaks, one in spring and a second in autumn after the summer withering (Figure 5E).

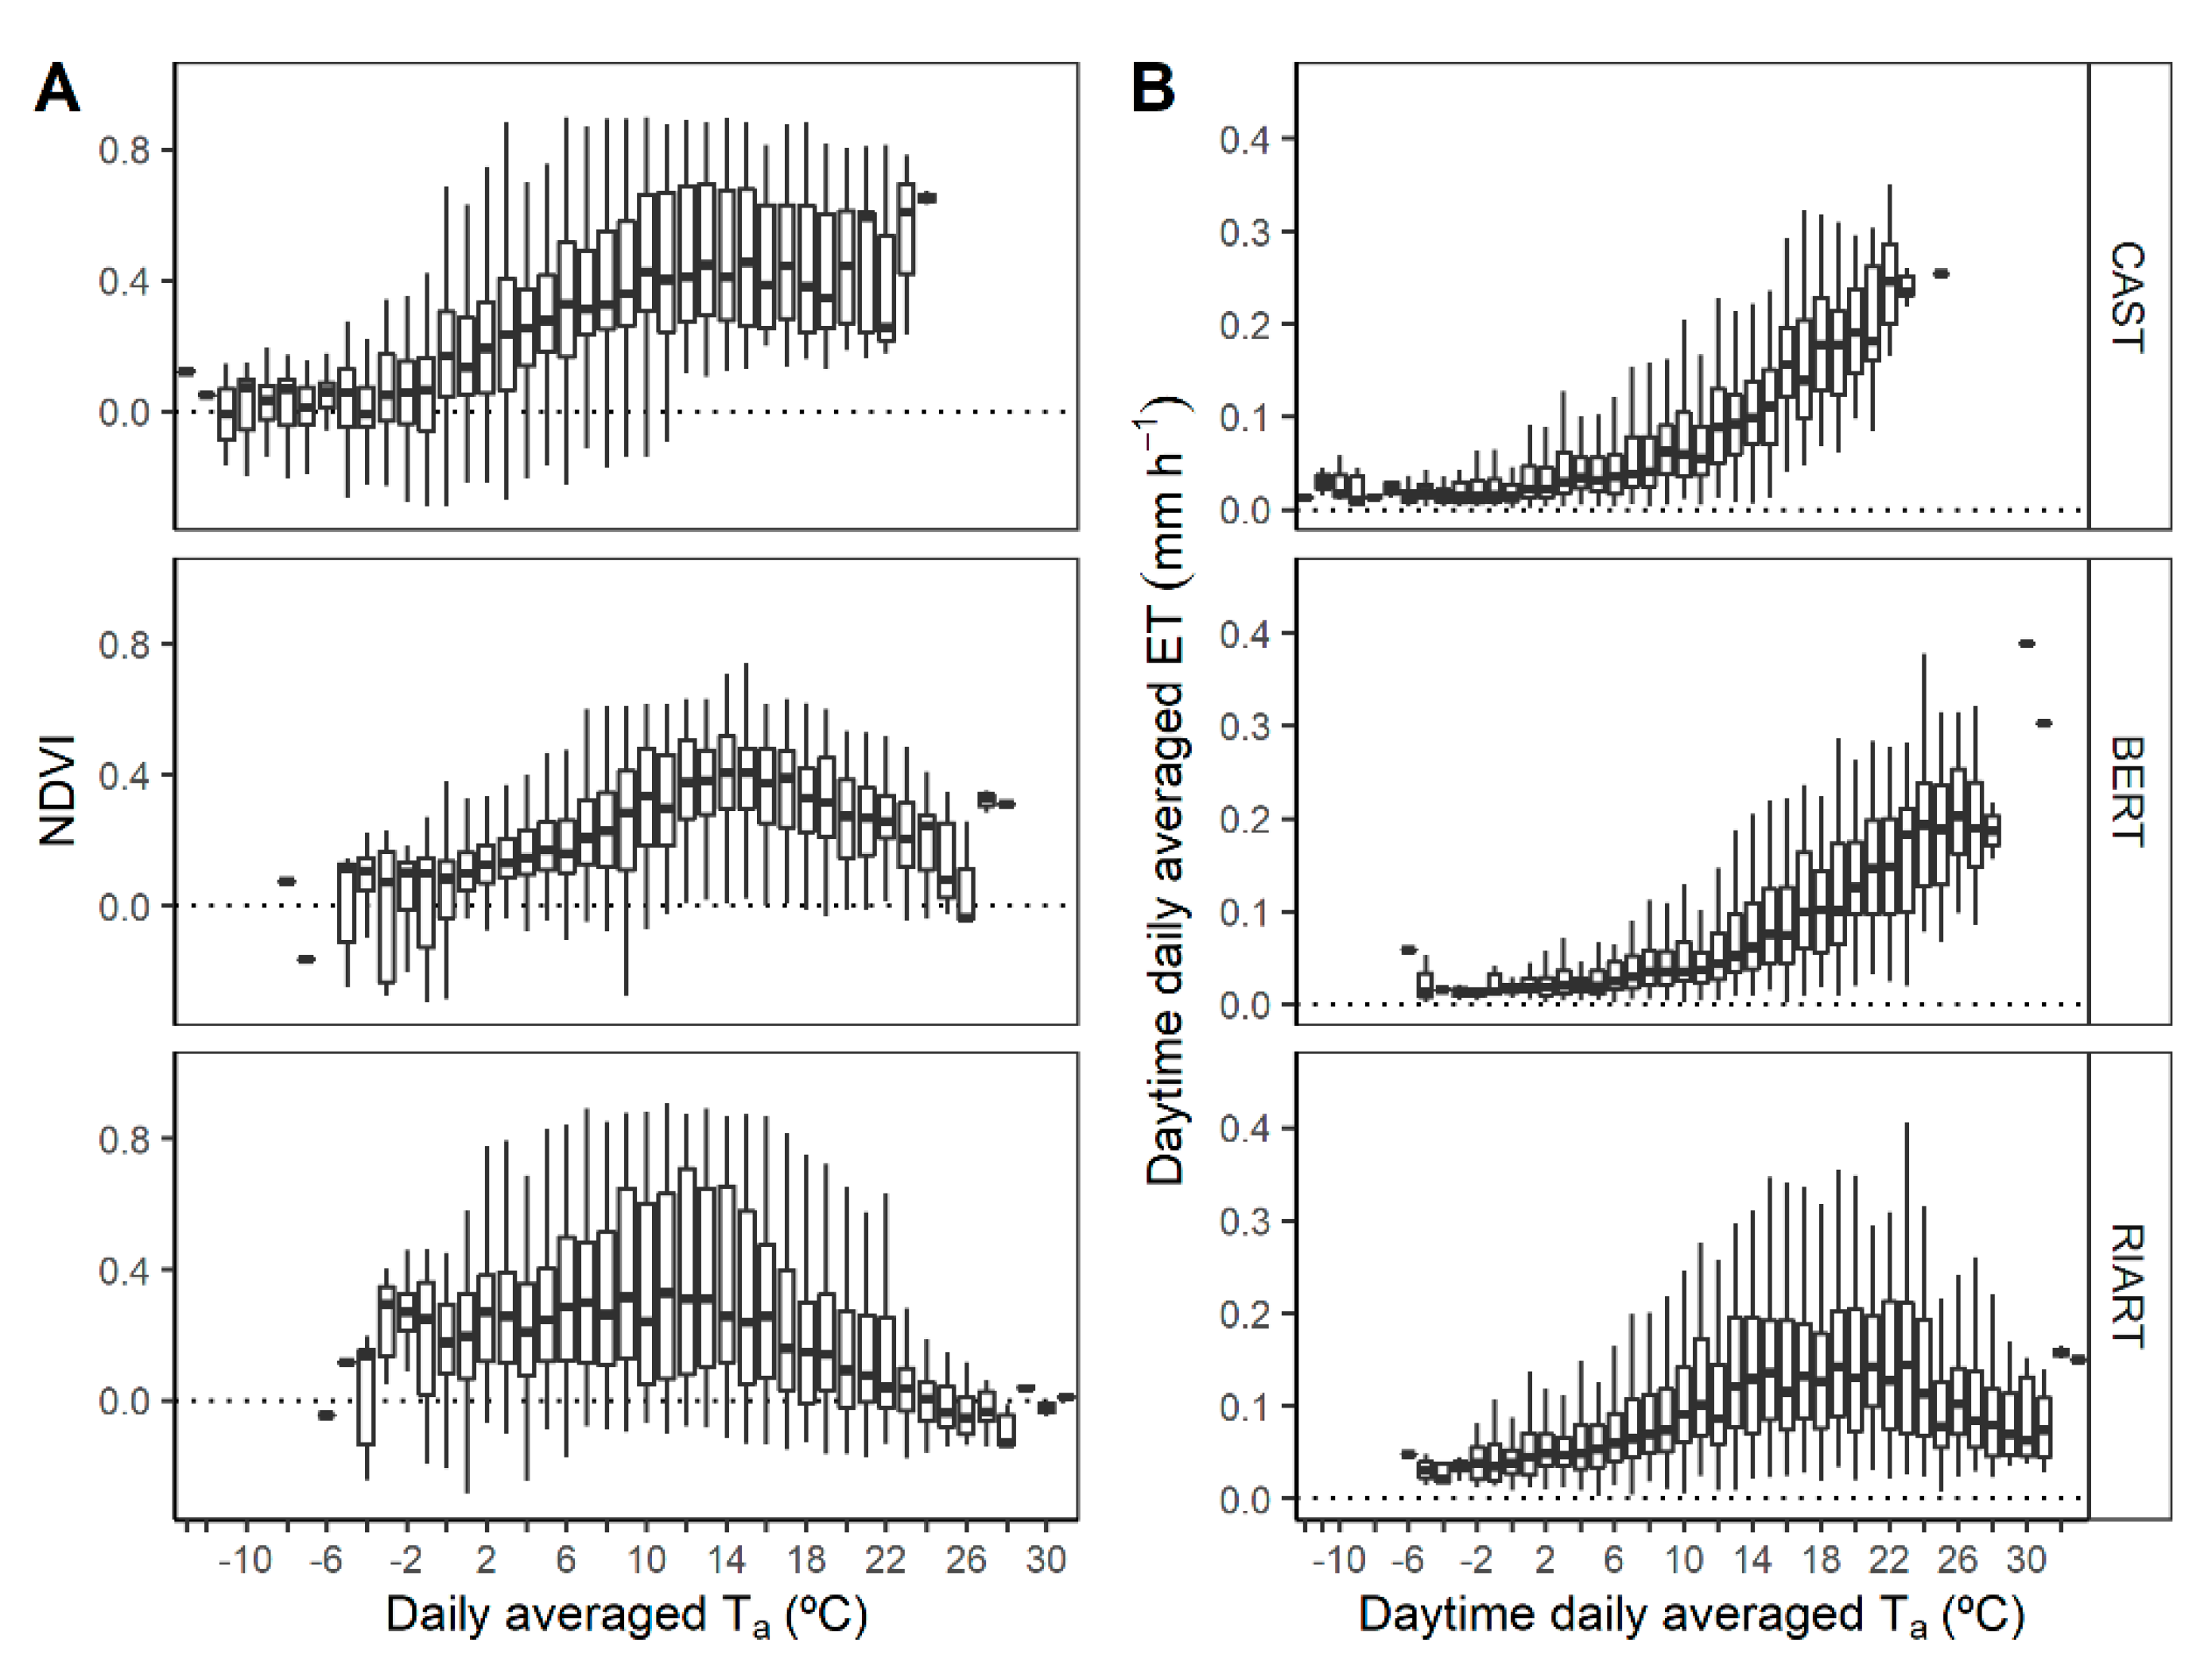
3.3. Environmental and Phenological Drivers of CO2 Fluxes

The role of Ta as a driver of CO2 fluxes (NEE, GPP and Reco) was site dependent. At the subalpine grassland (CAST), the NEE~Ta relationship tends to be linear (Figure 6A). This means that as soon as Ta increases, net CO2 uptake also increases with Ta (Figure 6A), which is the result of increasing GPP and Reco with increasing Ta (Figure 6B), but the magnitude of respiration fluxes is much smaller than GPP (Figure 6C). On the contrary, in the montane grasslands (RIART and BERT) there is also an increase in the CO2 fluxes with Ta, but up to a given threshold at which the relationship shifts, and there are CO2 emissions instead of uptake at the highest temperatures (Figure 6A).
These patterns were confirmed by the segmented linear models (Table 2 and Figure 7A). At the subalpine grassland of CAST there was always net CO2 uptake with increasing Ta, and there was a Ta threshold of 16 ± 2 °C from which the slope of the NEE~Ta relationship was even more pronounced. On the contrary, in the montane grasslands, there was net uptake up to a temperature threshold of 10.3 ± 0.9 °C in the case of RIART and of 11.3 ± 0.7 °C in the case of BERT, from which the relationship between NEE and Ta shifts, increasing CO2 emissions with temperature, instead of net CO2 uptake, (Table 2 and Figure 7A). A similar pattern was found on the influence of Ta on NDVI (indicative of phenological development, Figure 8A). The modelling indicates that in the subalpine grassland (CAST) the NDVI increases with Ta, and at a temperature threshold of 10 ± 2 °C, the NDVI increases even more (Table 2 and Figure 7B). While, in the montane grasslands, the NDVI increases with temperature up to a temperature threshold of 11.4 ± 0.8 °C at RIART, and of 12.6 ± 0.6 °C at BERT, from which NDVI decreases (Table 2 and Figure 7B).
The role of Ta as a driver of ET also showed differences between sites, although in this case, there were differences when comparing the extensively managed grasslands (BERT and CAST) to the intensively managed grassland (RIART, Figure 8B). In the extensively managed grasslands (BERT and CAST), the modelling confirmed that ET increased with Ta; while on the contrary, at the intensively managed grassland (RIART), ET increased with Ta only up to a temperature threshold of 18.0 ± 0.6 °C, from which ET decreased (Table 2 and Figure 7C).

4. Discussion

Our study presents the first long-term (27 site years) dataset of ecosystem-scale CO2 fluxes from eddy covariance flux stations of the Pyrenees (Figure 3); and provides relevant insights about the CO2 dynamics from Mediterranean mountain grasslands, an ecosystem that is seriously under-represented in the literature. For instance, in a review by Baldocchi et al. (2018), with 59 sites across the globe, it was reported that long term data (more than 5 years), published from Mediterranean grasslands, came only from Californian grasslands, which are generally warmer and drier than the grasslands studied here [19]. To our knowledge, the only published data from Mediterranean mountain grasslands that might be comparable to our sites are: (i) the data reported by Gilmanov et al. (2007), which included in their analysis 2 years of net ecosystem exchange (NEE) from an eddy covariance station of an alti-montane grassland in the Pyrenees (Alinyà, 1770 m a. s. l., MAT 6.1 °C and MAP 1064 mm [35]), which may be somewhat comparable to our site BERT; and (ii) the 2 years of NEE data included in the analysis by Serrano-Ortiz et al. (2014) from an alpine grassland at Sierra Nevada (2300 m a. s. l., MAT 5.5 ºC and MAP 800 mm [18]).
In the first study, the role of the photosynthesis was highlighted as the driver of NEE during spring, when there was water available [35]. In the second, the increase in the annual net CO2 fixation with elevation was highlighted (in their gradient) because of decreasing aridity via increases in the GPP [18]. However, in both cases, the magnitude of the fluxes was lower than in our study sites, mostly likely due to the lower productivity and the more constraining environmental conditions when comparing Alinyà [35] to BERT and Sierra Nevada [18] to CAST. In any case, what is clear is that these mountain systems are highly heterogenous and change rapidly in terms of productivity, CO2 exchange, and in general ecosystem performance. Additionally, in this regard, our contribution unravels differences on the CO2 flux dynamics along the studied climatic and the management gradient, and reveals potential differences in the response under the changing environmental conditions.
CO2 fluxes along a climatic and management gradient The subalpine grassland (CAST) was the most environmentally constrained site, with the lowest temperatures, the longest presence of snow, and a net ecosystem exchange (NEE) dominated by emissions during autumn, winter, and mid-spring (Figure 4). However, as soon as the temperature increased in summer, the vegetation experienced a rapid growth, and there was a pronounced net CO2 uptake (ca. between doy 100 and doy 200, Figure 4). This is most likely driven by the vegetation, which is actively photosynthesising, and performs higher absolute values of gross primary production (GPP, Figure 6B) than ecosystem respiration (Reco, Figure 6C).
In high-elevation grasslands, some ecosystem functions, including biomass production and CO2 exchange, have been traditionally temperature-limited [36]. Thus, in the Mediterranean region, high-elevation grasslands experience a rapid vegetation growth and are generally highly productive during the summer, while montane grasslands have a longer growing season but are less productive during the summer [37]. This agrees with the common management practices of these extensively managed grasslands. In alpine and subalpine grasslands, the livestock is brought to the mountains from late June to November, while in the montane grasslands, the livestock can start to pasture one month sooner (~first of June) and stay in the field until late November or early December, depending on the productivity of the year.
However, considering the current increasing trend in the temperature (Figure 3) this temperature limitation on productivity and CO2 exchange might not be the case in the incoming future for Mediterranean alpine and sub-alpine grasslands. As our results show, the NEE and its components—GPP and Reco—were all linearly enhanced by temperature at the subalpine grassland (CAST, Figure 6). Moreover, CO2 fluxes here have not reached a temperature shifting point yet (Figure 7 and Table 2), at which the relationship would change, and net uptake would become CO2 emissions with increasing temperatures. This suggests than in the short term, and under the incoming enhanced temperatures, sub-alpine grasslands in Mediterranean mountains might increase their net CO2 uptake. Similar results have also been reported in other mountain grasslands [38]. The higher temperatures may favour an earlier starting of vegetation development and a longer length of the growth period, which may result in a higher CO2 assimilation [21]. Such increase in the productivity has been reported to happen though mostly under non-water limited conditions, while warming combined with dry conditions may induce a reduction in the productivity [39].
In the specific case of our sub-alpine grassland (CAST), plants here seem to not be water limited yet, as shows the greenery of the vegetation even though the high summer temperatures (NDVI~Ta, Figure 7A) and the increasing evapotranspiration rates with increasing temperatures (ET~Ta, Figure 7B). Additionally, during summer, the soil water content at CAST does not reach such low values as it does at the montane grasslands (Figure S1); and even at the lowest soil water content, the NEE at CAST is more often dominated by net uptake than by emissions than in the montane grasslands (Figure S1). Overall, this suggests that the vegetation may be still adopting a ‘water spending strategy’ [40], not regulating the stomatal conductance until the soil water content approaches a wilting point [41]. This strategy can make the system resilient when drought periods are occasional, since CO2 exchange is not reduced, but may have negative consequences on the ecosystem if drought periods are more frequent and longer [23,41].
Meanwhile, it is unclear if a warming-enhanced productivity and a warming-enhanced net CO2 uptake will persist in the mid-long term in Mediterranean alpine and sub-alpine grasslands. The higher net and gross uptake induced by warming is also accompanied by higher rates of ecosystem respiration [42,43,44], which agrees with our Reco data from the sub-alpine grassland that increases almost exponentially with temperature (CAST, Figure 6C). Additionally, the Pyrenees have already experienced a global decrease in the precipitation volume (−2.5 %), and a significant decrease in the snow cover [5]. Such low water availability in combination with warming can finally lead to shifts in vegetation composition towards more opportunistic species in perennial alpine and subalpine grasslands [36,45]. Those changes in the vegetation composition would drive changes in the CO2 exchange dynamics [22,23] as well as on soil carbon stocks [46]. Therefore, the CO2 sink capacity of high-altitude Mediterranean grasslands under the current climate change scenario may experience profound changes in the incoming future.
On the other hand, the studied montane grasslands (RIART and BERT) are already at the edge of drastically reducing their net CO2 uptake capacity. Contrary to the situation in the sub-alpine grassland (CAST), the net CO2 uptake at the montane grasslands (RIART and BERT) is reduced at the highest temperatures. NEE turns here from net CO2 uptake to CO2 emissions at the highest temperatures, due to a decrease in the GPP, which is of higher magnitude than the decrease in the Reco (Figure 6). This is most likely driven by a decrease in the greenness of the vegetation (Figure 7B) and therefore on the photosynthetic capacity, which in turn is limited by the high temperatures and the low water availability.
In the studied mountain grasslands (RIART and BERT), the peak biomass, as well as the highest net CO2 uptake rates, are reached just before the high summer temperatures (Figure 5). This suggests that temperature here is not a limiting factor, while water instead is more constraining. When this is the case, small increases in the temperature accompanied by low water availability can easily decrease the productivity and net CO2 uptake [34]. This is especially the case during summer when NEE fluxes frequently turn from net uptake to emissions at the lowest soil water contents (Figure S1). Thus, under the current climate change scenario, with Mediterranean montane grasslands becoming warmer and drier, the productivity and the CO2 sink capacity might be significantly compromised. This might be especially pronounced in the montane grassland of RIART, wherein the mean annual temperatures are increasing more regularly than in the grasslands at higher altitudes (Figure 3B).
Note though that interannual CO2 fluxes (Figure 4) in the intensively managed montane grassland of RIART were the most heterogenous, as fluxes here are dependent not only on environmental and phenological drivers, but also on management events, including harvesting, ploughing, and crop type [22]. Ibañez et al. (2021) showed that the crop type drove CO2 fluxes, with grass-legume mixtures performing higher net CO2 balances than cereal monocultures. Hence, it is relevant to highlight the opportunities that may arise from management to mitigate climate change constrains, at least in intensively managed grasslands. The promotion of forage mixtures instead of monocultures, the introduction of plant species adapted to the new climatic conditions, and the adjustment of the grazing calendar are some examples of management measures that may be helpful to this regard.

5. Conclusions

Our study presents the first long-term dataset of ecosystem-scale CO2 fluxes from eddy covariance flux stations of the Pyrenees. Based on the findings of almost ten years of continuous measurements in three mountain grasslands, along a climatic and a management gradient, we found that net ecosystem CO2 exchange may be seriously endangered by the temperature increase and the current climate change scenario. At the subalpine grassland (CAST), we found that the net ecosystem exchange (NEE) and its components—gross primary production (GPP) and ecosystem respiration (Reco)—were all linearly enhanced by temperature; CO2 fluxes had not reached a temperature shifting point yet (according to the segmented linear models), at which the net uptake would become CO2 emissions. This suggests than in the short term, and under the incoming enhanced temperatures, sub-alpine grasslands in Mediterranean mountains might increase their net CO2 uptake. However, since changes in the water availability and in the plant species composition are also expected for the region, the mid- to long-term increase in the net CO2 uptake might be compromised.
On the other hand, the modelling also showed that the montane grasslands (RIART and BERT) presented already CO2 emissions at the highest temperatures, due to a decrease in the GPP of a higher magnitude than the decrease in the Reco. Montane grasslands are more water-limited than temperature-limited, and the CO2 decrease at the highest temperatures is most likely driven by a decrease in the greenness of the vegetation and the photosynthetic capacity. Montane grasslands are therefore expected to reduce their CO2 sink capacity under the current increasing temperatures.

Supplementary Materials

The following supporting information can be downloaded at: https://www.mdpi.com/article/10.3390/atmos13121980/s1, Figure S1: Data distribution, net ecosystem exchange (NEE) as function of soil water content (SWC); Table S1: Linear model results, daily averaged net ecosystem exchange (NEE), gross primary production (GPP) and ecosystem respiration (Reco), as function of ambient temperature (Ta), evapotranspiration (ET), and normalized vegetation index (NDVI). Model estimates, standard errors (SE), and p-values: *** p < 0.001, * p < 0.05, not significant (ns) p > 0.05. Annex S1. Aerial view of the study sites; Annex S2. Location of the closest meteorological stations to the study sites and meteorological data links.

Author Contributions

Conceptualization, M.I. and M.T.S.; methodology, M.I.; formal analysis, M.I.; investigation, M.I and M.T.S.; resources, M.T.S.; data curation, M.I.; writing—original draft preparation, M.I.; writing—review and editing, M.I and M.T.S.; supervision, M.T.S.; project administration, M.T.S.; funding acquisition, M.T.S. All authors have read and agreed to the published version of the manuscript.

Funding

The flux towers of this study were installed during the FLUXPYR project (EFA34/08, INTERREG IV-A POCTEFA, financed by EU-ERDF, Generalitat de Catalunya and Conseil Régional Midi-Pyrénées). The following additional projects also contributed with funding to this work: CAPACITI (FP7/2007-2013 grant agreement n° 275855), AGEC 2012 (Generalitat de Catalunya), CAPAS (Spanish Science Foundation, CGL2010-22378-C03-01), BIOGEI (Spanish Science Foundation, CGL2013-49142-C2-1-R, supported by a FPI fellowship for Mercedes Ibañez, BES-2014-069243) and IMAGINE (Spanish Science Foundation, CGL2017-85490-R).

Institutional Review Board Statement

Not applicable.

Informed Consent Statement

Not applicable.

Data Availability Statement

Data are available under reasonable request to the authors.

Acknowledgments

We would like to thank N. Altimir, F. Gouriveau, E. Ceschia, and J. Elbers for their contribution to the installation and functioning of the eddy covariance towers, and D. Estany and H. Sarri for field assistance. We would like to acknowledge the Forest Science and Technology Centre of Catalonia (CTFC) for support with study site maintenance.

Conflicts of Interest

The authors declare no conflict of interest.

References

  1. Gerber, P.J.; Steinfeld, H.; Henderson, B.; Mottet, A.; Opio, C.; Dijkman, J.; Falcucci, A.; Tempio, G. Tackling Climate Change through Livestock: A Global Assessment of Emissions and Mitigation Opportunities; Food and Agriculture Organization of the United Nations (FAO): Rome, Italy, 2013; ISBN 9789251079201. [Google Scholar]
  2. Berninger, F.; Susiluoto, S.; Gianelle, D.; Bahn, M.; Wohlfahrt, G.; Sutton, M.; Garcia-Pausas, J.; Gimeno, C.; Sanz, M.J.; Dore, S.; et al. Management and Site Effects on Carbon Balances of European Mountain Meadows and Rangelands. Boreal Environ. Res. 2015, 20, 748–760. [Google Scholar]
  3. Hörtnagl, L.; Barthel, M.; Buchmann, N.; Eugster, W.; Butterbach-Bahl, K.; Díaz-Pinés, E.; Zeeman, M.; Klumpp, K.; Kiese, R.; Bahn, M.; et al. Greenhouse Gas Fluxes over Managed Grasslands in Central Europe. Glob. Chang. Biol. 2018, 24, 1843–1872. [Google Scholar] [CrossRef] [Green Version]
  4. FAO. Challenges and Opportunities for Carbon Sequestration in Grassland Systems. A Technical Report on Grassland Management and Climate Change Mitigation; Conant, R.T., Ed.; Plant Production and Protection Division Food and Agriculture Organization of the United Nations (FAO): Rome, Italy, 2010; Volume 9, ISBN 9789251064948. [Google Scholar]
  5. OPCC-CTP. Climate Change in the Pyrenees: Impacts, Vulnerabilities and Adaptation. Bases of Knowledge for the Future Climate Change Adaptation Strategy in the Pyrenees; OPCC-CTP, Ed.; OPCC-CTP: Huesca, Spain, 2018; ISBN 978-84-09-06268-3. [Google Scholar]
  6. Smit, H.J.; Metzger, M.J.; Ewert, F. Spatial Distribution of Grassland Productivity and Land Use in Europe. Agric. Syst. 2008, 98, 208–219. [Google Scholar] [CrossRef]
  7. Porqueddu, C.; Ates, S.; Louhaichi, M.; Kyriazopoulos, A.P.; Moreno, G.; del Pozo, A.; Ovalle, C.; Ewing, M.A.; Nichols, P.G.H. Grasslands in “Old World” and “New World” Mediterranean-Climate Zones: Past Trends, Current Status and Future Research Priorities. Grass Forage Sci. 2016, 71, 1–35. [Google Scholar] [CrossRef]
  8. Rodríguez, A.; Canals, R.M.; Plaixats, J.; Albanell, E.; Debouk, H.; Garcia-Pausas, J.; San Emeterio, L.; Jimenez, J.J.; Sebastià, M.-T. Interactions between Biogeochemical and Management Factors Explain Soil Organic Carbon in Pyrenean Grasslands. Biogeosciences 2020, 17, 6033–6050. [Google Scholar] [CrossRef] [Green Version]
  9. Nogueira, C.; Werner, C.; Rodrigues, A.; Caldeira, M.C. A Prolonged Dry Season and Nitrogen Deposition Interactively Affect CO 2 Fluxes in an Annual Mediterranean Grassland. Sci. Total Environ. 2019, 654, 978–986. [Google Scholar] [CrossRef]
  10. Schaufler, G.; Kitzler, B.; Schindlbacher, A.; Skiba, U.; Sutton, M.A.; Zechmeister-Boltenstern, S. Greenhouse Gas Emissions from European Soils under Different Land Use: Effects of Soil Moisture and Temperature. Eur. J. Soil Sci. 2010, 61, 683–696. [Google Scholar] [CrossRef]
  11. Imer, D.; Merbold, L.; Eugster, W.; Buchmann, N. Temporal and Spatial Variations of Soil CO2, CH4 and N2O Fluxes at Three Differently Managed Grasslands. Biogeosciences 2013, 10, 5931–5945. [Google Scholar] [CrossRef] [Green Version]
  12. Ceschia, E.; Béziat, P.; Dejoux, J.F.; Aubinet, M.; Bernhofer, C.; Bodson, B.; Buchmann, N.; Carrara, A.; Cellier, P.; Di Tommasi, P.; et al. Management Effects on Net Ecosystem Carbon and GHG Budgets at European Crop Sites. Agric. Ecosyst. Environ. 2010, 139, 363–383. [Google Scholar] [CrossRef] [Green Version]
  13. Kutsch, W.L.; Aubinet, M.; Buchmann, N.; Smith, P.; Osborne, B.; Eugster, W.; Wattenbach, M.; Schrumpf, M.; Schulze, E.D.; Tomelleri, E.; et al. The Net Biome Production of Full Crop Rotations in Europe. Agric. Ecosyst. Environ. 2010, 139, 336–345. [Google Scholar] [CrossRef]
  14. Vuichard, N.; Ciais, P.; Viovy, N.; Li, L.; Ceschia, E.; Wattenbach, M.; Bernhofer, C.; Emmel, C.; Grünwald, T.; Jans, W.; et al. Simulating the Net Ecosystem CO2 Exchange and Its Components over Winter Wheat Cultivation Sites across a Large Climate Gradient in Europe Using the ORCHIDEE-STICS Generic Model. Agric. Ecosyst. Environ. 2016, 226, 1–17. [Google Scholar] [CrossRef]
  15. Xu, L.; Baldocchi, D.D. Seasonal Variation in Carbon Dioxide Exchange over a Mediterranean Annual Grassland in California. Agric. For. Meteorol. 2004, 1232, 79–96. [Google Scholar] [CrossRef] [Green Version]
  16. Jongen, M.; Pereira, J.S.; Aires, L.M.I.; Pio, C.A. The Effects of Drought and Timing of Precipitation on the Inter-Annual Variation in Ecosystem-Atmosphere Exchange in a Mediterranean Grassland. Agric. For. Meteorol. 2011, 151, 595–606. [Google Scholar] [CrossRef]
  17. Grant, R.F.; Baldocchi, D.D.; Ma, S. Ecological Controls on Net Ecosystem Productivity of a Seasonally Dry Annual Grassland under Current and Future Climates: Modelling with Ecosys. Agric. For. Meteorol. 2012, 152, 189–200. [Google Scholar] [CrossRef]
  18. Serrano-Ortiz, P.; Oyonarte, C.; Pérez-Priego, O.; Reverter, B.R.; Sánchez-Cañete, E.P.; Were, A.; Uclés, O.; Morillas, L.; Domingo, F. Ecological Functioning in Grass-Shrub Mediterranean Ecosystems Measured by Eddy Covariance. Oecologia 2014, 175, 1005–1017. [Google Scholar] [CrossRef]
  19. Ma, S.; Baldocchi, D.; Wolf, S.; Verfaillie, J. Slow Ecosystem Responses Conditionally Regulate Annual Carbon Balance over 15 Years in Californian Oak-Grass Savanna. Agric. For. Meteorol. 2016, 228–229, 252–264. [Google Scholar] [CrossRef] [Green Version]
  20. Pereira, J.S.; Mateus, J.A.; Aires, L.M.; Pita, G.; Pio, C.; David, J.S.; Andrade, V.; Banza, J.; David, T.S.; Paço, T.A.; et al. Net Ecosystem Carbon Exchange in Three Contrasting Mediterranean Ecosystems - The Effect of Drought. Biogeosciences 2007, 4, 791–802. [Google Scholar] [CrossRef] [Green Version]
  21. Rogger, J.; Hörtnagl, L.; Buchmann, N.; Eugster, W. Carbon Dioxide Fluxes of a Mountain Grassland: Drivers, Anomalies and Annual Budgets. Agric. For. Meteorol. 2022, 314, 108801. [Google Scholar] [CrossRef]
  22. Ibañez, M.; Altimir, N.; Ribas, À.; Eugster, W.; Sebastià, M.-T. Cereal-Legume Mixtures Increase Net CO2 Uptake in a Forage Crop System in the Eastern Pyrenees. F. Crop. Res. 2021, 272, 108262. [Google Scholar] [CrossRef]
  23. Ibañez, M.; Altimir, N.; Ribas, À.; Eugster, W.; Sebastià, M.-T. Phenology and Plant Functional Type Dominance Drive CO2 Exchange in Seminatural Grasslands in the Pyrenees. J. Agric. Sci. 2020, 158, 3–14. [Google Scholar] [CrossRef] [Green Version]
  24. Soil Survey Staff—NRCS/USDA. Keys to Soil Taxonomy, 12th ed.; United States Department of Agriculture: Washington, WA, USA, 2014; ISBN 0926487221. [Google Scholar]
  25. Moncrieff, J.; Clement, R.; Finnigan, J.; Meyers, T. Averaging, Detrending, and Filtering of Eddy Covariance Time Series. In Handbook of Micrometeorology. Atmospheric and Oceanographic Sciences Library; Lee, X., Massman, W., Law, B., Eds.; Springer: Dordrecht, The Netherlands, 2004; Volume 29. [Google Scholar]
  26. Moncrieff, J.B.; Massheder, J.M.; de Bruin, H.; Elbers, J.; Friborg, T.; Heusinkveld, B.; Kabat, P.; Scott, S.; Soegaard, H.; Verhoef, A. A System to Measure Surface Fluxes of Momentum, Sensible Heat, Water Vapour and Carbon Dioxide. J. Hydrol. 1997, 188–189, 589–611. [Google Scholar] [CrossRef]
  27. Webb, E.K.; Pearman, G.I.; Leuning, R. Correction of Flux Measurements for Density Effects Due to Heat and Water Vapour Transfer. Q. J. R. Meteorol. Soc. 1980, 106, 85–100. [Google Scholar] [CrossRef]
  28. Foken, T.; Gockede, M.; Mauder, M.; Mahrt, L.; Amiro, B.D.; Munger, J.W. Post-Field Quality Control. In Handbook of Micrometeorology. Atmospheric and Oceanographic Sciences Library; Lee, X., Massman, W., Law, B., Eds.; Springer: Dordrecht, The Netherlands, 2004; Volume 29, pp. 81–108. [Google Scholar]
  29. Papale, D. Data Gap Filling. In Eddy Covariance: A Practical Guide to Measurement and Data Analysis; Aubinet, M., Vesala, T., Papale, D., Eds.; Springer Dordrecht: Berlin/Heidelberg, Germany, 2012; pp. 159–172. ISBN 978-94-007-2350-4. [Google Scholar]
  30. Emmel, C.; Winkler, A.; Hörtnagl, L.; Revill, A.; Ammann, C.; D’Odorico, P.; Buchmann, N.; Eugster, W. Integrated Management of a Swiss Cropland Is Not Sufficient to Preserve Its Soil Carbon Pool in the Long Term. Biogeosciences 2018, 15, 5377–5393. [Google Scholar] [CrossRef] [Green Version]
  31. Aubinet, M.; Feigenwinter, C.; Heinesch, B.; Laffineur, Q.; Papale, D.; Reichstein, M.; Rinne, J.; Van Gorsel, E. Nighttime Flux Correction. In Eddy Covariance: A Practical Guide to Measurement and Data Analysis; Aubinet, M., Vesala, T., Papale, D., Eds.; Springer Dordrecht: Berlin/Heidelberg, Germany, 2012; pp. 133–157. ISBN 978-94-007-2351-1. [Google Scholar]
  32. Reichstein, M.; Falge, E.; Baldocchi, D.; Papale, D.; Aubinet, M.; Berbigier, P.; Bernhofer, C.; Buchmann, N.; Gilmanov, T.; Granier, A.; et al. On the Separation of Net Ecosystem Exchange into Assimilation and Ecosystem Respiration: Review and Improved Algorithm. Glob. Chang. Biol. 2005, 11, 1424–1439. [Google Scholar] [CrossRef]
  33. Muggeo, V.M.R. Segmented: An R Package to Fit Regression Models with Broken-Line Relationships. R News 2008, 8, 20–25. [Google Scholar]
  34. Baldocchi, D.; Chu, H.; Reichstein, M. Inter-Annual Variability of Net and Gross Ecosystem Carbon Fluxes: A Review. Agric. For. Meteorol. 2018, 249, 520–533. [Google Scholar] [CrossRef] [Green Version]
  35. Gilmanov, T.G.; Soussana, J.F.; Aires, L.; Allard, V.; Ammann, C.; Balzarolo, M.; Barcza, Z.; Bernhofer, C.; Campbell, C.L.; Cernusca, A.; et al. Partitioning European Grassland Net Ecosystem CO2 Exchange into Gross Primary Productivity and Ecosystem Respiration Using Light Response Function Analysis. Agric. Ecosyst. Environ. 2007, 121, 93–120. [Google Scholar] [CrossRef]
  36. Sebastià, M.-T. Plant Guilds Drive Biomass Response to Global Warming and Water Availability in Subalpine Grassland. J. Appl. Ecol. 2007, 44, 158–167. [Google Scholar] [CrossRef]
  37. García-González, R. Management of Natura 2000 Habitats. Alpine and Subalpine Calcareous Grasslands 6170; The European Commission: Brussels, Belgium, 2008; ISBN 9789279083266. [Google Scholar]
  38. Lin, D.; Xia, J.; Wan, S. Climate Warming and Biomass Accumulation of Terrestrial Plants: A Meta-Analysis. New Phytol. 2010, 188, 187–198. [Google Scholar] [CrossRef]
  39. Li, C.; Peng, F.; Xue, X.; You, Q.; Lai, C.; Zhang, W.; Cheng, Y. Productivity and Quality of Alpine Grassland Vary with Soil Water Availability under Experimental Warming. Front. Plant Sci. 2018, 9, 1790. [Google Scholar] [CrossRef] [Green Version]
  40. Leitinger, G.; Ruggenthaler, R.; Hammerle, A.; Lavorel, S.; Schirpke, U.; Clement, J.-C.; Lamarque, P.; Obojes, N.; Tappeiner, U. Impact of Droughts on Water Provision in Managed Alpine Grasslands in Two Climatically Different Regions of the Alps. Ecohydrology 2015, 8, 1600–1613. [Google Scholar] [CrossRef] [Green Version]
  41. Brilli, F.; Hörtnagl, L.; Hammerle, A.; Haslwanter, A.; Hansel, A.; Loreto, F.; Wohlfahrt, G. Leaf and Ecosystem Response to Soil Water Availability in Mountain Grasslands. Agric. For. Meteorol. 2011, 151, 1731–1740. [Google Scholar] [CrossRef]
  42. Yan, Y.; Wang, J.; Tian, D.; Luo, Y.; Xue, X.; Peng, F.; He, J.S.; Liu, L.; Jiang, L.; Wang, X.; et al. Sustained Increases in Soil Respiration Accompany Increased Carbon Input under Long-Term Warming across Global Grasslands. Geoderma 2022, 428, 116157. [Google Scholar] [CrossRef]
  43. Tiwari, P.; Bhattacharya, P.; Rawat, G.S.; Rai, I.D.; Talukdar, G. Experimental Warming Increases Ecosystem Respiration by Increasing Above-Ground Respiration in Alpine Meadows of Western Himalaya. Sci. Rep. 2021, 11, 2640. [Google Scholar] [CrossRef]
  44. Nyberg, M.; Hovenden, M.J. Warming Increases Soil Respiration in a Carbon-Rich Soil without Changing Microbial Respiratory Potential. Biogeosciences 2020, 17, 4405–4420. [Google Scholar] [CrossRef]
  45. Debouk, H.; De Bello, F.; Sebastia, M.T. Functional Trait Changes, Productivity Shifts and Vegetation Stability in Mountain Grasslands during a Short-Term Warming. PLoS One 2015, 10, 1–17. [Google Scholar] [CrossRef] [Green Version]
  46. Rodríguez, A.; Canals, R.M.; Sebastià, M.-T. Positive Effects of Legumes on Soil Organic Carbon Storage Disappear at High Legume Proportion across a Wide Range of Environmental Conditions in Grasslands in the Pyrenees. Ecosystems 2020, 25, 960–975. [Google Scholar] [CrossRef]
Figure 1. From left to right: Location of the study sites (source of the map: Institut Cartogràfic i Geològic de Catalunya, https://www.icgc.cat/, accessed on 10 January 2021); aerial view (source: googlemaps); and pictures of the eddy covariance flux stations (source: Laboratory of Functional Ecology and Global Change (ECOFUN), http://ecofun.ctfc.cat/, accessed on 10 January 2021). The more detailed aerial view of the study sites can be seen in the Annex S1 of the Supplementary Material.
Atmosphere 13 01980 g001
Figure 2. Climogram of the study sites, mean air temperature (Ta), and precipitation. Data sources: Ta, eddy covariance flux stations from the period 2012–2020; precipitation from the closest meteorological stations of the Servei Meteorologic de Catalunya (see Annex S2).
Atmosphere 13 01980 g002
Figure 3. (A) Mean annual temperatures (Ta, dots) along time, linear relationship and 95% confidence interval and (B) temperature difference compared to the average in the period 2012–2020. Data source: eddy covariance flux stations.
Atmosphere 13 01980 g003
Figure 4. Interannual CO2 flux dynamics: daily accumulated net ecosystem exchange (NEE), ecosystem respiration (Reco), and gross primary production (GPP).
Atmosphere 13 01980 g004
Figure 5. Intra-annual dynamics, mean daily averaged ± 1 SD (grey area) of (A): cumulative net ecosystem exchange (NEE); (B) air temperature (Ta); (C) albedo; (D) vapor pressure deficit (VPD); (E) and normalized vegetation index (NDVI). Source: eddy covariance flux stations.
Atmosphere 13 01980 g005
Figure 6. Daily averaged CO2 fluxes as function of daily averaged ambient temperature (Ta): (A) net ecosystem exchange (NEE); (B) gross primary production (GPP); and (C) ecosystem respiration (Reco). The boxplots display the first and the third quartile (boxes), the median (horizontal line), and the minimum and maximum values (whiskers).
Atmosphere 13 01980 g006
Figure 7. Predicted net ecosystem exchange (NEE), normalized vegetation index (NDVI), and evapotranspiration (ET) according to the segmented linear models of Table 2.
Atmosphere 13 01980 g007
Figure 8. Daily averaged (A) normalized vegetation index (NDVI) as function of ambient temperature (Ta); (B) evapotranspiration (ET) as function of ambient temperature (Ta).
Atmosphere 13 01980 g008
Table 1. Site names, coordinates, altitude, mean annual temperature (MAT), source: eddy covariance flux stations, data from the period 2012–2020; mean annual precipitation (MAP), source: Servei Meteorologic de Catalunya (https://en.meteocat.gencat.cat/, accessed on 14 August 2022, see the details in Annex S2); soil type according to the NRCS/USDA nomenclature [24]; and management regime.
SiteCoordinatesAltitude (m a. s. l.)MAT (°C)MAP (mm)Soil TypeManagement Regime
Pla de Riart (RIART)42°03′48″ N,
1°30′48″ E
100311.7 ± 7.4664 ± 187Petrocalcic calcixereptMixed crop-livestock system. Crop rotation of cereal monocultures and cereal-legume mixtures. Cattle grazing (0.91 LSU ha−1) during the fallow period
La Bertolina (BERT)42°05′56” N, 1°39′40” E127510.2 ± 6.8686 ± 193Udic calciustept Cattle grazing (0.44 LSU ha−1), from early June to November
Castellar de n’Hug (CAST)42°18′18” N, 2°02′01” E20006.9 ± 6.8944 ± 338Lithic udorthentCattle and sheep grazing (0.74 LSU ha−1), from late June to November
Table 2. Segmented linear models results for each site: net ecosystem exchange (NEE) as function of ambient temperature (Ta); normalized vegetation index (NDVI) as function of Ta; evapotranspiration (ET) as function of Ta. Models’ estimate, standard error (SE), and p-value (Pr (>|t|)): ‘***’ p < 0.001, ‘**’ p < 0.01, not significant (ns) p > 0.05.
SiteChange PointSlope 1Slope 2R2Adj
EstimateSEEstimateSEp-ValueEstimateSEp-Value
NEE~TaRIART10.30.9−0.210.05***0.230.03***0.15
BERT11.30.7−0.130.02***0.160.03***0.14
CAST162−0.080.02***−0.60.4***0.09
NDVI~TaRIART11.40.80.0200.005***−0.0300.004***0.15
BERT12.60.60.0300.003***−0.0160.004***0.33
CAST1020.0350.004***0.0110.009ns0.37
ET~TaRIART18.00.60.00620.0005***−0.0110.003***0.26
BERT1010.0040.001**0.00980.0009***0.52
CAST910.00480.0006***0.0110.001***0.58
Publisher’s Note: MDPI stays neutral with regard to jurisdictional claims in published maps and institutional affiliations.

