Article

Remote-Sensing Drought Monitoring in Sichuan Province from 2001 to 2020 Based on MODIS Data

1
The Faculty Geography Resources Sciences, Sichuan Normal University, Chengdu 610101, China
2
Key Laboratory of Land Resources Evaluation and Monitoring in Southwest China, Sichuan Normal University, Chengdu 610066, China
*
Author to whom correspondence should be addressed.
Atmosphere 2022, 13(12), 1970; https://doi.org/10.3390/atmos13121970
Submission received: 11 October 2022 / Revised: 17 November 2022 / Accepted: 18 November 2022 / Published: 25 November 2022

Abstract

:
In this study, four drought monitoring indices were selected to simulate drought monitoring in the study area and a correlation analysis was conducted using the self-calibrated Palmer Drought Index (sc-PDSI) to screen for the most suitable drought monitoring index for the study area. Then, the spatio-temporal variation characteristics of drought in the study area were discussed and analyzed. The results showed that the Crop Water Stress Index (CWSI) was most suitable for drought monitoring in the Sichuan Province. CWSI had the best monitoring in grasslands (r = 0.48), the worst monitoring in woodlands (r = 0.43) and the highest fitting degree of overall correlation (r = 0.47). The variation of drought time in the Sichuan Province showed an overall trend of wetting and the drought situation was greatly alleviated. In the past 20 years, the dry years in the Sichuan Province were from 2001 to 2007, in which the driest years were 2006 and 2007; 2012–2013 was the transition interval between drought and wet; any year from 2013 to 2020 was a wet year, showing a transition trend of “drought first and then wet”. The spatial distribution of drought was greater in the south than in the north and greater in the west than in the east. Panzhihua City and the southern part of the Liangshan Prefecture were the most arid areas, while the non-arid areas were the border zone between the western Sichuan Plateau and the Sichuan Basin. Looking at the spatial distribution of drought, “mild drought” accounted for the largest percentage of the total area (60%), mainly concentrated in the western Sichuan plateau. The second largest was “drought free” (33%), mostly concentrated in the transition area between the western Sichuan Plateau and the Sichuan Basin (western Aba Prefecture, Ya’an City, Leshan City and northern Liangshan Prefecture). The area of “moderate drought” accounted for a relatively small proportion (6%), mainly concentrated in Panzhihua City, the surrounding areas of Chengdu City and the southern area of the Liangshan Prefecture. The area of severe drought accounted for the least (1%), mostly distributed in Panzhihua City and a small part in the southern Liangshan Prefecture. The drought center ranged from 101.8° E to 103.6° E and 28.8° N to 29.8° N, with the movement trend of the drought center moving from the northeast to the southwest to the northeast.

1. Introduction

The Sichuan Province lies in the transition zone between the Qinghai–Tibet Plateau and the middle and lower reaches of the Yangtze River, with the characteristics of being high in the west and low in the east. The western part of Sichuan Province is characterized by a fragile plateau climate and ecological environment and the vertical zonal difference is great, while the eastern part is characterized by an abundant monsoon climate and precipitation. The climate and lower pad surface properties of the study areas are very different, which is of great reference value for research. In recent years, frequent droughts occurred in the Yangtze River Basin (especially in Sichuan and Chongqing in 2006), which posed a serious threat to agricultural and forestry production in this region. In order to better cope with and study the impact of drought on the study area, it is necessary to adopt effective monitoring methods to accurately analyze the drought situation in the study area.
The application of remote-sensing technology in drought monitoring has become mainstream [1]. Remote-sensing technology can make up for the shortage of meteorological station data and obtain meteorological data over a long time and a wide range [2]. At present, the meteorological drought index is based on the data of meteorological stations at different time scales. It uses mathematical and physical methods to calculate the drought index, so as to monitor the drought caused by climate anomalies in specific regions and specific periods [3]. The earliest drought indices used to characterize drought conditions were the Vegetation Condition Index (VCI) and the Temperature Condition Index (TCI) developed by Kogan [4,5]. Based on the Normalized Difference Vegetation Index (NDVI) and Land Surface Temperature (LST) changes in different time series. The Palmer Drought Severity Index (PDSI) developed by meteorologists Wayne Palmer et al. [6] put forward a drought index based on water supply and demand. The PDSI is widely used in drought assessment because it considers the temperature factor, can effectively reflect the impact of climate change on droughts and, at the same time, can consider the water supply and their relationship for regional drought assessment. However, there are differences in drought analysis in different spaces, so it is not always suitable to assess drought in different regions [7]. Compared with PDSI, the self-calibrating Palmer Drought Severity Index (sc-PDSI) is a great improvement and the calculation of evapotranspiration using the FAOPM formula has higher accuracy [7]. At the same time, sc-PDSI uses the meteorological data of the respective stations for the calculations, giving fewer regional constraints and high spatial comparability [8]. The application of sc-PDSI in regional drought analysis is relatively mature [9,10]. The Standard Precipitation Evapotranspiration Index (SPEI) is the degree of deviation between precipitation and evapotranspiration by Vicente Serrano et al. [11] to characterize the drought of a given area. In recent years, the application of SPEI to analyze regional drought has been increasing [12]. The Drought Severity Index (DSI) was proposed by Mu et al. [13]. Further, Jakson et al. [14] proposed considering energy and water exchange between the vegetation, soil and atmosphere and the related Crop Water Stress Index (CWSI). This is a standardized index according to the variation of the degree of water deficit in different time series compared with the standard state. Considering the comprehensive impact of NDVI and LST on drought, Sand Holt et al. [15] proposed the Temperature Vegetation Dryness Index (TVDI), Carlson et al. [16] proposed the Vegetation Supply Water Index (VSWI), Wang et al. [17] proposed the Vegetation Temperature Condition Index (VTCI). Thereafter, the development of a drought index combined with remote sensing technology involved various meteorological and hydrological elements such as soil water content, elevation, LST and NDVI. Liu et al. [18] used BP neural network to propose Integrated Agricultural Drought Index (IDI).
VCI and TCI are easy to calculate and mature in application but data from long time series are easily affected by non-drought stress factors [19]. DSI has unique advantages for global drought monitoring but there are great differences in its regional application. Although it is simple to calculate, it is still affected by non-drought stress factors based on historical data [20]. Therefore, the above three indices do not have universality in drought monitoring in agriculture and forestry. IDI has significant advantages for regional drought simulation but cannot be widely used due to the complexity of its calculation. Most of the previous studies considered the applicability of the index but not under the influence of different lower pad surfaces. Therefore, the Sichuan Province, where the lower pad surface is relatively complex, is selected as the study area. In order to better simulate drought in the study area, CWSI, VSWI, VTCI and TVDI are selected as the fitting models for the study area by comprehensively considering multiple drought stress factors. (The above indices have been widely used due to their simple calculation, easy access to data, and not being easily affected by non-drought stress factors [21,22]). The correlational analysis is conducted using the self-calibrated Palmer Drought Severity Index (sc-PDSI) to comprehensively select an appropriate drought index for the study area; this will provide a scientific basis for drought monitoring and management in the study area.

2. Data and Methods

2.1. Overview of the Study Area

The Sichuan Province is selected as the study area in this paper. The Sichuan Province is located in southwest China and consists of two major areas: the Sichuan Basin and the Western Sichuan Plateau. The terrain of the Sichuan Province is in the transition zone of the first and second steps in China and the lower pad surface has various properties. It is a key development province in southwest China and an economic and cultural center in the region. It is also an important grain-producing area, meaning Sichuan’s ecological environment is vulnerable to the impact of human activities. In the past 20 years, the frequent droughts in the Sichuan Province (represented by high temperatures and drought in 2001, 2006 and 2022) have caused great losses to agricultural production and people’s lives in the Sichuan Province.The geographical location of Sichuan Province is shown in Figure 1.

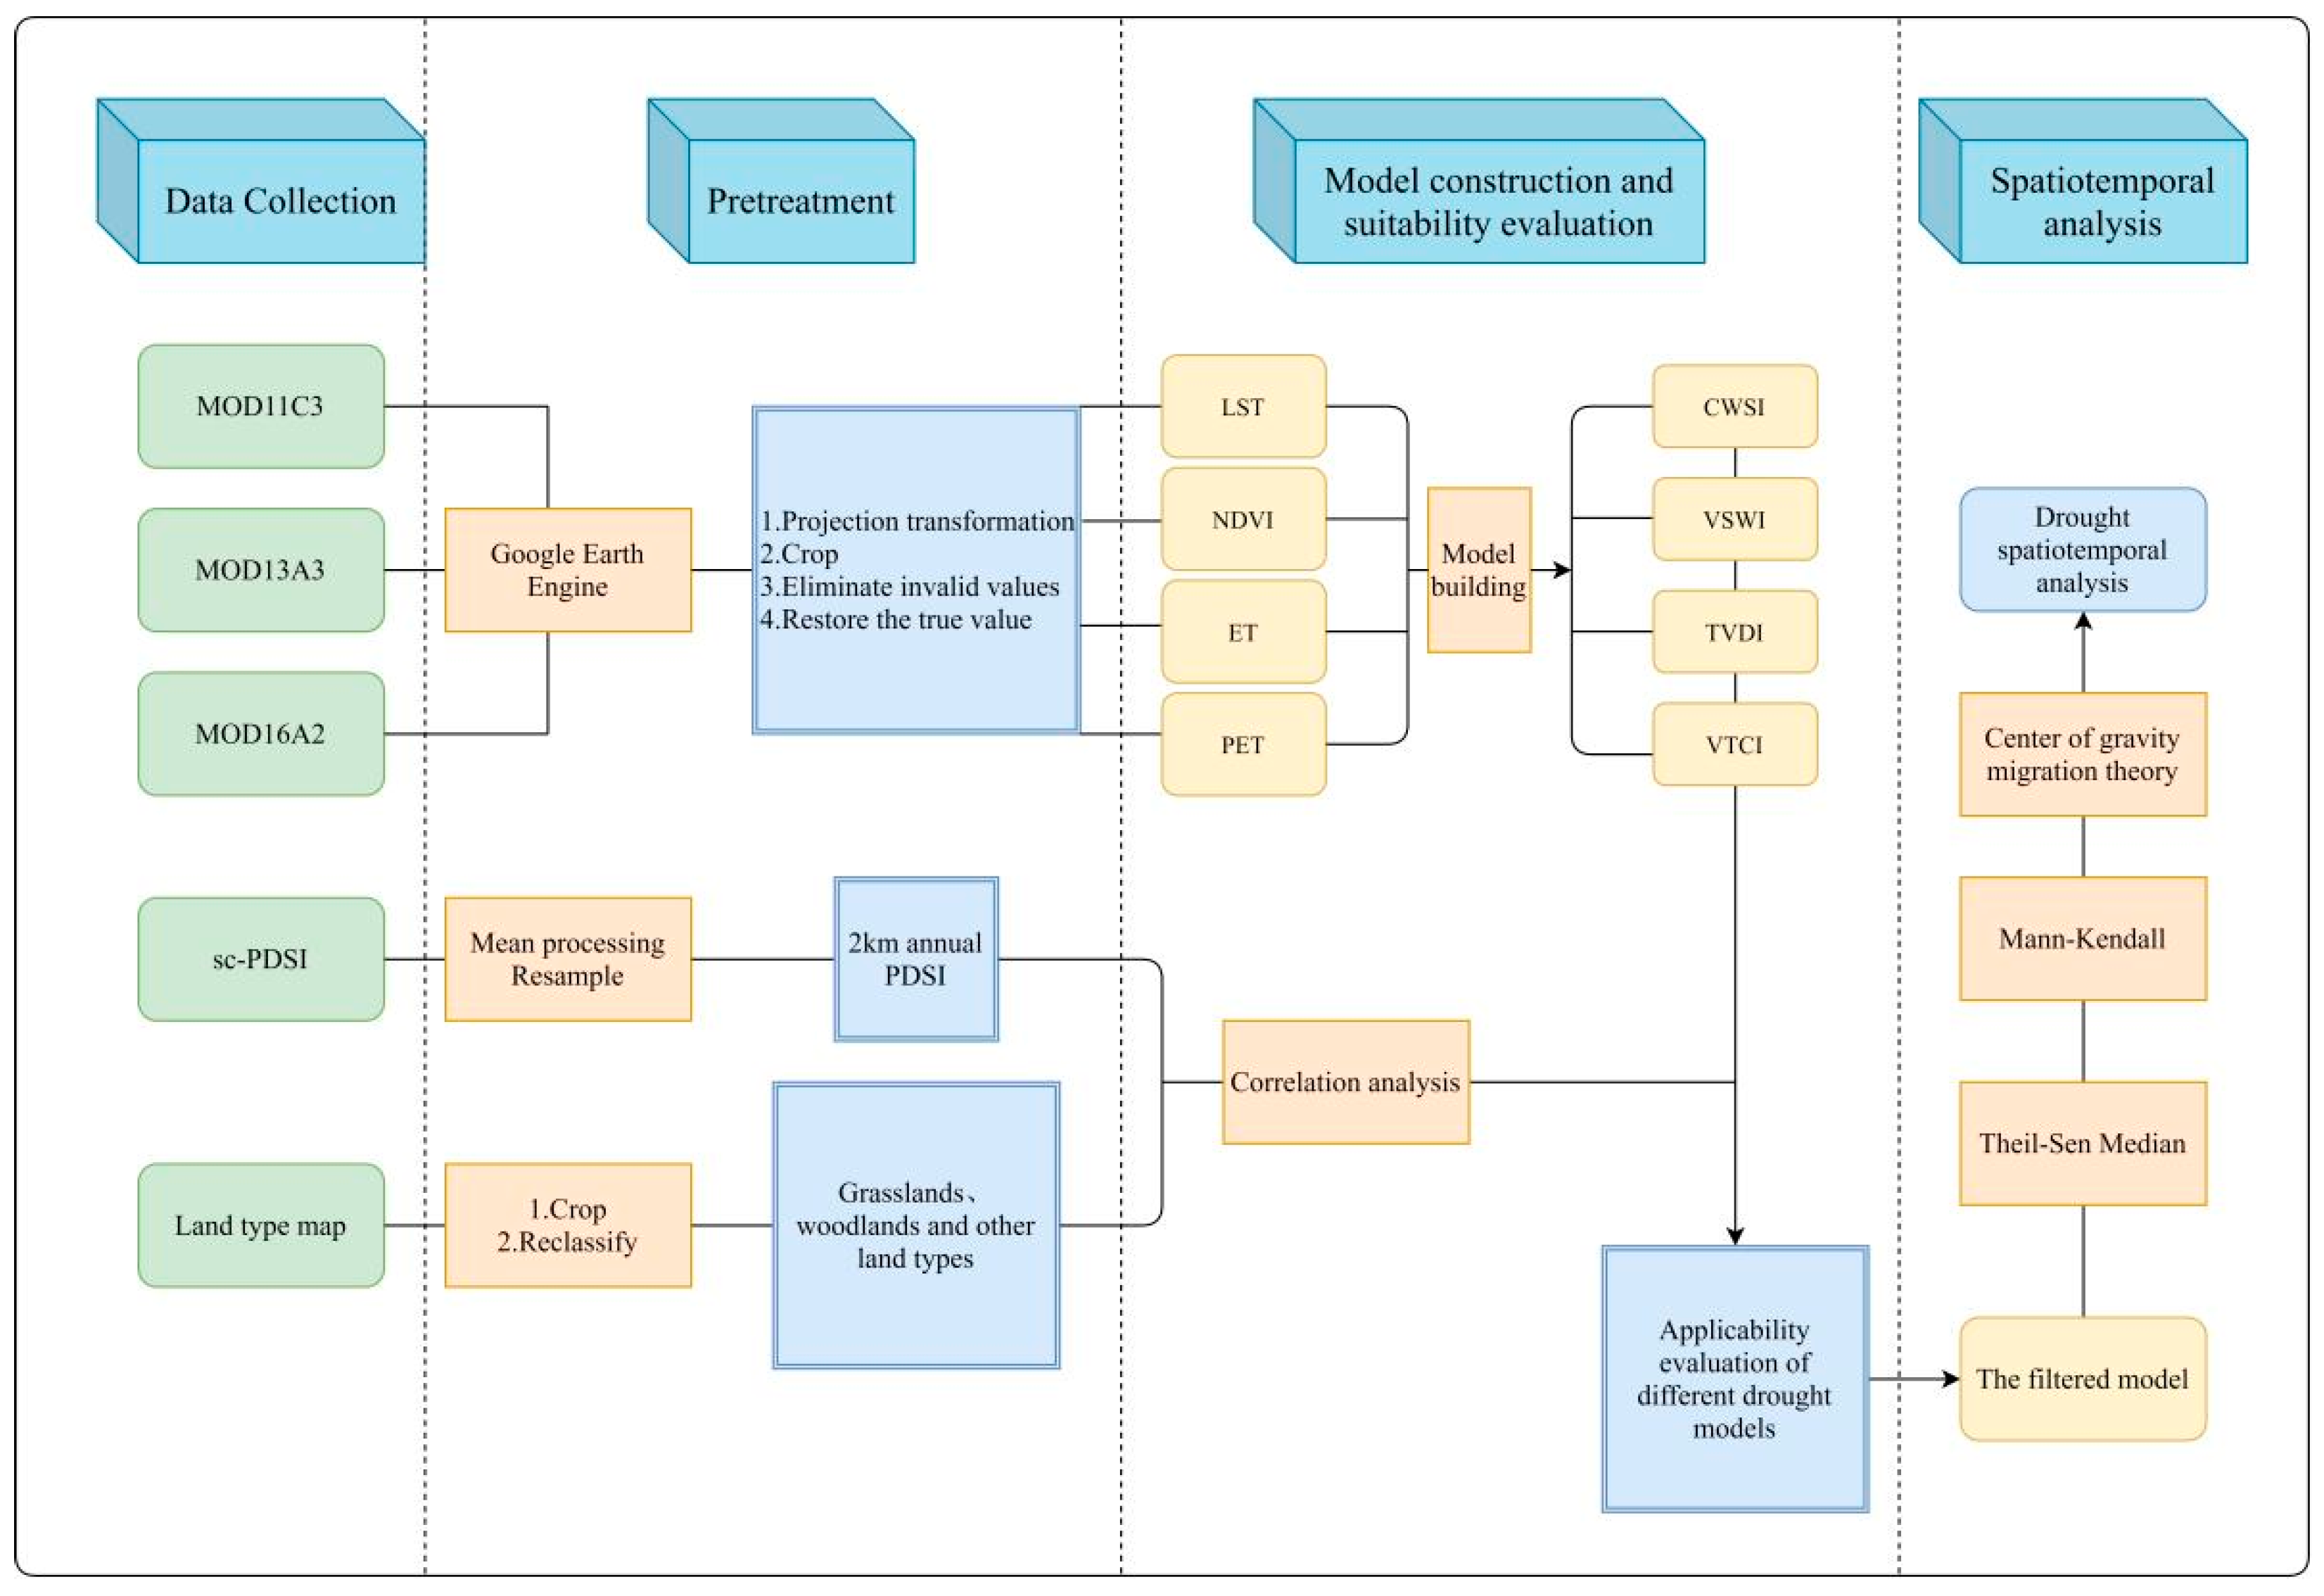
2.2. Data Sources and Research Methods

Using MODIS data and sc-PDSI, the drought model was constructed after preprocessing the data and its accuracy was verified to select a model with good fitting to analyze the spatial and temporal pattern of drought in the study area. The framework of the study was divided into three main parts: data preprocessing, model construction and applicability evaluation, and drought pattern analysis, as shown in Figure 2.

2.2.1. Data Sources

ET, PET, NDVI, and LST data from 2001 to 2020 were obtained from MODIS image data obtained from the National Aeronautics and Space Administration (NASA) (https://ladsweb.modaps.eosdis.nasa.gov/, accessed on 15 April to 20 May 2022). Among them, the MOD11C3 product contains the synthesized LST data on a monthly basis, with a resolution of 0.05° × 0.05°. MOD13A3 had monthly synthesized NDVI with a resolution of 1 km. MOD16A2 synthesized Evapotranspiration (ET) and Potential Evapotranspiration (PET) in 8 days with a resolution of 0.5 km. Google Earth Engine (GEE) was used for data preprocessing and clipping to output Geo-Tiff format with a resolution of 0.5 km. From 2001 to 2020 the sc-PDSI data are from the Climatic Research Unite (https://crudata.uea.ac.uk/, accessed on 1 May 2022) with a spatial resolution of 0.5° × 0.5°. The average calculated from 2001 to 2020 is the average PDSI and sampling to 2 km. The annual mean sc-PDSI from 2001 to 2020 was calculated and the tool “Create fishing nets” in ArcGIS10.8 was used to create 0.5 km×0.5 km fishing nets and their annotation points in the study area. The annotated points were used to obtain the attributes of the source data at each annotated point through the ‘value extraction to point’ tool, and the fishing nets were resampled to 0.5 km by attributing the attributes. The Land cover types data (with a resolution of 1 km) for the Sichuan Province were obtained from the Resource and Environmental Science and Data Center of the Chinese Academy of Sciences (http://www.resdc.cn, accessed on 13 May 2022.). The range of forest, grassland, cultivated land and other land types could be obtained by reclassification.

2.2.2. Research Methods

Four remote sensing-based indices, i.e., the CWSI, VSWI, TVDI, and VTCI, were selected to detect the drought in the study area. According to the principle of water balance, CWSI determines the drought degree of the region according to the soil evapotranspiration deficit. It also involves a variety of agronomic and meteorological factors with clear physical meaning and high reliability. CWSI is defined as:
C W S I = 1 E T / P E T
where ET is the actual evapotranspiration and PET is the potential evapotranspiration. CWSI returns a value between 0 and 1, the larger the value is, the more arid and water scarce the region is, and vice versa.
The physical meaning of VSWI is that vegetation index and canopy temperature remain within a certain range when plants’ water supply is normal, while an insufficient water supply affects plant growth. In order to reduce water loss, foliar stomata will partially close, resulting in a canopy temperature rise.
VSWI is defined as:
V S W I = N D V I / T c
where, NDVI is the normalized vegetation index, and Tc is the canopy temperature of vegetation. Since it is difficult to obtain the canopy temperature, LST is used to replace it. VSWI values are between 0 and 1; the smaller the value is, the more arid and water-scarce the area is, and vice versa.
TVDI (Sandholt et al. [15]) is used in the study of soil moisture. It was found that there were many contour lines in the feature space of TS-NDVI, based upon which the concept of TVDI was proposed. Later, Carlson [16] found that when the vegetation coverage of the study area is large, the scatter plot is obtained by using the LST and NDVI, obtained from remote-sensing data, as the horizontal and vertical coordinates are triangular. The value of TVDI was calculated from the vegetation index and the land surface temperature. Meanwhile, Wang et al. [17] proposed VTCI based on NDVI and LST feature space. The two are defined as:
V T C I = ( L S T N D V I , m a x L S T ) / ( L S T N D V I , m a x L S T N D V I , m i n )
V T C I = ( L S T L S T N D V I , m i n ) / ( L S T N D V I , m a x L S T N D V I , m i n )
L S T N D V I , m a x = a 1 + b 1 × N D V I
L S T N D V I , m i n = a 2 + b 2 × N D V I
where, LST is the surface temperature, and LSTNDVI,min and LSTNDVI,max represent the corresponding minimum and maximum. They correspond to “dry edge” and “wet edge” and a1, a2 and b1, b2, are the fitting coefficients of dry and wet edges, respectively. TVDI and VTCI are both between 0 and 1. The smaller the VTCI value is, the more arid and water scarce the region is, and vice versa. The smaller the TVDI value, the wetter the region is, and vice versa.
The Theil-sen Median method, also known as Sen slope estimation, is a robust non-parametric statistical trend calculation method. This method has high computational efficiency and is insensitive to measurement errors and outliers so it is often used in trend analysis of long-time series data [23]. The Mann–Kendall (MK) test is a non-parametric trend test method for time series, proposed by Mann in 1945 and further improved by Kendall and Sneyers. It does not require the measurement values to follow a normal distribution and is not affected by missing values and outliers so it is suitable for trend significance tests for long time series data. The Sen slope estimation is used to calculate the trend value, which is usually used in combination with the MK nonparametric test; that is, the Sen trend value is calculated first and then the trend significance is determined using the MK method.
According to the center of gravity transfer theory. the geographical center of gravity can reflect the spatial and temporal distribution characteristics of an element. The relative transfer distance and direction to its center of gravity can reflect the variation amplitude and spatial difference of the geographical element in this period. It is often used to reflect the transformation of the economy and population [22]. The application of this technique in drought monitoring can effectively describe the spatial location of the center of gravity shift in arid areas and provide a basis for monitoring research in arid areas.

3. Suitability Assessment and Drought Classification

3.1. Correlation between Remote-Sensing Drought Index and Sc-PDSI

In order to verify the accuracy of spatial and temporal monitoring of the four remote-sensing drought indices, a Pearson coefficient correlation analysis was performed between the four indices and sc-PDSI data (Figure 3). According to the statistical analysis, the correlation coefficients of CWSI, VSWI, TVDI and VTCI are −0.44, 0.32, −0.28 and 0.28, respectively. On the whole, CWSI and TVDI are negatively correlated with sc-PDSI while the other indices are positively correlated with sc-PDSI.
Among them, only the correlation between CWSI and sc-PDSI passes the significance test (p < 0.05) in most regions, which indicates that CWSI has a better fit to the inter-annual variation in soil drought in the study area.
For the correlation coefficients of different land types (Figure 4), it can be seen that CWSI has a higher fitting degree in the steppe. The mean of the correlation coefficient of the steppe is 0.48, which passes the significance test (p < 0.05). Although the mean of woodland is 0.43, it is still much higher than the other three indices. The comprehensive analysis shows that CWSI has great advantages in drought monitoring and simulation in the Sichuan Province.

3.2. Drought Classification

The above correlational analysis shows that the CWSI index has better applicability than other indices in the study area; the CWSI was selected to analyze the spatial and temporal characteristics of drought in the study area. First of all, the drought grade criteria should be divided. In this study, sc-PDSI data were used to classify drought grades (Table 1). Most sc-PDSI data from 2001 to 2020 are between −3 and 2. There are values −3 to −4 in sc-PDSI data of some years, but they are few and they do not exist after the 20-year mean treatment. Therefore, according to the sc-PDSI criteria for drought classification, the drought grade is divided into four classes. In addition, 120 sample points are selected according to the area proportion of different land types in Sichuan Province (Figure 1b). The specific number of sample points is 48 (45.56%) forestland, 20 (13.85%) arable land, 38 (25.12%) grassland, 4 (3.23%) building land and 10 (7.86%) other land. Considering the existence of unsuitable land types such as water area and traffic land and the highest fitting degree of grassland, the number of selected grassland sites is increased and the above 120 sample sites are obtained through data screening of alternative sample sites. We then perform a unary linear regression (Figure 5) to obtain the partition thresholds of CWSI corresponding to different grades (Table 1).

4. Spatial-Temporal Pattern Analysis of Drought in the Sichuan Province

4.1. Variation Characteristics of Drought Time

According to the statistics of CWSI and sc-PDSI index data from each year, Figure 6 shows that the fluctuation range of CWSI is between 0.53 and 0.62 and the fluctuation range of sc-PDSI is between −1.48 and 1.21. CWSI shows an obvious downward trend (p < 0.05), while sc-PDSI shows an obvious upward trend (p < 0.05), indicating that CWSI is consistent with sc-PDSI in terms of the time development trend of drought; that is, the trend of drought in the study area slow down. Based on previous studies, the cumulative anomaly value is determined to be stable; that is, the changing trend does not pass the significance test p < 0.05, which is regarded as the turning interval. According to Figure 6, the drought trend of CWSI and sc-PDSI tend to be consistent, with CWSI on the whole in a downward trend and sc-PDSI in an upward trend (the smaller the CWSI value is, the wetter it is, while the larger sc-PDSI value is, the wetter it is), so the drought situation has been greatly improved. At the same time, the drought and wetness transition intervals of the two indices are both in 2012–2013 and there are significant abrupt changes in 2006 and 2007 (drought caused by high temperatures in the study area in 2006 and 2007). Therefore, the reliability of CWSI for drought monitoring and simulation in the study area is strong.

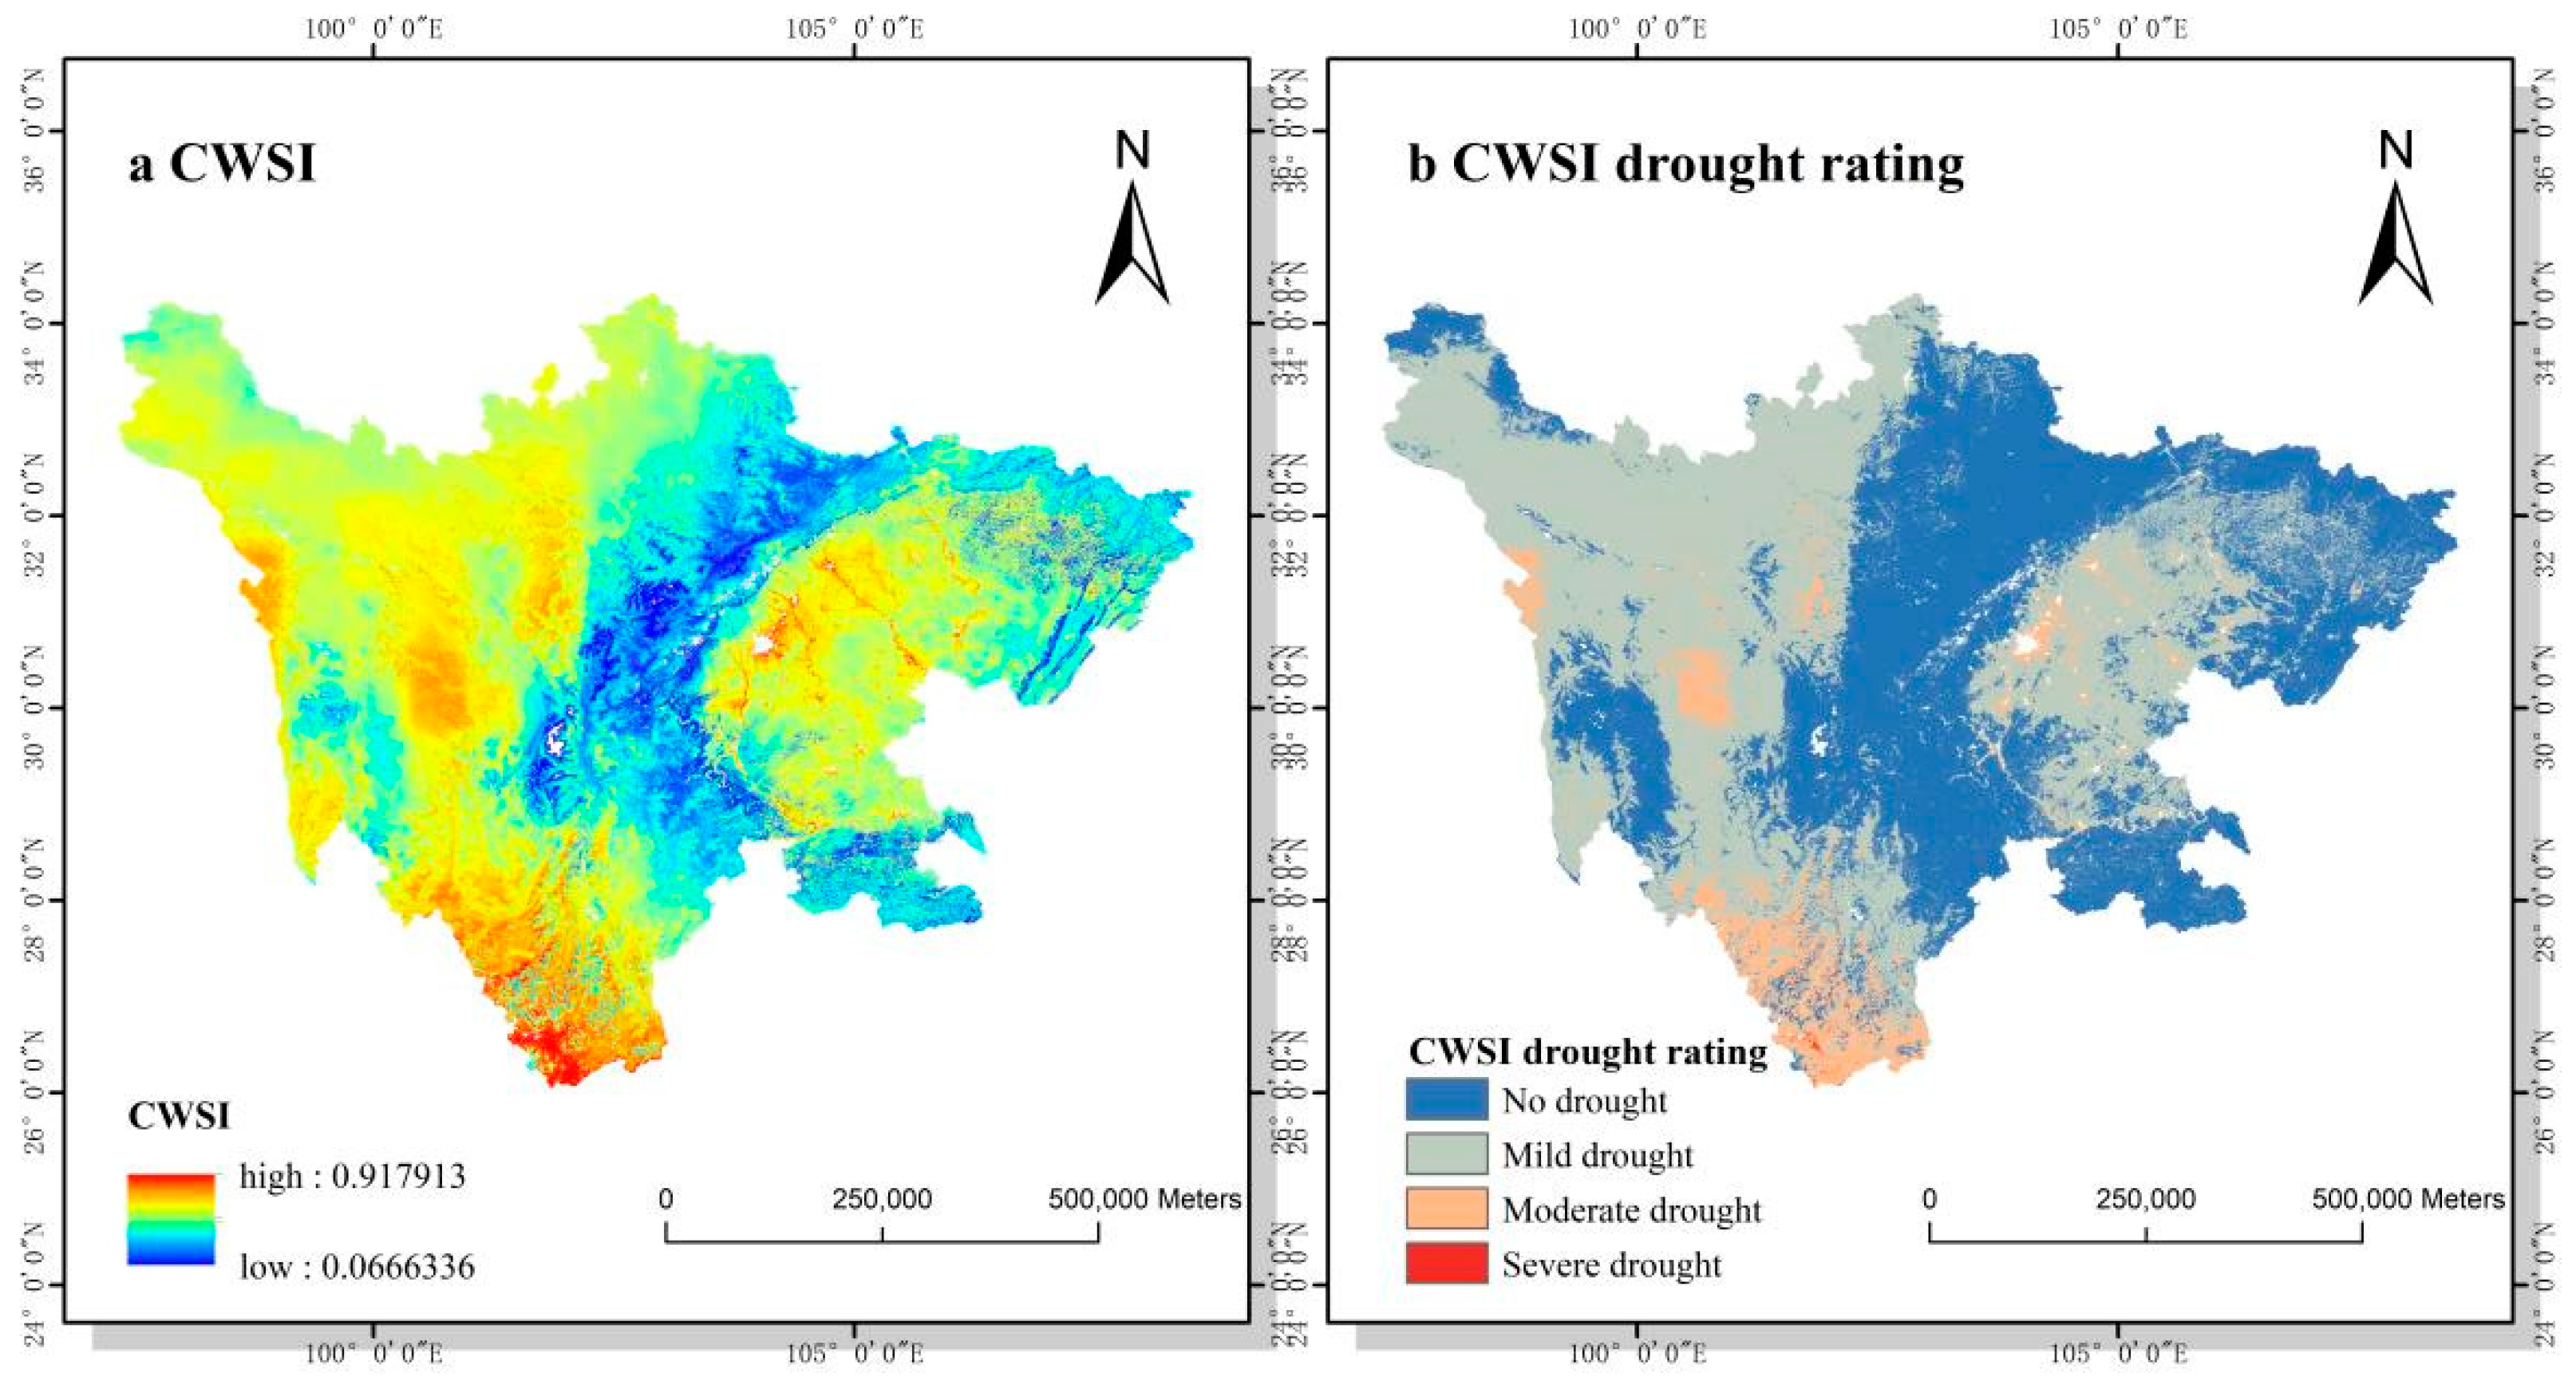
4.2. Spatial Variation Characteristics of Drought

Figure 7 shows the spatial distribution of the multi-annual mean of CWSI and the spatial distribution of the drought grade from 2001 to 2020. The available CWSI values ranged from 0.06 to 0.91. Most of the low values of CWSI are concentrated in the central belt of Sichuan Province; namely, the junction of the plateau and basin. The high-value areas are concentrated in Panzhihua, Xichang, Chengdu and other cities and their surrounding areas, as well as the hinterland of the western Sichuan Plateau. The spatial pattern of high values in the plateau basin junction zone, low values in the two sides of the plateau basin, and low values in the southern Sichuan plateau is generally formed. In terms of the spatial distribution of drought classes, Panzhihua City and the Liangshan Prefecture are the most severe drought areas in the study area, followed by Chengdu City and its surrounding areas and the central region of the Garze Prefecture. The border areas of the plateau basin and Luzhou, Yibin, Dazhou, Bazhong, Guang’an and part of the western Garze Prefecture were drought-free areas. From Figure 7, it can be found that the proportion of mild drought in the total area of the CWSI drought spatial distribution is the largest (60%), which is mainly concentrated in the western Sichuan plateau, followed by the central area of the Sichuan Basin. Secondly, the percentage that is drought-free of the total area is relatively large (33%), and mostly concentrated in the border zone between the western Sichuan Plateau and the Sichuan Basin (western Aba Prefecture, Ya’an, Leshan City, and northern Liangshan Prefecture). The area of moderate drought is relatively small (6%), mainly concentrated in Panzhihua City, the surrounding areas of Chengdu City and the southern areas of the Liangshan Prefecture. The area of severe drought is the smallest (1%) and is mostly distributed in Panzhihua City and a small part of the southern Liangshan Prefecture. Based on the above analysis, the percentages of drought grades in the study area are, in descending order, mild drought > no drought > moderate drought > severe drought.

4.3. Spatial-Temporal Evolution of Drought in the Sichuan Province

The Sen trend and Mann–Kendall method is used to obtain the variation trend of CWSI and the spatial distribution of its significance Figure 8a,b). According to Table 2, the spatial distribution of the trend and significance of CWSI are superimposed and analyzed to obtain the spatial distribution of the detailed changes of drought (Figure 8).
According to Figure 8, it can be seen that the change rate of CWSI from 2001 to 2020 ranged from −0.0366 to 0.0208 and the overall spatial distribution show that the drought mitigation degree in the western region was greater than in the eastern region (Figure 8a). The areas with significant drought changes in the last 20 years are the eastern part of the Sichuan Basin and the northern region of the Garze Prefecture and Aba Prefecture (Figure 8b). Most of the areas with significant changes are “significantly wetter” and the proportion of the area is the largest (46.5%) compared with other areas, followed by “stable and unchanged” (25%), and “wet”, “slightly wet”, “slightly dried”, “dry” and “significantly dried”. Among them, the wetting trend accounts for 79.5% of the total area while the drying trend accounts for only 1.5%. The comprehensive analysis shows that the trend of drought change in the study area is overall wetting, indicating that the drought situation in the study area is getting better overall from 2001 to 2020, and the drought level is easing in most areas (Figure 8c).

4.4. Analysis of the Change of the Drought Center of Gravity in the Sichuan Province

The larger the CWSI value, the greater the degree of drought in the region, so this paper selects the CWSI of drought-prone areas (CWSI > 0.72) as the weight and calculates the distribution of the center of gravity of drought-prone areas every 4 years.
The Gration trajectory of the center of gravity in the drought-prone areas is shown in Figure 9. From the figure, it can be seen that the center of gravity in the drought-prone region of CWSI is concentrated between 101.8° E to 103.6° E and 28.8° N to 29.8° N. On the whole, the center of gravity shifts southward in latitude and westward in longitude. In terms of spatial distribution, the center of gravity shifts from the area around Chengdu in 2001 to Leshan in 2020. Although the drought-prone areas are not distributed in the driest regions, the trajectory of their center of gravity shift can reveal the pattern of drought migration. The overall migration trend of drought-prone areas is from the northeast to the southwest, and then to the northeast.

5. Discussion

The correlation analysis between the four indices and sc-PDSI showed that CWSI is more suitable for drought monitoring in the study area, followed by VSWI. However, since the VSWI index is concentrated in the range 0~0.2, they lack discriminative power for drought class classification, and therefore, cannot meet the adaptation requirements of the study area. CWSI has a greater advantage in regional drought monitoring because ET/PET reflects the energy and water exchange between vegetation, soil, and atmosphere and can better describe soil moisture information [24,25]. NDVI/LST reflects the stress effect of drought on vegetation and can better reflect the effect of soil water deficit on vegetation growth [26,27]. However, it has also been suggested that the dry and wet side fitting equations of LST-NDVI and VTCI of LST and NDVI in TVDI are more influenced by regional differences and vegetation types, and the dry and wet side fitting is not good [28]. Therefore, the drought monitoring of TVDI and VTCI in the study area is not effective and widely affected by regional differences.
The lowest values of CWSI are concentrated in the northwestern part of Sichuan. This is mainly due to the low local temperature, sufficient precipitation, abundant groundwater sources, and a high proportion of irrigated farmland [8]. Similarly, in other areas of the study area with irrigated farmland networks, there are lower values of CWSI. The high values of CWSI are concentrated in Panzhihua city because the subtropical climate of Panzhihua city is controlled by subtropical high pressure, so the climate is dry and rainy, with high variability in the subsurface layer and increased evapotranspiration, resulting in high values of regional CWSI. Since CWSI is based on the vegetation evapotranspiration theory, the external water supply can increase the actual evapotranspiration when the actual evapotranspiration does not reach PET; this may lead to lower CWSI values. CWSI is calculated based on canopy temperature. Canopy temperature is inversely proportional to leaf stomatal closure and evapotranspiration. Stomatal closure is a result of crop water stress, which in turn reduces the transpiration rate of the plant. A low transpiration rate reduces plant cooling; therefore, an increase in canopy temperature is seen as an indicator of water stress. If a meteorological drought occurs due to insufficient precipitation, climate change-induced temperature increases will exacerbate the drought by increasing evapotranspiration. The areas with significant changes in drought trends in Sichuan Province (the eastern part of Sichuan Province, i.e., the Sichuan Basin area) are mostly monsoonal in climate, and their high precipitation and evapotranspiration are highly adaptable to CWSI, forming the advantage of CWSI in drought monitoring simulations in Sichuan Province.
The drought in the study area is mainly concentrated in the southern part of Panzhihua city and its surrounding areas. As a traditional industrial city, the mining of mineral resources in the Panzhihua area has to some extent destroyed the nature of the substratum and weakened the soil water exchange between ET/PET, thus exacerbating the drought in the area. As a result, the drought in the region has been aggravated by human actions. It is closely followed by the central areas of Chengdu and Garze. The drought in Chengdu and its surrounding areas is caused by the change in the nature of the substratum due to the combined effects of urban expansion and the urban heat island effect. However, the drought in Garze is caused by natural factors such as climate and topography; the sparse precipitation and long sunshine hours in the plateau region result in reduced soil moisture. Therefore, the drought monitoring of CWSI shows the drought status. The drought-free areas in the study area are mainly concentrated at the junction of the western Sichuan plateau and the Sichuan basin (western Aba, Ya’an, Leshan, and northern Liangshan). The area is dominated by forest cover with high vegetation coverage and significant elevation differences; high precipitation results in good soil moisture retention. In general, the CWSI results of drought monitoring in Sichuan Province show a good trend, thanks to the emphasis on environmental protection in recent years; for example, the implementation of the policy of “returning farmland to forest and grass” and “Sichuan Ecological Protection Red Line”. As a result, the ecological environment in Sichuan province has been improving and the drought has been alleviated. The center of gravity of drought areas shifted from northeast to southwest to northeast. The specific shift is divided into two phases, 2001–2009 and 2010–2020, reflecting the trend of the center of gravity shifting from the area around Chengdu to southwest Sichuan and then back to Chengdu. This effect is mainly due to the over-exploitation of mineral resources and environmental changes caused by human activities in Panzhihua City before 2009, which formed the drought center and easily shifted to the southwest. From 2010 to 2020, the South Asian high-pressure and subtropical high-pressure systems were active, resulting in high temperatures in the interior. In addition, the eastern plain of Sichuan Province is densely populated, with over-exploited resources and a lack of water conservation projects. Due to natural and man-made causes, drought has shifted eastward.
Different drought monitoring indices have different adaptation statuses in different study areas. In this paper, four drought monitoring indices are constructed, their correlation with sc-PDSI is verified, and the more appropriate CWSI index is selected as the drought monitoring index for the study area. Although index screening is conducted based on the lower pad surface of the study area, it is limited to four factors, ET, PET, NDVI and LST, to analyze the degree of drought. The effects of other factors such as precipitation [29], extreme hazards [30] and topography [31] on drought conditions are not considered.

6. Conclusions

In most areas of the Sichuan Province, woodlands and grasslands are more sensitive to water exchange between vegetation, soil and atmosphere, which means that ET and PET can better reflect the physical processes and thus CWSI has a greater advantage for drought monitoring simulations. Although VSWI has a high correlation in correlation analysis, it is difficult to classify drought classes due to its over-concentration (mostly between 0 and 0.2). The fitted equations of dry and wet edges of TVDI and VTCI are influenced by regional differences and vegetation types, and the dry and wet edges are not well fitted on a large scale. Therefore, CWSI is selected as the best-fitting drought monitoring index in the study area.
The drought monitoring results show that the drought conditions in the study area are gradually improving. From 2001 to 2011 it was relatively dry, with the most severe years ranging from 2006 to 2007 (influenced by the high-temperature drought in Sichuan in 2006); 2012 to 2013 was the transitional interval between dry and wet in the study area. From 2014 to 2020, the study area showed a stable wet trend, especially in the eastern part of the basin. This is mainly due to the improving environmental and drought conditions in Sichuan Province as a result of China’s ecological protection policies. In the eastern plateau, drought occurs only in the central part of the Garze Prefecture, and the drought-intensive areas of the Sichuan Basin are concentrated in Chengdu City and its surrounding areas. In general, Panzhihua City and the southern part of Liangshan Prefecture are the most severely drought-stricken areas. The ratio of drought-rated areas is as follows: mild drought > no drought > moderate drought > severe drought.
The overall drought trend in the study area is improving and the drought mitigation trend is effective, especially in the Sichuan basin. Drought-prone areas are concentrated in the range of 101.8° E–103.6° E and 28.8° N–29.8° N. The center of gravity of drought in drought-prone areas tends to move to the southwest, showing a shift from northeast to southwest to northeast.

Author Contributions

Conceptualization, W.C.; methodology, Y.C.; software, Y.C.; validation, W.C., J.Y. and Y.X.; formal analysis, Y.C. and J.Y.; investigation, W.Z., Y.X. and J.W.; resources, W.C. and Y.W.; data curation, Y.C.; writing—original draft preparation, W.C., Y.C. and J.Y.; writing—review and editing, J.Y., Y.C. and W.Z.; visualization, W.C. and Y.W.; supervision, J.W.; project administration, W.C.; funding acquisition, W.C. All authors have read and agreed to the published version of the manuscript.

Funding

This research was funded by the Humanities and Social Sciences, Ministry of Education of The People’s Republic of China (grant number: 18YJC850004) and the National Natural Science Foundation of China (grant number: 32060370).

Institutional Review Board Statement

Not applicable.

Informed Consent Statement

Not applicable.

Data Availability Statement

The MODIS image data obtained from the National Aeronautics and Space Administration (NASA) (https://ladsweb.modaps.eosdis.nasa.gov/, accessed on 15 April to 20 May 2022). sc-PDSI data comes from the Climatic Research Unit (https://crudata.uea.ac.uk/, accessed on 1 May 2022). Land use data of Sichuan Province are obtained from the Resource and Environmental Science and Data Center of the Chinese Academy of Sciences (http://www.resdc.cn, accessed on 13 May 2022).

Conflicts of Interest

The authors declare no conflict of interest, and the funders had no role in the design of the study; in the collection, analyses, or interpretation of data; in the writing of the manuscript; or in the decision to publish the results.

References

  1. Cheng, Q.P.; Gao, L.; Zhong, F.L.; Zuo, X.A.; Ma, M.M. Spatiotemporal variations of drought in the Yunnan-Guizhou Plateau, southwest China, during 1960–2013 and their association with large-scale circulations and historical records. Ecol. Indic. 2020, 112, 106041. [Google Scholar] [CrossRef]
  2. Gu, Z.J.; Duan, X.W.; Liu, B.; Hu, J.M.; He, J.N. The spatial distribution and temporal variation of rainfall erosivity in the Yunnan Plateau, Southwest China: 1960–2012. Catena 2016, 145, 291–300. [Google Scholar] [CrossRef]
  3. Um, M.J.; Kim, Y.; Park, D. Evaluation and modification of the Drought Severity Index (DSI) in East Asia. Remote Sens. Environ. 2018, 209, 66–76. [Google Scholar] [CrossRef]
  4. Kogan, F.N. Droughts of the late 1980s in the United States as derived from NOAA polar-orbiting satellite data. Bull. Am. Meteorol. Soc. 1995, 76, 655–668. [Google Scholar] [CrossRef]
  5. Kogan, F.N. Application of vegetation index and brightness temperature for drought detection. Adv. Space Res. 1995, 15, 91–100. [Google Scholar] [CrossRef]
  6. Palmer, W.C. Meteorological Drought; US Department of Commerce, Weather Bureau: Washington, DC, USA, 1965; Volume 30.
  7. van der Schrier, G.; Barichivich, J.; Briffa, K.; Jones, P. A scPDSI-based global data set of dry and wet spells for 1901–2009. J. Geophys. Res. Atmos. 2013, 118, 4025–4048. [Google Scholar] [CrossRef]
  8. Li, C.B.; Adu, B.; Li, H.H.; Yang, D.H. Spatial and temporal variations of drought in Sichuan Province from 2001 to 2020 based on modified temperature vegetation dryness index (TVDI). Ecol. Indic. 2022, 141, 109106. [Google Scholar] [CrossRef]
  9. Lewińska, K.E.; Ivits, E.; Schardt, M.; Zebisch, M. Alpine forest drought monitoring in South Tyrol: PCA based synergy between scPDSI data and MODIS derived NDVI and NDII7 time series. Remote Sens. 2016, 8, 639. [Google Scholar] [CrossRef] [Green Version]
  10. Gaire, N.P.; Dhakal, Y.R.; Shah, S.K.; Fan, Z.-X.; Bräuning, A.; Thapa, U.K.; Bhandari, S.; Aryal, S.; Bhuju, D.R. Drought (scPDSI) reconstruction of trans-Himalayan region of central Himalaya using Pinus wallichiana tree-rings. Palaeogeogr. Palaeoclimatol. Palaeoecol. 2019, 514, 251–264. [Google Scholar] [CrossRef]
  11. Vicente-Serrano, S.M.; Beguería, S.; López-Moreno, J.I. A multiscalar drought index sensitive to global warming: The standardized precipitation evapotranspiration index. J. Clim. 2010, 23, 1696–1718. [Google Scholar] [CrossRef]
  12. Sein, Z.M.M.; Zhi, X.; Ogou, F.K.; Nooni, I.K.; Lim Kam Sian, K.T.; Gnitou, G.T. Spatio-temporal analysis of drought variability in myanmar based on the standardized precipitation evapotranspiration index (SPEI) and its impact on crop production. Agronomy 2021, 11, 1691. [Google Scholar] [CrossRef]
  13. Mu, Q.; Zhao, M.; Kimball, J.S.; McDowell, N.G.; Running, S.W. A remotely sensed global terrestrial drought severity index. Bull. Am. Meteorol. Soc. 2013, 94, 83–98. [Google Scholar] [CrossRef] [Green Version]
  14. Jackson, R.D.; Idso, S.; Reginato, R.; Pinter, P., Jr. Canopy temperature as a crop water stress indicator. Water Resour. Res. 1981, 17, 1133–1138. [Google Scholar] [CrossRef]
  15. Sandholt, I.; Rasmussen, K.; Andersen, J. A simple interpretation of the surface temperature/vegetation index space for assessment of surface moisture status. Remote Sens. Environ. 2002, 79, 213–224. [Google Scholar] [CrossRef]
  16. Carlson, T.N.; Gillies, R.R.; Perry, E.M. A method to make use of thermal infrared temperature and NDVI measurements to infer surface soil water content and fractional vegetation cover. Remote Sens. Rev. 1994, 9, 161–173. [Google Scholar] [CrossRef]
  17. Wang, P.-x.; Li, X.-w.; Gong, J.-y.; Song, C. Vegetation temperature condition index and its application for drought monitoring. In Proceedings of the IGARSS 2001. Scanning the Present and Resolving the Future. Proceedings. IEEE 2001 International Geoscience and Remote Sensing Symposium (Cat. No.01CH37217), Sydney, NSW, Australia, 9–13 July 2001; pp. 141–143. [Google Scholar]
  18. Liu, X.; Zhu, X.; Zhang, Q.; Yang, T.; Pan, Y.; Sun, P. A remote sensing and artificial neural network-based integrated agricultural drought index: Index development and applications. Catena 2020, 186, 104394. [Google Scholar] [CrossRef]
  19. Bokusheva, R.; Kogan, F.; Vitkovskaya, I.; Conradt, S.; Batyrbayeva, M. Satellite-based vegetation health indices as a criteria for insuring against drought-related yield losses. Agric. For. Meteorol. 2016, 220, 200–206. [Google Scholar] [CrossRef] [Green Version]
  20. Li, Z.; Han, Y.; Hao, T. Assessing the consistency of remotely sensed multiple drought indices for monitoring drought phenomena in continental China. IEEE Trans. Geosci. Remote Sens. 2020, 58, 5490–5502. [Google Scholar] [CrossRef]
  21. Balsa-Barreiro, J.; Li, Y.; Morales, A. Globalization and the shifting centers of gravity of world’s human dynamics: Implications for sustainability. J. Clean. Prod. 2019, 239, 117923. [Google Scholar] [CrossRef]
  22. Dhorde, A.; Patel, N. Spatio-temporal variation in terminal drought over western India using dryness index derived from long-term MODIS data. Ecol. Inform. 2016, 32, 28–38. [Google Scholar] [CrossRef]
  23. McLeod, A.I. Kendall Rank Correlatoin and Mann-Kendall Trend Test. Available online: https://cran.r-project.org/web/packages/Kendall/index.html (accessed on 5 July 2022).
  24. Allen, R.; Irmak, A.; Trezza, R.; Hendrickx, J.M.; Bastiaanssen, W.; Kjaersgaard, J. Satellite-based ET estimation in agriculture using SEBAL and METRIC. Hydrol. Process. 2011, 25, 4011–4027. [Google Scholar] [CrossRef]
  25. Cooke, W.H.; Mostovoy, G.V.; Anantharaj, V.G.; Jolly, W.M. Wildfire potential mapping over the state of Mississippi: A land surface modeling approach. GIScience Remote Sens. 2012, 49, 492–509. [Google Scholar] [CrossRef] [Green Version]
  26. Park, S.; Im, J.; Jang, E.; Rhee, J. Drought assessment and monitoring through blending of multi-sensor indices using machine learning approaches for different climate regions. Agric. For. Meteorol. 2016, 216, 157–169. [Google Scholar] [CrossRef]
  27. Ren, Y.; Liu, J.; Liu, S.; Wang, Z.; Liu, T.; Shalamzari, M.J. Effects of Climate Change on Vegetation Growth in the Yellow River Basin from 2000 to 2019. Remote Sens. 2022, 14, 687. [Google Scholar] [CrossRef]
  28. Huang, J.; Zhuo, W.; Li, Y.; Huang, R.; Sedano, F.; Su, W.; Dong, J.; Tian, L.; Huang, Y.; Zhu, D. Comparison of three remotely sensed drought indices for assessing the impact of drought on winter wheat yield. Int. J. Digit. Earth 2020, 13, 504–526. [Google Scholar] [CrossRef]
  29. Tirivarombo, S.; Osupile, D.; Eliasson, P. Drought monitoring and analysis: Standardised precipitation evapotranspiration index (SPEI) and standardised precipitation index (SPI). Phys. Chem. Earth Parts A/B/C 2018, 106, 1–10. [Google Scholar] [CrossRef]
  30. Liu, J.; Ren, Y.; Tao, H.; Shalamzari, M.J. Spatial and Temporal Variation Characteristics of Heatwaves in Recent Decades over China. Remote Sens. 2021, 13, 3824. [Google Scholar] [CrossRef]
  31. Awange, J. Drought Monitoring: Topography and Gauge Influence. In Food Insecurity & Hydroclimate in Greater Horn of Africa; Springer: Cham, Switzerland, 2022; pp. 387–420. [Google Scholar]
Figure 1. Study area land type zoning and selection sample points.
Atmosphere 13 01970 g001
Figure 2. Flowchart of drought estimation based on MODIS remote sensing data.
Atmosphere 13 01970 g002
Figure 3. Correlation coefficient between remote-sensing drought Indices and sc-PDSI in 2001–2020.
Atmosphere 13 01970 g003
Figure 4. Correlation coefficient between remote-sensing drought index and sc-PDSI in different vegetation zones in 2001–2020.
Atmosphere 13 01970 g004
Figure 5. Linear regression analysis of PDSI and CWSI in the Sichuan Province from 2001 to 2020.
Atmosphere 13 01970 g005
Figure 6. The interannual variation and cumulative anomaly of CWSI and sc-PDSI.
Atmosphere 13 01970 g006
Figure 7. Trend of drought based on CWSI in Sichuan Province from 2001 to 2020.
Atmosphere 13 01970 g007
Figure 8. The trend of drought based on CWSI in 2001–2020.
Atmosphere 13 01970 g008
Figure 9. Comparison of barycenter trajectories.
Atmosphere 13 01970 g009
Table 1. Drought categories.
Drought Ratingsc-PDSICWSI
No drought>00~0.59
Mild drought−1~00.59~0.72
Moderate drought−2~−10.72~0.85
Severe drought−2~−30.85~0.92
Table 2. Category of significant variation of drought trend.
CWSI SlopeZTrend TypeTrend Features
Slope > 02.58 < |Z|3Significantly dried
1.96 < |Z| 2.58 or less2Dry
1.65 < |Z| 1.96 or less1Slightly dried
Slope = 0Z0Stable and unchanged
Slope < 01.65 < |Z| 1.96 or less−1Slightly wet
1.96 < |Z| 2.58 or less−2Wet
2.58 < |Z|−3Significantly wet
Publisher’s Note: MDPI stays neutral with regard to jurisdictional claims in published maps and institutional affiliations.

