Article

Evaluation of Fengyun-4A Detection Accuracy: A Case Study of the Land Surface Temperature Product for Hunan Province, Central China

1
China Meteorological Administration Training Centre Hunan Branch, Changsha 410125, China
2
Hunan Key Laboratory of Meteorological Disaster Prevention and Reduction, Changsha 410118, China
3
International Center for Ecology, Meteorology and Environment, Jiangsu Key Laboratory of Agricultural Meteorology, Nanjing University of Information Science and Technology, Nanjing 210044, China
4
Hunan Meteorological Research Institute, Changsha 410118, China
5
School of Data Science, Chinese University of Hong Kong, Shenzhen 518172, China
6
Key Laboratory of Atmospheric Sounding, Chengdu University of Information Technology, Chengdu 610225, China
7
Ecology and Agrometeorology Center of Inner Mongolia, Hohhot 010051, China
*
Authors to whom correspondence should be addressed.
Atmosphere 2022, 13(12), 1953; https://doi.org/10.3390/atmos13121953
Submission received: 28 October 2022 / Revised: 17 November 2022 / Accepted: 20 November 2022 / Published: 23 November 2022
(This article belongs to the Special Issue Land Surface Temperature Retrieval Using Satellite Remote Sensing)

Abstract

:
Land surface temperature (LST) is an important parameter in determining surface energy balance and a fundamental variable detected by the advanced geostationary radiation imager (AGRI), the main payload of FY-4A. FY-4A is the first of a new generation of Chinese geostationary satellites, and the detection product of the satellite has not been extensively validated. Therefore, it is important to conduct a comprehensive assessment of this product. In this study, the performance of the FY-4A LST product in the Hunan Province was authenticity tested with in situ measurements, triple collocation analyzed with reanalysis products, and impact analyzed with environmental factors. The results confirm that FY-4A captures LST well (R = 0.893, Rho = 0.915), but there is a general underestimation (Bias = −0.6295 °C) and relatively high random error (RMSE = 8.588 °C, ubRMSE = 5.842 °C). In terms of accuracy, FY-4A LST is more accurate for central-eastern, northern, and south-central Hunan Province and less accurate for western and southern mountainous areas and Dongting Lake. FY-4A LST is not as accurate as Himawari-8 LST; its accuracy also varies seasonally and between day and night. The accuracy of FY-4A LST decreases as elevation, in situ measured LST, surface heterogeneity, topographic relief, slope, or NDVI increase and as soil moisture decreases. FY-4A LST is also more accurate when the land cover is cultivated land or artificial surfaces or when the landform is a platform for other land covers and landforms. The conclusions drawn from the comprehensive analysis of the large quantity of data are generalizable and provide a quantitative baseline for assessing the detection capability of the FY-4A satellite, a reference for determining improvement in the retrieval algorithm, and a foundation for the development and application of future domestic satellite products.

1. Introduction

Land surface processes are important in Earth system research, and accurate modeling of the state of the land surface is essential for predicting the weather, modeling climate, and simulating the water cycle [1,2]. Land surface temperature (LST), which characterizes the state of surface heat balance, is an important physical parameter in modeling land surface processes [3,4], whether in climate, hydrology, ecology, biogeochemistry, or agricultural research [5,6,7].
LST is usually measured by in situ observation, predicted by models, or retrieved from satellite-based remote sensing data. In situ measurements are accurate, but recording stations are sparsely distributed, and their data do not meet the needs of regional-scale research or applications [8]. Models can process long LST time series with high spatial and temporal resolutions, but several input parameters are required, and the accuracy of the product is compromised by land surface inhomogeneity, land cover diversity, and difficulties in parameterizing land surface processes [2]. Satellite-based remote sensing is the principal method of detecting LST, and it provides real-time spatial and temporal distributions of surface temperature at regional and global scales [9]. Of the many techniques used for remote sensing, geostationary satellite-based remote sensing technology uses measurements in the thermal infrared (TIR) spectral bands to obtain LST at high temporal and spatial resolutions.
Remote sensing products require continuous comprehensive assessments to improve both detection technology and product performance [10]. Such activity promotes their use. Thus, new satellite detection technology and new products must be evaluated. The Fengyun-4 series (FY-4) represents the second generation of Chinese geostationary meteorological satellites. The prototype satellite FY-4A was launched on 11 December 2016. Its successful launch and the applications it carries make it a key component of the geosynchronous satellite constellation [11]. The advanced geostationary radiation imager (AGRI), the primary instrument of satellite payload, was designed principally to image land surface, atmosphere, and cloud targets with high spatial and temporal resolution [12]. FY-4A products, from the most advanced integrated atmospheric observation satellite of its time, have not been comprehensively evaluated.
Validating remote sensing products uses many methods of testing and assessment, such as ground-based validation [13], radiance-based validation [14], and satellite product comparison [15]. Temperature and radiance measured in situ provide the most accurate data for validation [16]. Testing product accuracy by directly comparing product data with in situ data is conceptually straightforward, but land surface heterogeneity and scale mismatch can lead to errors in this type of validation [17]. Direct comparison of satellite products may not generate noise-free results and is therefore inadequate for evaluating a remote sensing product in terms of other products [18]. Triple collocation analysis (TCA) is a method of calculating differences in random error in a single geophysical variable between three collocated datasets [19] that does not require the use of a high-quality reference dataset. TCA has become an important method of assessing Earth observation data [20], but it is not widely used to assess LST products. However, the recent development of innovative remote sensing and reanalysis products has resulted in the creation of many independent LST data products, which allows the use of TCA to test the accuracy of remote sensing LST products. All metrics calculated by TCA theoretically lie between the evaluated product and the unknown ground truth value [21], which enables a comparison of the accuracy and error characteristics of different products [22,23].
Various environmental factors distort the data recorded by satellite-based LST products [24,25]. It is necessary to identify how these factors affect the data to ensure the retrieval algorithm extracts accurate data by correcting for the mechanisms that reduce data accuracy. Studies have identified the various ways in which land cover [26,27], landform [28], human activity [29], meteorological conditions [30], and geographic factors [31] reduce the accuracy of satellite-based LST products, and researchers have created corresponding algorithms to increase the accuracy of detected LST data [31]. Identification and modeling of the environmental factors that affect the accuracy of FY-4A/LST data products at a regional scale and analysis of the influencing mechanisms are conducive to the improvement of the algorithms and thus increase product utility.
This study was intended to complete a comprehensive evaluation of the FY-4A/AGRI LST product for Hunan Province, China, and proceeded as follows. We conducted an accuracy test by direct comparison of FY-4A data with in situ measured data. We then conducted TCA with FY-4A data and two reanalysis products and determined the influence of several environmental factors. We used the Himawari-8 Advanced Himawari Imager LST product for comparison; this product is extensively used and has been well-validated in remote sensing LST assessments. The sensing instrumentation is functionally similar to FY-4A/AGRI, which makes the Himawari-8 product good for comparison [32,33] that will provide information used to improve and promote the use of FY-4A LST products. In situ measurement and grid products were included in our assessment, and a variety of methods were used in our comprehensive evaluation. The use of a large quantity of data suggests that the research conclusions are universally generalizable. The results of this study provide a baseline reference for assessing the detection capability of FY-4A and the utility of FY-4A LST products. This study also provides a basic analysis of how environmental factors, such as day and night, seasons, elevation, topography, land cover, landform, soil moisture, and vegetation, affect the accuracy of retrieved LST data. The work of this study supports the adoption and improvement of Fengyun 4 satellite LST products.

2. Materials and Methods
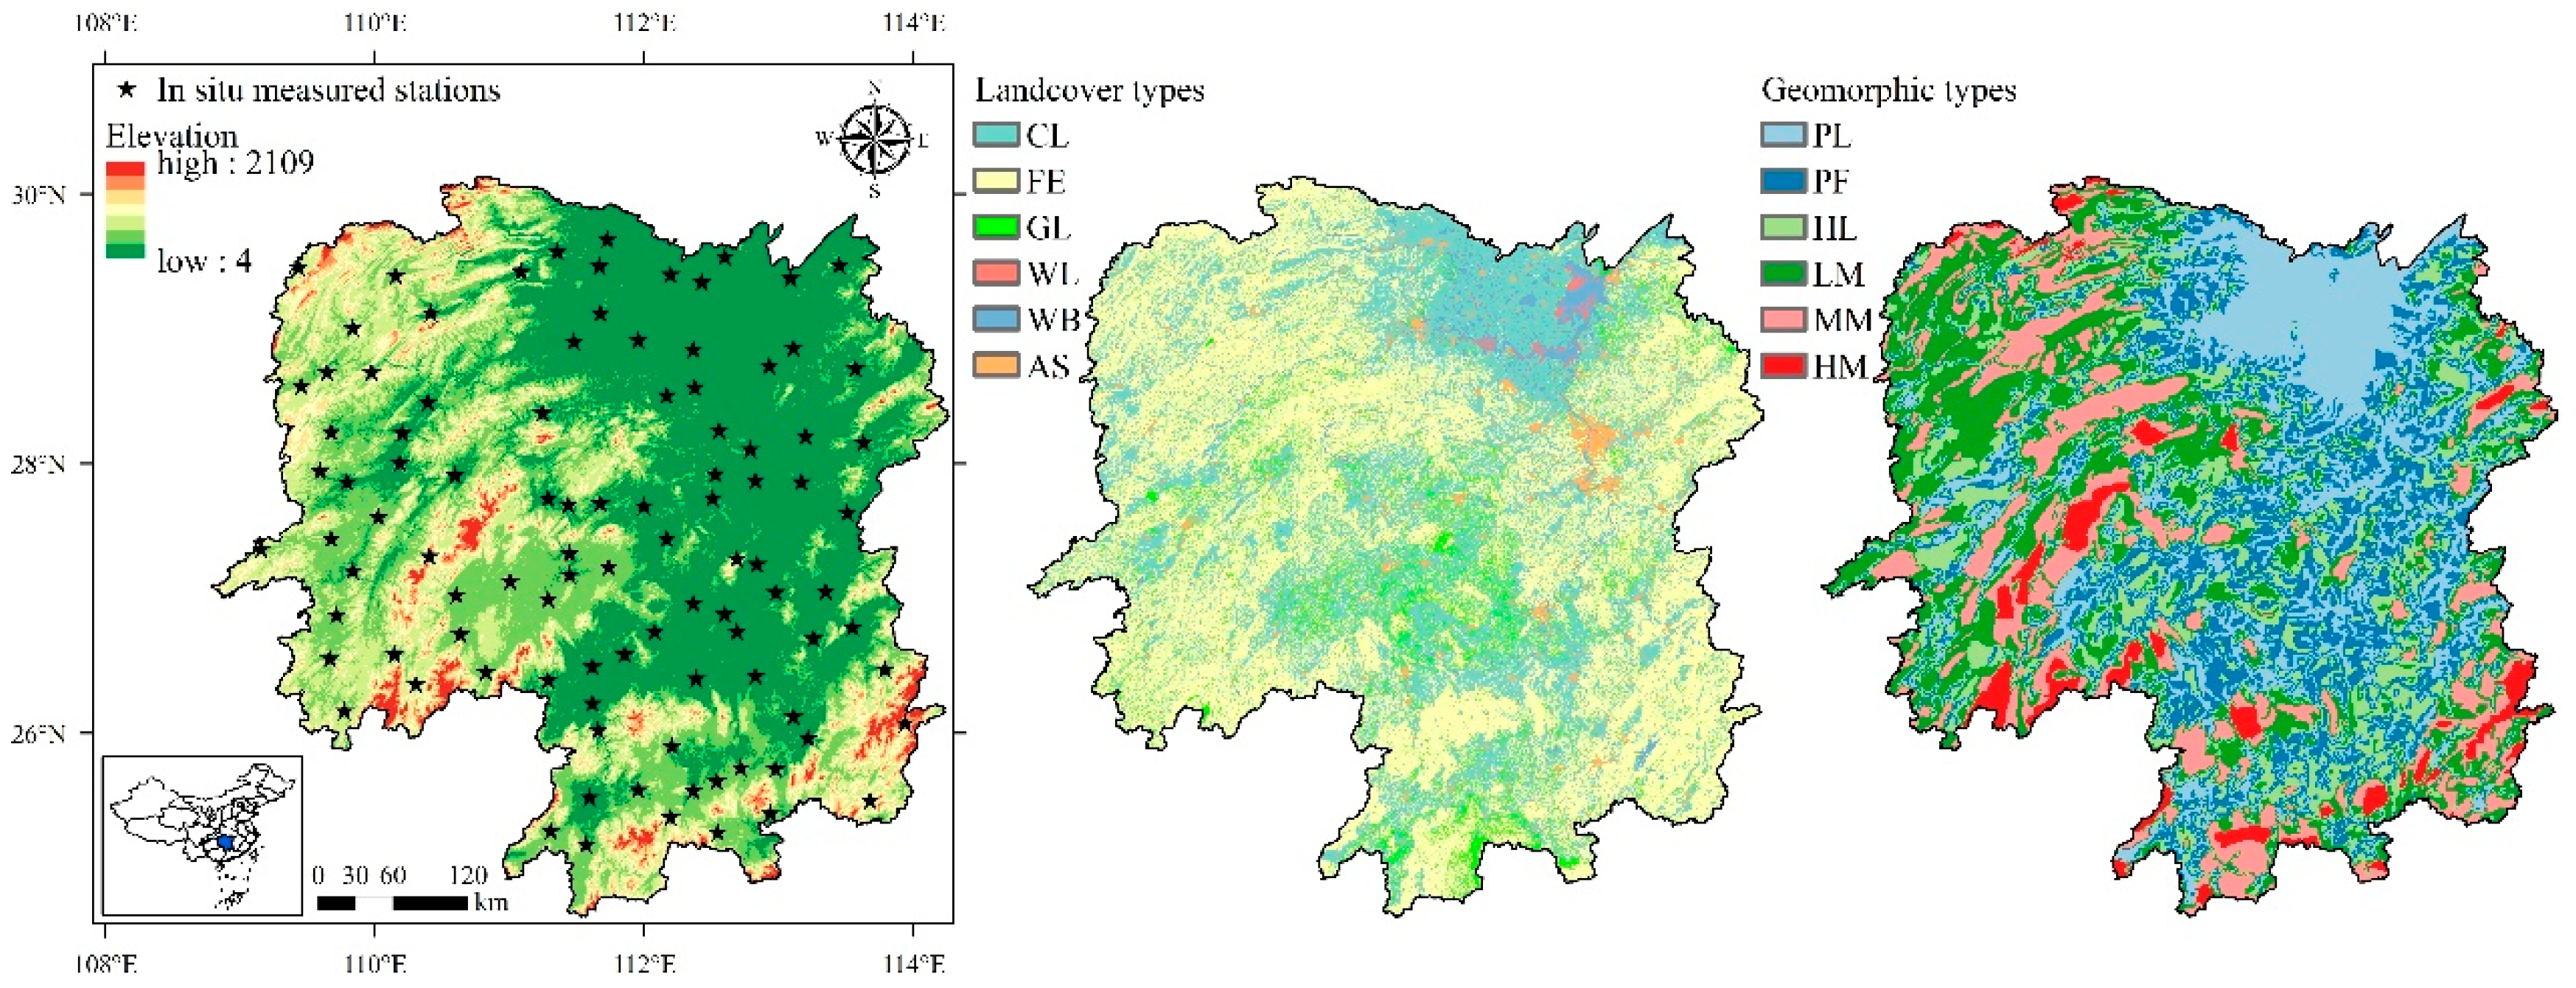
2.1. Study Area

Hunan Province is in south-central China, between 24°38′–30°08′ N and 108°47′–114°15′ E. The province covers an area of 211,800 km2 and is in the transition zone from the Yunnan-Guizhou Plateau to the Jiangnan Hills and the Nanling Mountains to the Jianghan Plain. The province is highest in the south and lowest in the north and is surrounded by mountains on three sides (Figure 1). The central region alternates between hills and river valley basins, and the Dongting Lake Plain in the north is low and flat. The province has a high forest cover and a good natural environment. The climate of Hunan is continental subtropical monsoonal humid with abundant light, heat, and water resources but large intra-annual variations and significant vertical changes.

2.2. Data

The datasets used in this study are shown in Table 1.

2.2.1. Remote Sensing Products

FY-4A/AGRI LST

FY-4A is the first satellite in the FY-4 series of independently developed Chinese second-generation geostationary meteorological satellites. FY-4A was the most advanced integrated atmospheric observation satellite of its time. It was launched in December 2016 and delivered in September 2017, positioned over the equator at 99.5° E (it later drifted to 104.7° E). The three-axis stabilized FY-4 series offers full disk coverage every 15 min or better (in contrast to the 30 min of FY-2), and there is an option for more frequent regional and mesoscale observation modes. The Advanced Geostationary Radiation Imager (AGRI) on FY-4A, with 14 channels, provides data that can be used to improve applications in a wide range of oceanic, land, and atmospheric monitoring activities and in forecasting extreme weather, especially typhoons and thunderstorms [12]. FY-4A LST data retrieval is based on the split-window algorithm [34] and uses two TIR channels (10.3–12.5 µm). The sensitivity of the product is 0.2 K, the spatial resolution is 4 km, and the temporal resolution is up to 15 min. The product was projected using the normalized projection (NOM) and was downloaded from http://satellite.nsmc.org.cn/ (accessed on 2 April 2021). Data were stored in netCDF format.

Himawari-8/AHI LST

Himawari-8 is a Japanese meteorological satellite that became operational in July 2015. It is positioned over the equator at 140° E. The primary instrument aboard Himawari-8 is the advanced Himawari imager (AHI), which is a 16-channel multispectral imager that captures visible light and infrared images of the Asia–Pacific region. AHI is similar to AGRI, so its LST product can be used for comparison with the FY-4A LST product. The Eastern Asia and Oceania LST of the Copernicus LST version 2 datasets derived from Himawari-8 data was retrieved using the generalized split-window algorithm (GSW) for two adjacent TIR channels (10.8–13.1 μm). The spatial resolution is 0.045°, the temporal resolution is 1 h, and it was projected using WGS 1984 and downloaded from http://land.copernicus.eu/ (accessed on 2 April 2021). Data were stored in netCDF format.

2.2.2. In Situ Measured LST Data

The in situ LST measurements were obtained from the National Meteorological Stations of the China Meteorological Administration (CMA). Most of the stations are located in flat terrain areas with uniform land cover and so can represent the local scale land surface state and thus are suitable for verification data (Table A1). All of the in situ data were automatically observed by platinum resistance sensors and subjected to data quality control processes. The data range was (−80, 80) °C, and the accuracy was 0.1 °C. There are 99 stations in Hunan Province (Figure 1), and the data were obtained through the China Integrated Meteorological Information Sharing System (CIMISS) with a temporal resolution of hours.

2.2.3. Reanalysis Products

CLDAS

CMA Land Data Assimilation System (CLDAS) Version 2.0 [35] is a reanalysis grid product developed by CMA that covers Asia (0–65° N, 60–160° E) and consists of model, ground, and satellite data ensembles; it is of better quality than similar international products for China. We used the more accurate near real-time type LST product, which contains 0.0625° equal latitude and longitude grid data with 1 h temporal resolution. The data agreed well with ground observations: for China, the average correlation coefficient was 0.98, root mean square error (RMSE) was 1.8 K, and Bias was 1.4 K. The product was available from http://data.cma.cn/ (accessed on 13 March 2022). The data were saved in netCDF format.

ERA5-Land

The European Centre for Medium-Range Weather Forecasts (ECMWF) ERA5-Land is a fifth-generation reanalysis land surface dataset. ERA5-Land is produced by replaying the land component of the ECMWF ERA5 climate reanalysis; it combines model data with observations from across the world into a globally complete and consistent dataset. The product is available at 1 h temporal resolution and ~9 km spatial resolution from ERA5-Land servers. The ERA5-Land LST product is a state-of-the-art global reanalysis dataset for land applications. When compared with the MODIS LST, it showed a good correlation (correlation coefficient 0.94, Bias 1.36 K, RMSE 3.78) [36]. The product was available at https://cds.climate.copernicus.eu/ (accessed on 2 April 2021). The data were saved in netCDF format.

2.2.4. Auxiliary Data

The following data for environmental factors was used in the assessment.
1. Mean elevations within the FY-4A grids were calculated using a 30 m resolution elevation dataset from the NASA Advanced Spaceborne Thermal Emission and Reflection Radiometer Global Digital Elevation Model Version 3 (https://doi.org/10.5067/ASTER/AST14DEM.003; accessed on 20 January 2021). Slopes were calculated by the arcGIS planar method using this dataset.
2. Land cover type and information entropy within the FY-4A grids were derived from the 30 m resolution land cover dataset of the Ministry of Natural Resources of the People’s Republic of China, GlobalLand30 version 2020 (http://globallandcover.com; accessed on 2 April 2021). Information entropy is a measure of system uncertainty and indicates surface heterogeneity [37,38]. The probability distribution of a random variable X with n possible outcomes is P(X = xi) = pi for i = 1, 2,…, n. Information entropy H(X) is calculated as:
H ( X ) = i = 1 n p i log p i
3. The landform type for FY-4A grids was derived from the 1:1,000,000 dataset of the spatial distribution of landforms in China from the Institute of Geographic Sciences and Natural Resources Research, Chinese Academy of Sciences (https://www.resdc.cn/data.aspx?DATAID=124; accessed on 30 March 2022).
4. The mean value of soil moisture within the FY-4A grids was calculated using the Soil Moisture Active Passive (SMAP) L3 Radiometer Global Daily 36 km EASE-Grid Soil Moisture dataset (https://nsidc.org/; accessed on 15 April 2022) from 1 October 2019 to 30 September 2021.
5. The mean value of the normalized difference vegetation index (NDVI) in the FY-4A grids was calculated using an NDVI dataset with a 16 d acquisition period at 1 km resolution from 22 September 2019 to 30 September 2021. The data were obtained from the Suomi National Polar-Orbiting Partnership NASA Visible Infrared Imaging Radiometer Suite Vegetation Indices (VNP13A2) Version 1 (https://lpdaac.usgs.gov; accessed on 4 April 2022).

2.3. Methods

2.3.1. Research Methods

The LST measurement unit of each product in the study was standardized as °C, and the time was standardized as UTC. Since the data quality flags in FY-4A LST products are identified as invalid parameters, no data filtering was performed on the two remote sensing products. The following steps were taken to conduct this research (Figure 2).
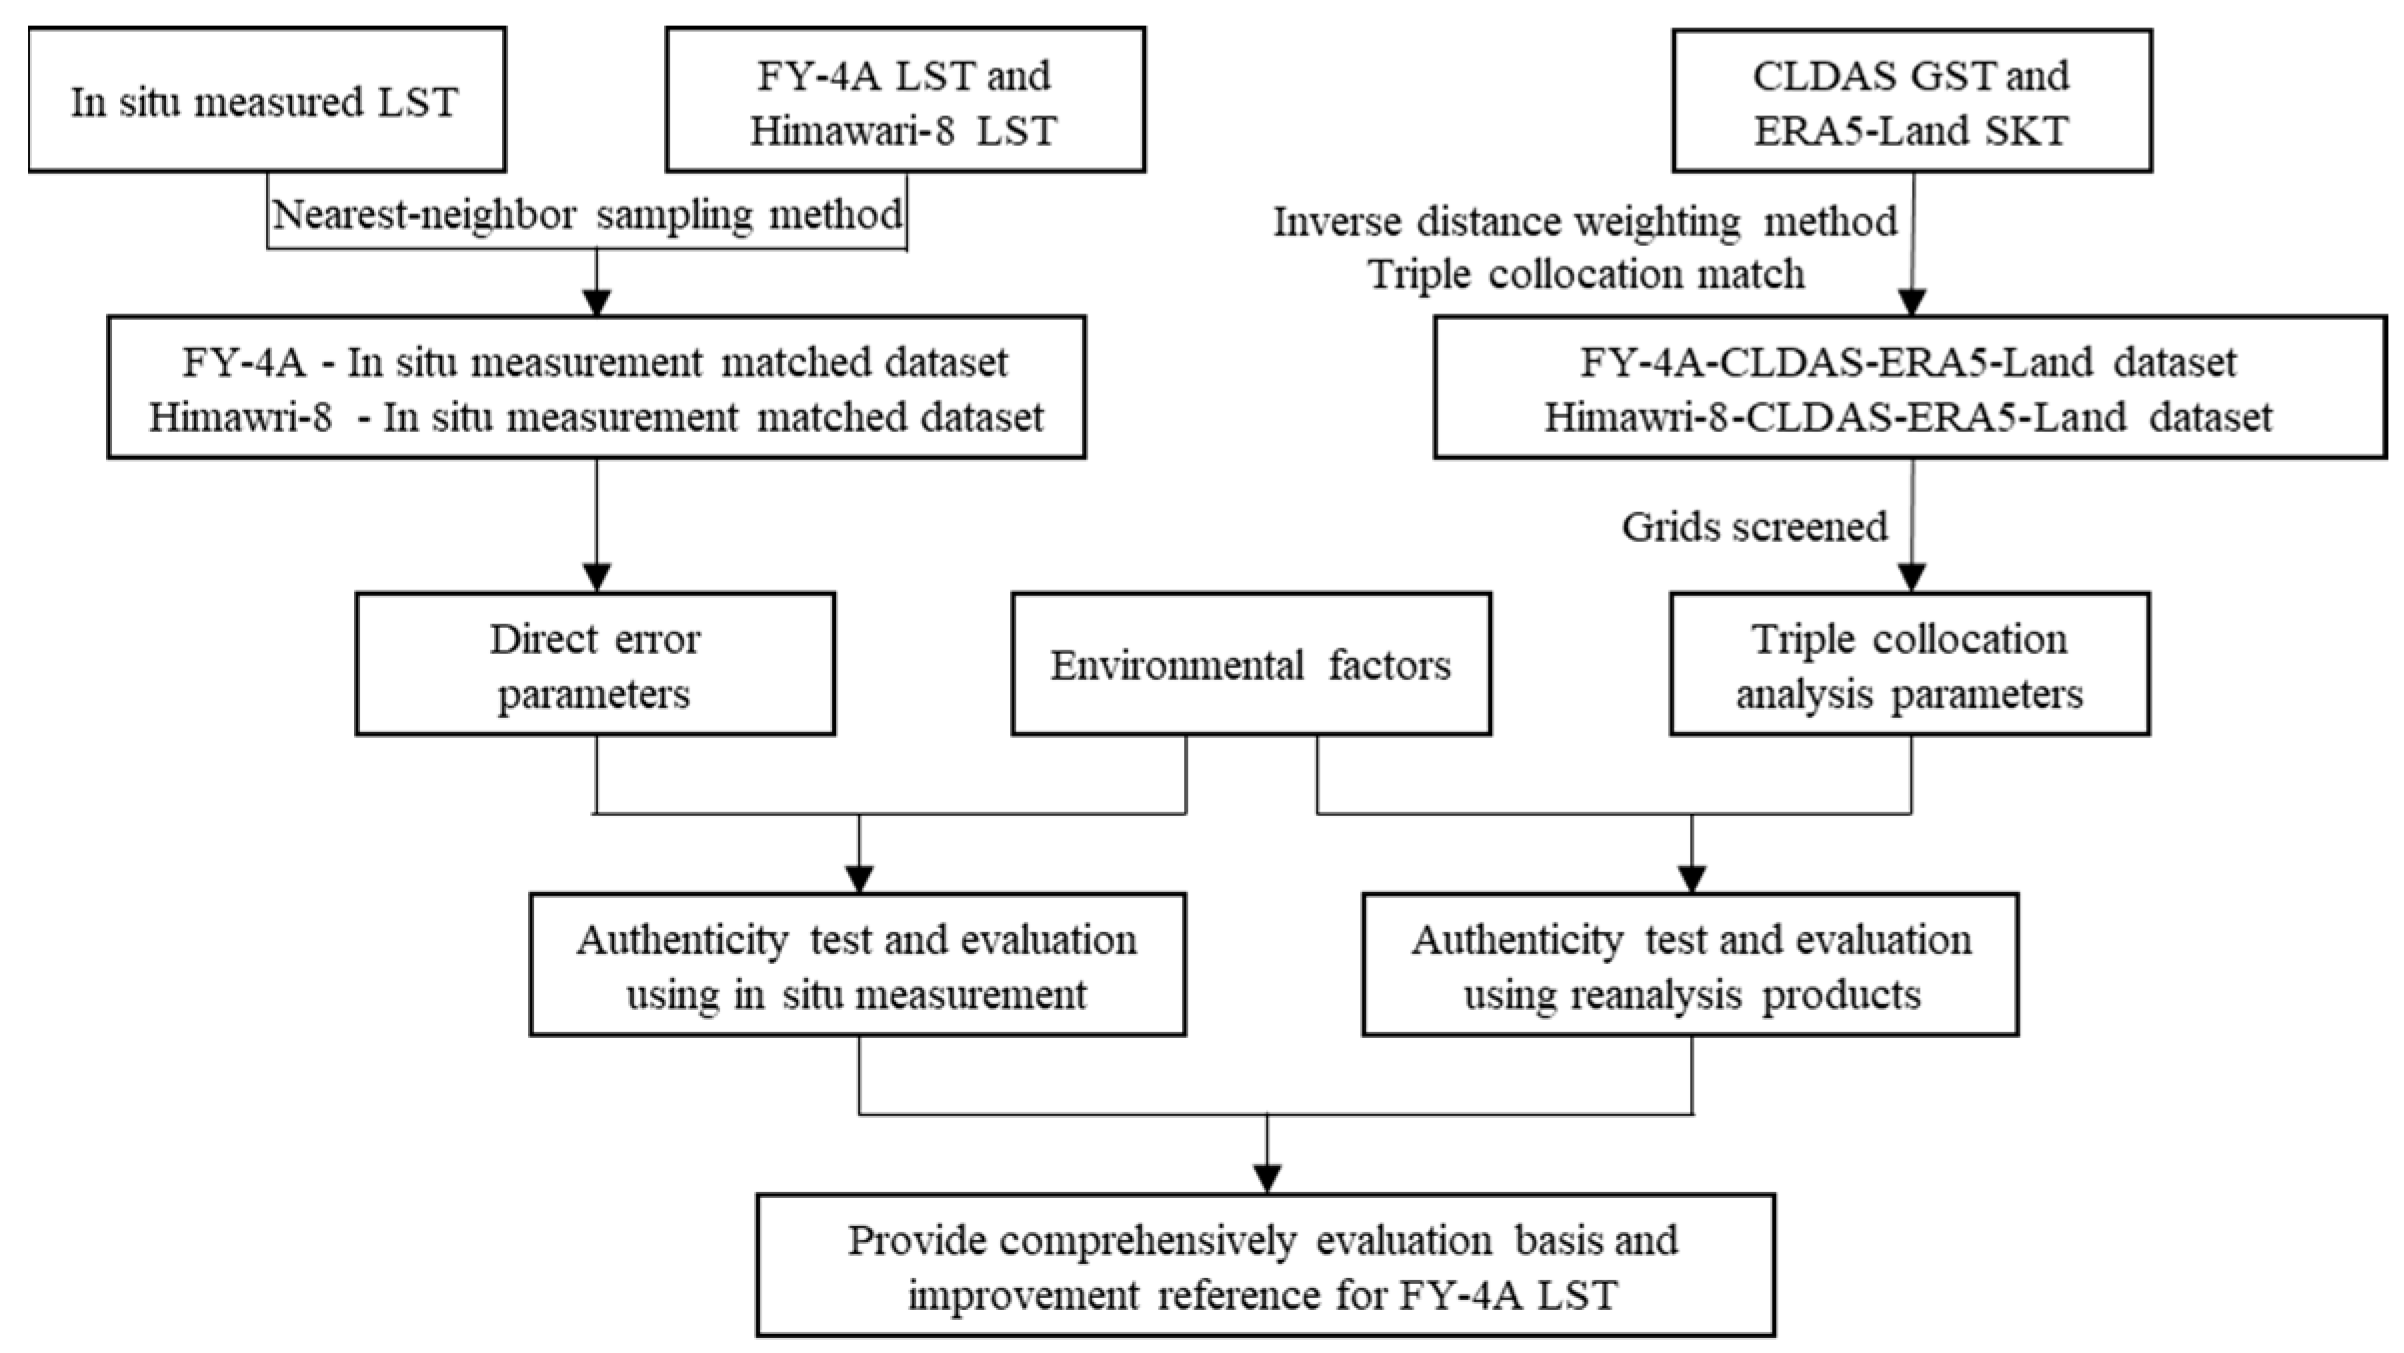
  • Acquire FY-4A/AGRI LST and Himawari-8/AHI LST products from 1 October 2019 0 h to 30 September 2021 23 h and decode and extract data for Hunan Province; carry out nearest-neighbor sampling to match 1 h remote sensing products with in situ measurements. The direct authenticity test and assessment based on measured data use this matched dataset.
  • Obtain the CLDAS ground surface temperature data and the ERA5-Land skin temperature data of ERA5-Land for the same time period as step 1. Resample the CLDAS and ERA5-Land products to the FY-4A and Himawari-8 grids using three points inverse distance weighting, respectively, and match them hour by hour to form the FY-4A-CLDAS-ERA5-Land and Himawari-8-CLDAS-ERA5-Land datasets. The TCA-based LST accuracy assessment was carried out only for grids for which all three datasets were significantly positively correlated [20]; there were >100 data triplets [39].
  • Identify the influencing mechanisms of environmental factors on FY-4A LST products by analyzing the effects of topography, land cover, landform, soil moisture, vegetation, and other environmental factors on TCA errors.

2.3.2. Performance Indicators

Direct Authenticity Test

The performance of remote sensing LST products in Hunan Province was assessed using the following error parameters: Pearson correlation coefficient (R), Bias, relative bias (Biasr), root mean square error (RMSE), and unbiased RMSE (ubRMSE). The equations for these indexes are:
R = cov ( R S T , I S T ) σ R S T σ I S T
B i a s = 1 m i = 1 m ( R S T i I S T i )
B i a s r = 1 m i = 1 m | R S T i I S T i | I S T i
R M S E = 1 m i = 1 m ( R S T i - I S T i ) 2
u b R M S E = R M S E 2 B i a s 2
where RST is the LST of each remote sensing-based product, IST is the in situ measured LST, cov() is the covariance, and σ is the standard deviation.

Triple Collocation Analysis

The following parameters were used as indicators of TCA: Sensitivity, standard error (Stderr), correlation coefficient (Rho), fractional RMSE (fRMSE), and signal-to-noise ratio in decibels (Snr_db). The equations used are:
Sensitivity a = cov ( a , b ) × cov ( a , c ) cov ( b , c )
Errvar a = cov ( a , a ) S e n s i t i v i t y a
If   Errvar a     0 ,   then   S t d e r r a = Errvar a
Rho = [ cov ( a , b ) × cov ( a , c ) cov ( a , a ) × cov ( b , c ) s i g n ( cov ( a , c ) × cov ( b , c ) ) × cov ( a , b ) × cov ( b , c ) cov ( b , b ) × cov ( a , c ) s i g n ( cov ( a , b ) × cov ( b , c ) ) × cov ( a , c ) × cov ( b , c ) cov ( c , c ) × cov ( a , b ) ]
f R M S E = 1 R h o 2
S n r a = cov ( a , a ) × cov ( b , c ) cov ( a , b ) × cov ( a , c ) 1
If   Snr a     0 ,   then   S n r _ d b a = 10 × log ( S n r a )
where a, b and c are the triple-collocated LST products in each grid.
Of the preceding parameters, greater values of R, Sensitivity and Rho, and lesser values of Bias, Biasr, RMSE, ubRMSE and Stderr, indicate better product performance. The value of fRMSE has a well-defined range from 0 (perfect estimates) to 1 (total noise, with no ground truth signal), with values > ∼0.7 indicating an error variance that exceeds the variance of the true time series [40]. A value of zero for Snr_db indicates that signal variance is equal to noise variance; +3 (+6) dB indicates that signal variance is twice (four times) noise variance; −3 (−6) dB indicates that signal variance is half (one-fourth) noise variance, and so forth [20].

3. Results

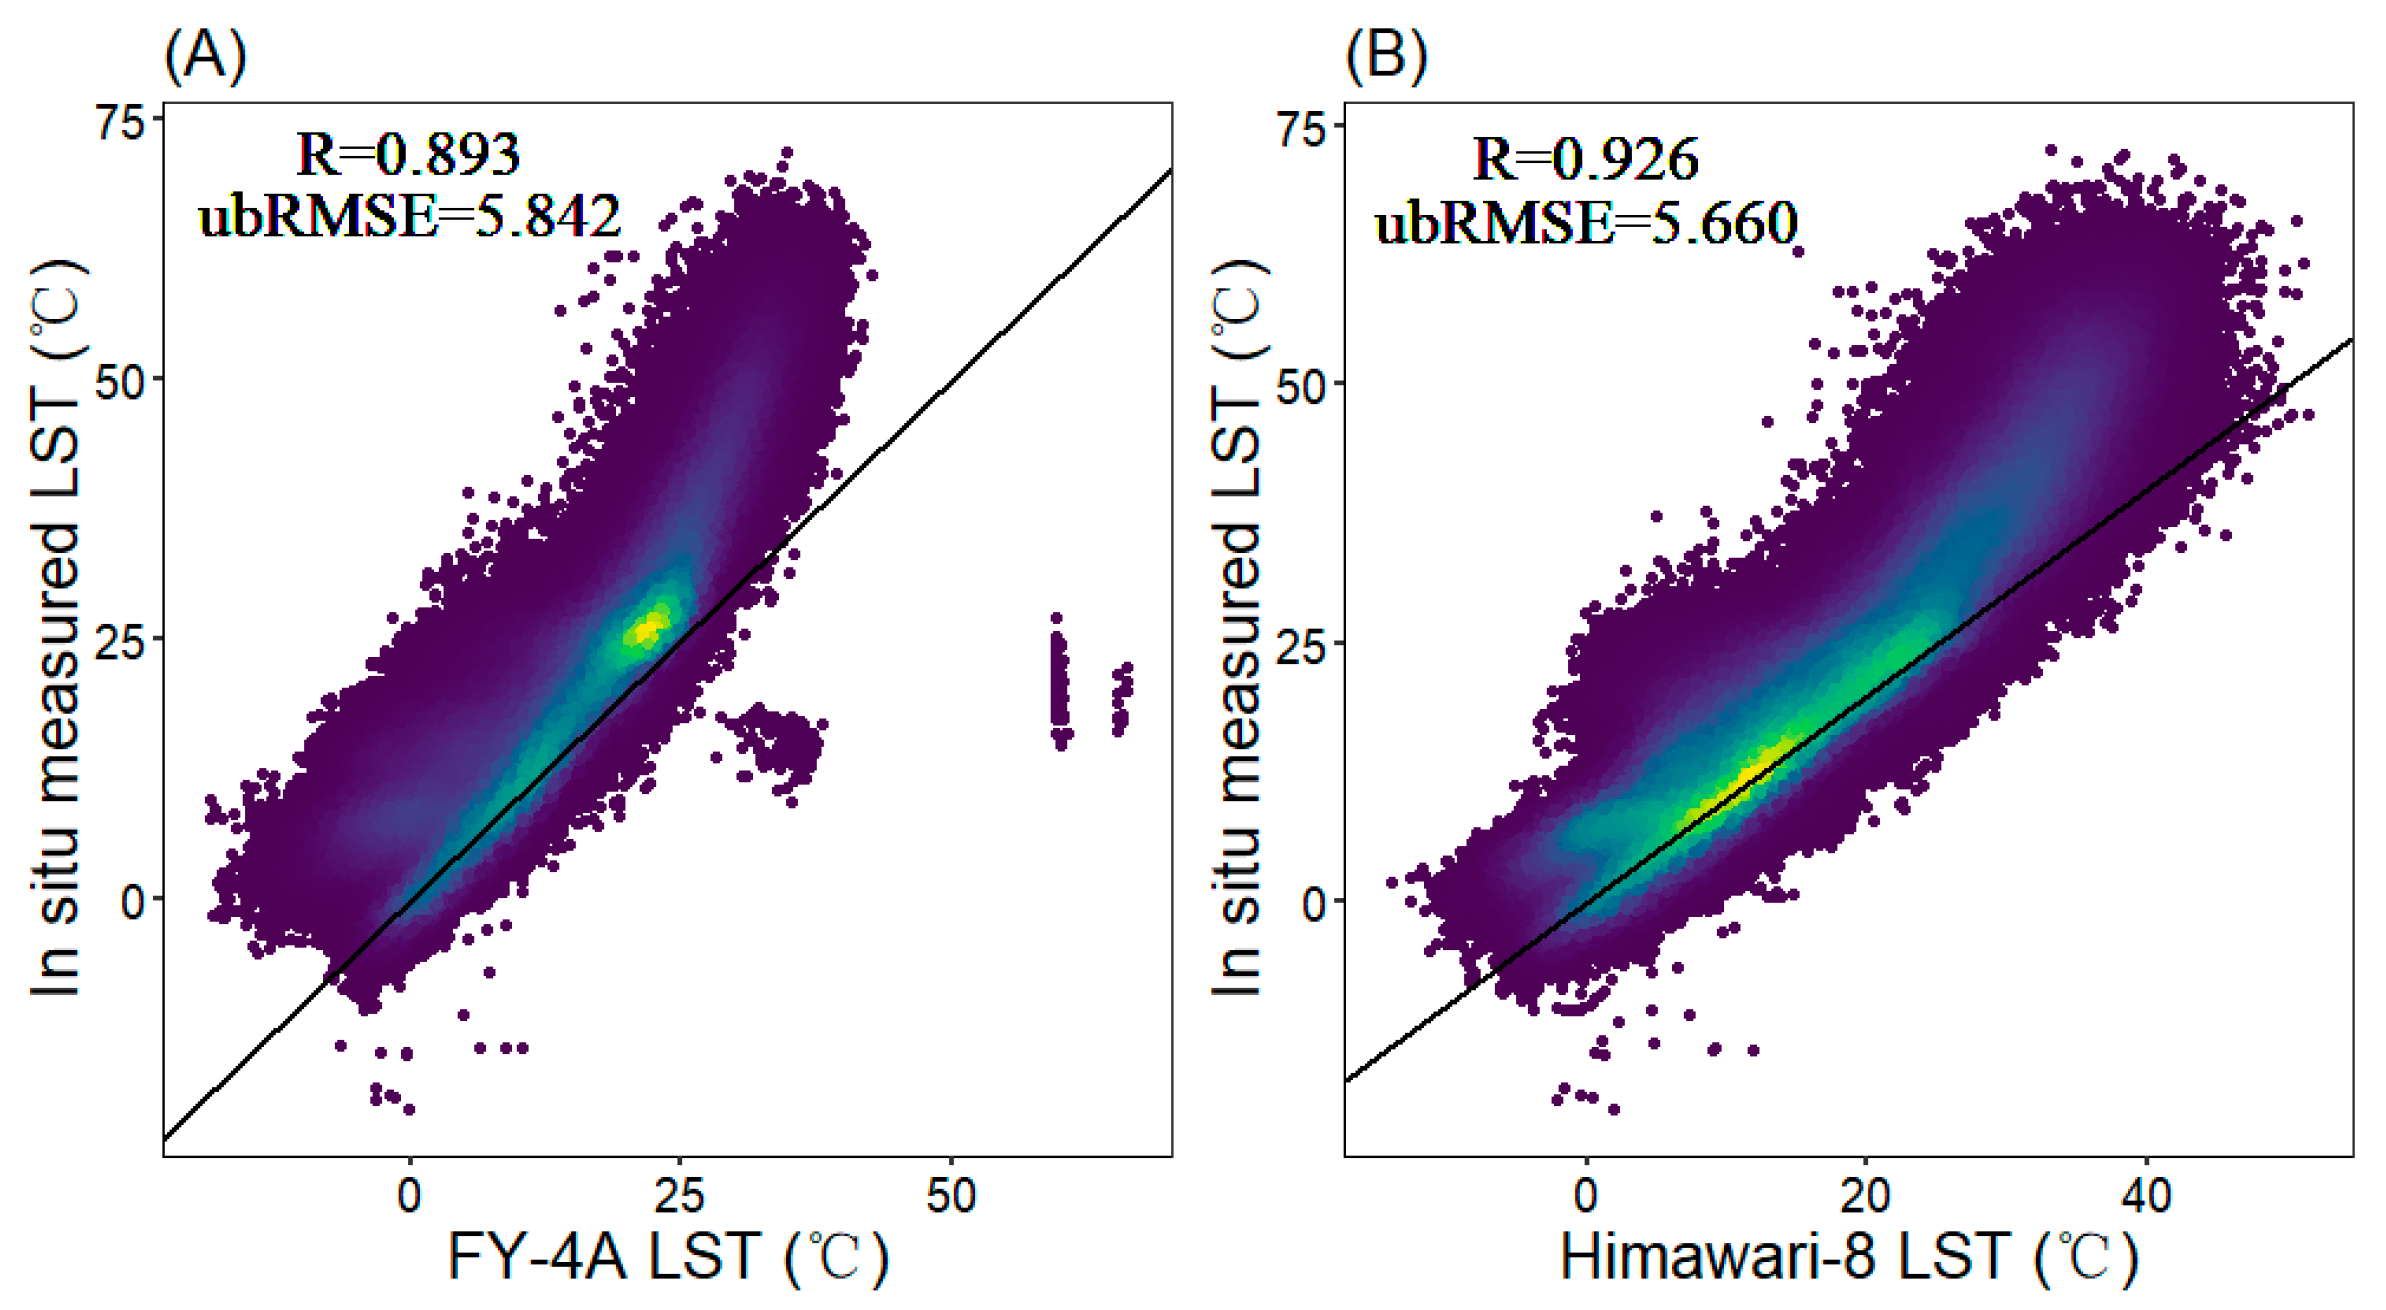
3.1. Direct Authenticity Test and Evaluation of FY-4A LST Using In Situ Measurement

Comparative analysis of the FY-4A LST hourly data for Hunan Province matched with in situ measurements from 1 October 2019 0h to 30 September 2021 23 h shows (Table 2) that the FY-4A product captured changes in the surface temperature well (R = 0.893), but that it generally underestimated LST (Bias = −6.295 °C) and had some deviation from in situ measurement (RMSE = 8.58 °C; ubRMSE = 5.842 °C). FY-4A was better at capturing daytime surface temperature changes than nighttime changes but also had greater Bias; ubRMSE was significantly lower than RMSE, indicating that FY-4A was more affected by random errors in observations. The Himawari-8 LST product was better than FY-4A in terms of all parameters except that there was overall less data due to the coarser resolution of the product; the deviation in LST was clearly less, as shown by Bias and RMSE.
When LST was low (<25 °C), the accuracy of FY-4A LST was better and stable. The center of density of its scatterplot was around the y = x line, but as the temperature increased, the deviation from observation gradually increased, and the underestimation of LST became greater (Figure 3), which may be one reason for its larger overall error (Table 2); there were also some outliers in the product. In contrast, the Himawari-8 LST product was overall more stable, with the center of density of the scatterplot close to the y = x line. This product also showed less deviation from direct observation than FY-4A at higher values of LST (>25 °C).
Table 3 shows the values of indicators when FY-4A LST was compared with in situ measurement for equivalent classification of environmental factors. It can be seen that FY-4A LST was worst (R, Bias, RMSE were all worst) when LST was highest (49–72 °C). When LST was low (−20–3 °C), FY-4A performed better according to several indicators (Bias, RMSE, ubRMSE were all optimal), but its ability to capture changes in land surface temperature was not good (R) in this temperature range; the better indicator values may be due to the lower values of LST in this temperature range, as can be seen from the maximum value of Biasr. The better performance of the FY-4A LST product in autumn and winter and the worse performance in summer may be related to mean LST (minimum Biasr in summer). The ability of the FY-4A LST product to capture changes in LST decreased as elevation increased (R gradually decreased), but the deviation from in situ observation gradually decreased (Bias and RMSE both improve greatly). This may also be related to the decrease in LST as elevation increased.

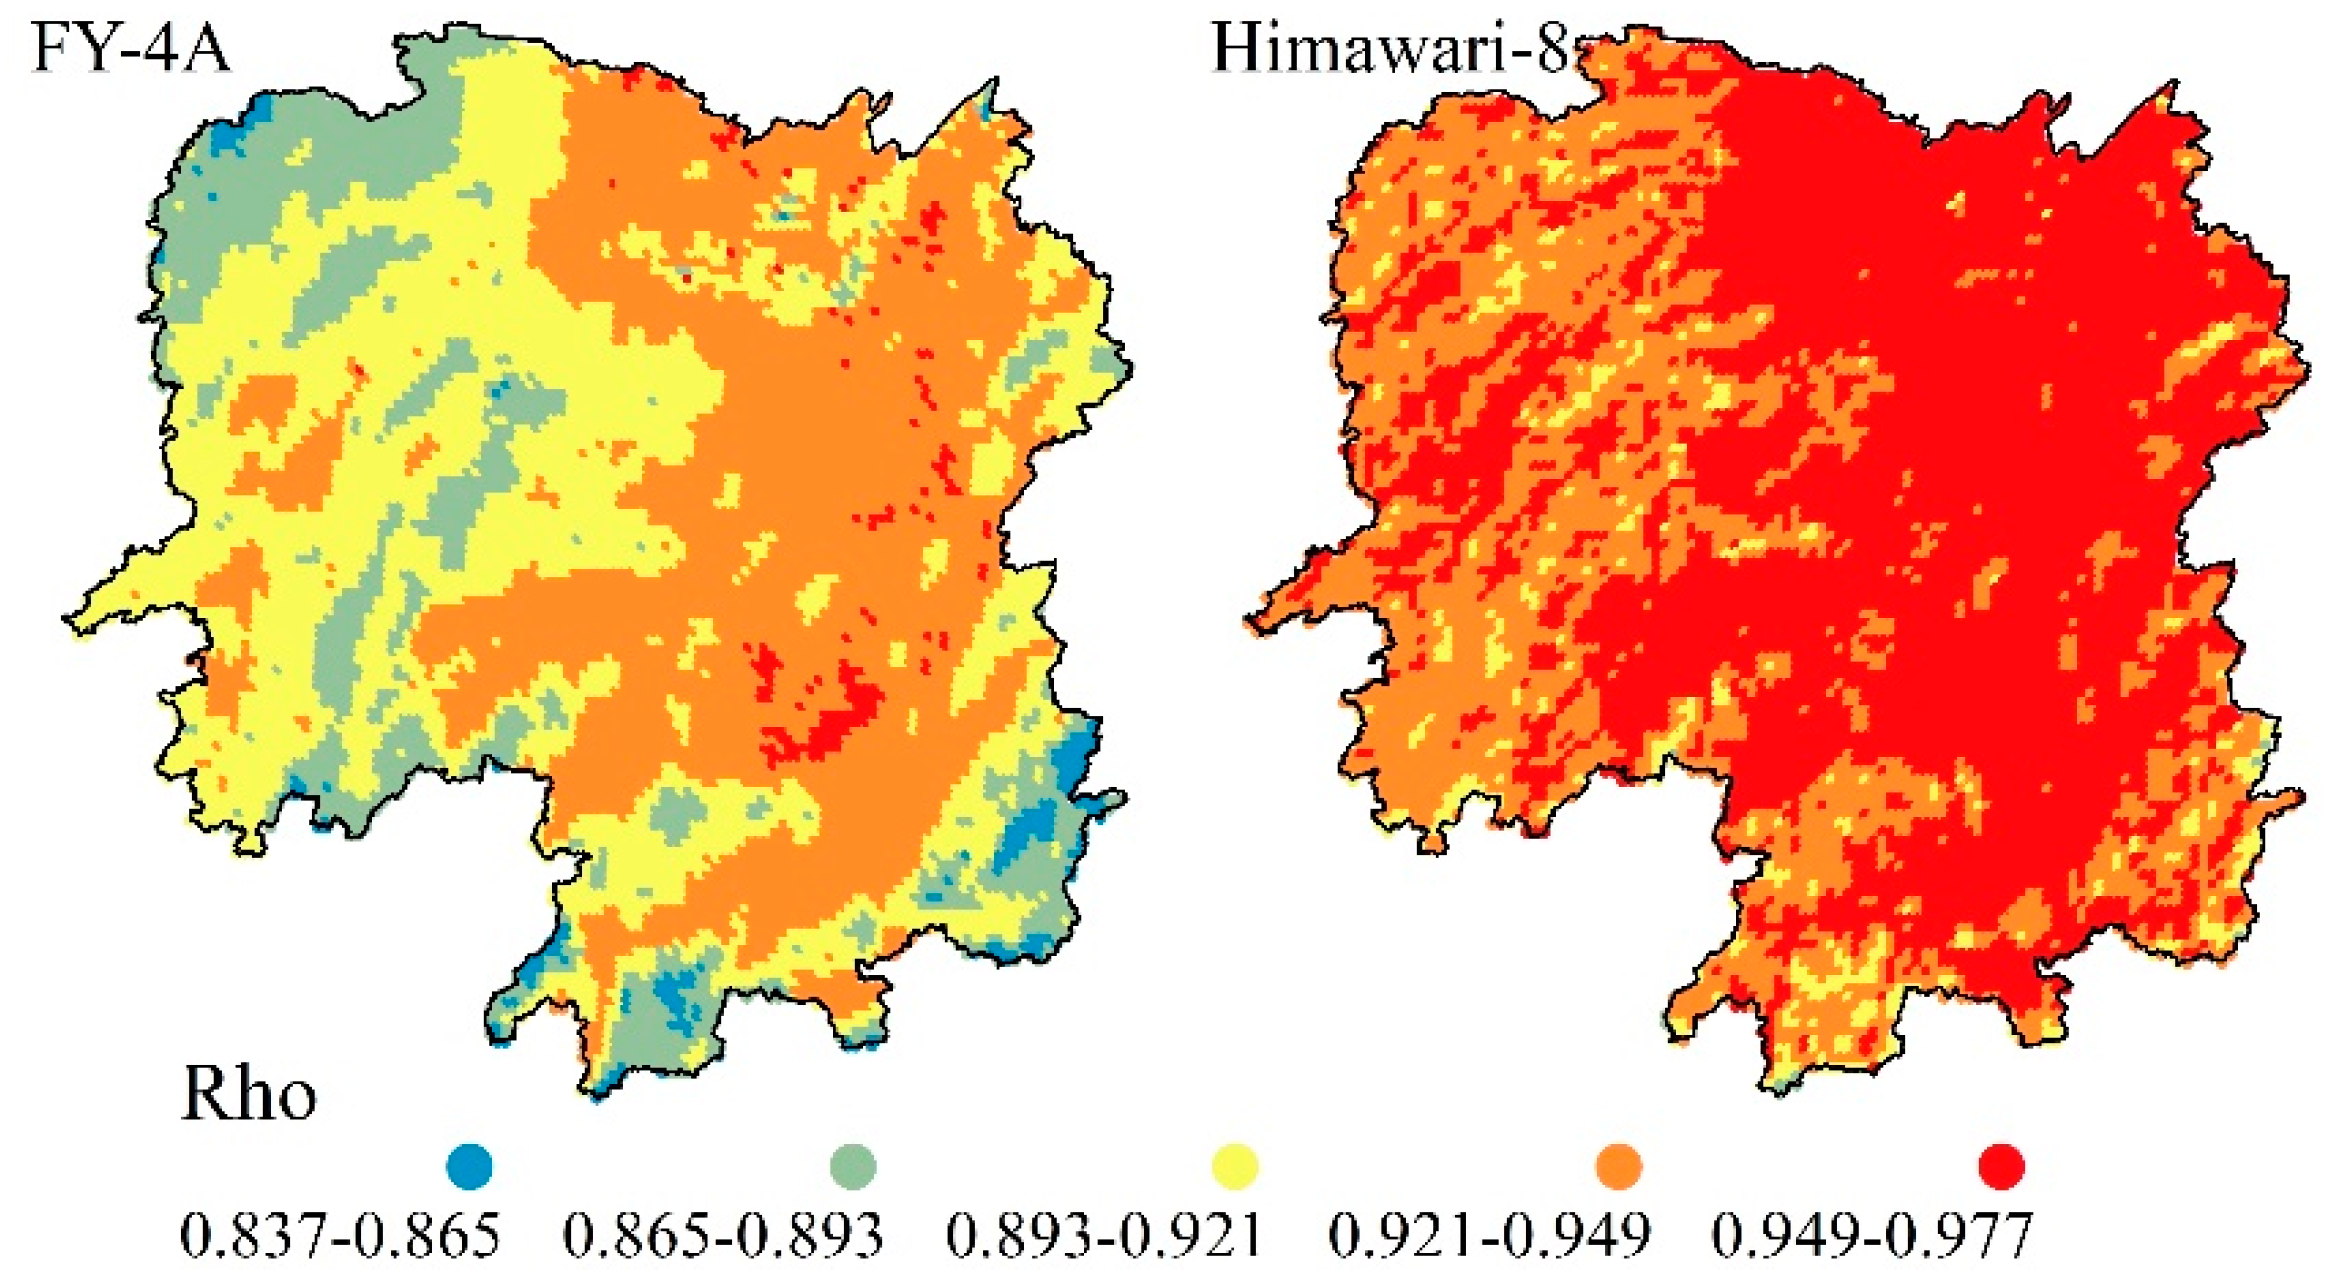
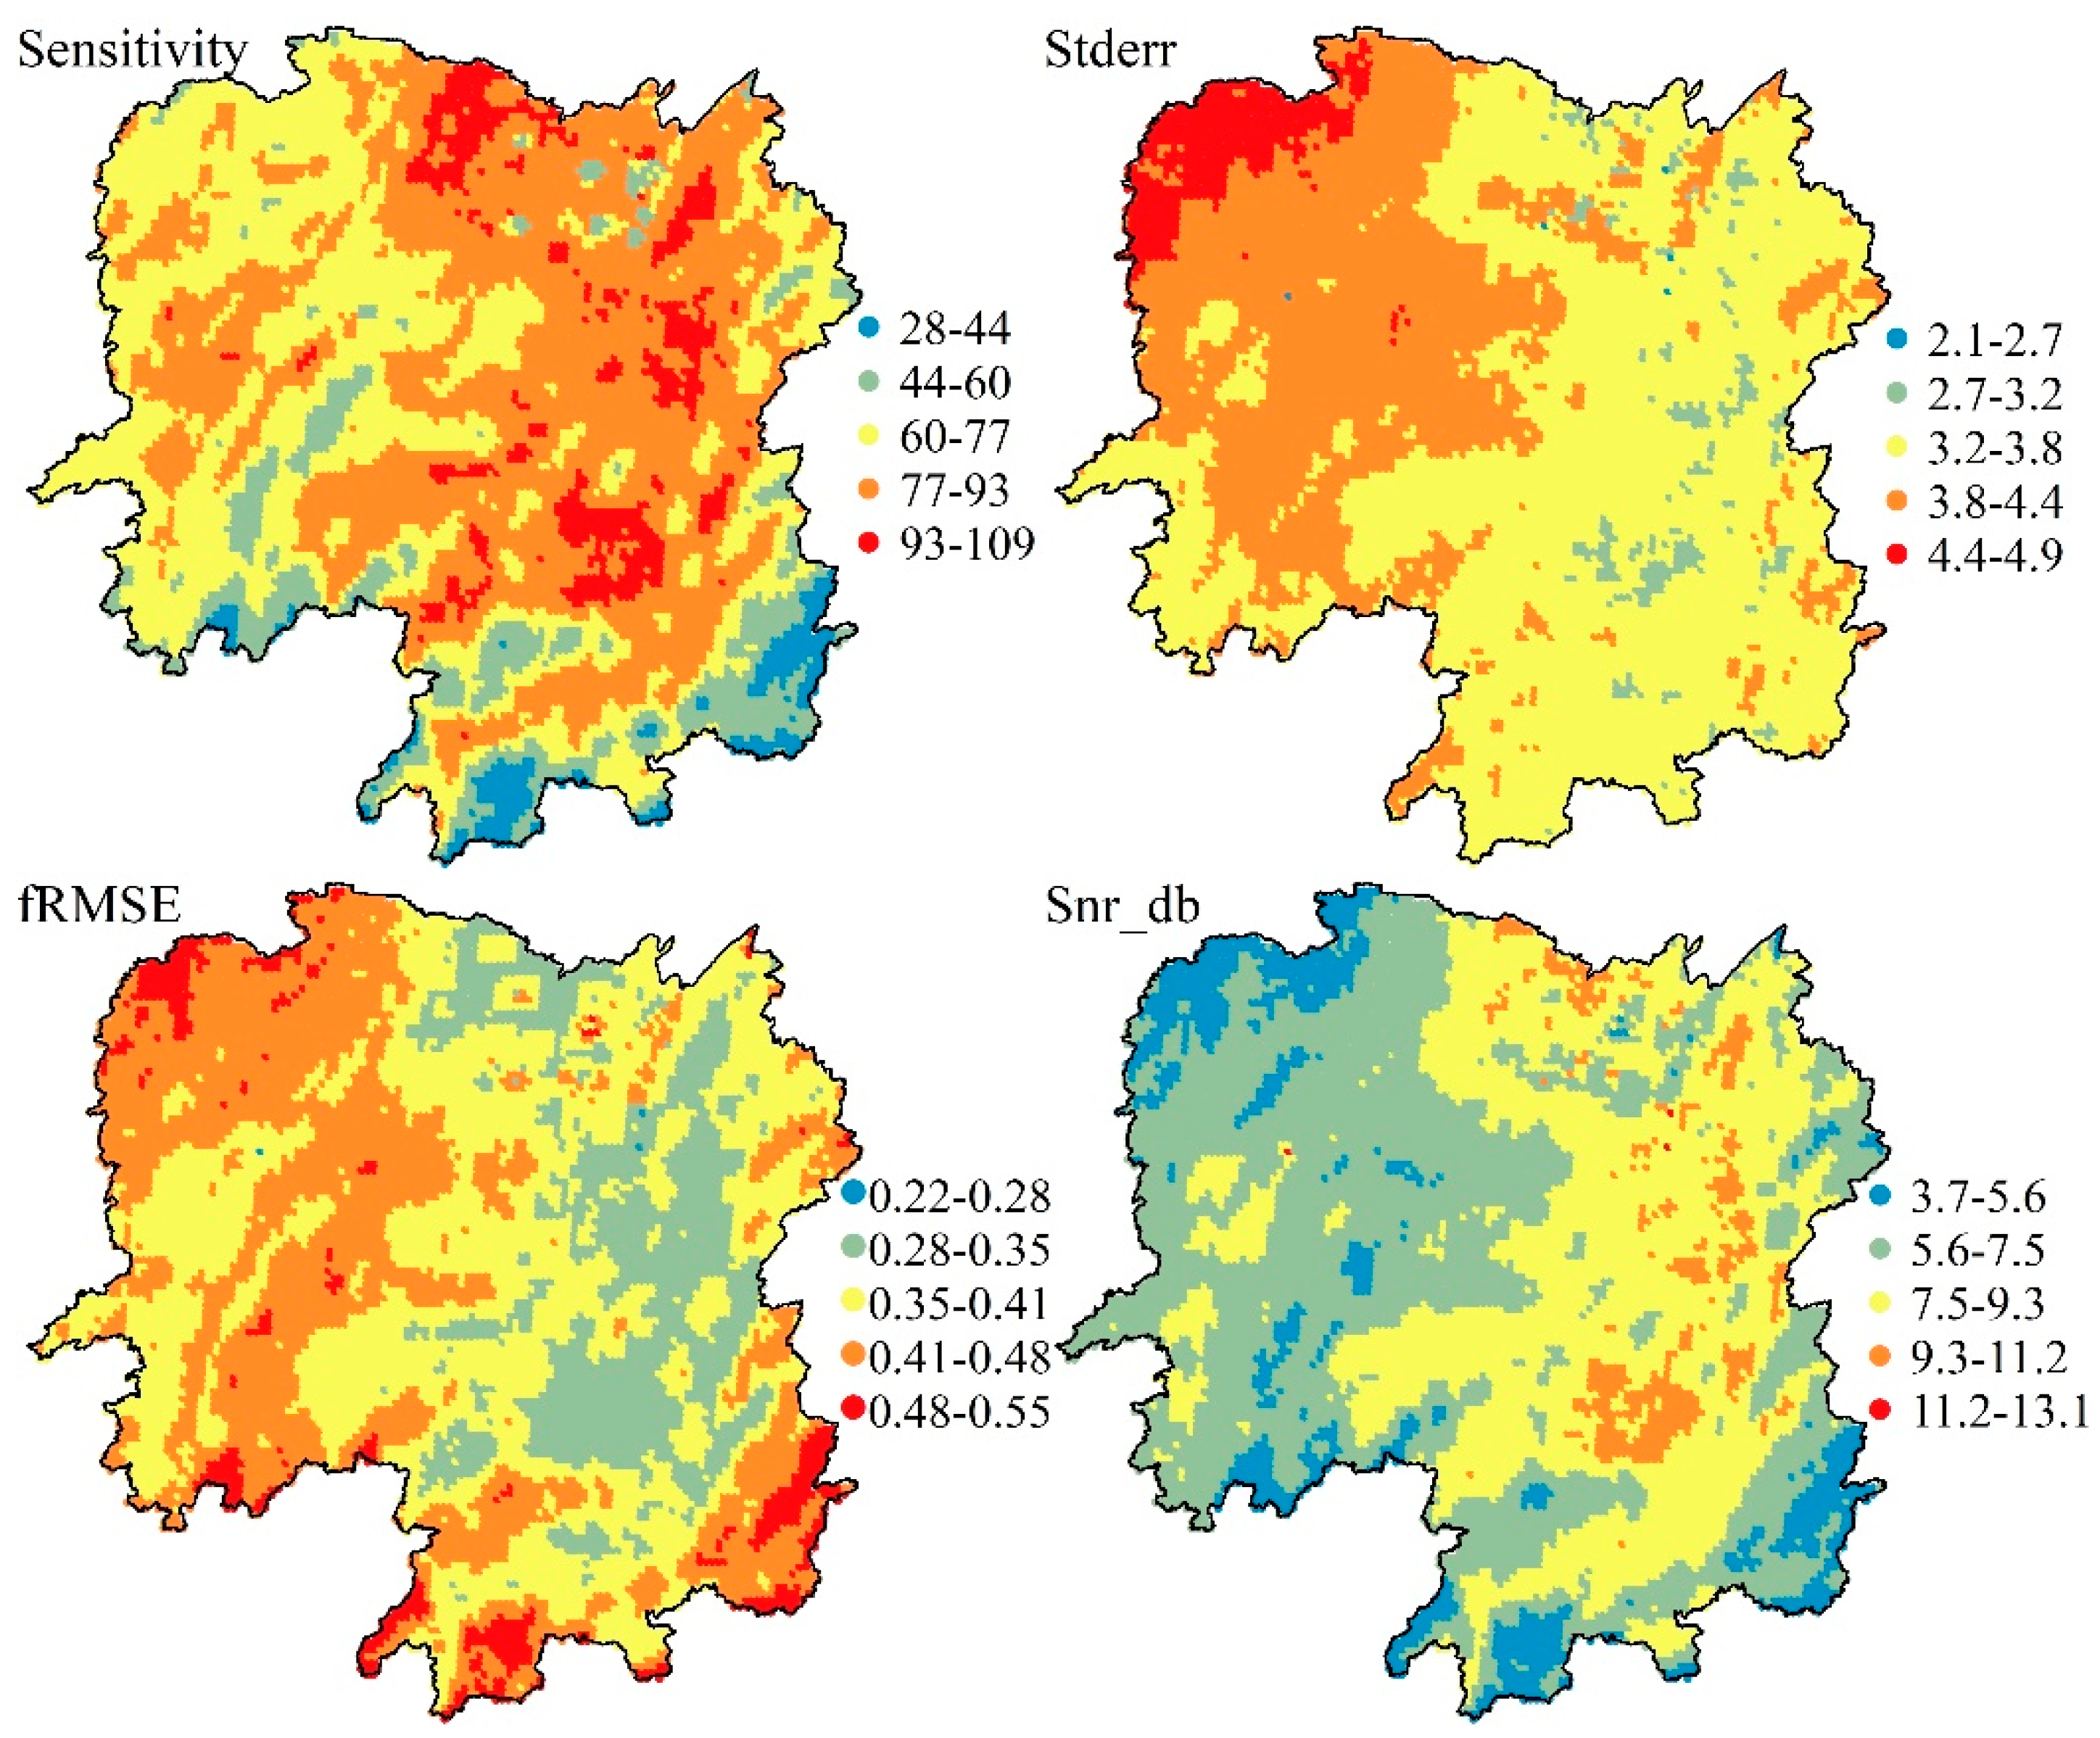
3.2. FY-4A LST Authenticity Test Using TCA

Using TCA can overcome the problem created by the difficulty of obtaining the standard reference dataset of quantitative remote sensing parameters on the surface at a regional scale with high spatial and temporal resolution; the error indicators for comparisons between remote sensing products and the unknown ground truth are computed in the analysis [21]. The matched hourly data triplets formed in this study, the 2 y FY-4A-CLDAS-ERA5-Land dataset with a total of 65.3 million triplets of data that we created, and the sufficiency of the quantity of data ensure the generality of the study results.
The results of the analysis showed that the correlation coefficient (Rho) between FY-4A LST and true surface temperature was greater in central-eastern, northern, and south-central Hunan Province and that areas with very high correlation coefficients were found mostly in the Hengyang basin in central Hunan. Rho decreased in the western and southern mountainous areas and the northern Dongting Lake area; values for the southern border mountainous areas and the northwestern border mountainous areas were significantly lower (Figure 4). Rho for Himawari-8 LST was greater than for FY-4A overall; the spatial distribution trended similarly.
Analysis of the other error indicators (Figure 5) showed that the sensitivity of FY-4A LST to the true surface temperature was high relative to other remote sensing parameters [38]. The distribution of Sensitivity was similar to that of Rho, and it was greater in the central-eastern, south-central and northern parts of Hunan Province except for the Dongting Lake area and some areas in the west; Stderr, which indicates the degree of error, was between 3 and 4 for most grids and was greater in most areas in the west and the Dongting Lake area in the north and very high in the high elevation mountainous areas in the northwest.
The FY-4A LST product showed stable deviation and weak signal interference. The value of fRMSE, which indicates variation in error, was greater in the central-western, northwestern, and southern border areas, and the greatest values were found mostly in the northwestern, southern, and southeastern borders. Deviation was steady and always less than the standard deviation of the true time series (~0.7). Snr_db, which characterizes the signal-to-noise ratio, was greater in the central-southern, central, and northern areas except for Dongting Lake, where the signal showed weak interference; the signal showed some distortion in the western and southern regions.
The distribution of TCA error indicators shows that FY-4A LST data is strongly influenced by topography, and parameters that indicate its accuracy are almost consistently correlated with terrain in Hunan Province, whereas parameters indicating error are inversely related to terrain. FY-4A LST has low accuracy in the western and southern mountainous areas of Hunan Province, indicated by low correlation, large deviation and strong signal distortion, especially in the northwestern and southern border areas; in the south-central, central, and northern areas other than Dongting Lake, the product is more accurate, especially in the Hengyang basin, where correlation was greater, deviation was less, and the signal-to-noise ratio was greater.

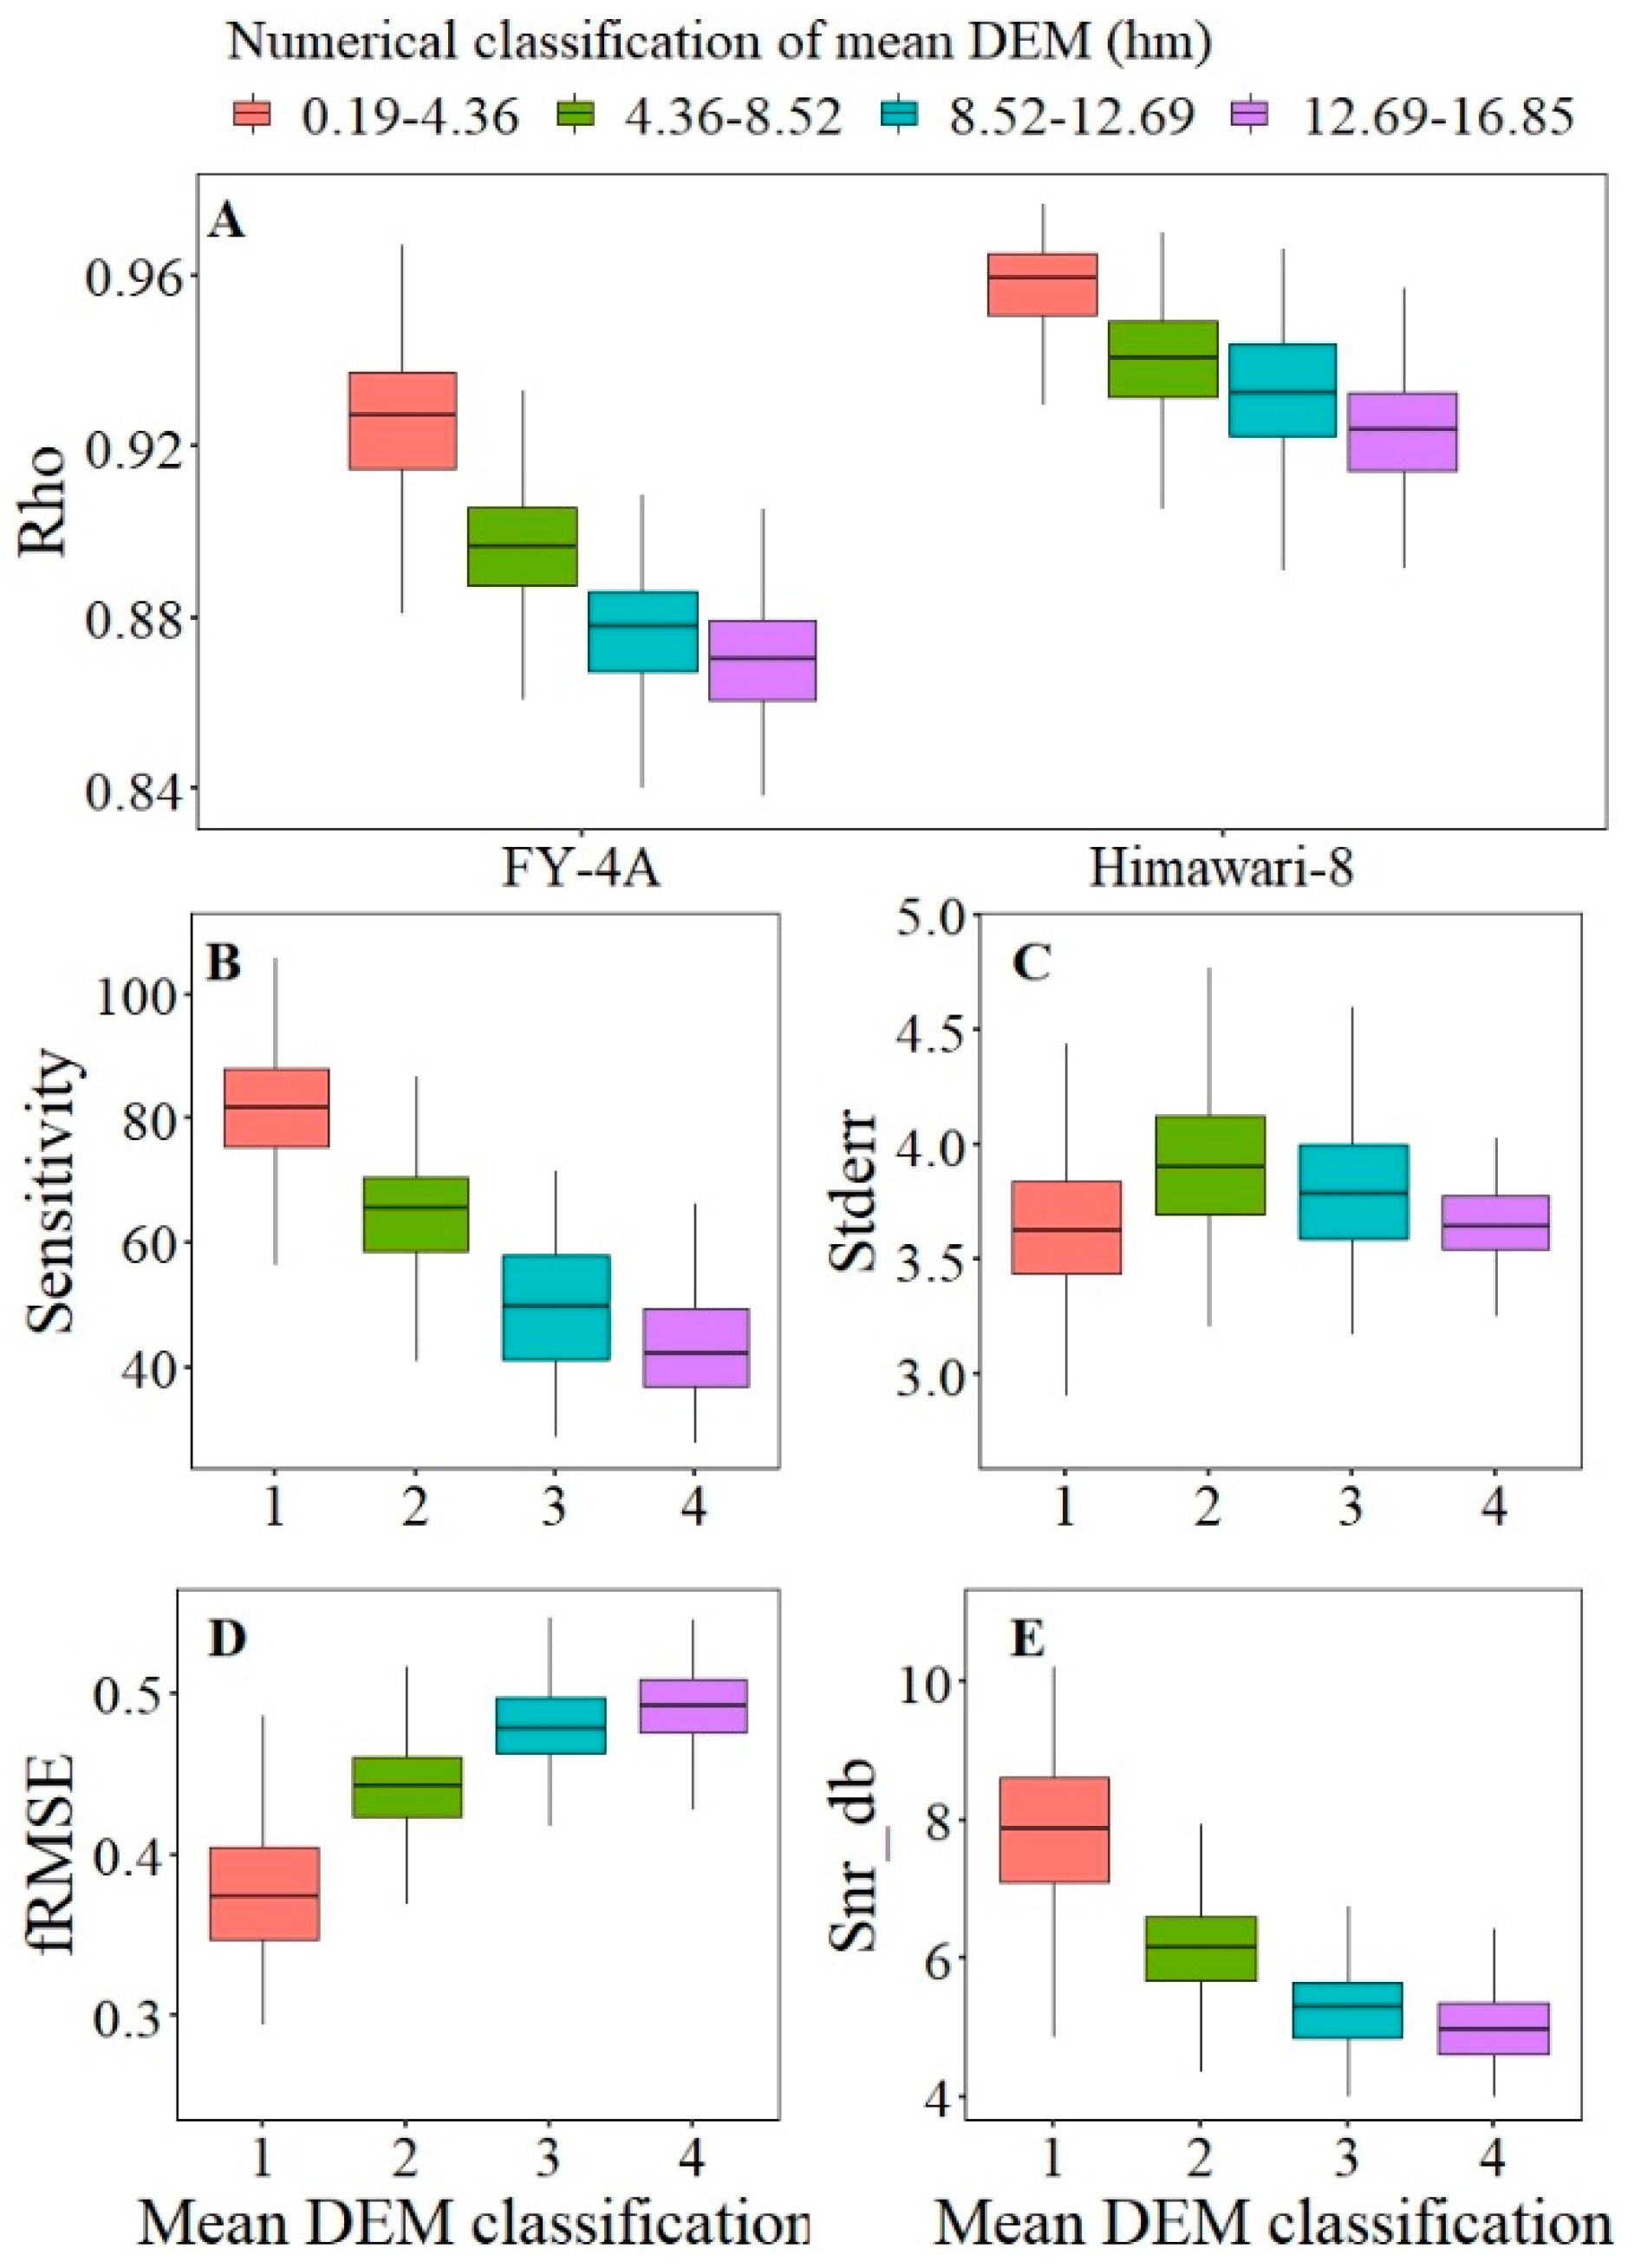
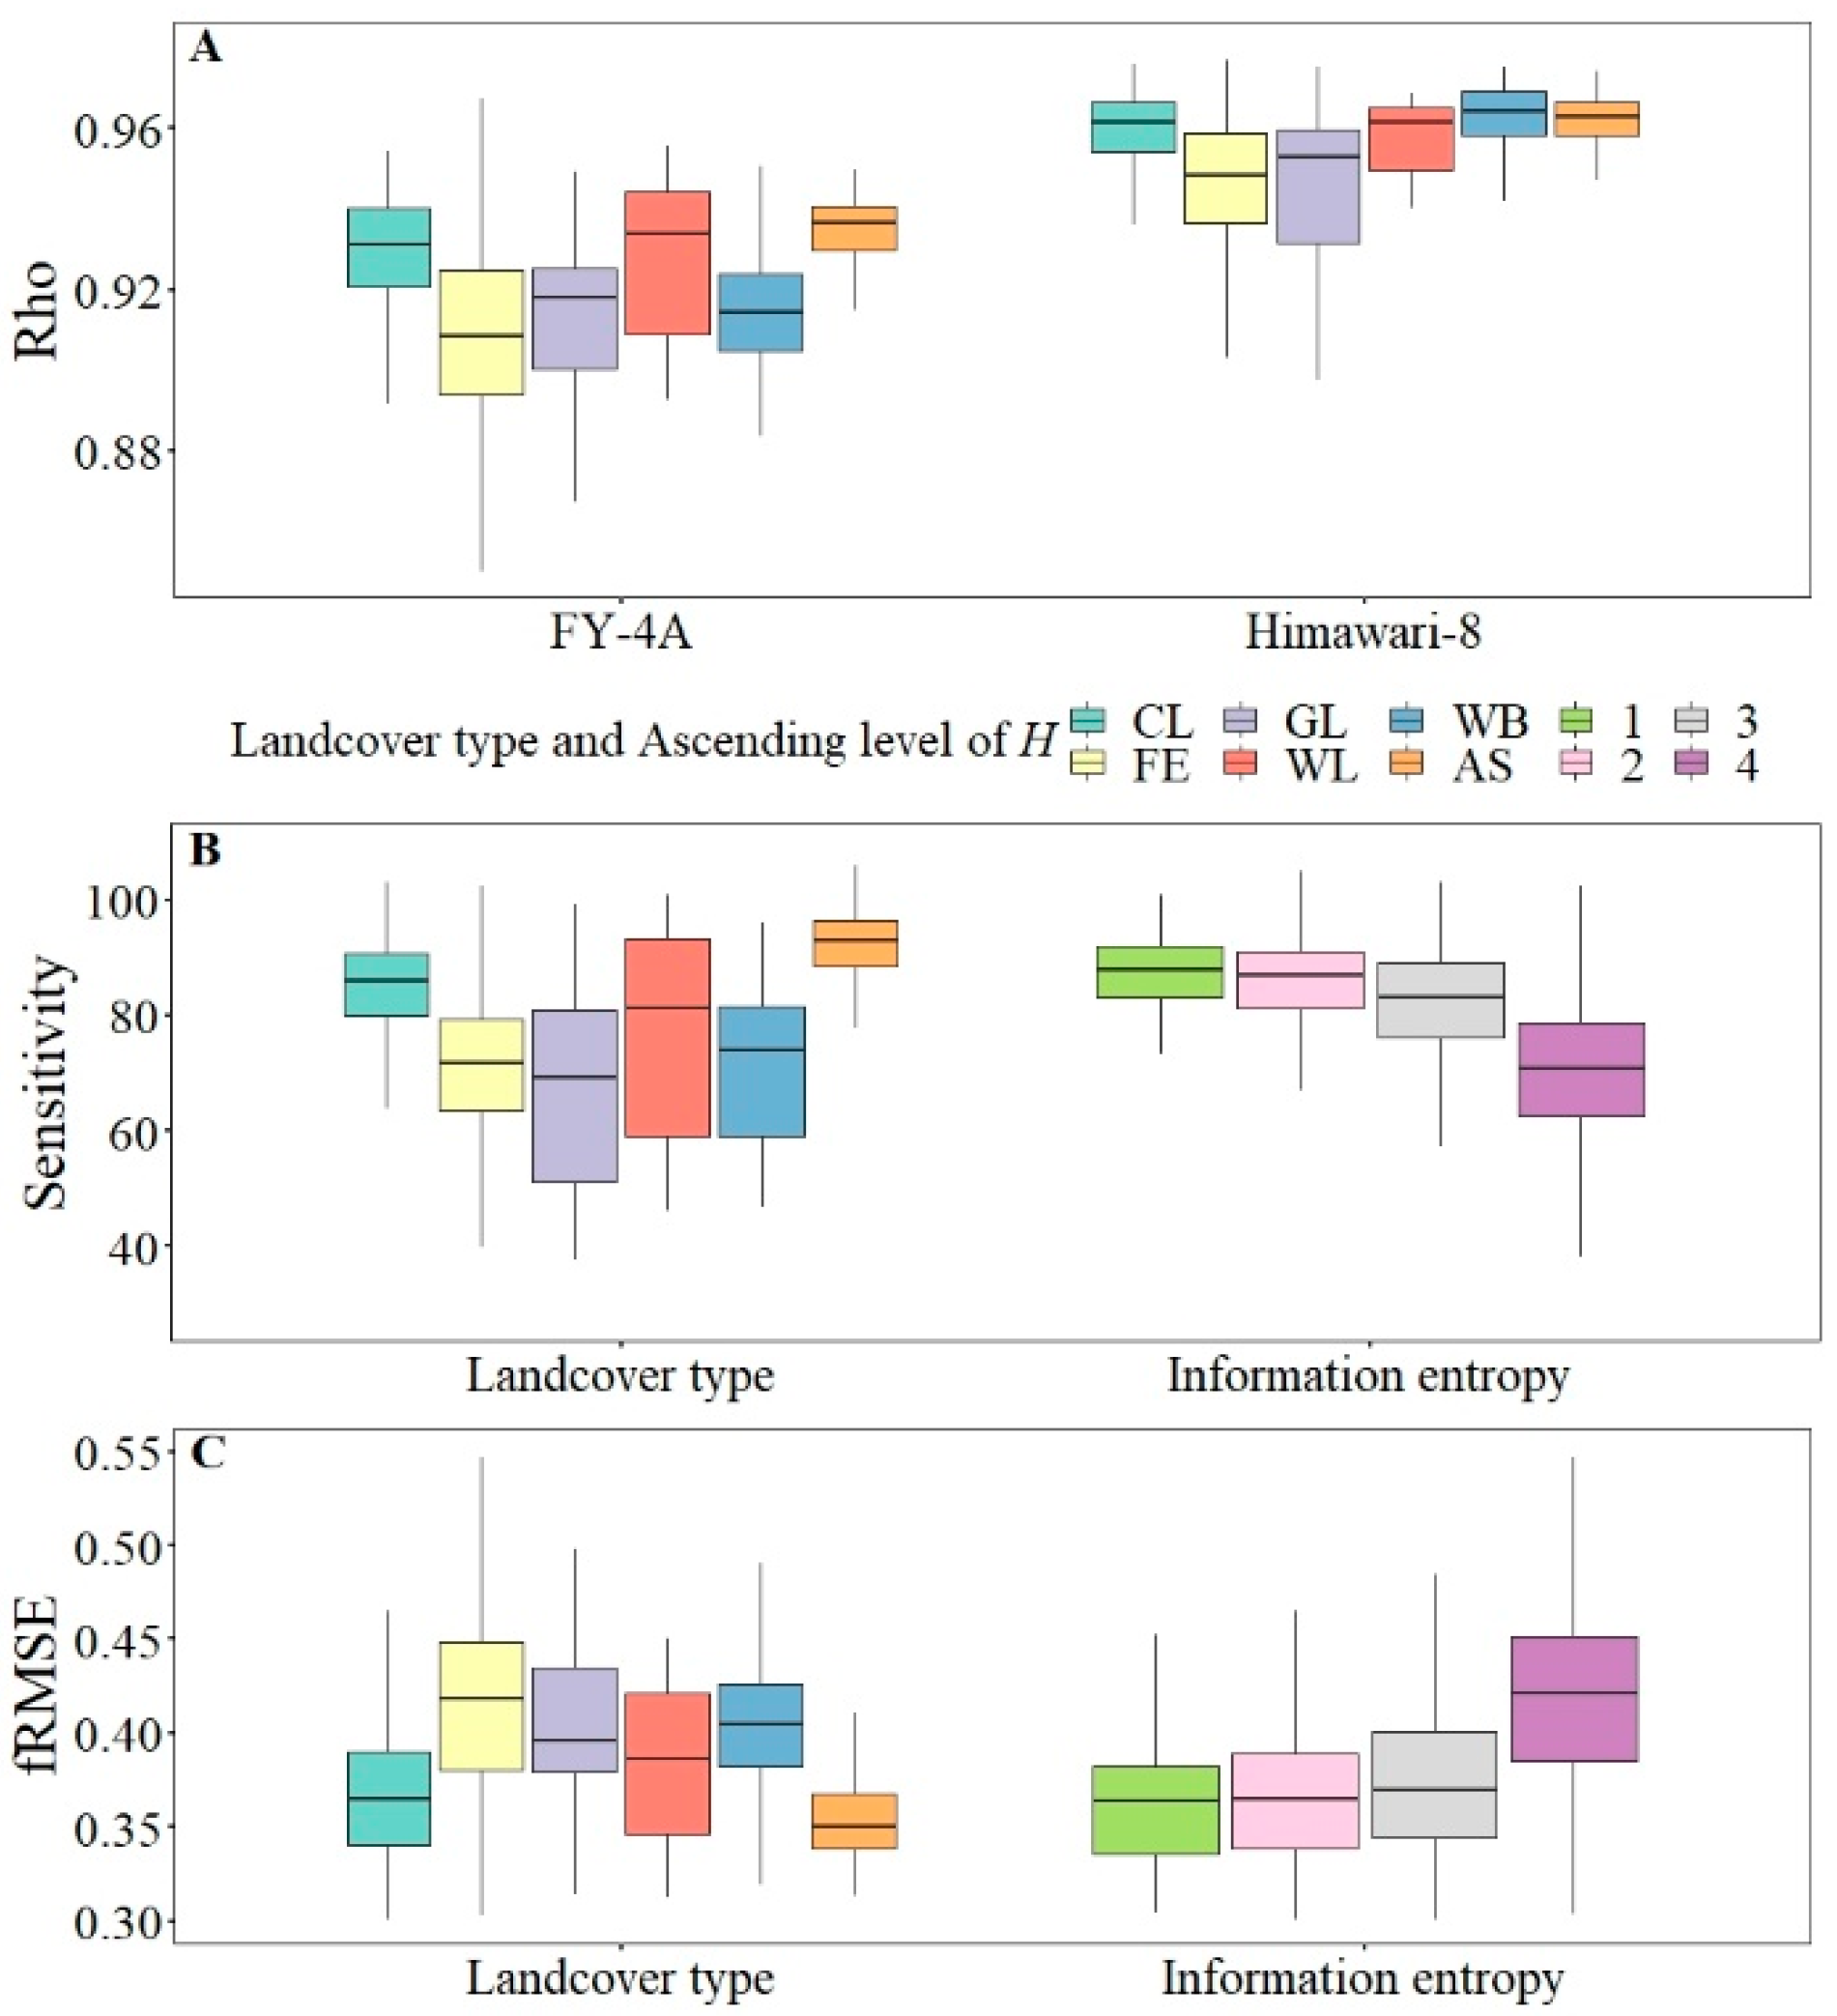
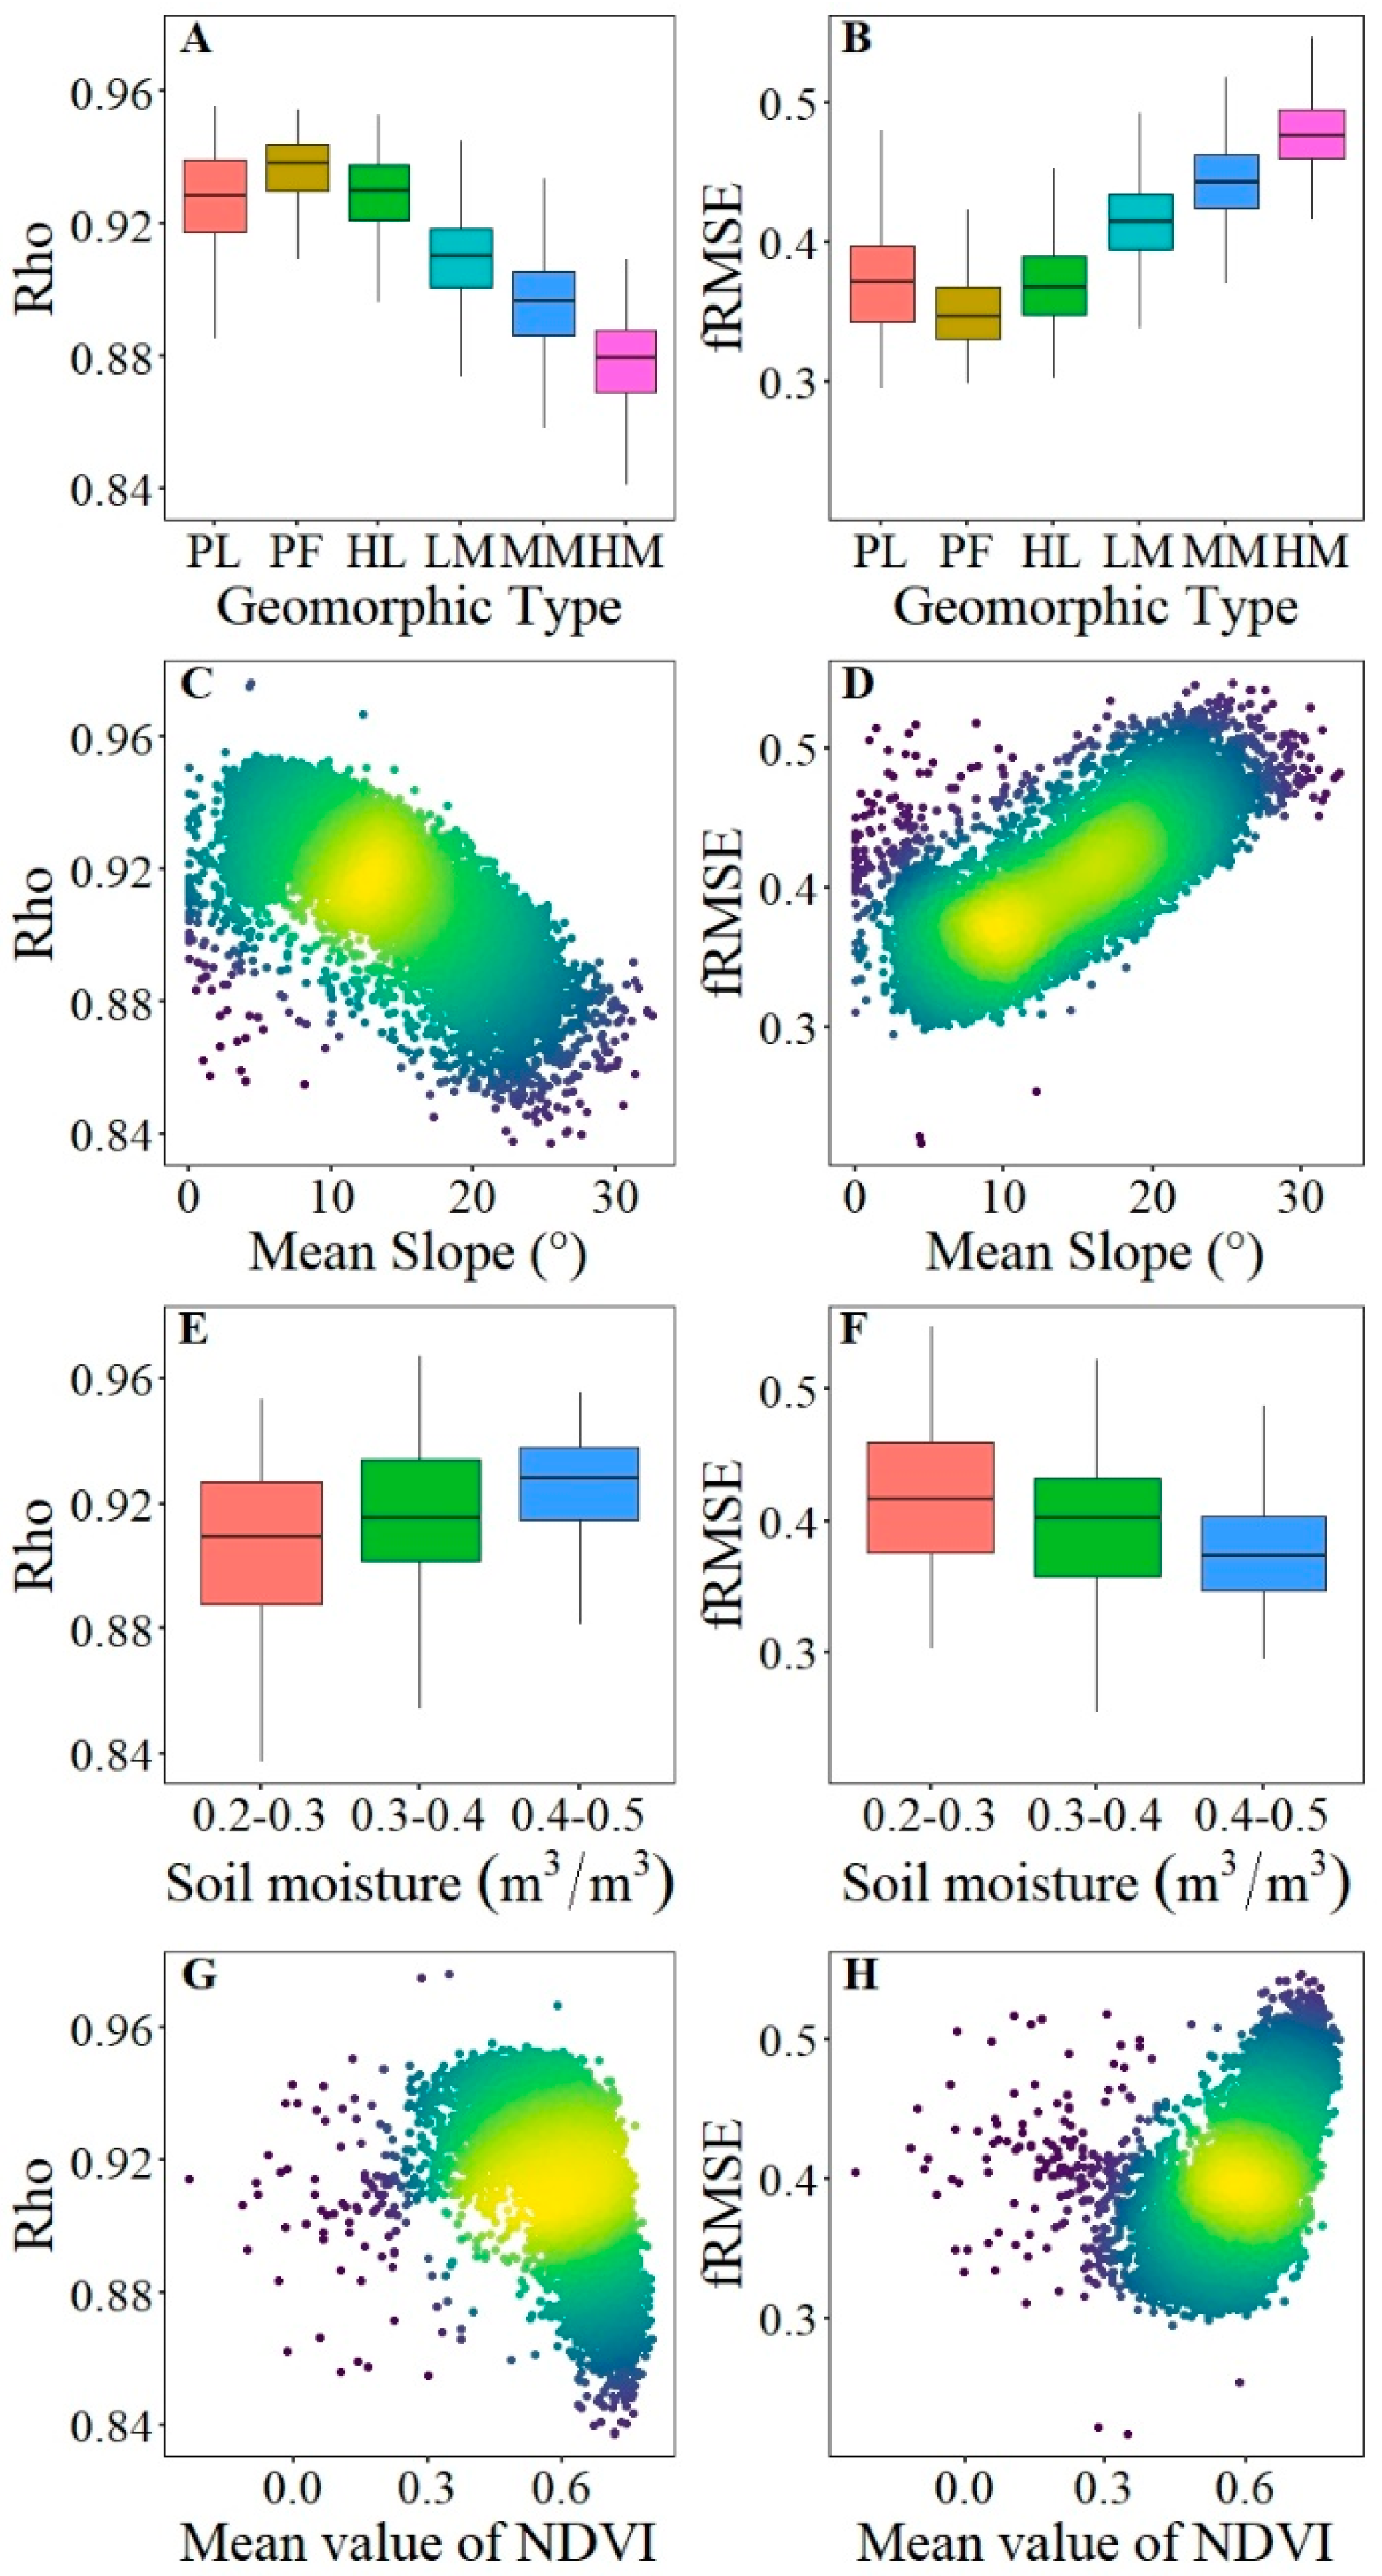
3.3. Analysis of the Mechanism of the Influence of Environmental Factors on the Performance of FY-4A/LST

In this study, environmental factor parameters and remote sensing LST error parameters were combined for analysis of the mechanisms through which environmental factors influence FY-4A LST data. The results of the analysis confirmed the results in Section 3.1 and Section 3.2 that described the performance of FY-4A LST products as being strongly influenced by topographic factors. The accuracy of remote sensing LST products varied significantly for different mean DEM classifications (Figure 6). Most indicators showed that the accuracy of remote sensing LST products gradually decreased as elevation increased (Rho, Sensitivity, Snr_db gradually decreased; fRMSE gradually increased). Only the parameter Stderr, which exists as a filtering process in the algorithm (Equation (9)), showed a trend of initially increasing and then decreasing as elevation increased, which indicated that the error of FY-4A LST was larger at medium elevations (436–1269 m). Rho for Himawari-8 LST was greater than for FY-4A LST, but the change trend was consistent between the two. Thus, the accuracy of FY4A LST gradually decreased, and the distortion of the detection signal gradually increased as elevation increased.
The results of elevation analysis using TCA differed from the results based on in situ measurement (Table 3). In the latter, the maximum station elevation category was also worst in capturing changes in LST but had the least deviation (as indicated by Bias, Biasr, and RMSE). However, we think the results of TCA in our study were more dependable for the following two reasons. 1. There were only two in situ measurement stations in the highest elevation category, so the amount of data provided was limited. 2. The least values of Bias and RMSE may be related to the lowest LST value range at high elevation; Stderr in TCA for areas above 436 m shows a similar trend to Bias and RMSE, and Biasr shows a gradual increase as elevation increases in all categories except the highest elevation category (Table 3 and Figure 6).
The performance of FY-4A LST varies with land cover. FY-4A data were more accurate for Cultivated land and Artificial surfaces and less accurate for Forests and Water bodies. Variation was greater for Forests and Wetlands (Figure 7). The accuracy of FY-4A LST gradually decreased as land cover information entropy increased, indicating that as land cover became more inhomogeneous, FY-4A LST decreased in accuracy. The trend of variation in accuracy for Himawari-8 LST with land cover was generally similar to that of FY-4A LST, but Himawari-8 was significantly more accurate when the surface water content was greater (accuracy was relatively higher for Water body and there was less variation for Wetland).
Landform, slope, soil moisture, and NDVI all affected the accuracy of FY-4A LST (Figure 8). For landform, the accuracy of FY-4A LST was best for Platform, followed by Hill and Plain, and it decreased for Mountain as relief increased, which is consistent with the trend of accuracy decreasing as slope increased. For soil moisture, the accuracy of FY-4A LST increased as surface soil moisture increased. For NDVI, the trend of variation in FY-4A LST was more complex. When NDVI was low (<0.6), FY-4A LST was uniformly accurate; however, when NDVI was high (>0.6), the accuracy of FY-4A LST decreased sharply as NDVI increased. This behavior indicates that lush vegetation on the ground surface has a greater influence on FY-4A LST accuracy than other factors.

4. Discussion

Many factors affect the accuracy of LST data retrieved from satellite TIR data, such as atmospheric profiles, sensor parameters, surface parameters, and systematic errors due to the parameterization step of the retrieval algorithm [41]. It is therefore important to test the authenticity and comprehensively evaluate the LST product, especially for new satellite products.
There have been many validation studies of the LST products of Landsat, MODIS, Himawari and other satellites [16,42], and the effects of the retrieval algorithm, day/night observation, season, and land cover type on the accuracy of remote sensing LST products have been documented, quantified and modeled. In this study, we conducted a comprehensive assessment of the FY-4A LST product, which has not previously been extensively validated. We used high-quality in situ measured data from CMA together with reanalysis products, which gave us a large quantity of data to ensure our research was superior to other similar validation studies [13,16,41]. The direct accuracy comparison analyzed more than 500,000 data points, and TCA used >65 million data points for a 2 y period; the study results were therefore more generalizable and provide a baseline reference for improving and promoting the FY-4A product.
The authenticity test in the study adopted direct comparison between FY-4A LST with in situ measurement and TCA between FY-4A LST with two reanalysis products. The different methods of analysis allowed us to make more comprehensive and more generalizable conclusions. The scale difference between different data products in the direct comparison may have affected the results. The resolution of FY-4A/AGRI (4 km resolution for both TIR bands and LST product) differs from the resolution of Himawari-8/AHI (2 km resolution for TIR bands and 0.045° resolution for LST product), and the remote sensing grid product scale is different from the in situ measured single point data scale. However, the research results of the TCA method partially compensate for the impact of scale differences on the results. In contrast to the Bias values that were within ±2 K according to the Quality Assessment Report of Copernicus Global Land Operations, the Bias values we obtained were generally greater than the values for in situ measurement. This result may be due to the sparse distribution of observation stations (thus increasing the scale mismatch between remote sensing data and in situ measurements) and the fact that most meteorological observatories were situated on hills at elevations that are not conducive to accurate remote sensing detection (Figure 6). However, the different but still similar observational accuracy of FY-4A LST when compared with Himawari-8 data, and the greater accuracy of the LST product than other remote sensing parameters [38], illustrate the capability of the TIR-based split-window algorithm of FY-4A/AGRI to retrieve accurate LST.
The seasonal and diurnal trends of FY-4A LST (Bias, RMSE; Table 3) were consistent with the findings of Li et al. [43] for Himawari-8 and MODIS LST in western China; the LST products in that study also showed the largest variation when the land cover was forest. The error coefficients (Bias, Biasr, and RMSE) calculated in the comprehensive assessment by Fan et al. [24] using FY-3C/MWRI LST and in situ measurement in Hunan Province were similar to those we obtained in this study. Fan et al. [24] also found a trend of decreasing accuracy with increasing elevation in remotely sensed LST together with a trend of gradually increasing underestimation when daytime LST was >20 °C (descending orbit). Martin et al. [16] validated remote sensing LST products using in situ radiation measurement and found that the accuracy of such products varied with season, day/night, and land cover, similar to our findings, and that observation variations in subtropical and forest sites were similar to those of FY-4A LST.
There were large differences in remote sensing LST accuracy for different surface temperature ranges in our results (Figure 3 and Table 3), and the ranges of surface temperature were affected by factors such as day/night, season [44], land cover, soil moisture, and vegetation condition [45]. Analysis of the effects of environmental factors confirmed that the preceding factors had a large effect on LST accuracy. The poor performance of LST products in Dongting Lake area may be related to the interference of remote sensing signals at the meeting of land surface and water surface. However, the lack of water surface observation stations in the in situ measurements limits our in-depth analysis of this point. Another factor that affects LST is shade: surfaces that are shaded are significantly cooler than sunlit surfaces. The effects of this factor are incorporated in the effects of elevation, landform, and slope on LST.
FY-4A LST was less accurate than Himawari-8 LST, which indicates that the FY-4A product is in need of improvement. However, as the prototype of a new generation of Chinese geostationary meteorological satellites, FY-4A is inherently experimental, and therefore systematic errors due to instrument performance are unavoidable. It has been found that some TIR bands of AGRI are not very stable in terms of satellite calibration [46]. It has also been found that although the retrieval algorithm used to produce FY-4A LST is similar to that used for Geostationary Operational Environmental Satellites (GOES)-R LST, observational variation in FY-4A LST is much greater [47]; this may also be related to the relatively poor performance of the sensor.
LST is a fundamental surface parameter that is detected by the primary sensors of China’s new generation of geostationary meteorological satellites. This comprehensive evaluation of the FY-4A LST product confirms the satellite has a good detection capability, but it does not yet match foreign satellite products in terms of overall accuracy. We can improve the retrieval algorithm by incorporating the influencing factors we identified or perhaps by using data-driven models based on artificial neural network methods to retrieve quantitative parameters from the remote sensing Chinese satellites, which is the goal of our next research project.
In conclusion, FY-4A, the first satellite of the FY-4 series, has successfully completed its task of comprehensively prototyping China’s second-generation geostationary orbit meteorological satellite program and observation technologies. Its observation performance has exceeded expectations, and the data products are being used in live meteorological applications. FY-4B has also been launched and will soon be in operation, and we look forward to the increasingly important role that Chinese meteorological satellites will play in the future.

5. Conclusions

In this study, we directly compared the FY-4A LST product with in situ measured LST data and used TCA with other reanalysis products to test the authenticity of the FY-4A LST product, which has not previously been extensively validated, for accuracy. We used Himawari-8 LST for comparison. We analyzed the effects of several environmental factors on LST accuracy. We drew the following conclusions.
  • The FY-4A LST product captured the surface temperature well for Hunan Province (R = 0.893, Rho = 0.915), but it generally underestimated LST (Bias = −0.6295 °C) and there was a large random error (RMSE = 8.588 °C, ubRMSE = 5.842 °C); observation accuracy was worse than for Himawari-8 LST.
  • The FY-4A LST product performed better in terms of accuracy for the central-eastern area, the northern area except Dongting Lake, and the central-southern parts of Hunan Province than for other parts of the province. The greatest accuracy was for the Hengyang basin in central Hunan. Accuracy decreased in the western and southern mountainous areas and the Dongting Lake area, and accuracy was the lowest in the mountainous areas along the southern and northwestern borders.
  • When the surface temperature is high (>25 °C), remote sensing detection will significantly underestimate LST, and accuracy is greatly affected by topography and terrain; product accuracy decreases as elevation increases, and the change trend is basically consistent with change in elevation. FY-4A LST is most accurate when the land cover is Cultivated land or Artificial surfaces and the landform is Platform. Accuracy changes between day and night and seasonally, and decreases as land cover becomes more heterogeneous, mountain relief increases, or slope and NDVI increase; accuracy increases as soil moisture increases.
FY-4A is an experimental satellite and its detection performance exceeded expectations and provided a variety of valuable observation products for China’s meteorological operations. However, our evaluation found that the FY-4A LST product is not as accurate as advanced foreign satellite products, and so there is still a need to improve the performance of domestic satellite instruments and to improve the retrieval algorithm by combining environmental factors so as to improve China’s meteorological detection capability.

Author Contributions

Data curation, S.T. and W.L.; formal analysis, S.W.; funding acquisition, Q.H.; investigation, J.F.; methodology, J.F., Q.H. and H.L.; project administration, Q.H.; resources and software, J.F., S.W., L.C. and H.S.; writing—original draft, J.F.; validation and writing—review and editing, H.L. All authors have read and agreed to the published version of the manuscript.

Funding

This research was funded by Hunan Meteorological Bureau, grant number NO. XQKJ18A003 and NO. XQKJ22C010, and the major program of the Natural Science Foundation of Hunan province: “Multi-source satellite remote sensing model of meso- and micro-scale severe convective weather system and its derived disasters”.

Institutional Review Board Statement

Not applicable.

Informed Consent Statement

Not applicable.

Data Availability Statement

All the data used in the study can be obtained in a public way, as described in the Data section of the article.

Acknowledgments

We thank the global component of Land Service of Copernicus, the Earth Observation programme of the European Commission, and Japan Meteorological Agency for providing Himawari-8 LST product.

Conflicts of Interest

The authors declare that the research was conducted in the absence of any commercial or financial relationships that could be construed as a potential conflict of interest.

Appendix A

Table A1. Overview of in situ measured stations.
Station NumberStation NameLatitude (°)Longitude (°)Elevation (m)Land Cover TypeGeomorphic Type
1Longshan29.46109.44488.7Artificial surfacesPlain
2Sangzhi29.4110.16318.8Artificial surfacesHill
3Zhangjiajie29.12110.42218.5Artificial surfacesPlatform
4Shimen29.58111.36116.9Artificial surfacesPlatform
5Cili29.43111.09167.7ForestHill
6Lixian29.67111.7338.1Cultivated landPlatform
7Linli29.47111.6789.3ForestPlatform
8Nanxian29.35112.4340.3Cultivated landPlain
9Huarong29.54112.649.5Artificial surfacesPlatform
10Anxiang29.41112.233.6Cultivated landPlain
11Yueyang29.38113.0953Artificial surfacesPlain
12Linxiang29.48113.4560.4Artificial surfacesPlain
13Huayuan28.58109.46341Artificial surfacesPlatform
14Baojing28.68109.65438.1Cultivated landHill
15Yongshun29.01109.84268.2Cultivated landPlatform
16Guzhang28.68109.98294ForestPlatform
17Jishou28.24109.68254.6Artificial surfacesPlain
18Yuanling28.46110.4151.6Artificial surfacesPlatform
19Luxi28.23110.21186ForestPlatform
20Chenxi28.01110.19152.8Artificial surfacesPlain
21Taoyuan28.91111.4848.7Artificial surfacesPlain
22Changde29.12111.68150.6ForestHill
23Hanshou28.92111.9631.9Artificial surfacesPlain
24Taojiang28.51112.17136.9ForestPlatform
25Anhua28.38111.25196Artificial surfacesPlatform
26Yuanjiang28.85112.3737Water bodyPlain
27Xiangyin28.73112.9363ForestPlatform
28Heshan28.57112.3846.3Artificial surfacesPlatform
29Ningxiang28.25112.5674.7Artificial surfacesPlain
30Huanghua28.21113.2101.4Cultivated landPlatform
31Miluo28.86113.1182.5ForestPlatform
32Pingjiang28.71113.57106.3Artificial surfacesPlain
33Changsha28.11112.79119ForestPlatform
34Liuyang28.16113.63101.1ForestPlain
35Fenghuang27.95109.6349.6Artificial surfacesPlatform
36Mayang27.87109.8176.6Artificial surfacesPlain
37Xinhuang27.37109.16355.5ForestPlatform
38Zhijiang27.45109.68272.2Artificial surfacesPlain
39Huaihua27.61110.03286.9Cultivated landPlain
40Xupu27.92110.6204ForestPlain
41Hongjiang27.21109.84252Artificial surfacesHill
42Dongkou27.03110.61339.5Cultivated landPlatform
43Lengshuijiang27.7111.44249.2Artificial surfacesPlain
44Xinhua27.75111.29211.9Artificial surfacesPlain
45Lianyuan27.71111.68249.2Artificial surfacesHill
46Loudishi27.69112205.8ForestPlatform
47Xuefengshan27.32110.411420ForestHigh relief mountain
48Shaoyangshi27.18111.45311Cultivated landPlatform
49Longhui27.13111.01308.4Cultivated landPlatform
50Xinshao27.34111.45294.1ForestPlatform
51Shaodong27.24111.74252.6Artificial surfacesPlain
52Shaoshan27.93112.5388.3Cultivated landPlatform
53Xiangxiang27.75112.5186.9ForestPlain
54Xiangtan27.88112.8363.8Cultivated landPlatform
55Shuangfeng27.45112.17100Artificial surfacesPlatform
56Nanyue27.3112.691265.9ForestMedium relief mountain
57Hengshan27.26112.84159.1ForestHill
58Hengdong27.05112.98109.4ForestPlatform
59Youxian27.06113.35115.2ForestPlatform
60Zhuzhou27.87113.1774.6Artificial surfacesPlatform
61Lilin27.64113.5172.7Artificial surfacesPlatform
62Jingzhou26.56109.67320.3Artificial surfacesPlain
63Huitong26.88109.72281.4ForestPlatform
64Tongdao26.17109.78397.5Artificial surfacesPlain
65Suining26.59110.15310.3Artificial surfacesPlatform
66Xinning26.46110.83346.1ForestPlatform
67Wugang26.74110.64341Artificial surfacesPlain
68Chengbu26.37110.31477.7Artificial surfacesPlain
69Shaoyangxian27111.29283.3Cultivated landHill
70Lengshuitan26.5111.62192.8Cultivated landPlain
71Yongzhoushi26.23111.62172.6Artificial surfacesPlain
72Dongan26.4111.29169Artificial surfacesPlain
73Qiyang26.59111.86113.2Artificial surfacesPlain
74Qidong26.76112.08218.9Cultivated landPlatform
75Hengyangxian26.97112.3790.8Artificial surfacesPlain
76Hengyang26.89112.6104.9Artificial surfacesPlatform
77Changning26.41112.39116.6Artificial surfacesPlatform
78Hengnan26.76112.69137GrasslandPlatform
79Leiyang26.43112.83135Cultivated landPlatform
80Anren26.71113.26101.8Artificial surfacesPlain
81Chaling26.79113.55136.2GrasslandPlain
82Yanling26.48113.79268.8Cultivated landPlain
83Yongxing26.13113.11167.6Artificial surfacesPlatform
84Guidong26.08113.94835.9Artificial surfacesHill
85Shuangpai26.03111.66205Artificial surfacesPlatform
86Daoxian25.53111.6192.2Artificial surfacesPlain
87Ningyuan25.59111.96244.2GrasslandPlain
88Jiangyong25.28111.31269ForestPlain
89Xintian25.91112.21224.2Artificial surfacesPlatform
90Chenzhou25.74112.98368.6ForestHill
91Guiyang25.75112.72329.1Artificial surfacesHill
92Jiahe25.58112.37214.5GrasslandHill
93Lanshan25.38112.2277Artificial surfacesPlain
94Yizhang25.41112.94222.8ForestHill
95Linwu25.27112.55292Artificial surfacesPlain
96Zixing25.97113.22139.3Artificial surfacesPlatform
97Rucheng25.51113.68645.6ForestPlain
98Jianghua25.18111.57265.7Artificial surfacesHill
99Pumanxiang25.65112.54291Cultivated landPlatform

References

  1. Kustas, W.P.; Norman, J.M.; Anderson, M.C.; French, A.N. Estimating subpixel surface temperatures and energy fluxes from the vegetation index–radiometric temperature relationship. Remote Sens. Environ. 2003, 85, 429–440. [Google Scholar] [CrossRef]
  2. Shuai, S.; Chunxiang, S.; Xiao, L.; Shuai, H.; Zhiwei, J.; Tao, Z. Assessment of ground temperature simulation in China by different land surface models based on station observations. J. Appl. Meteorol. Sci. 2017, 28, 737–749. [Google Scholar]
  3. Mannstein, H. Surface energy budget, surface temperature and thermal inertia. In Remote Sensing Applications in Meteorology and Climatology; Springer: Berlin/Heidelberg, Germany, 1987; pp. 391–410. [Google Scholar]
  4. Sellers, P.; Hall, F.; Asrar, G.; Strebel, D.; Murphy, R.E. The first ISLSCP field experiment (FIFE). Bull. Am. Meteorol. Soc. 1988, 69, 22–27. [Google Scholar] [CrossRef]
  5. Karnieli, A.; Agam, N.; Pinker, R.T.; Anderson, M.; Imhoff, M.L.; Gutman, G.G.; Panov, N.; Goldberg, A. Use of NDVI and land surface temperature for drought assessment: Merits and limitations. J. Clim. 2010, 23, 618–633. [Google Scholar] [CrossRef]
  6. Liao, W.; Liu, X.; Wang, D.; Sheng, Y. The impact of energy consumption on the surface urban heat island in China’s 32 major cities. Remote Sens. 2017, 9, 250. [Google Scholar] [CrossRef] [Green Version]
  7. Meng, X.C.; Liu, H.; Cheng, J. Evaluation and characteristic research in diurnal surface temperature cycle in China using FY-2F data. Natl. Remote Sens. Bull. 2019, 23, 570–581. [Google Scholar]
  8. Quan, W.; Chen, H.; Han, X.; Ma, Z. Validation of the modified Becker’s split-window approach for retrieving land surface temperature from AVHRR. J. Meteorol. Res. 2015, 29, 823–836. [Google Scholar] [CrossRef]
  9. Zhu, J.H.; Zhu, S.Y.; Yu, F.C.; Zhang, G.X.; Xu, Y.M. A downscaling method for ERA5 reanalysis land surface temperature over urban and mountain areas. Natl. Remote Sens. Bull. 2021, 25, 1778–1791. [Google Scholar]
  10. Fan, J.; Tan, S.; Han, Q.; Li, J. Evaluation of six satellite-based soil moisture products based on in situ measurements in Hunan Province, Central China. Front. Environ. Sci. 2022, 56, 829046. [Google Scholar] [CrossRef]
  11. Zhang, P.; Zhu, L.; Tang, S.; Gao, L.; Chen, L.; Zheng, W.; Han, X.; Chen, J.; Shao, J. General Comparison of FY-4A/AGRI with Other GEO/LEO Instruments and Its Potential and Challenges in Non-meteorological Applications. Front. Earth Sci. 2019, 6, 224. [Google Scholar] [CrossRef] [Green Version]
  12. Yang, J.; Zhang, Z.; Wei, C.; Lu, F.; Guo, Q. Introducing the new generation of Chinese geostationary weather satellites, Fengyun-4. Bull. Am. Meteorol. Soc. 2017, 98, 1637–1658. [Google Scholar] [CrossRef]
  13. Duan, S.-B.; Li, Z.-L.; Li, H.; Göttsche, F.-M.; Wu, H.; Zhao, W.; Leng, P.; Zhang, X.; Coll, C. Validation of Collection 6 MODIS land surface temperature product using in situ measurements. Remote Sens. Environ. 2019, 225, 16–29. [Google Scholar] [CrossRef] [Green Version]
  14. Wan, Z. New refinements and validation of the collection-6 MODIS land-surface temperature/emissivity product. Remote Sens. Environ. 2014, 140, 36–45. [Google Scholar] [CrossRef]
  15. Guillevic, P.C.; Biard, J.C.; Hulley, G.C.; Privette, J.L.; Hook, S.J.; Olioso, A.; Göttsche, F.M.; Radocinski, R.; Román, M.O.; Yu, Y. Validation of Land Surface Temperature products derived from the Visible Infrared Imaging Radiometer Suite (VIIRS) using ground-based and heritage satellite measurements. Remote Sens. Environ. 2014, 154, 19–37. [Google Scholar] [CrossRef]
  16. Martin, M.A.; Ghent, D.; Pires, A.C.; Göttsche, F.-M.; Cermak, J.; Remedios, J.J. Comprehensive in situ validation of five satellite land surface temperature data sets over multiple stations and years. Remote Sens. 2019, 11, 479. [Google Scholar] [CrossRef] [Green Version]
  17. Yu, W.; Ma, M. Scale mismatch between in situ and remote sensing observations of land surface temperature: Implications for the validation of remote sensing LST products. IEEE Geosci. Remote Sens. Lett. 2014, 12, 497–501. [Google Scholar]
  18. Guillevic, P.; Göttsche, F.; Nickeson, J.; Hulley, G.; Ghent, D.; Yu, Y.; Trigo, I.; Hook, S.; Sobrino, J.; Remedios, J. Land surface temperature product validation best practice protocol. Version 1.1. In Best Practice for Satellite-Derived Land Product Validation; WGCV/CEOS: Washington, DC, USA, 2018; Volume 60. [Google Scholar]
  19. Stoffelen, A. Toward the true near-surface wind speed: Error modeling and calibration using triple collocation. J. Geophys. Res. Ocean. 1998, 103, 7755–7766. [Google Scholar] [CrossRef]
  20. Gruber, A.; Su, C.-H.; Zwieback, S.; Crow, W.; Dorigo, W.; Wagner, W. Recent advances in (soil moisture) triple collocation analysis. Int. J. Appl. Earth Obs. Geoinf. 2016, 45, 200–211. [Google Scholar] [CrossRef]
  21. Chen, F.; Crow, W.T.; Colliander, A.; Cosh, M.H.; Jackson, T.J.; Bindlish, R.; Reichle, R.H.; Chan, S.K.; Bosch, D.D.; Starks, P.J. Application of triple collocation in ground-based validation of Soil Moisture Active/Passive (SMAP) level 2 data products. IEEE J. Sel. Top. Appl. Earth Obs. Remote Sens. 2016, 10, 489–502. [Google Scholar] [CrossRef]
  22. Miralles, D.G.; Crow, W.T.; Cosh, M.H. Estimating spatial sampling errors in coarse-scale soil moisture estimates derived from point-scale observations. J. Hydrometeorol. 2010, 11, 1423–1429. [Google Scholar] [CrossRef]
  23. Dorigo, W.A.; Scipal, K.; Parinussa, R.M.; Liu, Y.Y.; Wagner, W.; De Jeu, R.A.; Naeimi, V. Error characterisation of global active and passive microwave soil moisture datasets. Hydrol. Earth Syst. Sci. 2010, 14, 2605–2616. [Google Scholar] [CrossRef] [Green Version]
  24. Fan, J.; Luo, Y.; Tan, S.; Ma, W.; Zhang, H.; Liu, F. Accuracy evaluation of the FY-3 C/MWRI land surface temperature product in Hunan Province. Remote Sens. Land Resour. 2021, 1, 249–255. [Google Scholar]
  25. Wu, P.; Yin, Z.; Zeng, C.; Duan, S.-B.; Göttsche, F.-M.; Ma, X.; Li, X.; Yang, H.; Shen, H. Spatially continuous and high-resolution land surface temperature product generation: A review of reconstruction and spatiotemporal fusion techniques. IEEE Geosci. Remote Sens. Mag. 2021, 9, 112–137. [Google Scholar] [CrossRef]
  26. Yang, J.; Ren, J.; Sun, D.; Xiao, X.; Xia, J.C.; Jin, C.; Li, X. Understanding land surface temperature impact factors based on local climate zones. Sustain. Cities Soc. 2021, 69, 102818. [Google Scholar] [CrossRef]
  27. Song, J.; Du, S.; Feng, X.; Guo, L. The relationships between landscape compositions and land surface temperature: Quantifying their resolution sensitivity with spatial regression models. Landsc. Urban Plan. 2014, 123, 145–157. [Google Scholar] [CrossRef]
  28. Guo, A.; Yang, J.; Sun, W.; Xiao, X.; Cecilia, J.X.; Jin, C.; Li, X. Impact of urban morphology and landscape characteristics on spatiotemporal heterogeneity of land surface temperature. Sustain. Cities Soc. 2020, 63, 102443. [Google Scholar] [CrossRef]
  29. Xiao, R.; Weng, Q.; Ouyang, Z.; Li, W.; Schienke, E.W.; Zhang, Z. Land surface temperature variation and major factors in Beijing, China. Photogramm. Eng. Remote Sens. 2008, 74, 451–461. [Google Scholar] [CrossRef] [Green Version]
  30. Koc, C.B.; Osmond, P.; Peters, A.; Irger, M. Understanding land surface temperature differences of local climate zones based on airborne remote sensing data. IEEE J. Sel. Top. Appl. Earth Obs. Remote Sens. 2018, 11, 2724–2730. [Google Scholar]
  31. Yang, J.; Wong, M.S.; Menenti, M.; Nichol, J. Study of the geometry effect on land surface temperature retrieval in urban environment. ISPRS J. Photogramm. Remote Sens. 2015, 109, 77–87. [Google Scholar] [CrossRef]
  32. Choi, Y.-Y.; Suh, M.-S. Development of Himawari-8/Advanced Himawari Imager (AHI) land surface temperature retrieval algorithm. Remote Sens. 2018, 10, 2013. [Google Scholar] [CrossRef] [Green Version]
  33. Hu, T.; van Dijk, A.I.; Renzullo, L.J.; Xu, Z.; He, J.; Tian, S.; Zhou, J.; Li, H. On agricultural drought monitoring in Australia using Himawari-8 geostationary thermal infrared observations. Int. J. Appl. Earth Obs. Geoinf. 2020, 91, 102153. [Google Scholar] [CrossRef]
  34. Yu, Y.; Tarpley, D.; Privette, J.L.; Goldberg, M.D.; Raja, M.K.R.V.; Vinnikov, K.Y.; Xu, H. Developing Algorithm for Operational GOES-R Land Surface Temperature Product. IEEE Trans. Geosci. Remote Sens. 2009, 47, 936–951. [Google Scholar]
  35. Shi, C.; Xie, Z.; Qian, H.; Liang, M.; Yang, X. China land soil moisture EnKF data assimilation based on satellite remote sensing data. Sci. China Earth Sci. 2011, 54, 1430–1440. [Google Scholar] [CrossRef]
  36. Muñoz-Sabater, J.; Dutra, E.; Agustí-Panareda, A.; Albergel, C.; Arduini, G.; Balsamo, G.; Boussetta, S.; Choulga, M.; Harrigan, S.; Hersbach, H. ERA5-Land: A state-of-the-art global reanalysis dataset for land applications. Earth Syst. Sci. Data 2021, 13, 4349–4383. [Google Scholar] [CrossRef]
  37. Russo, I.M.; Di Bisceglie, M.; Galdi, C.; Lavalle, M.; Zuffada, C. Entropy-Based Coherence Metric for Land Applications of GNSS-R. IEEE Trans. Geosci. Remote Sens. 2021, 60, 1–13. [Google Scholar] [CrossRef]
  38. Fan, J.; Luo, M.; Han, Q.; Liu, F.; Huang, W.; Tan, S. Evaluation of SMOS, SMAP, AMSR2 and FY-3C soil moisture products over China. PLoS ONE 2022, 17, e0266091. [Google Scholar] [CrossRef] [PubMed]
  39. McColl, K.A.; Vogelzang, J.; Konings, A.G.; Entekhabi, D.; Piles, M.; Stoffelen, A. Extended triple collocation: Estimating errors and correlation coefficients with respect to an unknown target. Geophys. Res. Lett. 2014, 41, 6229–6236. [Google Scholar] [CrossRef]
  40. Draper, C.; Reichle, R.; de Jeu, R.; Naeimi, V.; Parinussa, R.; Wagner, W. Estimating root mean square errors in remotely sensed soil moisture over continental scale domains. Remote Sens. Environ. 2013, 137, 288–298. [Google Scholar] [CrossRef] [Green Version]
  41. Sekertekin, A.; Bonafoni, S. Sensitivity Analysis and Validation of Daytime and Nighttime Land Surface Temperature Retrievals from Landsat 8 Using Different Algorithms and Emissivity Models. Remote Sens. 2020, 12, 2776. [Google Scholar] [CrossRef]
  42. Sekertekin, A.; Bonafoni, S. Land surface temperature retrieval from Landsat 5, 7, and 8 over rural areas: Assessment of different retrieval algorithms and emissivity models and toolbox implementation. Remote Sens. 2020, 12, 294. [Google Scholar] [CrossRef] [Green Version]
  43. Li, R.; Li, H.; Sun, L.; Yang, Y.; Hu, T.; Bian, Z.; Cao, B.; Du, Y.; Liu, Q. An Operational Split-Window Algorithm for Retrieving Land Surface Temperature from Geostationary Satellite Data: A Case Study on Himawari-8 AHI Data. Remote Sens. 2020, 12, 2613. [Google Scholar] [CrossRef]
  44. Chang, Y.; Xiao, J.; Li, X.; Frolking, S.; Zhou, D.; Schneider, A.; Weng, Q.; Yu, P.; Wang, X.; Li, X.; et al. Exploring diurnal cycles of surface urban heat island intensity in Boston with land surface temperature data derived from GOES-R geostationary satellites. Sci. Total Environ. 2021, 763, 144224. [Google Scholar] [CrossRef] [PubMed]
  45. Peng, J.; Jia, J.; Liu, Y.; Li, H.; Wu, J. Seasonal contrast of the dominant factors for spatial distribution of land surface temperature in urban areas. Remote Sens. Environ. 2018, 215, 255–267. [Google Scholar] [CrossRef]
  46. Wang, H.; Mao, K.; Yuan, Z.; Shi, J.; Cao, M.; Qin, Z.; Duan, S.; Tang, B. A method for land surface temperature retrieval based on model-data-knowledge-driven and deep learning. Remote Sens. Environ. 2021, 265, 112665. [Google Scholar] [CrossRef]
  47. Xu, H.; Yu, Y.; Tarpley, D.; Göttsche, F.; Olesen, F. Evaluation of GOES-R Land Surface Temperature Algorithm Using SEVIRI Satellite Retrievals with In Situ Measurements. IEEE Trans. Geosci. Remote Sens. 2014, 52, 3812–3822. [Google Scholar] [CrossRef]
Figure 1. Topographical map showing the distribution of in situ measurement stations, land cover and landforms in Hunan Province; abbreviations for land cover are: CL Cultivated land, FE Forest, GL Grassland, WL Wetland, WB Water body, AS Artificial surfaces; abbreviations for landform are: PL Plain, PF Platform, HL Hill, LM Low relief mountain, MM Medium relief mountain, HM High relief mountain.
Atmosphere 13 01953 g001
Figure 2. Flowchart of this research project.
Atmosphere 13 01953 g002
Figure 3. Scatterplots of FY-4A LST and Himawari-8 LST vs. in situ measurement; the straight line in the figure is the y = x line; the brighter the color in the figure, the more concentrated the data points.
Atmosphere 13 01953 g003
Figure 4. Spatial distribution of Rho from TCA of FY-4A (left) and Himawari-8 (right) LSTs in Hunan Province; results are only shown for grids in which all three datasets showed a significant positive correlation and there were >100 data triplets.
Atmosphere 13 01953 g004
Figure 5. Distribution of TCA error indicators for FY-4A LST in Hunan Province; results are shown only for grids in which all three datasets showed significant positive correlation and there were >100 triplets.
Atmosphere 13 01953 g005
Figure 6. Error indicators of TCA for different mean DEM classifications; (A): Rho vs. DEM for LST of FY-4A and Himawari-8; (BE) are Sensitivity, Stderr, fRMSE, and Snr_db vs. DEM for FY-4A LST; the number of FY-4A grids in each mean DEM classification was 7094, 2845, 542 and 98.
Atmosphere 13 01953 g006
Figure 7. Effect of land cover type and information entropy on the accuracy of remote sensing LST products; abbreviations and FY-4A grids for land cover are: CL Cultivated land (2973 grids), FE Forest (7246 grids), GL Grassland (91 grids), WL Wetland (9 grids), WB Water body (122 grids), AS Artificial surfaces (138 grids); (A): Rho vs. land cover type for LST of FY-4A and Himawari-8; (B,C) are Sensitivity, fRMSE vs. land cover type and information entropy for FY-4A LST; the number of FY-4A grids in each level of H was 295, 1008, 2650 and 6626.
Atmosphere 13 01953 g007
Figure 8. Effect of landform, slope, soil moisture and NDVI on the accuracy of FY-4A LST data; abbreviations for landform are: PL Plain, PF Platform, HL Hill, LM Low relief mountain, MM Medium relief mountain, HM High relief mountain.
Atmosphere 13 01953 g008
Table 1. Datasets used in this study.
Data CategoryData NameTime PeriodTemporal ResolutionSpatial Resolution
Remote sensing
products
FY-4A/AGRI LST1 October 2019 0 h–30 September 2019 23 h1 h4 km
Himawari-8/AHI LST1 October 2019 0 h–30 September 2019 23 h1 h0.045°
In situ measured dataIn situ measured LST
from CMA stations
1 October 2019 0 h–30 September 2019 23 h1 h/
Reanalysis productsCLDAS LST1 October 2019 0 h–30 September 2019 23 h1 h0.0625°
ERA5-Land LST1 October 2019 0 h–30 September 2019 23 h1 h0.1°
Auxiliary dataNASA ASTER GDEM v32021/30 m
China’s GlobalLand30 v20202020/30 m
Geomorphic type data
from IGSNRR, CAS
2009/1:1,000,000
Soil moisture data
retrieval from SMAP
1 October 2019–
30 September 2019
1 d36 km
NDVI data of NASA VNP13A222 September 2019–
30 March 2021
16 d1 km
Table 2. Error parameters for comparison between FY-4A LST and Himawari-8 LST tested against in situ measurements.
ProductRBiasBiasrRMSEubRMSEData Quantity
FY-4Aoverall0.893−6.2950.3038.5885.8425.394 × 105
daytime0.920−9.2440.33611.0786.1052.181 × 105
nighttime0.864−4.2940.2656.3654.6993.213 × 105
Himawari-8overall0.926−4.9330.2387.5085.6605.191 × 105
daytime0.923−7.4130.2479.6066.1102.368 × 105
nighttime0.849−2.8540.2195.1244.2562.823 × 105
Daytime is the local meteorological daytime in Hunan Province, i.e., UTC [0, 12), and nighttime is UTC [12, 24).
Table 3. Error indicators for comparison between FY-4A LST and in situ measurement of classifications of different factors.
FactorsClassificationRBiasBiasrRMSEubRMSEData Quantity
Land surface temperature
(°C)
−20–30.333−0.2760.9373.1793.1670.316 × 105
3–260.778−4.7910.3166.7794.7953.301 × 105
26–490.673−9.0310.27410.1414.6131.617 × 105
49–720.333−21.5120.40121.8683.9290.16 × 105
SeasonsSpring0.849−6.4460.3068.6305.7370.972 × 105
Summer0.756−8.1370.26110.1606.0841.277 × 105
Autumn0.854−6.5730.2908.8295.8951.624 × 105
Winter0.819−4.3540.4446.6375.0091.521 × 105
Elevation
(m)
32–3790.895−6.3780.3038.6525.8455.011 × 105
379–7260.874−6.3480.3448.1825.1630.233 × 105
726–10730.848−5.9540.3628.2975.7790.052 × 105
1073–14200.847−2.1250.1506.0515.6650.099 × 105
Data in red are the optimal parameters of each classification, and data in yellow are the worst parameters.
Publisher’s Note: MDPI stays neutral with regard to jurisdictional claims in published maps and institutional affiliations.

