
Towards a Healthy Car: UVC LEDs in an Automobile’s HVAC Demonstrates Effective Disinfection of Cabin Air
 ,
,
Abstract
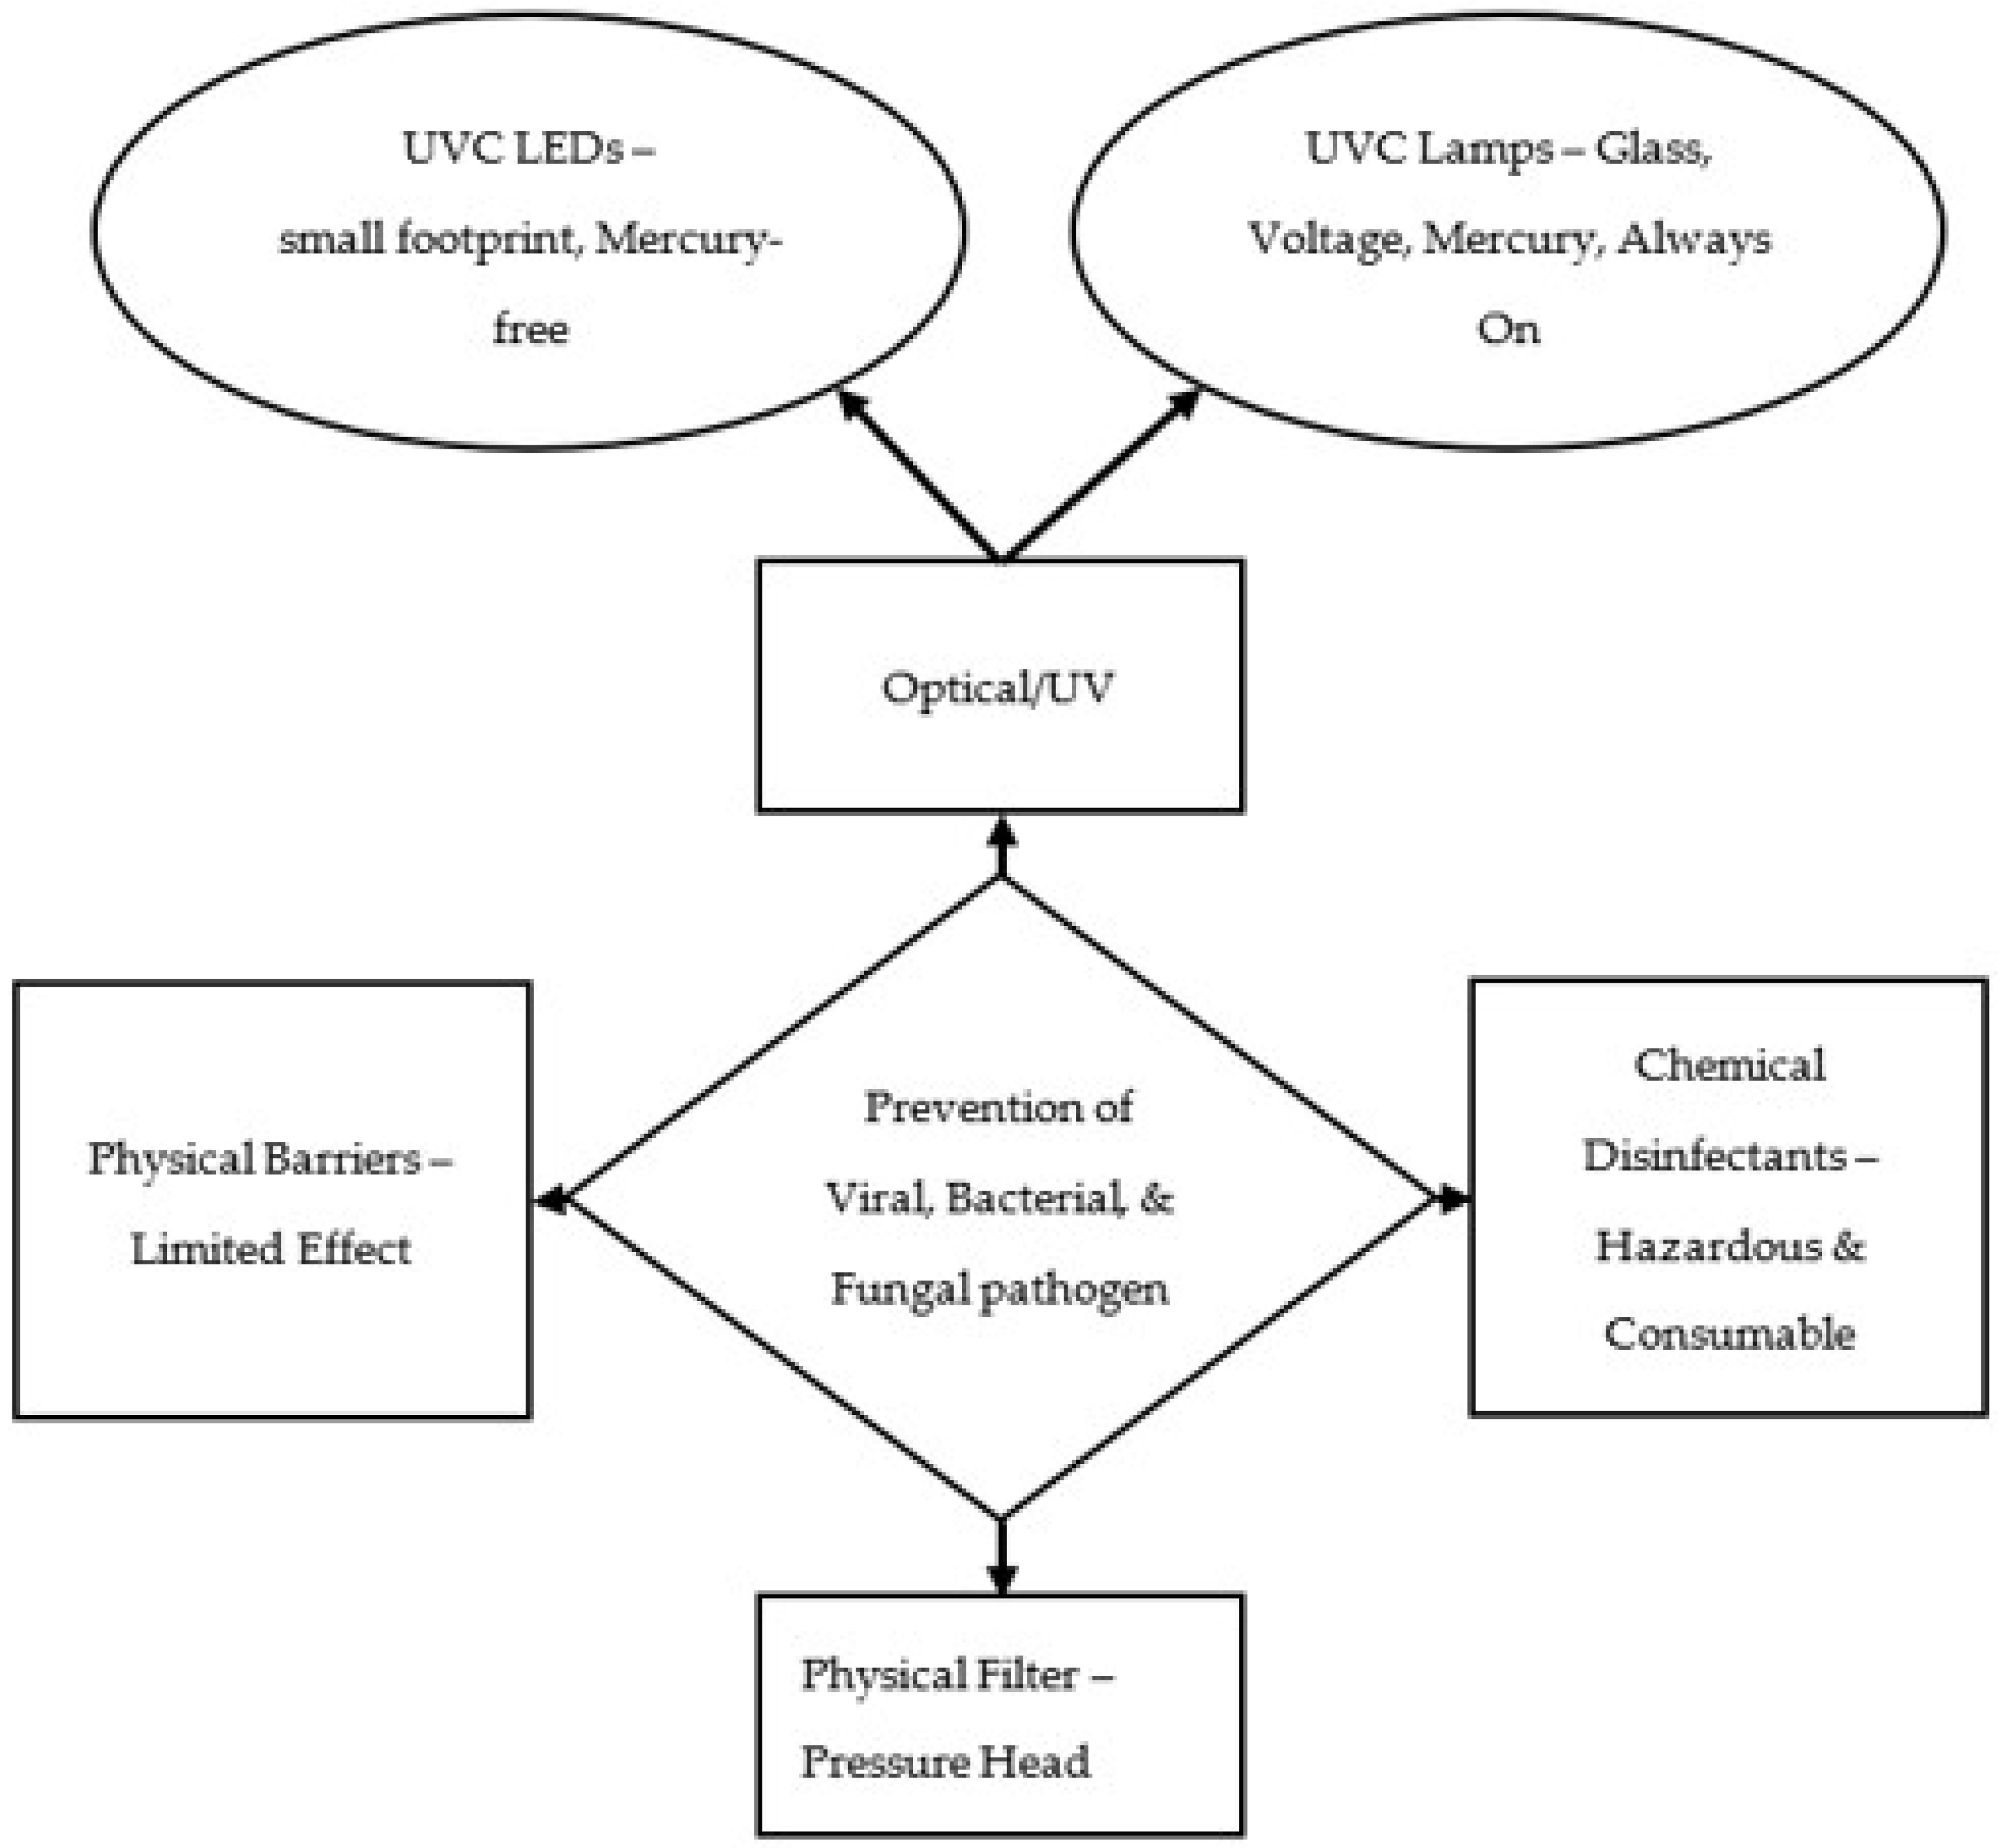
:1. Introduction
2. Materials and Methods
2.1. Culture Growth and Preparation of Bacteria and Bacteriophage Strains
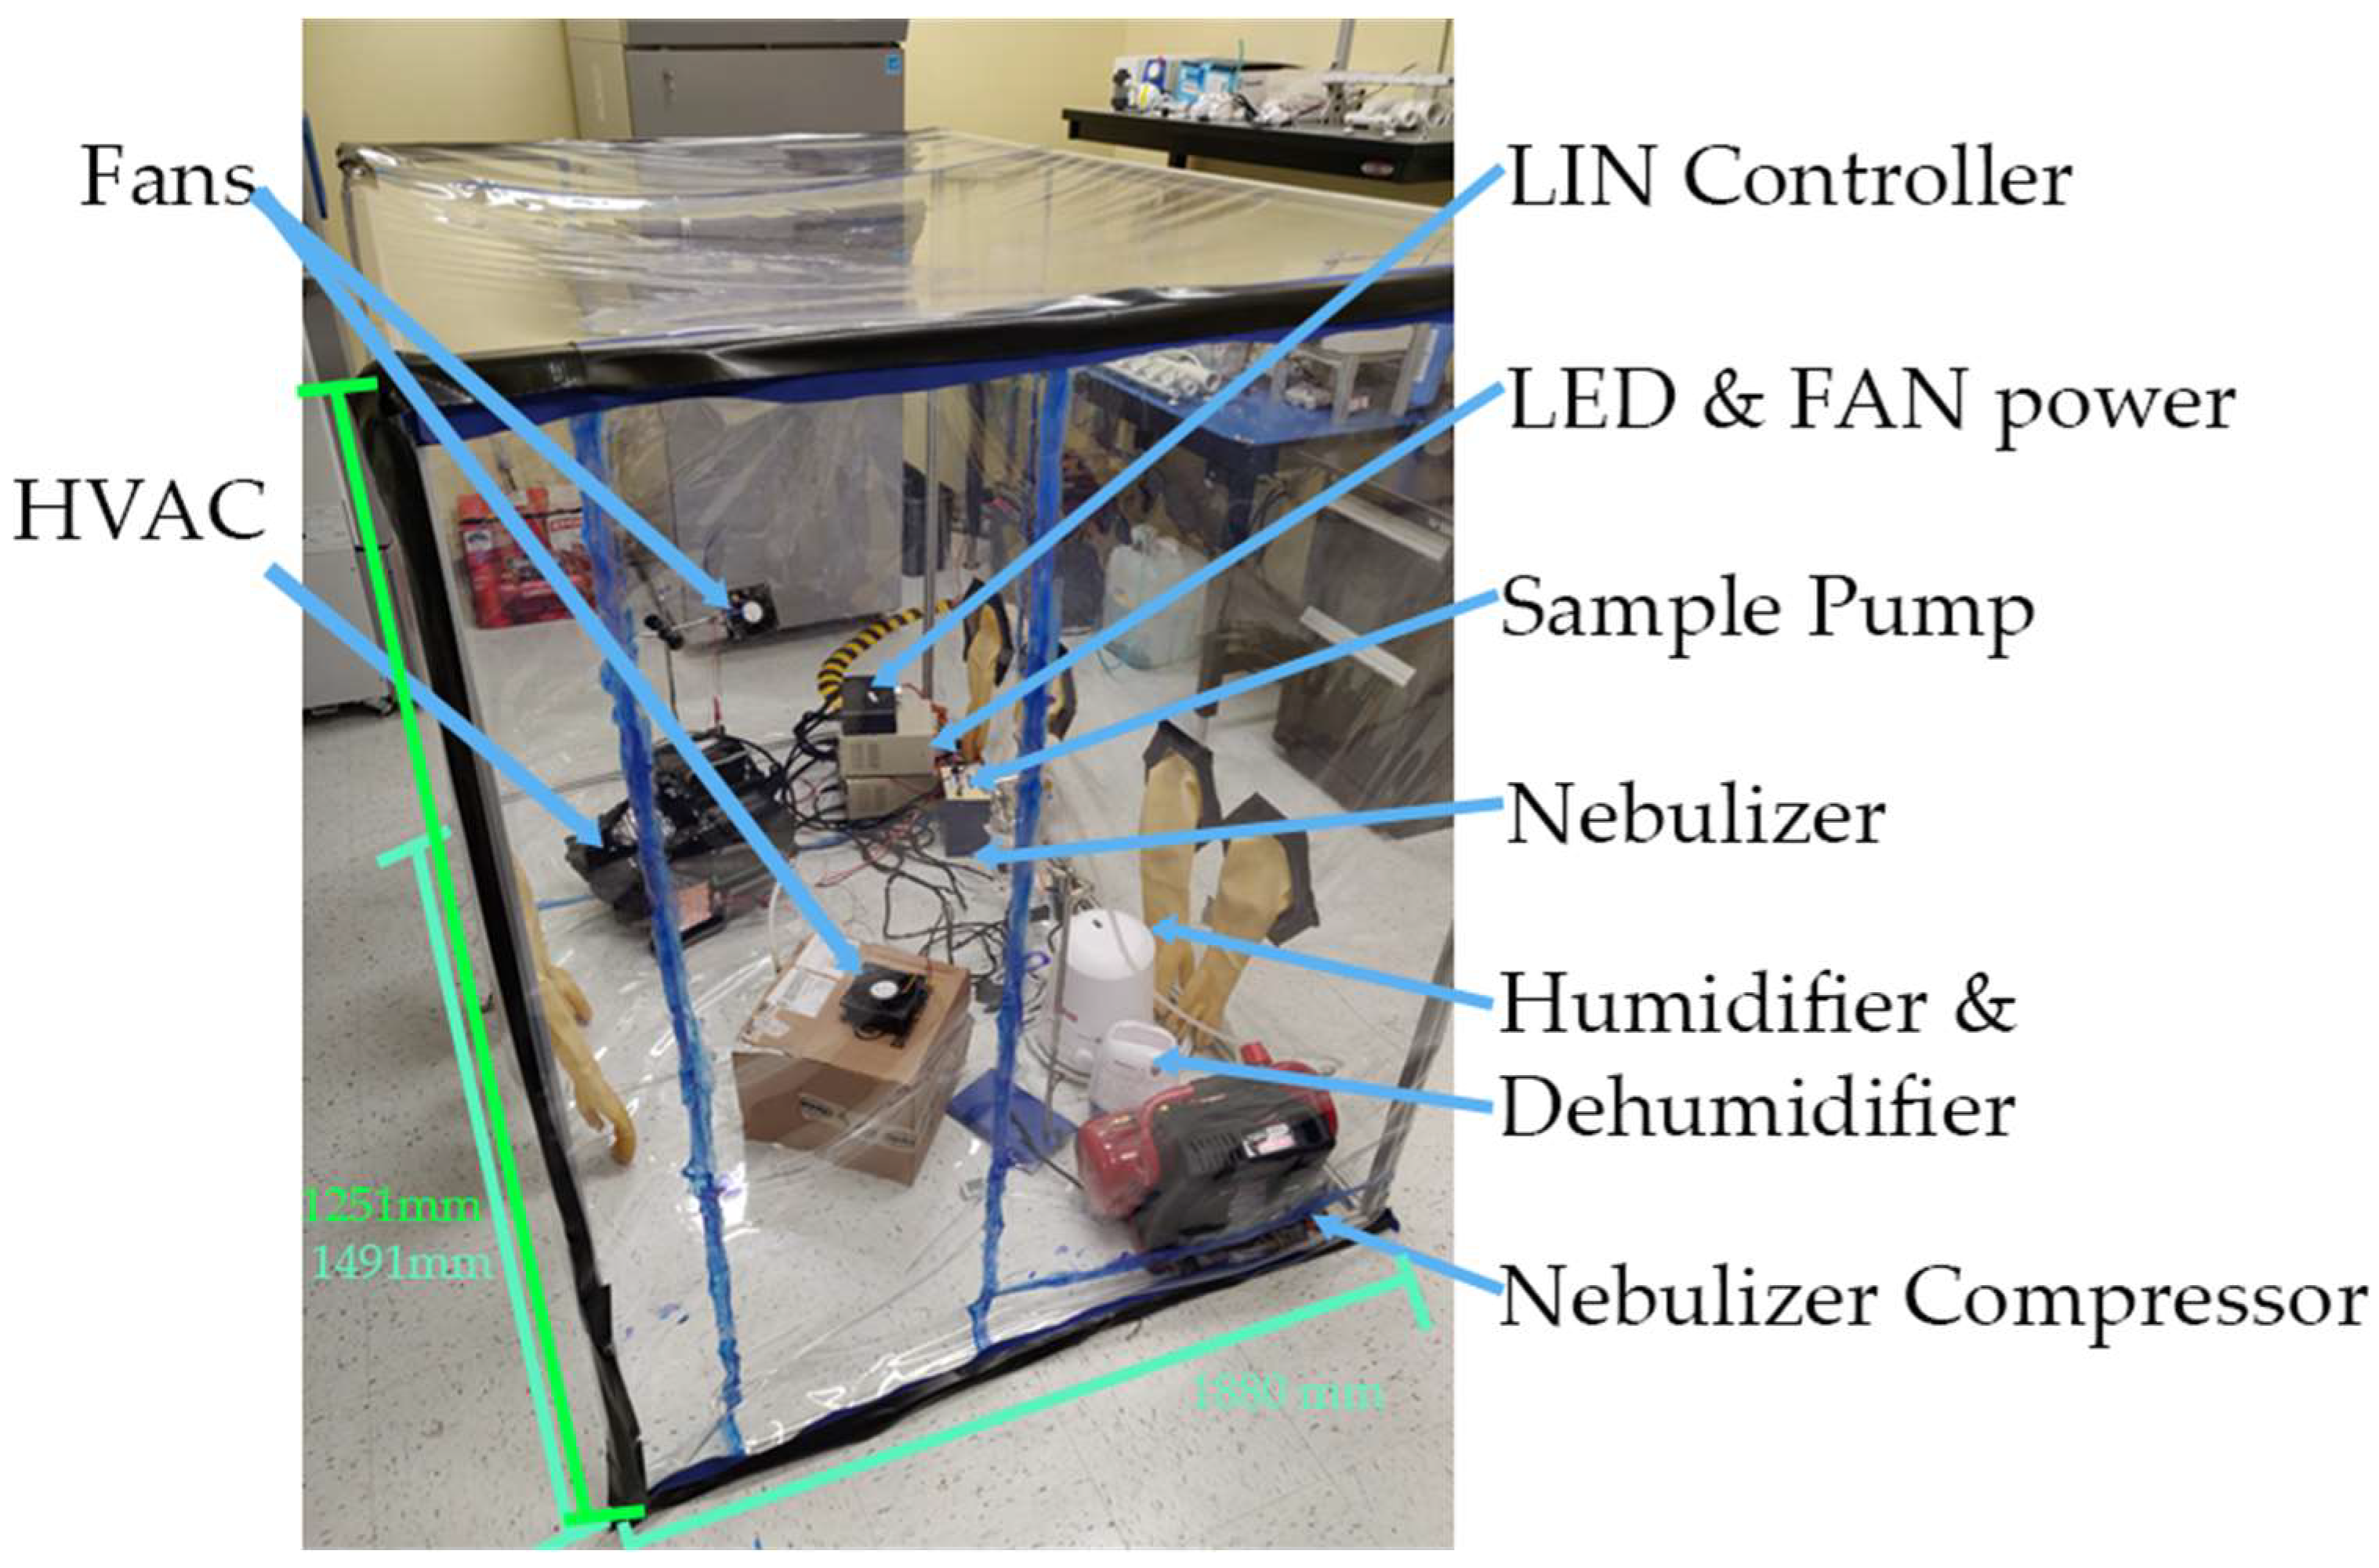
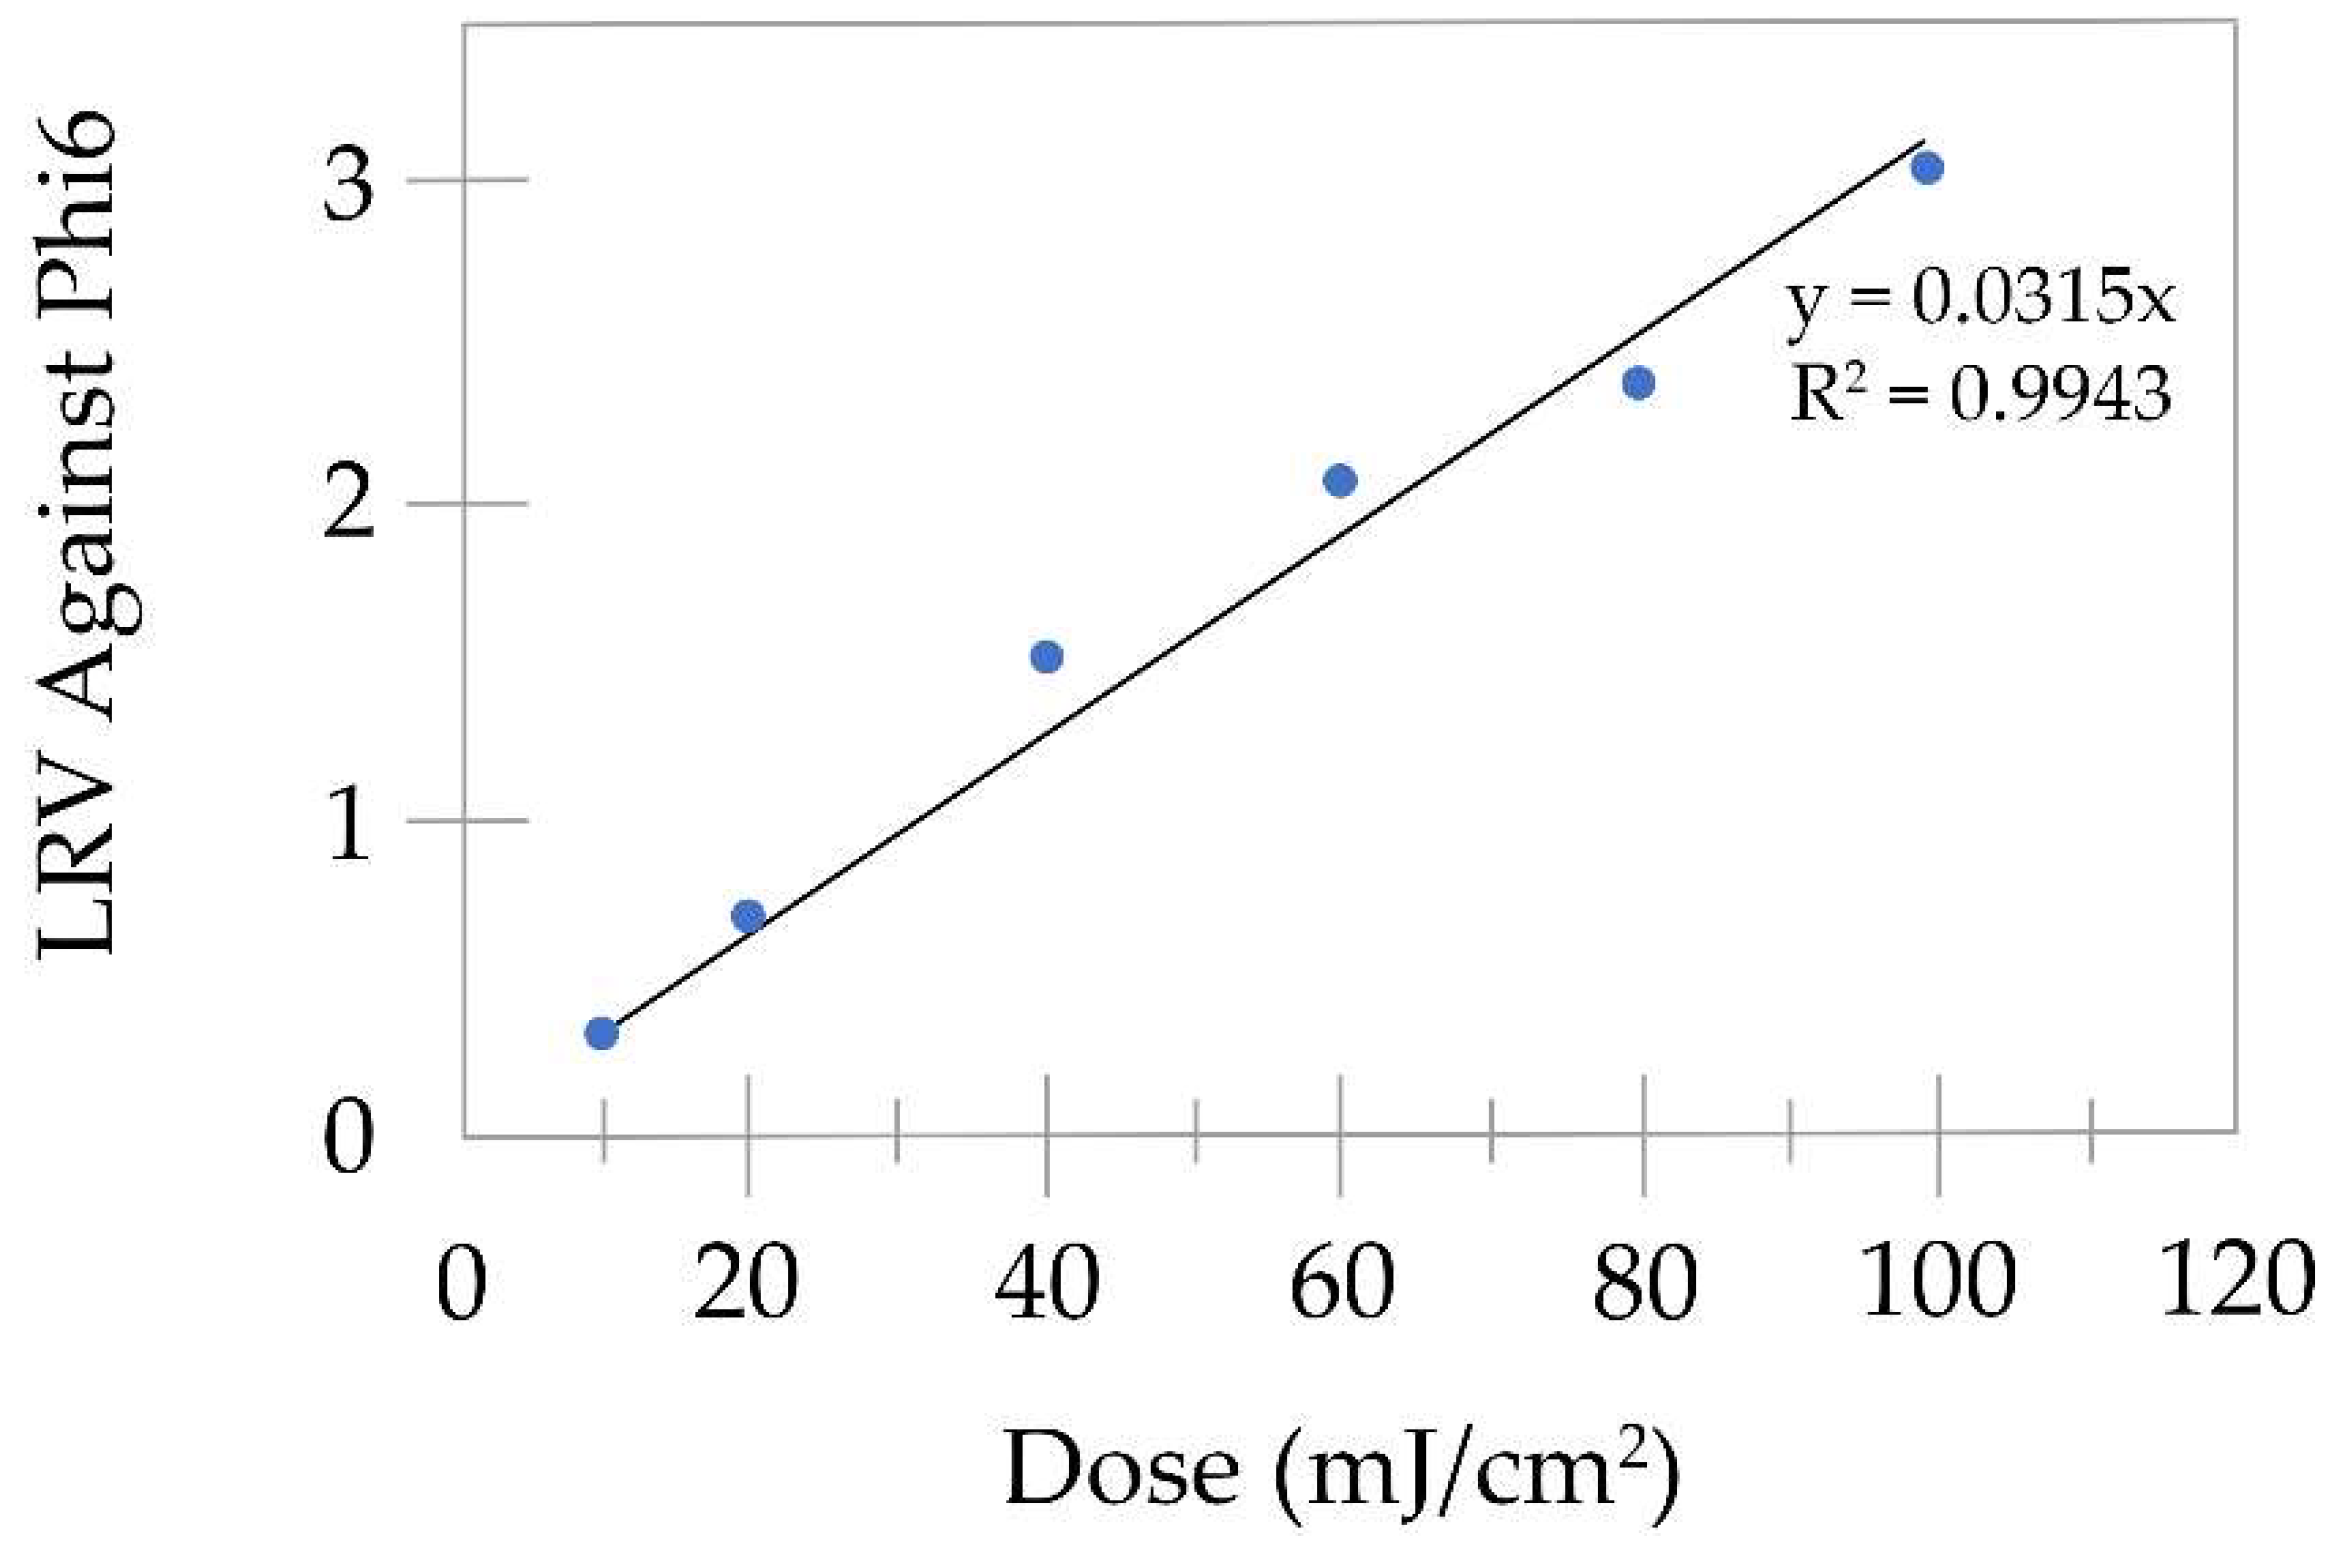
2.2. Set Up and Bacteriophage Phi6 Dose Response Curve
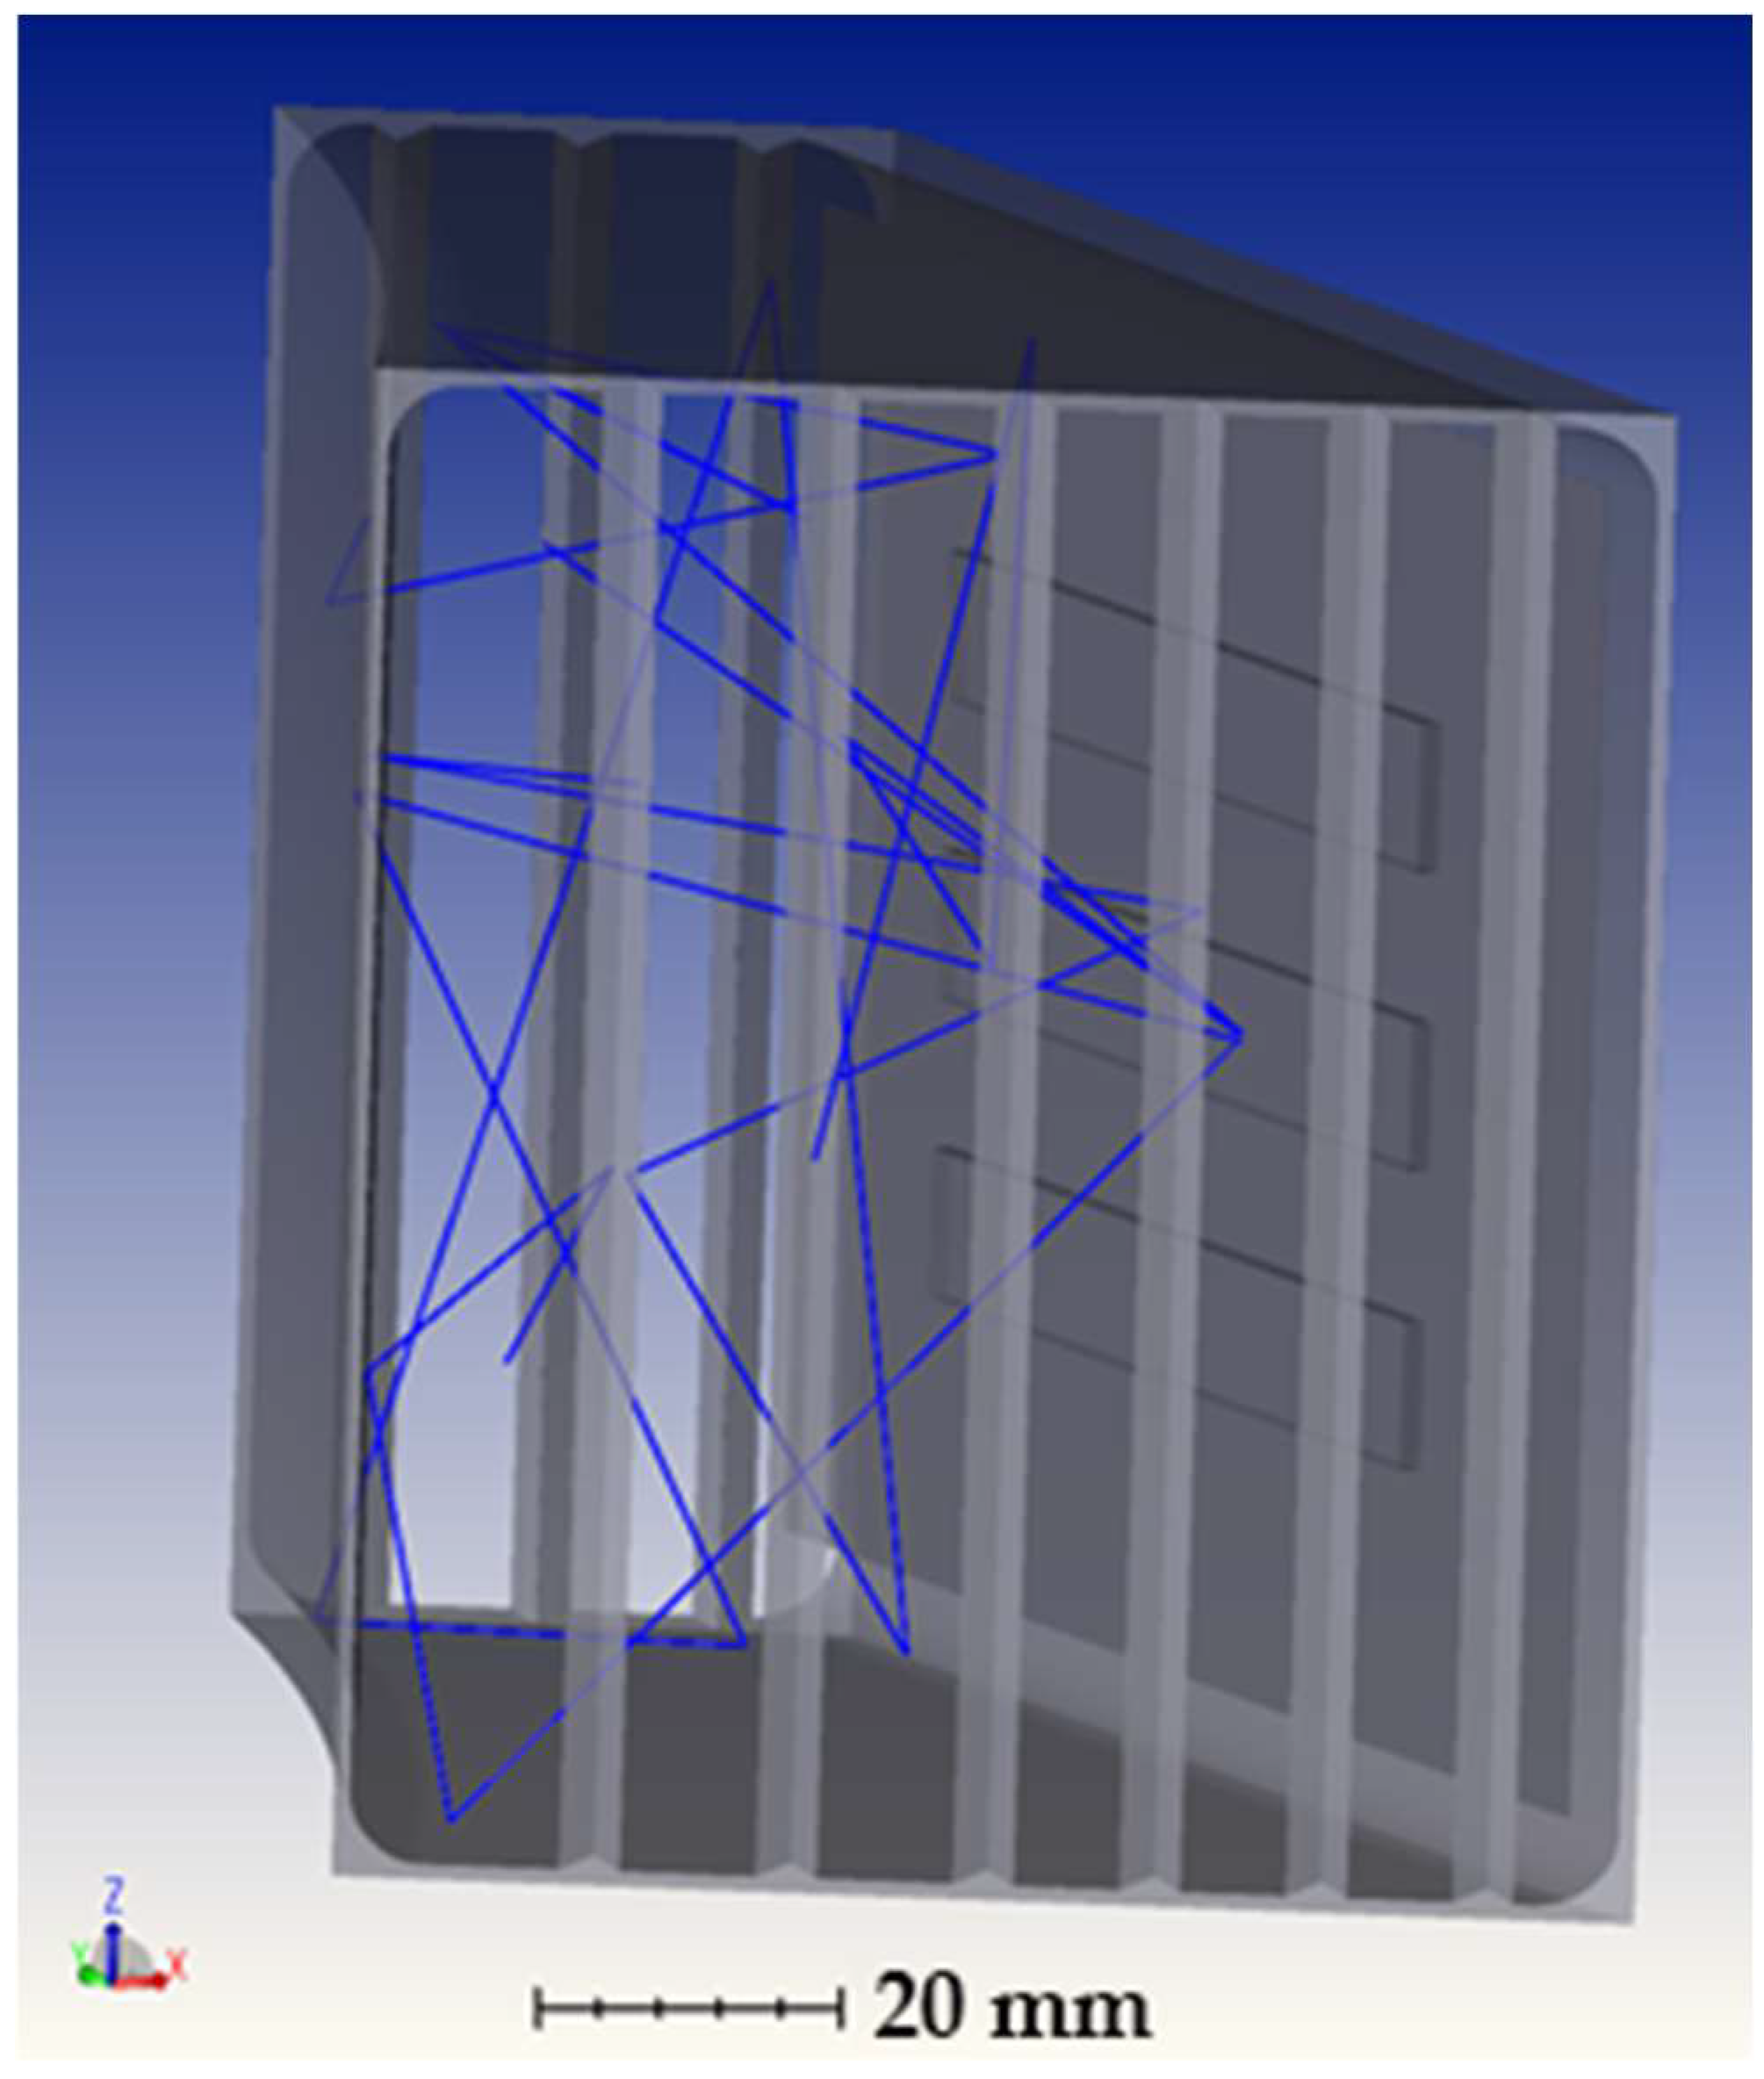
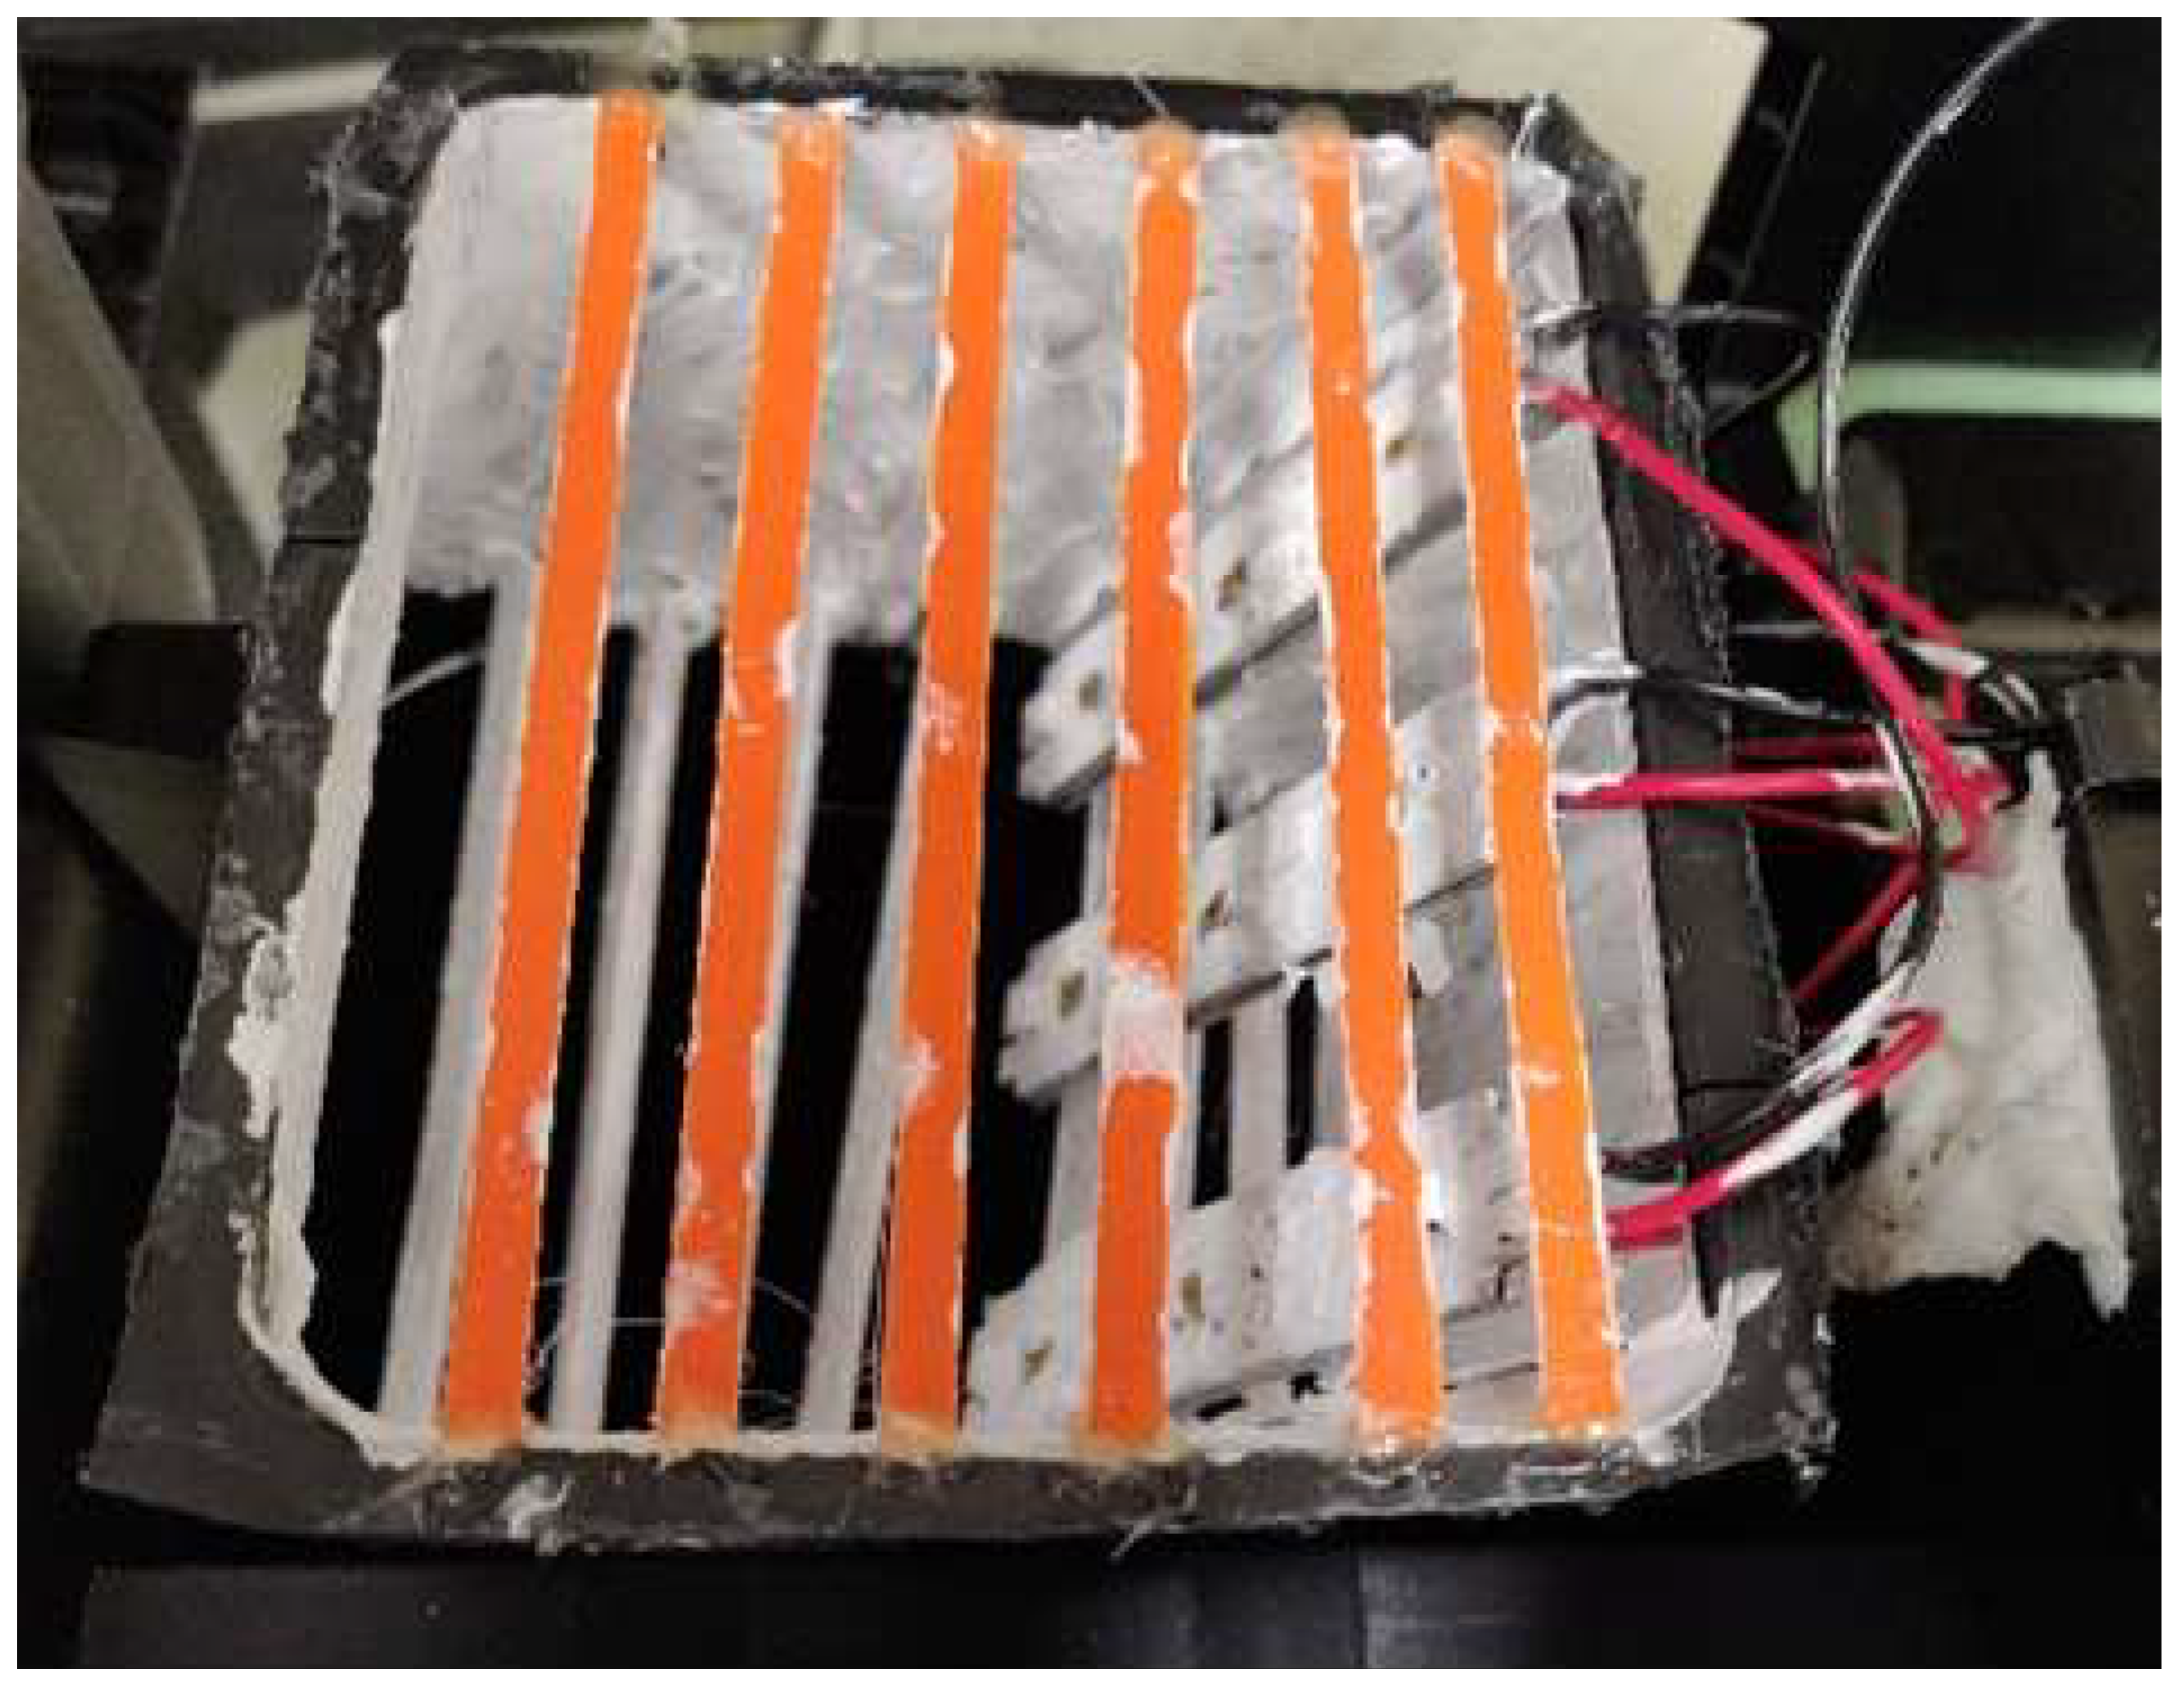
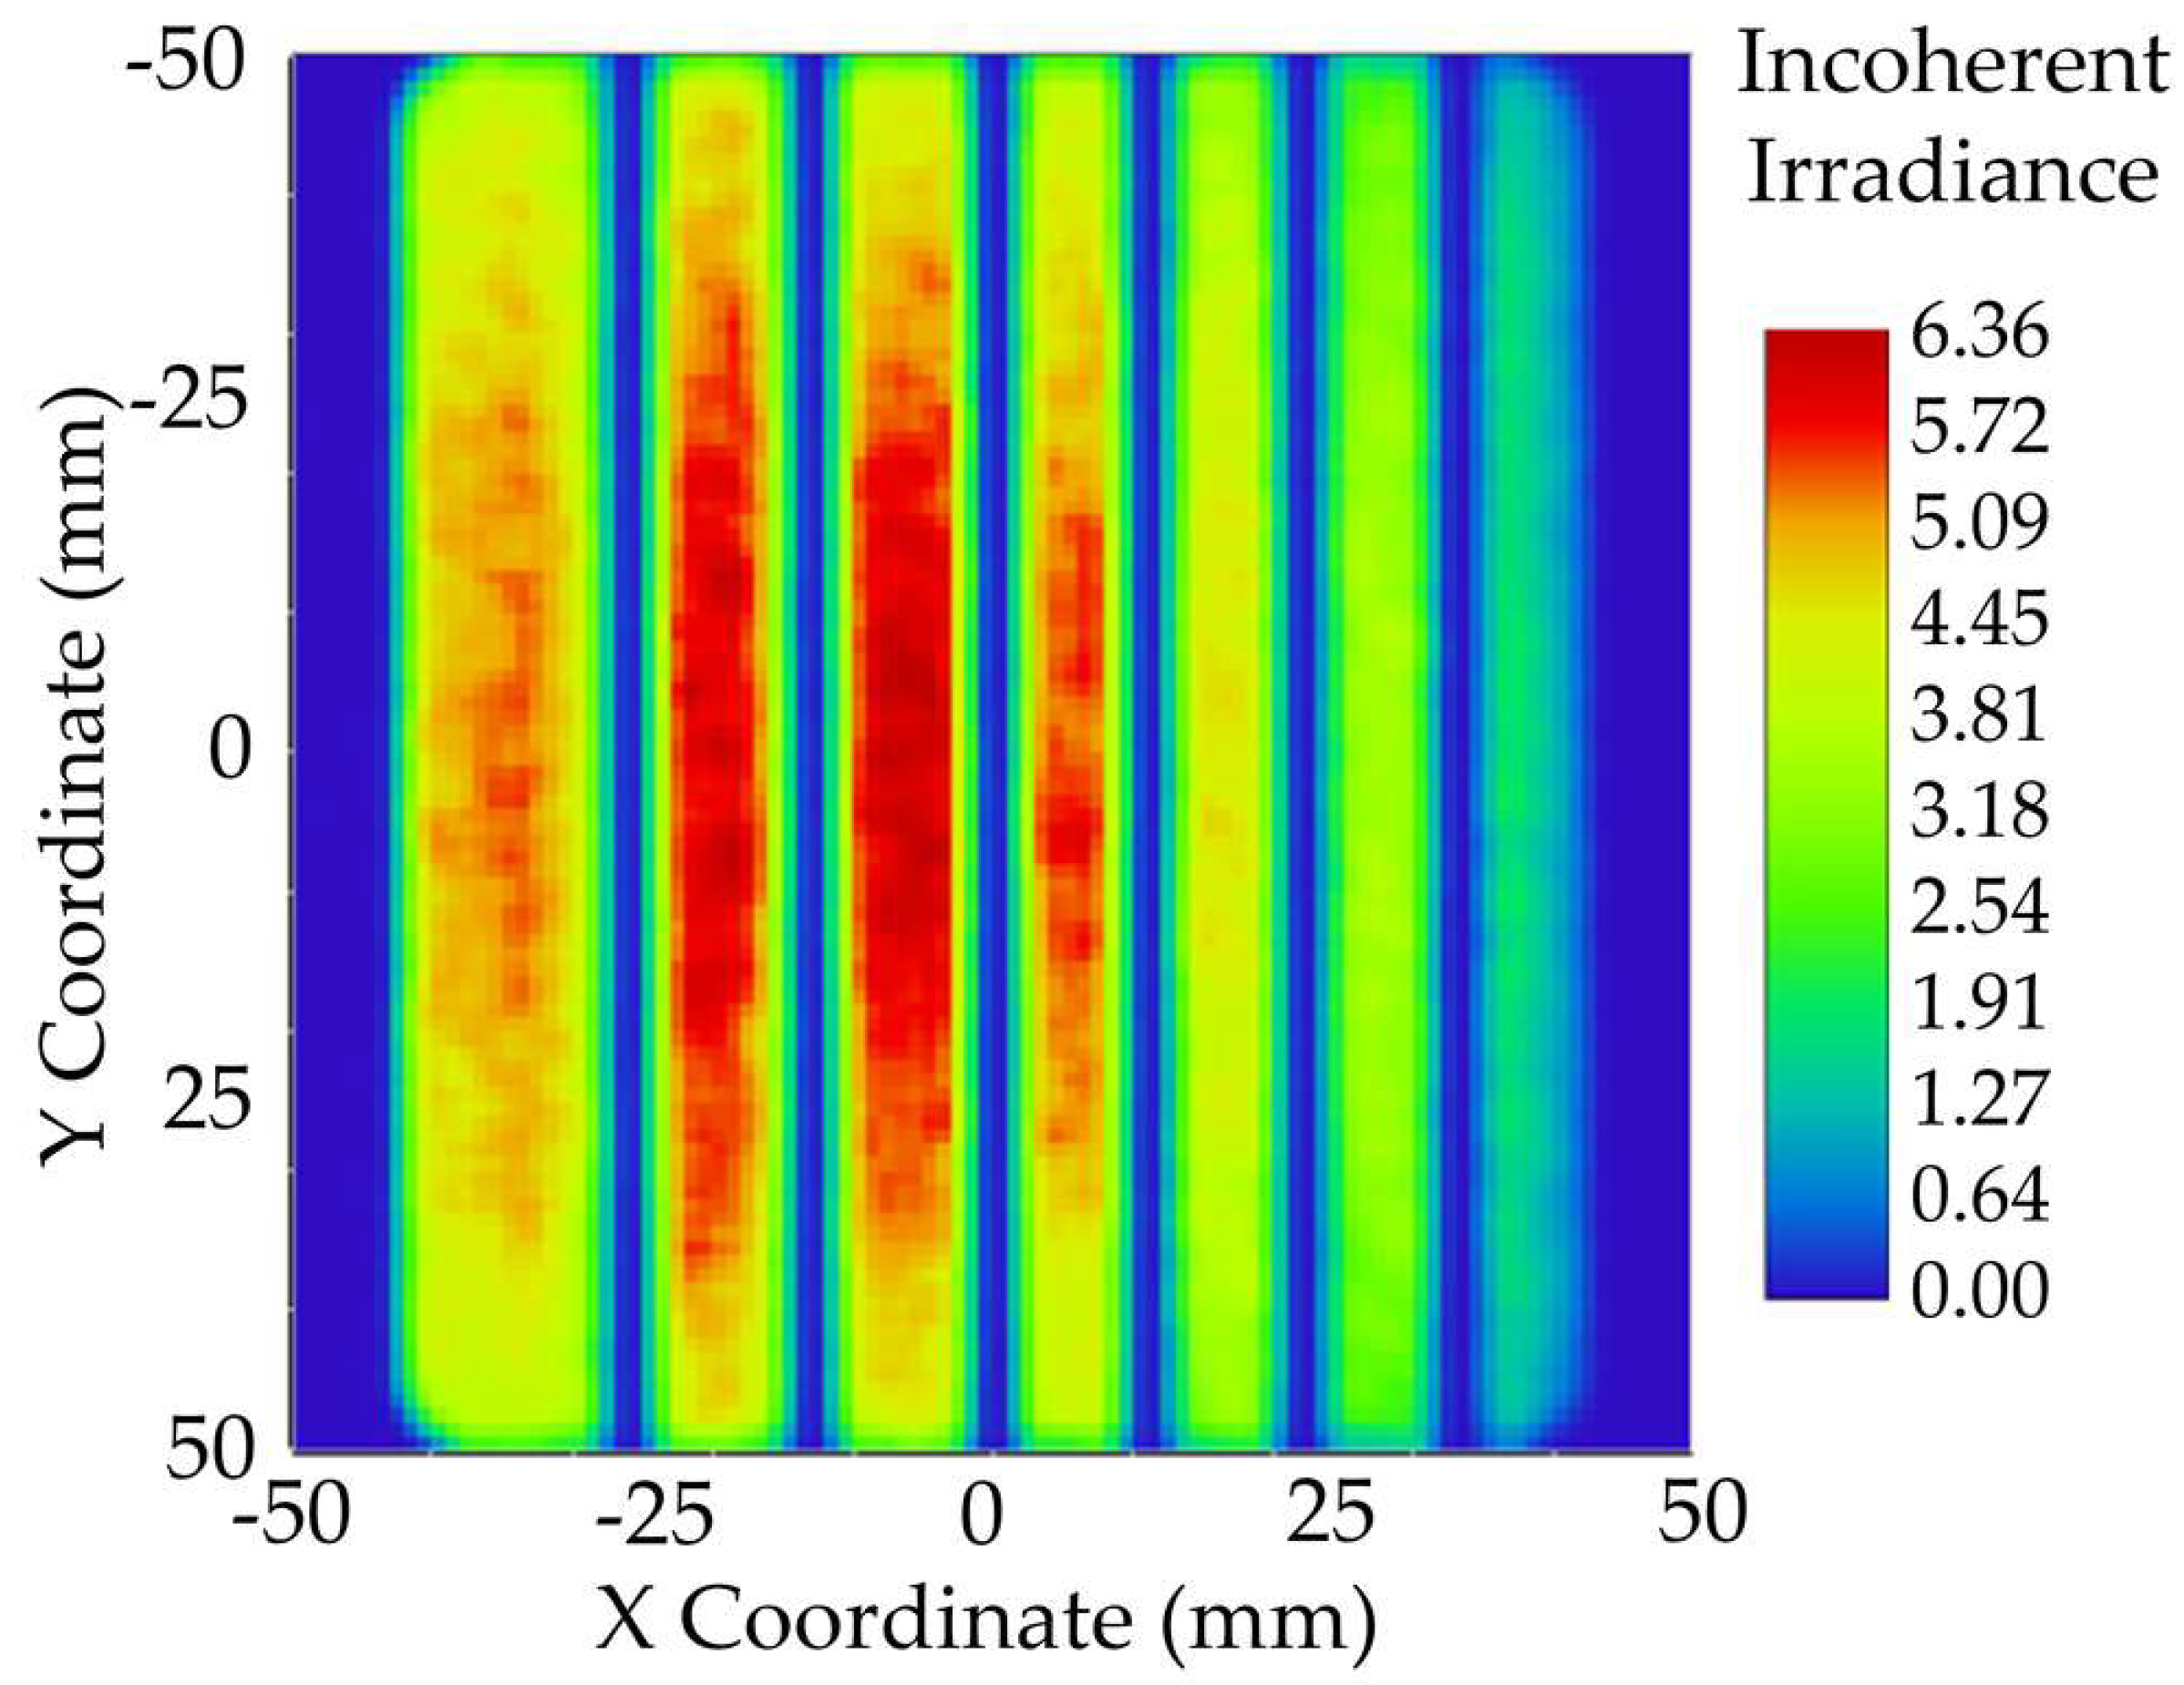
2.3. Modelling and Simulation of Reaction Chamber
2.4. Bacteriophage Phi6 Air Disinfection Procedure
2.5. Statistical Analysis
3. Results
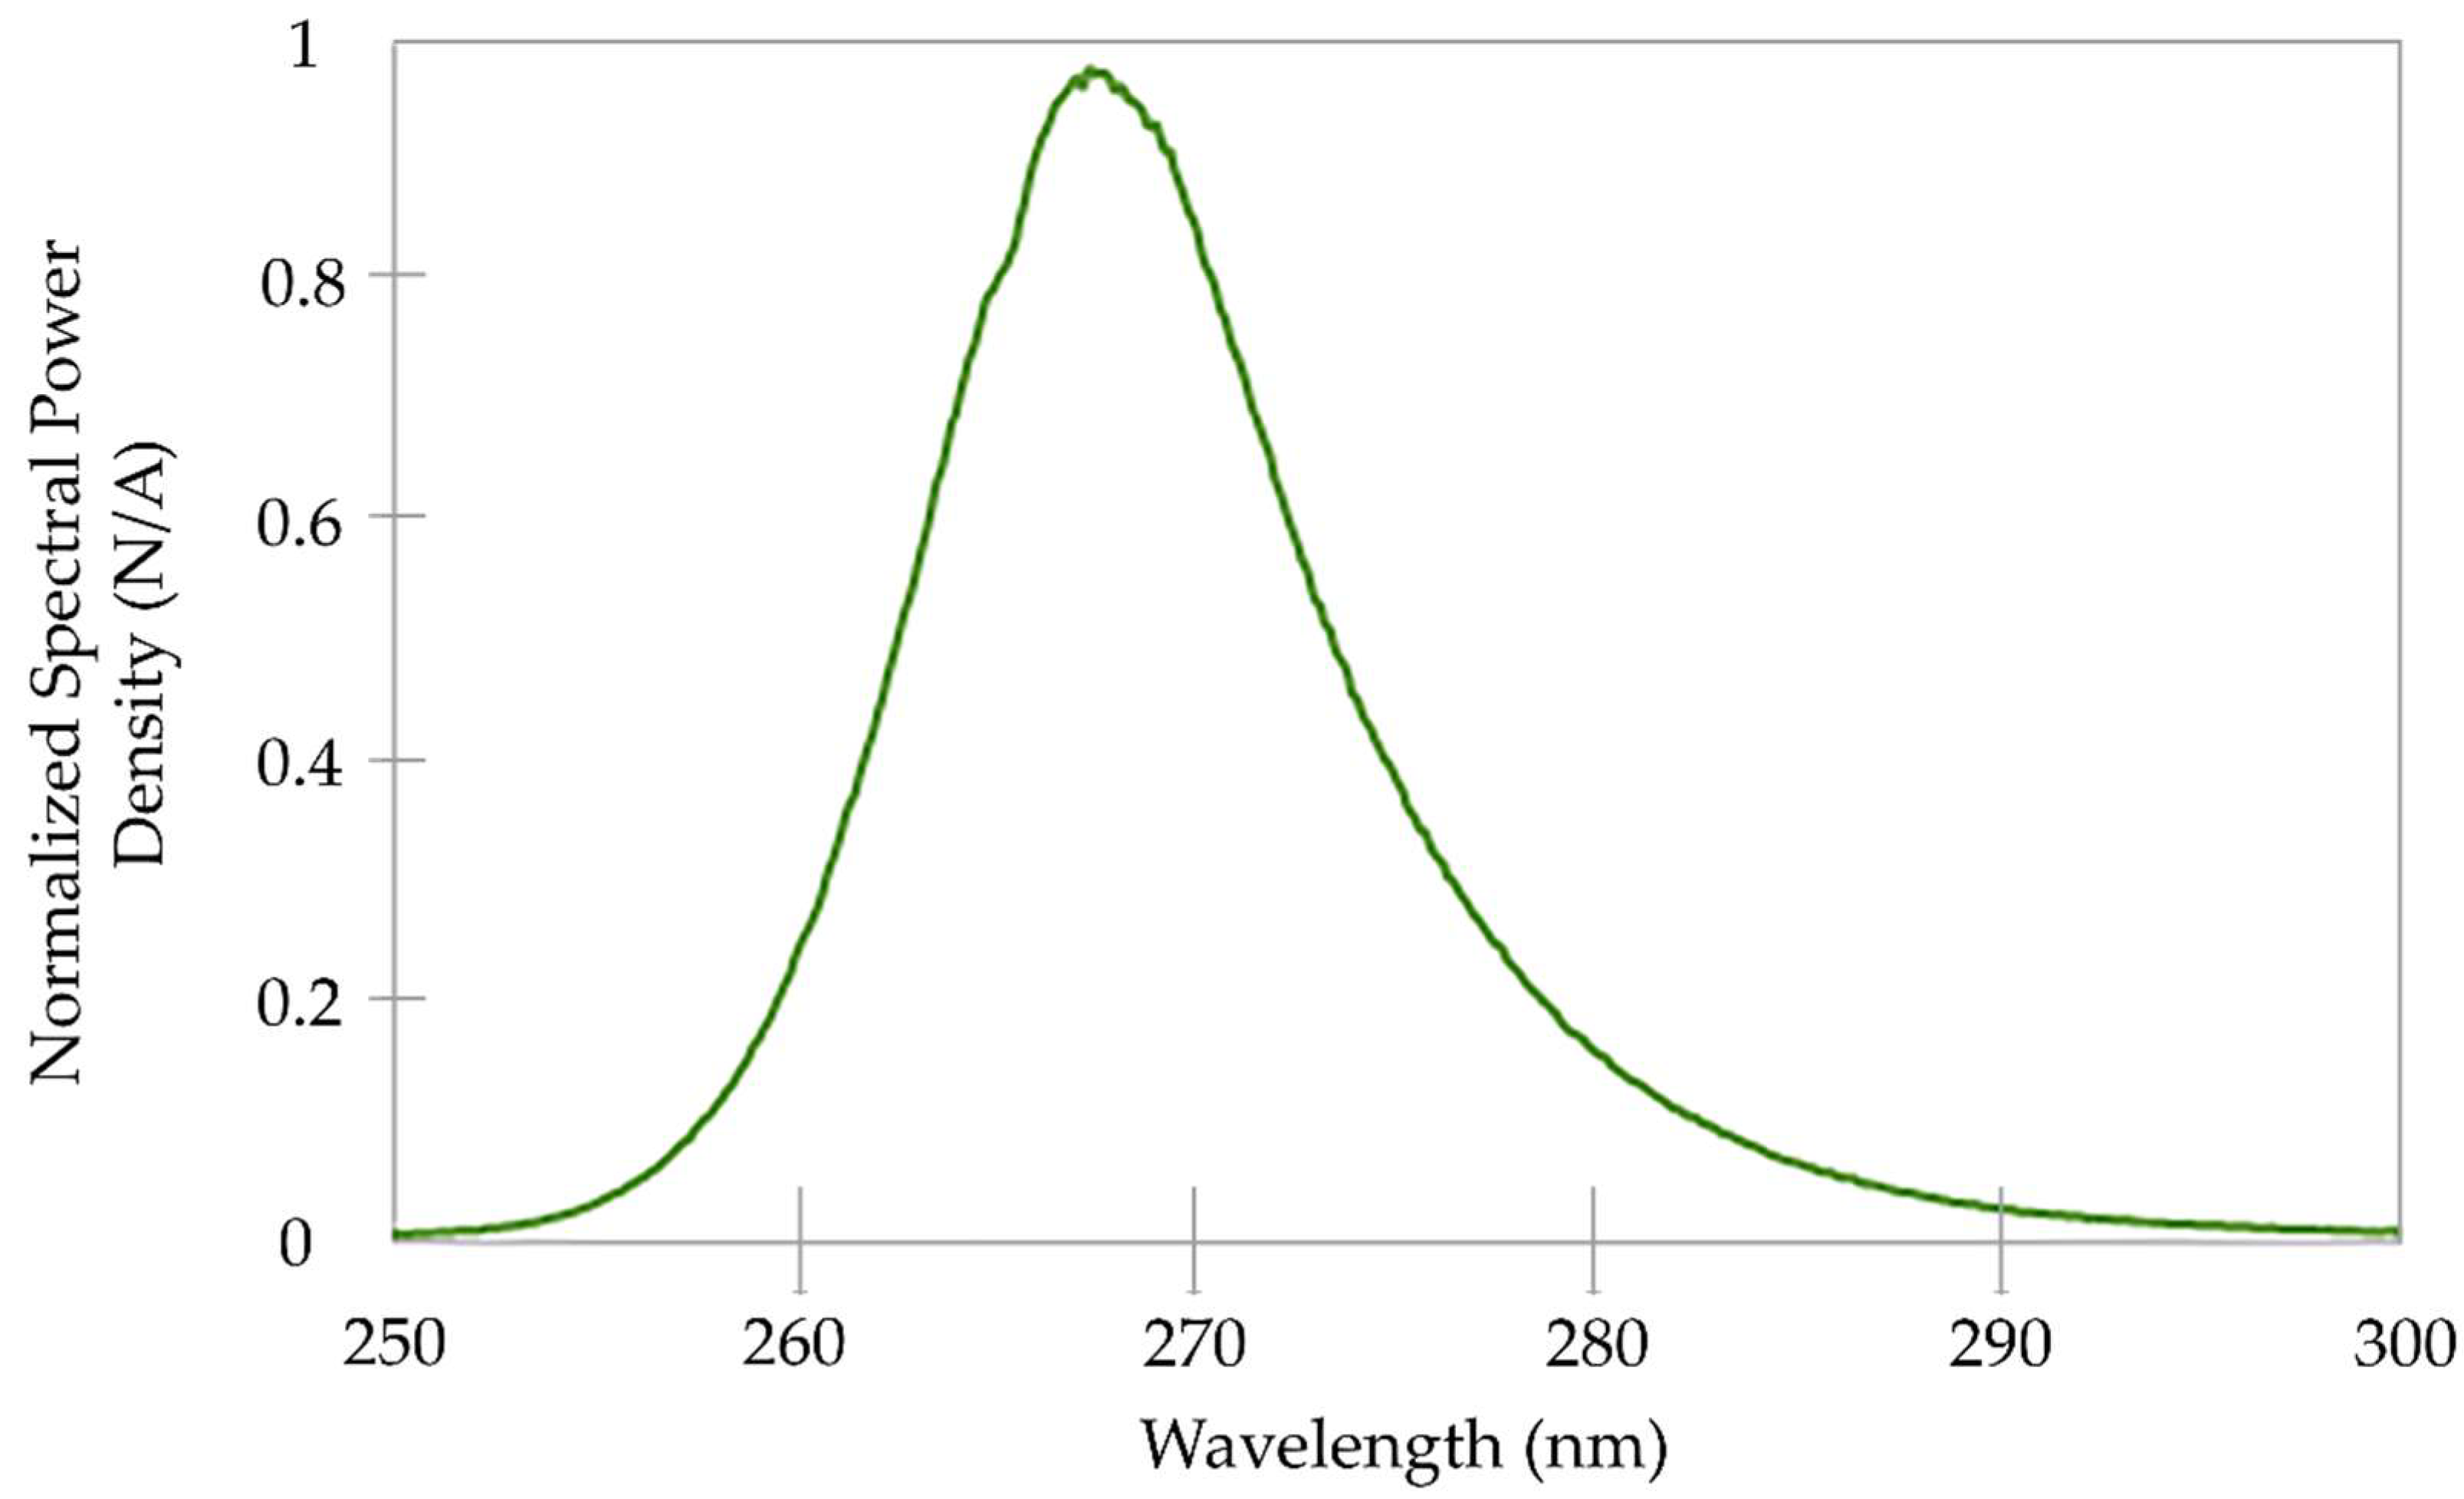
3.1. Spectral Analysis and Bacteriophage Phi6 Dose Response Curve
3.2. Modelling and Simulation
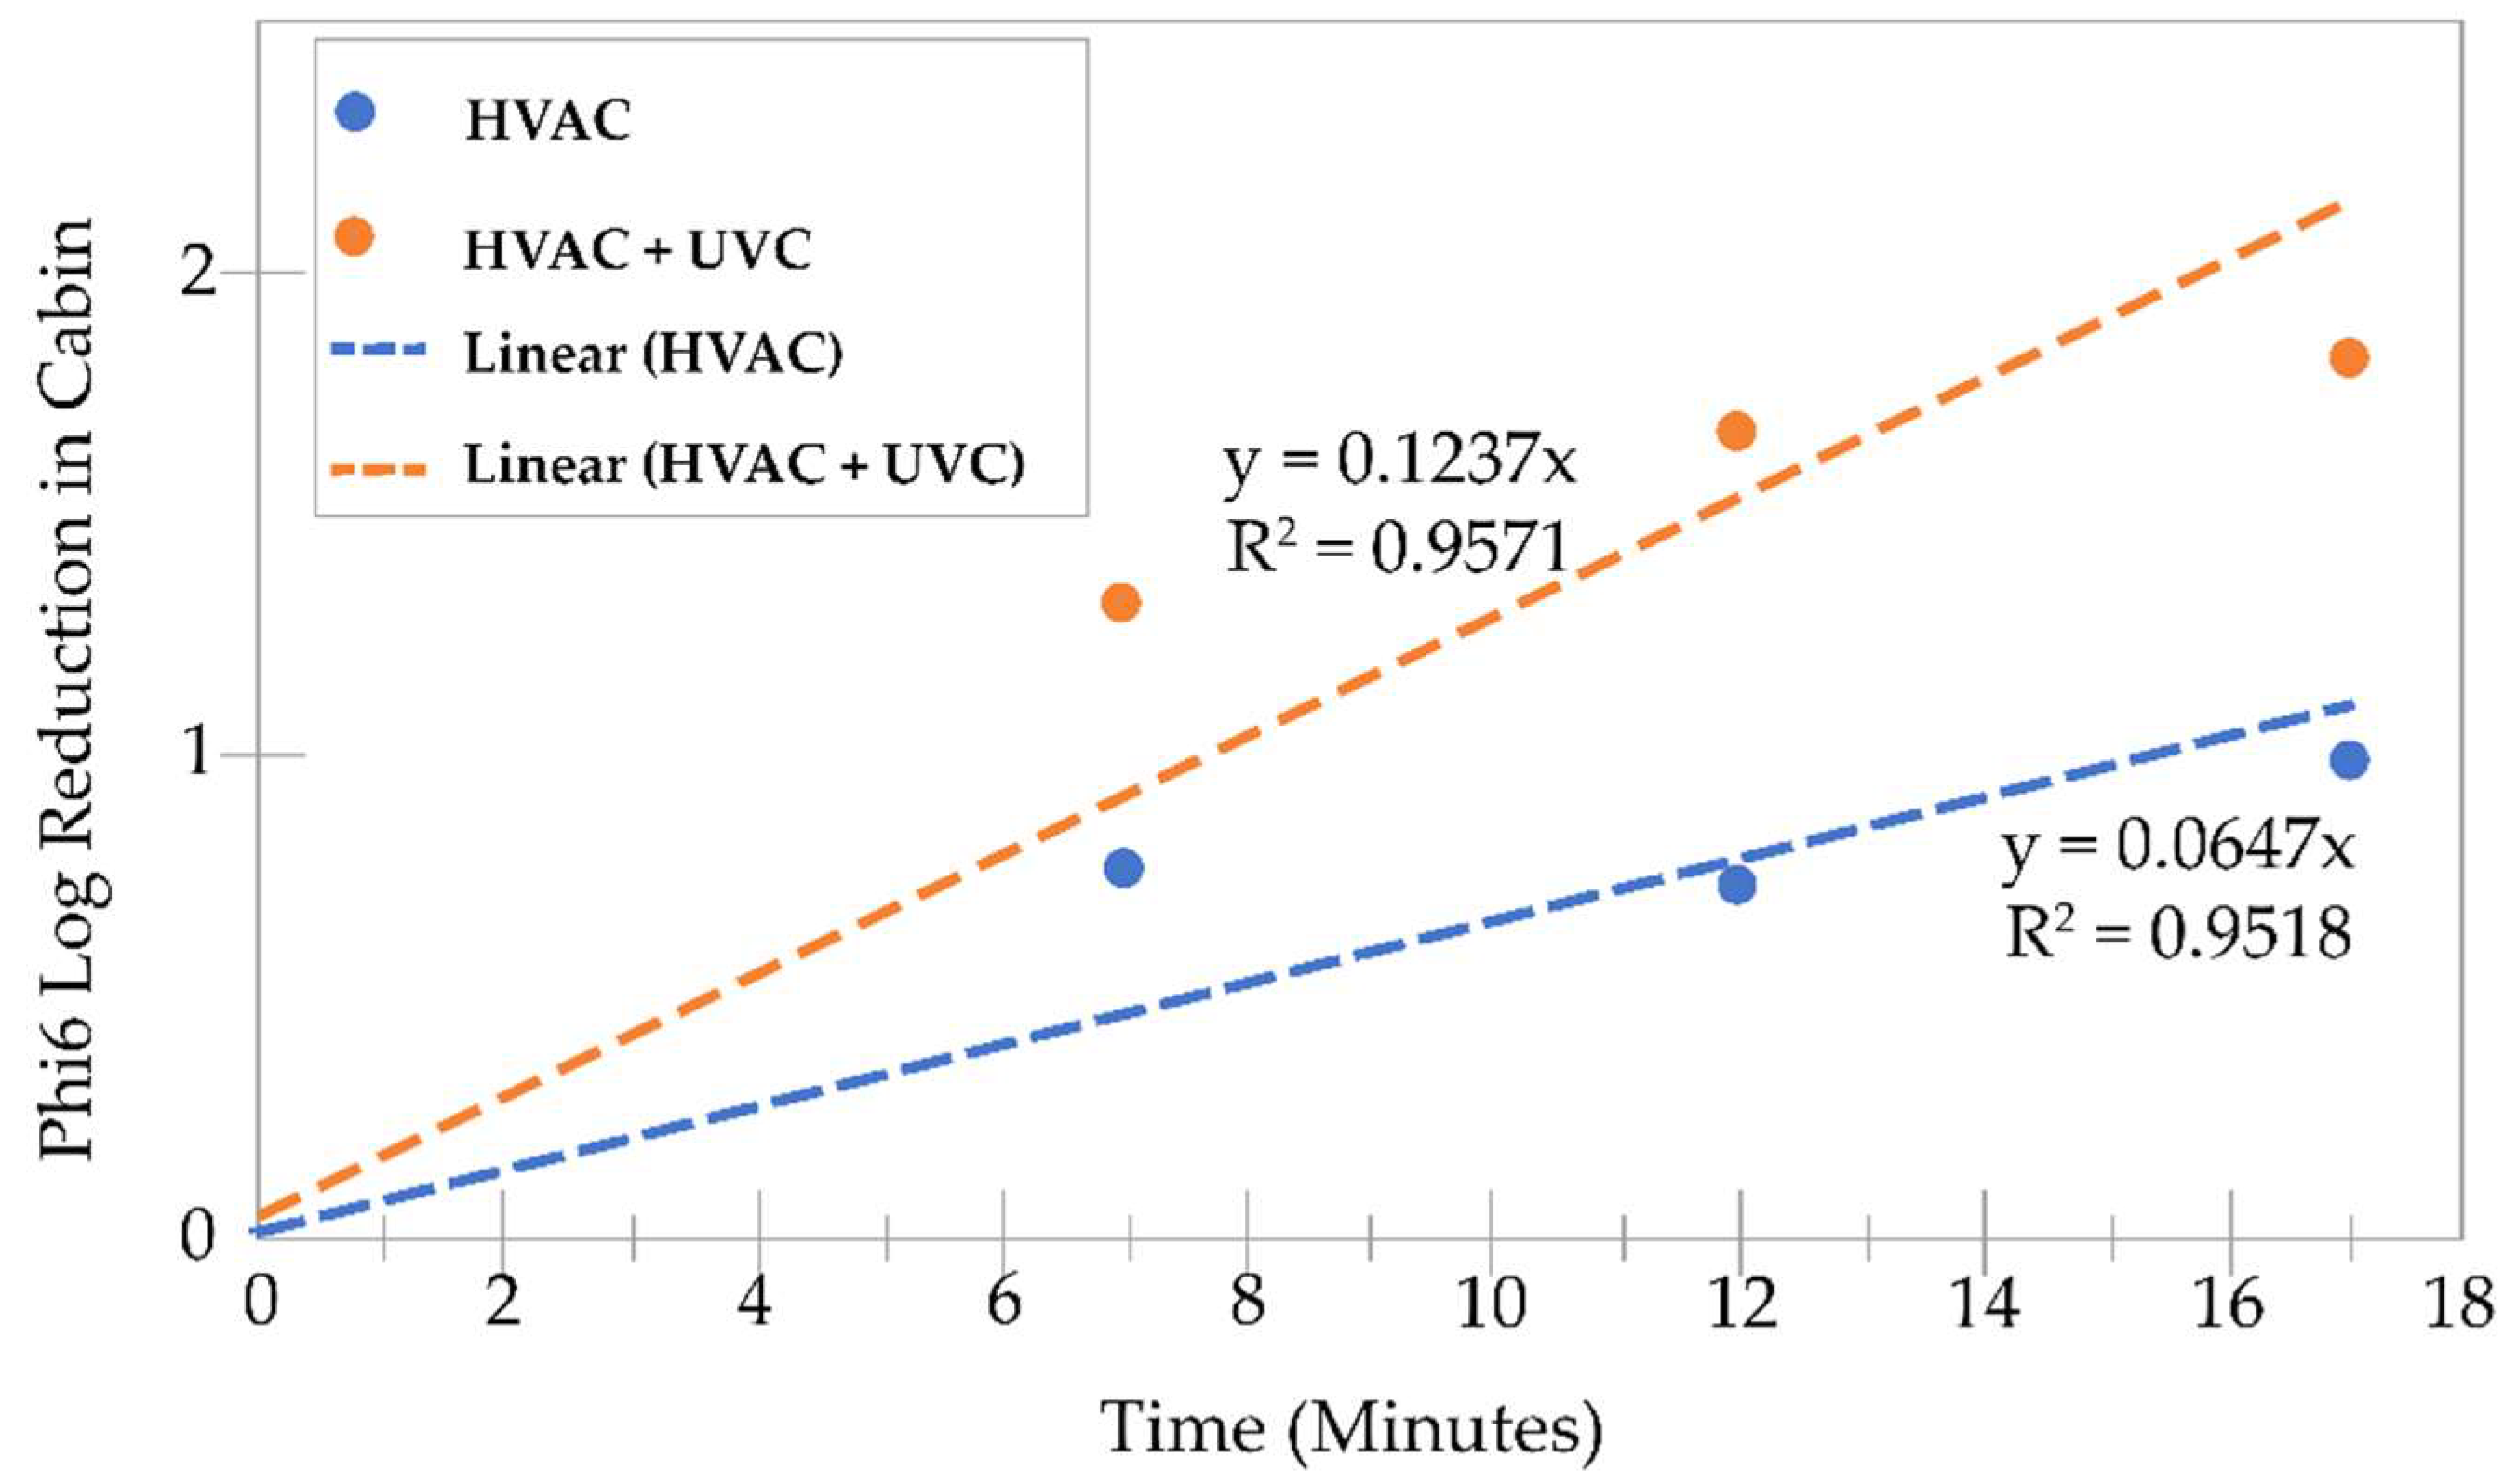
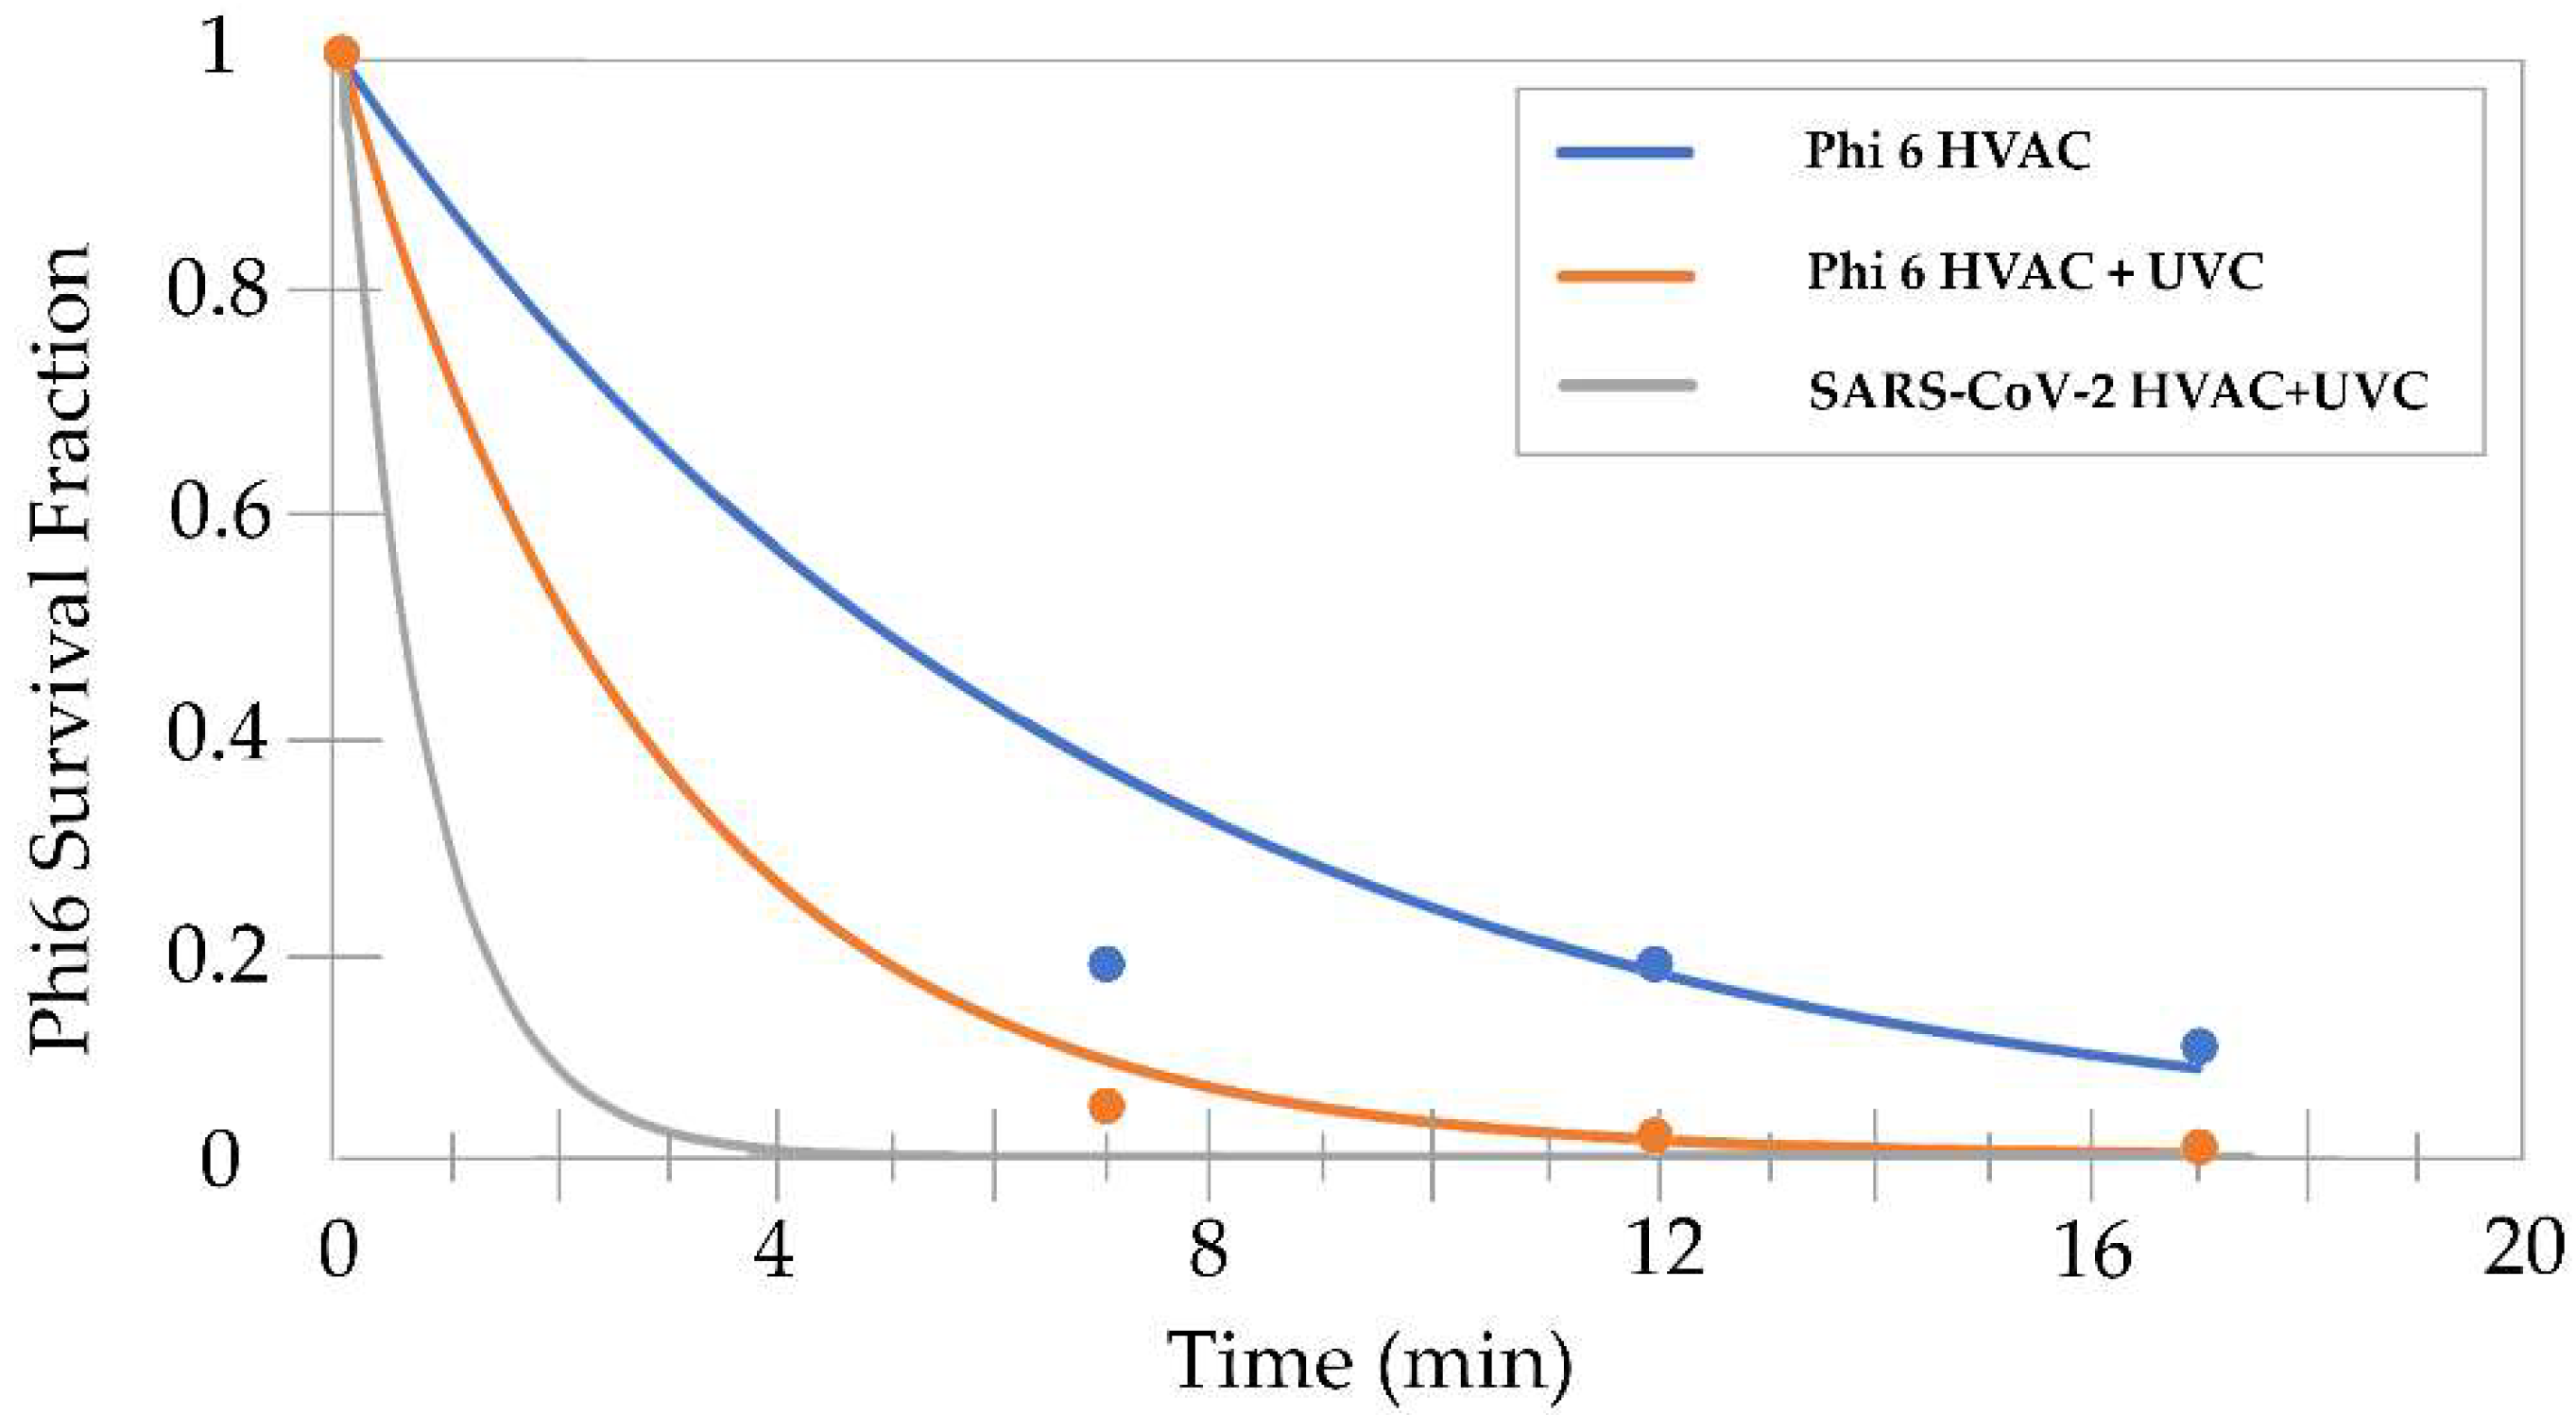
3.3. Bacteriophage Phi6 Air Disinfection
4. Discussion
5. Conclusions
Author Contributions
Funding
Informed Consent Statement
Data Availability Statement
Acknowledgments
Conflicts of Interest
References
- Bukłaha, A.; Wieczorek, A.; Kruszewska, E.; Majewski, P.; Iwaniuk, D.; Sacha, P.; Tryniszewska, E.; Wieczorek, P. Air Disinfection—From Medical Areas to Vehicle. Front. Public Health 2022, 10, 820816. Available online: https://www.frontiersin.org/article/10.3389/fpubh.2022.820816 (accessed on 28 June 2022). [CrossRef] [PubMed]
- Hurley, K.V.; Wharton, L.; Wheeler, M.J.; Skjøth, C.A.; Niles, C.; Hanson, M.C. Car cabin filters as sampling devices to study bioaerosols using eDNA and microbiological methods. Aerobiologia 2019, 35, 215–225. [Google Scholar] [CrossRef]
- Kim, K.-H.; Kabir, E.; Jahan, S.A. Airborne bioaerosols and their impact on human health. J. Env. Sci. 2018, 67, 23–35. [Google Scholar] [CrossRef] [PubMed]
- Núñez, A.; Amo de Paz, G.; Rastrojo, A.; García Ruiz, A.M.; Alcamí, A.; Gutiérrez-Bustillo, A.M.; Moreno Gómez, D.A. Monitoring of airborne biological particles in outdoor atmosphere. Part 1: Importance, variability and ratios. Int. Microbiol. 2016, 19, 1–13. [Google Scholar] [PubMed] [Green Version]
- Mathai, V.; Das, A.; Bailey, J.A.; Breuer, K. Airflows inside passenger cars and implications for airborne disease transmission. Sci. Adv. 2021, 7, eabe0166. [Google Scholar] [CrossRef]
- Jung, J.H.; Lee, J.E.; Lee, C.H.; Kim, S.S.; Lee, B.U. Treatment of fungal bioaerosols by a high-temperature, short-time process in a continuous-flow system. Appl. Environ. Microbiol. 2009, 75, 2742–2749. [Google Scholar] [CrossRef] [Green Version]
- Abubakar, I.; Tillmann, T.; Banerjee, A. Global, regional, and national age-sex specific all-cause and cause-specific mortality for 240 causes of death, 1990–2013: A systematic analysis for the Global Burden of Disease Study 2013. Lancet 2015, 385, 117–171. [Google Scholar]
- Drenik, G. The Air Inside Our Car Is More Dangerous Than The Outside Air: CabinAir Is Fixing This. Forbes. Available online: https://www.forbes.com/sites/garydrenik/2021/05/27/the-air-inside-our-car-is-more-dangerous-than-the-outside-air-cabinair-is-fixing-this/ (accessed on 20 July 2022).
- Gross, A. Think You’re In Your Car More? You’re Right. Americans Spend 70 Billion Hours Behind the Wheel. AAA Newsroom 2019. Available online: https://newsroom.aaa.com/2019/02/think-youre-in-your-car-more-youre-right-americans-spend-70-billion-hours-behind-the-wheel/ (accessed on 18 July 2022).
- Asahi Kasei America. Clean Surfaces and Safe In-Cabin Air—New Global Survey by Asahi Kasei Shows Growing Need for Hygienic Automotive Interiors. 2021. Available online: https://www.businesswire.com/news/home/20210504005096/en/Clean-Surfaces-and-Safe-In-Cabin-Air-%E2%80%93-New-Global-Survey-by-Asahi-Kasei-Shows-Growing-Need-for-Hygienic-Automotive-Interiors (accessed on 18 July 2022).
- Hattrup-Silberberg, M.; Hausler, S.; Heineke, K.; Laverty, N.; Möller, T.; Schwedhelm, D.; Wu, T. Five COVID-19 Aftershocks Reshaping Mobility’s Future|McKinsey. 2020. Available online: https://www.mckinsey.com/industries/automotive-and-assembly/our-insights/five-covid-19-aftershocks-reshaping-mobilitys-future (accessed on 29 June 2022).
- Motavalli, J. Drive Smart: 20 Ways to Save Gas. Forbes Wheels 2022. Available online: https://www.forbes.com/wheels/advice/gas-saving-tips/ (accessed on 1 August 2022).
- Fontaras, G.; Zacharof, N.-G.; Ciuffo, B. Fuel consumption and CO2 emissions from passenger cars in Europe—Laboratory versus real-world emissions. Prog. Energy Combust. Sci. 2017, 60, 97–131. [Google Scholar] [CrossRef]
- Nazarious, M.I.; Mathanlal, T.; Zorzano, M.-P.; Martin-Torres, J. Pressure Optimized PowEred Respirator (PROPER): A miniaturized wearable cleanroom and biosafety system for aerially transmitted viral infections such as COVID-19. HardwareX 2020, 8, e00144. [Google Scholar] [CrossRef]
- Mariita, R.M.; Randive, R.V.; Lottridge, M.M.; Davis, J.H.; Bryson, B.W. UVC Inactivation of Black Mold is Wavelength-Dependent, and its Growth in HVAC Systems is Preventable Using Periodic Dosing with commercially available UVC LEDs. bioRxiv 2022, 1–20. [Google Scholar] [CrossRef]
- Bono, N.; Ponti, F.; Punta, C.; Candiani, G. Effect of UV Irradiation and TiO(2)-Photocatalysis on Airborne Bacteria and Viruses: An Overview. Materials 2021, 14, 1075. [Google Scholar] [CrossRef] [PubMed]
- Chen, Y. Pros and Cons of UVC LEDs and Lamps for Disinfecting Applications. Available online: https://www.ledinside.com/news/2020/8/uvc_light_comparison (accessed on 3 August 2022).
- Randive, R.; Mariita, R.; Davis, J.; Schwegler, T.; Franchy, M.; Kamtekar, S.; Rother, H. Demonstrating UVC LEDs inside Automobile HVAC Chambers for Clean Cabin Air and Airborne Transmission Risk Reduction. Warrendale, PA: SAE Technical Paper 2022. Available online: https://www.sae.org/publications/technical-papers/content/2022-01-0197/ (accessed on 18 July 2022).
- Kim, S.C.; Kang, S.; Lee, H.; Kwak, D.-B.; Ou, Q.; Pei, C.; Pui, D.Y.H. Nanofiber Filter Performance Improvement: Nanofiber Layer Uniformity and Branched Nanofiber. Aerosol Air Qual. Res. 2020, 20, 80–88. [Google Scholar] [CrossRef] [Green Version]
- Van Doremalen, N.; Bushmaker, T.; Morris, D.H.; Holbrook, M.G.; Gamble, A.; Williamson, B.N.; Tamin, A.; Harcourt, J.L.; Thornburg, N.J.; Gerber, S.I.; et al. Aerosol and Surface Stability of SARS-CoV-2 as Compared with SARS-CoV-1. N. Engl. J. Med. 2020, 382, 1564–1567. [Google Scholar] [CrossRef] [PubMed]
- Ma Ben Gundy Patricia, M.; Gerba Charles, P.; Sobsey Mark, D.; Linden Karl, G.; Dudley Edward, G. UV Inactivation of SARS-CoV-2 across the UVC Spectrum: KrCl* Excimer, Mercury-Vapor, and Light-Emitting-Diode (LED) Sources. Appl. Environ. Microbiol. 2021, 87, e01532-21. [Google Scholar] [CrossRef]
- Bangiyev, R.; Chudaev, M.; Schaffner, D.W.; Goldman, E. Higher Concentrations of Bacterial Enveloped Virus Phi6 Can Protect the Virus from Environmental Decay. Appl. Env. Microbiol. 2021, 87, e0137121. [Google Scholar] [CrossRef]
- Kahn, K.; Mariita, R.M. Quantifying the Impact of Ultraviolet Subtype C in Reducing Airborne Pathogen Transmission and Improving Energy Efficiency in Healthy Buildings: A Kahn–Mariita Equivalent Ventilation Model. Front. Built Environ. 2021, 7, 725624. [Google Scholar] [CrossRef]
- Barros, J.; Ferraz, M.P.; Monteiro1, F.J. Bacteriophage Phi 6 as Surrogate and Human-Harmless Viruses to Study Anti-SARS-CoV-2 Approaches. Int. J. Mol. Sci. 2021, 2, 175–177. [Google Scholar]
- Fedorenko, A.; Grinberg, M.; Orevi, T.; Kashtan, N. Survival of the enveloped bacteriophage Phi6 (a surrogate for SARS-CoV-2) in evaporated saliva microdroplets deposited on glass surfaces. Sci. Rep. 2020, 10, 22419. [Google Scholar] [CrossRef]
- Ma, B.; Linden, Y.S.; Gundy, P.M.; Gerba, C.P.; Sobsey, M.D.; Linden, K.G. Inactivation of Coronaviruses and Phage Phi6 from Irradiation across UVC Wavelengths. Env. Sci. Technol. Lett. 2021, 8, 425–430. [Google Scholar] [CrossRef]
- Serrano-Aroca, Á. Antiviral Characterization of Advanced Materials: Use of Bacteriophage Phi 6 as Surrogate of Enveloped Viruses Such as SARS-CoV-2. Int. J. Mol. Sci. 2022, 23, 5335. [Google Scholar] [CrossRef]
- Mariita, R.M.; Peterson, J.W. Not all wavelengths are created equal: Disinfection of SARS-CoV-2 using UVC radiation is wavelength-dependent. Access Microbiol. 2021, 3, 000276. [Google Scholar] [CrossRef] [PubMed]
- Brickner, P.W.; Vincent, R.L.; First, M.; Nardell, E.; Murray, M.; Kaufman, W. The Application of Ultraviolet Germicidal Irradiation to Control Transmission of Airborne Disease: Bioterrorism Countermeasure. Public Health Rep. 2003, 118, 99–114. [Google Scholar] [CrossRef]
- Reed, N.G. The history of ultraviolet germicidal irradiation for air disinfection. Public Health Rep. 2010, 125, 15–27. [Google Scholar] [CrossRef] [PubMed]
- Lutz, E.A.; Sharma, S.; Casto, B.; Needham, G.; Buckley, T.J. Effectiveness of UV-C equipped vacuum at reducing culturable surface-bound microorganisms on carpets. Env. Sci. Technol. 2010, 44, 9451–9455. [Google Scholar] [CrossRef] [PubMed]
- Bernstein, J.A.; Bobbitt, R.C.; Levin, L.; Floyd, R.; Crandall, M.S.; Shalwitz, R.A.; Seth, A.; Glazman, M. Health Effects of Ultraviolet Irradiation in Asthmatic Children’s Homes. J. Asthma 2006, 43, 255–262. [Google Scholar] [CrossRef] [PubMed]
- Cone, M. Volatile Organic Compounds May Worsen Allergies and Asthma. Scientific American. Available online: https://www.scientificamerican.com/article/volatile-organic-compounds/ (accessed on 20 July 2022).
- Liu, C.-Y.; Tseng, C.-H.; Wang, H.-C.; Dai, C.-F.; Shih, Y.-H. The Study of an Ultraviolet Radiation Technique for Removal of the Indoor Air Volatile Organic Compounds and Bioaerosol. Int. J. Environ. Res. Public Health 2019, 16, 2557. [Google Scholar] [CrossRef] [PubMed] [Green Version]
- Lah, E.F.C.; Musa, R.N.A.R.; Ming, H.T. Effect of germicidal UV-C light (254 nm) on eggs and adult of house dustmites, Dermatophagoides pteronyssinus and Dermatophagoides farinae (Astigmata: Pyroglyhidae). Asian Pac. J. Trop. Biomed. 2012, 2, 679–683. [Google Scholar] [CrossRef]
- Bower, J. Chapter 5: Indoor Air Pollutants and Toxic Materials | Healthy Housing Reference Manual | NCEH. 2019. Available online: https://www.cdc.gov/nceh/publications/books/housing/cha05.htm (accessed on 3 August 2022).


| HVAC + UVC | |||||||
| Sampling Time (Min) | 1 | 2 | 3 | Average (PFU/Gel) | Phi6 LRV | Phi6 Reduction (%) | LRV Extrapolated to SARS-CoV-2 |
| 0 | 5.30 × 10² | 6.90 × 10² | 6.30 × 10² | 6.17 × 10² | - | - | - |
| 5 | 2.00 × 101 | 5.00 × 101 | 2.00 × 101 | 3.00 × 101 | 1.31 | 95.14 | 3.86 |
| 10 | 2.00 × 101 | 1.00 × 101 | 1.00 × 101 | 1.33 × 101 | 1.67 | 97.84 | 6.62 |
| 15 | 1.00 × 101 | 1.00 × 101 | 1.00 × 101 | 1.00 × 101 | 1.79 | 98.38 | 9.38 |
| HVAC ONLY | |||||||
| Sampling time (Min) | 1 | 2 | 3 | Average PFU/gel | Phi6 LRV | Phi6 reduction (%) | LRV extrapolated to SARS-CoV-2 |
| 0 | 6.80 × 10² | 5.60 × 10² | 6.30 × 10² | 6.23 × 10² | - | - | - |
| 5 | 8.00 × 101 | 1.20 × 10² | 1.30 × 10² | 1.10 × 10² | 0.75 | 82.34 | 0.75 |
| 10 | 8.00 × 101 | 1.00 × 10² | 7.00 × 101 | 8.33 × 101 | 0.87 | 86.63 | 0.87 |
| 15 | 5.00 × 101 | 7.00 × 101 | 7.00 × 101 | 6.33 × 101 | 0.99 | 89.84 | 0.99 |
Publisher’s Note: MDPI stays neutral with regard to jurisdictional claims in published maps and institutional affiliations. |
© 2022 by the authors. Licensee MDPI, Basel, Switzerland. This article is an open access article distributed under the terms and conditions of the Creative Commons Attribution (CC BY) license (https://creativecommons.org/licenses/by/4.0/).
Share and Cite
Mariita, R.M.; Davis, J.H.; Lottridge, M.M.; Randive, R.V.; Witting, H.; Yu, J. Towards a Healthy Car: UVC LEDs in an Automobile’s HVAC Demonstrates Effective Disinfection of Cabin Air. Atmosphere 2022, 13, 1926. https://doi.org/10.3390/atmos13111926
Mariita RM, Davis JH, Lottridge MM, Randive RV, Witting H, Yu J. Towards a Healthy Car: UVC LEDs in an Automobile’s HVAC Demonstrates Effective Disinfection of Cabin Air. Atmosphere. 2022; 13(11):1926. https://doi.org/10.3390/atmos13111926
Chicago/Turabian StyleMariita, Richard M., James H. Davis, Michelle M. Lottridge, Rajul V. Randive, Hauke Witting, and Johannes Yu. 2022. "Towards a Healthy Car: UVC LEDs in an Automobile’s HVAC Demonstrates Effective Disinfection of Cabin Air" Atmosphere 13, no. 11: 1926. https://doi.org/10.3390/atmos13111926