Article

Methodology for Virtual Prediction of Vehicle-Related Particle Emissions and Their Influence on Ambient PM10 in an Urban Environment

1
Department of Automotive Engineering, Technical University Ilmenau, Ehrenbergstraße 15, 98693 Ilmenau, Germany
2
IAV GmbH, Rockwellstraße 3, 38518 Gifhorn, Germany
3
Audi AG, Auto-Union-Str. 1, 85057 Ingolstadt, Germany
*
Author to whom correspondence should be addressed.
Atmosphere 2022, 13(11), 1924; https://doi.org/10.3390/atmos13111924
Submission received: 1 November 2022 / Revised: 15 November 2022 / Accepted: 16 November 2022 / Published: 18 November 2022
(This article belongs to the Special Issue Non-exhaust particle emissions from vehicles)

Abstract

:
As a result of rising environmental awareness, vehicle-related emissions such as particulate matter are subject to increasing criticism. The air pollution in urban areas is especially linked to health risks. The connection between vehicle-related particle emissions and ambient air quality is highly complex. Therefore, a methodology is presented to evaluate the influence of different vehicle-related sources such as exhaust particles, brake wear and tire and road wear particles (TRWP) on ambient particulate matter (PM). In a first step, particle measurements were conducted based on field trials with an instrumented vehicle to determine the main influence parameters for each emission source. Afterwards, a simplified approach for a qualitative prediction of vehicle-related particle emissions is derived. In a next step, a virtual inner-city scenario is set up. This includes a vehicle simulation environment for predicting the local emission hot spots as well as a computational fluid dynamics model (CFD) to account for particle dispersion in the environment. This methodology allows for the investigation of emissions pathways from the point of generation up to the point of their emission potential.

1. Introduction

As a result of negative health effects linked to particulate matter exposure, limits were introduced for ambient PM10 and PM2.5 concentrations in Europe. On the vehicle side, exhaust PN and PM emissions were limited as well. However, it is expected that non-exhaust sources already exceed exhaust emissions. Brake wear and TRWP are not subject to legal regulation [1]. The relationship between ambient PM concentrations and vehicle emissions is very complex and influenced by numerous parameters. In order to develop effective protective measures, a holistic approach is necessary. The main sources have to be identified and put into relation. Furthermore, the particle dispersion in the environment has to be taken into account. The exposure concentration level of each particle sources has to be determined individually. Within this work, a novel simulation approach is presented to predict vehicle-related emissions as well as particle dispersion in the environment.
In a first step, a literature review was conducted regarding methods for vehicle-related particle emission prediction. Domingues et al. used an artificial neuronal network (ANN) as well as symbolic regression in order to predict exhaust emissions such as O2, NOx and particle number [2]. Ghiasi et al. applied an ANN for the prediction of parameters for an exhaust after-treatment system [3]. Ricciardi presented a semi-empirical brake wear model. Furthermore, brake wear emissions were predicted using an ANN [4]. Riva et al. used an FEA approach for the prediction of macroscopic brake wear and air-borne particle emissions. Therefore, the influence of the local contact pressure and sliding speed was included into the model. For this purpose, wear and emission maps from pin-on-disc tests were implemented [5]. Sasa et al. presented an approach for the prediction of PM10 and PM2.5 brake wear emissions using a neural network. Based on an inertia brake dynamometer, the neural network was trained and validated. In addition, different ANN algorithms were compared [6]. Nguyen et al. developed a mathematical tire wear model. The model includes the influence of directional effects and wear history. Additionally, local contact conditions such as temperature, sliding speed and contact pressure were implemented. The model was validated by experiment (Grosch wheel) [7]. Braghin et al. presented a methodology for the prediction of global tire wear and local wear distribution. A mathematical tire model was combined with an experimentally determined local friction and wear law [8]. Ivanov modelled the influence of longitudinal and lateral slip on tire wear. The model was applied for the investigation of wear loss [9]. Feißel et al. presented an approach for the estimation of air-borne TRWP emissions as a function of lateral and longitudinal acceleration as well as vehicle velocity [10]. As it can be seen from this review, several approaches for modeling and prediction of exhaust, brake and tire emissions already exist. However, few of them include air-borne particles.
In order to improve the evaluation of the toxic potential of air-borne particles, it is necessary to create a holistic methodology that can be used to determine the exposure concentration in the ambient air. Therefore, a CFD model can provide insights into the particle dispersion process. Likewise, a literature review has been conducted for this topic. Wingstedt and Reif analyzed the particle transport and deposition for different wind conditions in an urban environment. The study investigated a vehicle as a moving emission source. It was found that the wind velocity has a decisive influence on the horizontal and vertical particle dispersion [11]. Nikolova et al. investigated the dispersion of ultrafine particles (UFP) based on an inner-city scenario in Antwerp [12]. Gidhagen et al. analyzed the particle concentration within a street canyon in order to determine the relevance of aerosol dynamic processes such as coagulation and deposition [13]. Amorim et al. investigated the influence of urban trees on the dispersion of toxicity in the air in Aveiro and Lisbon. Therefore, the respective mean wind values were applied as boundary conditions. Due to the aerodynamic blocking effect of the trees, a reduced exchange rate of the polluted air was observed [14]. Wang and Zhang analyzed the air quality near streets in Los Angeles. Since an increase in local turbulence due to the traffic was expected, simplified block-shaped modelled vehicles were included in the model [15]. Pospisil and Jicha investigated the relationship between the wind speed and the associated particle resuspension. The study showed that above a certain threshold of the wind speed, deposited particles are resuspended, which leads to an increased particle concentration within street canyons [16]. Camelli et al. analyzed the influence of tall buildings (chimney effect) on the vertical particle dispersion in Manhattan. Furthermore, the influence of the street layout on the lateral dispersion was investigated [17].
As shown in the review, various individual approaches exist for the prediction of emissions as a function of vehicle dynamic parameters. The same applies for the prediction of particle dispersion within street canyons. However, a holistic approach connecting both models is still missing.
Within this work, a novel methodology for the tracking of particle pathways from the point of formation up to the dispersion in the environment is presented. It contains a first approach for the generation of an emission database, the derivation of emission predictors and finally the transfer into a flow model to account for particle-air-interaction. At first, an emission database for all relevant particle sources was created based on field trails. In a next step, a methodology for emission prediction was derived and implemented into a vehicle simulation environment. To analyze the influence on the ambient air quality, a corresponding CFD model was applied. Consequently, particle dilution and trans-location within an urban environment was calculated. Finally, a framework for the estimation of the influence of vehicle-related particle emissions on ambient air pollution was described. The methodology can be considered a helpful tool for the development of protection measures in terms of air quality improvement.

2. Materials and Methods

2.1. Framework

Figure 1 shows the framework of a simulation environment for virtual emission prediction and tracking. In a first step, an emission database is created based on test vehicle trials. Therefore, exhaust, brake wear and TRWP emissions are measured with online measurement systems. Additionally, vehicle dynamic parameters (i.e., vehicle speed, lateral and longitudinal acceleration, etc.) are recorded. Based on the database, a methodology for a qualitative prediction of particle emissions is derived. In a next step, a vehicle simulation model of a downtown scenario based on the example of the city of Erfurt (Germany) is set up. Within the framework of this method, the measured vehicle-related emissions and the resulting ambient air concentrations are related to each other. Furthermore, an emission prediction model is proposed as an interface of the two sub-models to enable further analyses on emission hotspots. Finally, the predicted particle mass flow is transferred into a corresponding CFD model. Based on the model, the ambient air concentration as a function of wind properties (magnitude, direction) and particle size is estimated. The objective of this methodology is to determine the correlation between vehicle-related emissions and ambient air quality.

2.2. Measurement Set-Up

The measurements were performed based on a test vehicle under real road conditions. Consequently, brake wear, TRWP and exhaust emissions were measured for an identical vehicle under realistic conditions. The vehicle, shown in Figure 2, has a diesel engine with a displacement of 1968 cm3 and a maximum power of 75 kW at 3500 rpm. The total mass of the vehicle is 2150 kg. It is equipped with summer tires (255/45 R18) and ECE brake pads. Exhaust emissions are sampled by a probe placed inside the exhaust pipe. An exhaust flow meter (EFM) is used to determine the exhaust gas volume flow. Brake wear and TRWP emissions are sampled by two separate constant volume sampling systems (CVS). Subject of the investigation is the front right wheel, to which both systems are mounted. The measurement set up was already presented by Feißel et al. [18].
In order to collect the maximum amount of particles, the brake system is fully enclosed and separated from ambient air. An electric fan generates an air flow through the system to evacuate the particles and transport them into a measurement tunnel. On the inlet side a filter stage (class H13) is integrated to avoid background influences. The measurement setup for TRWP emissions consists of a sampling funnel, a flexible hose and a further measurement tunnel. In combination with the CVS system for brake emissions, the disturbance of the TRWP measurement by brake particles is avoided. The TRWP-funnel is mounted to the wheel carrier. This design allows for obtaining a measurement perpendicular to the tread surface even during cornering. However, sampling losses due to inlet efficiency and particle deposition as a function of vehicle speed and particle size have to be taken into account [18].
Since it is the aim of this study to investigate the correlation between vehicle-related emissions and ambient air quality, it was focused on PM10 concentration. Therefore, a TSI DustTrak II 8530 aerosol monitor was used with an additional PM10 pre-separator. The system is applicable for the measurement of the particle mass concentration (mg/m3) in a size range from 100 nm to 10 μm. Furthermore, the particle number concentration (#/cm3) was measured. For these purposes, a condensation particle counter (TSI Model 3776) with a measuring range from 2.5 nm to 3 μm was applied. Both systems provide online measurements with a sampling rate of 1 Hz. Since exhaust emissions mainly occur in a size range below 100 nm, exhaust-PM was calculated based on the number concentration assuming a mean particle diameter of 100 nm and a density of 1 g/cm3.
P C ˙ = M E P C V s ˙
In order to compare different particle sources, the sample volume flow must be taken into account. While the brake wear and TRWP particles are sampled with an approximately constant volume flow (120 m3/h), the exhaust gas volume flow varies depending on the load condition and the engine rpm. The respective volume flows are recorded with volume flow sensors. By multiplying particle concentration P C and sample flow V s ˙ , the corresponding normalized emission factor P C ˙ ([mg/s] and [#/s]) can be determined. Furthermore, a measurement efficiency factor M E is introduced accounting for particle losses due to inlet and deposition losses.

2.3. Simulation Environment

To investigate the relationship between vehicle-related emissions and ambient PM10, an inner-city scenario based on the example of the city of Erfurt was chosen. The focus is on a specific street (Bergstraße), where an environmental measuring station for air pollutants monitoring is located. This allows the comparison of measured and predicted ambient air concentrations.
As shown in Figure 3a, a vehicle simulation model of the district was set up with the use of the commercial vehicle simulation software IPG CarMaker. The orientation of the streets including all traffic lights, traffic signs, lanes, lane markings and parking bays was modeled. A vehicle model is selected to emulate the measurement vehicle, which was used for the generation of the emission data base. Based on the model, a virtual test cycle within the city environment is conducted. By implementing emission predictors, the local emission contribution can be estimated.
Furthermore, the particle dispersion in the environment is investigated by setting up a corresponding CFD model of the city scenario. Therefore, the commercial CFD code ANSYS Fluent was used. For simplification, only the buildings were represented. Details such as cars and trees are neglected. Based on the model shown in Figure 3b, the local wind vectors within the street canyons can be calculated as a function of the global wind speed and global wind direction. The model contains the area within a circumference of 1 km of the environmental measurement station (Bergstraße) and has a height of 200 m.
The model covers a total air volume of 2*108 m3. A hybrid-meshing algorithm was applied resulting in a total cell count of 1.5*106. The boundary region of the mesh was covered with 10 prism shaped inflation layers with a fist layer thickness of 1*10−3 m to ensure a y+ value of y+ = 1. The 8 edge surfaces of the model volume can be individually defined as velocity inlets to account for different wind directions. In case the surface is not assigned as velocity inlet it is defined as a pressure outlet. For the flow calculation, the k-w-SST turbulence model is applied. A turbulent intensity of 5% and a turbulent viscosity ratio of 10 is assumed for both inlets and outlets.
To predict the particle dispersion in the environment, a method for the implementation of the previously predicted particle emissions was developed. For this purpose, an input file is required. This file contains the normalized emission factor P C ˙ , the injection coordinate position (x,y,z), the particle diameter d p and the vehicle velocity vector v v . The particles are injected after the flow filed calculation reached its convergence criterion (residuals < 1*10−3). The particle tracking is based on the discrete phase model (DPM). Therefore, spherical model particles (parcels) in a size range between 1 and 10 μm are tracked within the flow field while a particle density of ρ p = 1 g/cm3 is assumed (aerodynamic diameter). To account for turbulent dispersion, stochastic particle tracking was enabled (discrete random walk model). The number of random walk repetitions per particle stream was set to 10. In total, 1.9*106 parcels were tracked to ensure statistical validation of the trajectories. Consequently, the local particle concentration within the ambient air volume was estimated.

3. Results

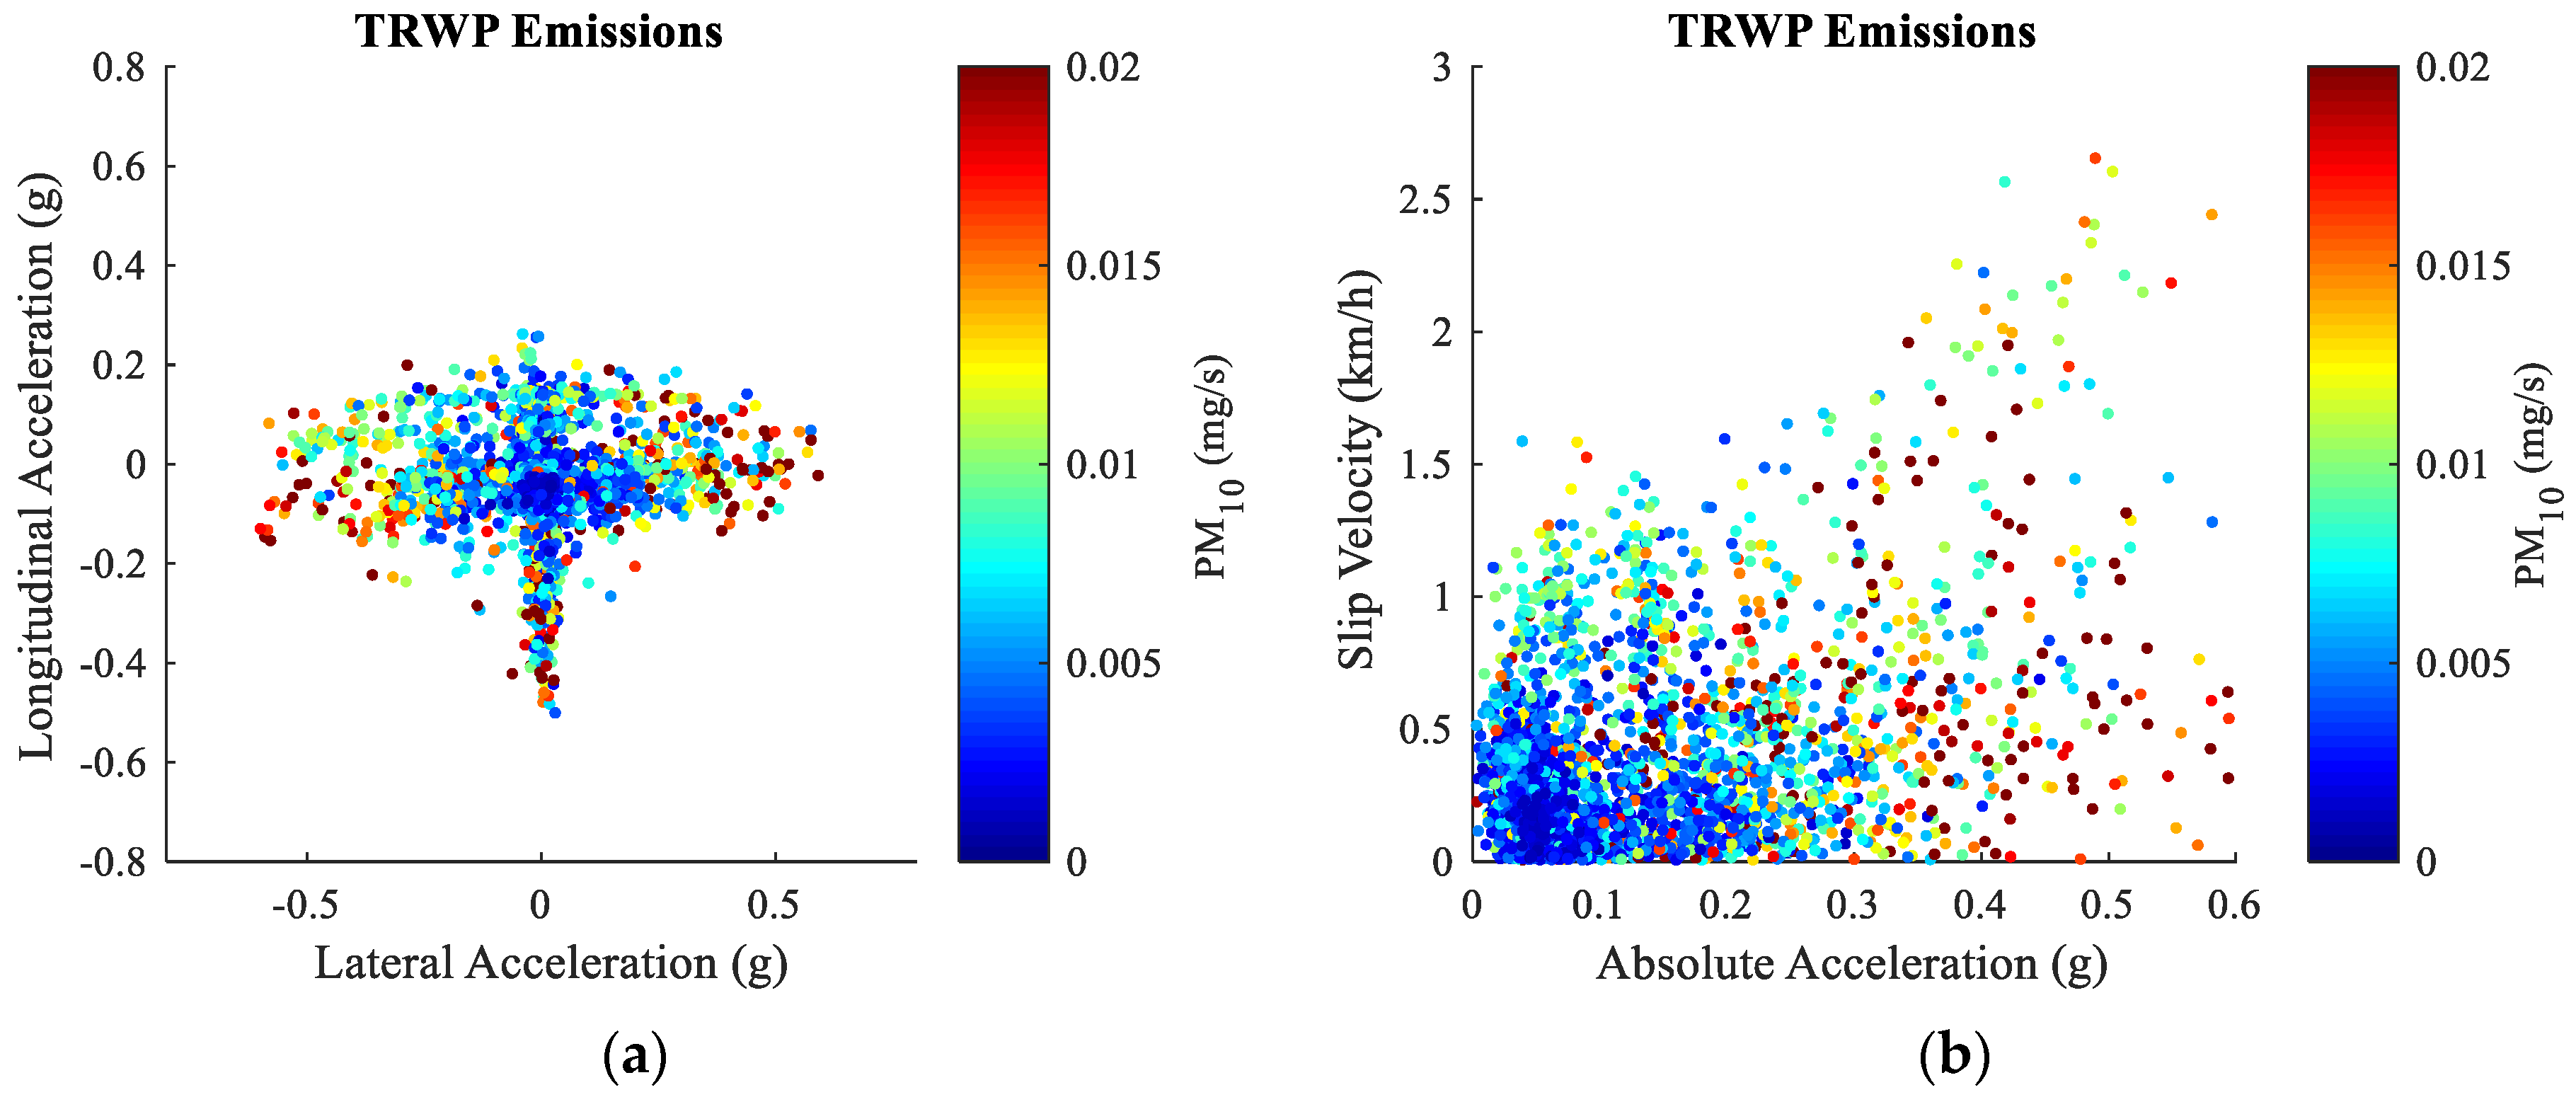
3.1. Influence Parameters of Particle Generation

For the investigation of the correlation between vehicle dynamics and particle emissions, field trails were conducted. For all vehicle-related particle sources, the normalized emission factor was determined as a function of vehicle dynamic parameters. The study is based on a real driving emissions-compliant (RDE) driving cycle (EU 2018/1832). The cycle is composed of city segments (<60 km/h), rural segments (60–90 km/h) and motorway segments (90–145 km/h) with a distance share of 33% each and a total length of 87 km. The average cycle speed is 55 km/h.
Internal combustion engines convert chemical energy into mechanical energy and heat. Under ideal conditions, only carbon dioxide, water and nitrogen are generated. Under real conditions, the interruption of the reaction chains results in undesirable by-products. These include carbon monoxide, unburned and partially burned hydrocarbons and oxides of nitrogen as well as solids in the form of particle emissions [19].
In Figure 4 the correlation between the driving conditions and exhaust emissions is shown. As expected, the highest emission values are observed during acceleration events in the upper engine torque and rpm-range. The vehicle complies with the Euro6 emissions standard and is equipped with a diesel particle filter. The measurement results confirm the effectiveness of the exhaust after-treatment system. Overall, the measured emission values are at a comparatively low level.
Friction brakes are based on the conversion of kinetic energy into thermal energy. They are most commonly used to control and regulate the vehicle speed of vehicles with conventional internal combustion engines. One way to reduce brake-related emissions effectively is to use vehicles with regenerative braking systems (electric drive or hybrid drive). Under specific operating conditions, the regenerative electric drive can replace the function of the friction brake [20]. The brake system consists of the brake disk and the brake linings. During the braking event, the boundary layer undergoes continuous buildup and degradation due to wear mechanisms. The third layer is composed of the abrasion products of the brake disk and the lining material. The friction force transmission is based on primary and secondary patches. Primary patches consist of hard, mechanically resistant components. Wear products accumulate on these primary patches during the friction process and form secondary patches. The resulting abrasion particles are emitted into the environment when the brake is finally released [1].
In Figure 5 the correlations between deceleration, vehicle speed, brake pressure and brake wear emissions are shown. The measurement was carried out based on an RDE-compliant driving cycle. As expected, brake wear emissions occur during deceleration events. The fact that virtually no emissions emerge in a low deceleration range (0–0.06 g) can be attributed to the effect of driving resistance forces (i.e., air resistance, roll resistance, transmission resistance). Furthermore, a dependency from the brake pressure can be derived. However, the vehicle speed shows the highest influence. Braking maneuvers with low brake pressures at high-speed result in accordingly high particle emission values.
The transmission of longitudinal and lateral forces between the tires and the road leads to wear generation. TRWP particles are generated mainly by shear forces between the tire and the road, which leads to mechanical abrasion and the formation of rather coarse particles (>1 μm). In addition to the air-borne fraction, a large part of the abrasion mass (>90%) is emitted in the form of micro plastic particles with sizes up to 5 mm. In the case of high stress, increased tire temperatures can lead to tribo-oxidative processes. Consequently, even ultrafine particles (<100 nm) can occur [1].
Figure 6 shows the relationship between the driving dynamics and TRWP emissions. Opposed to the measurement of exhaust and brake emissions, the driving tests were carried out on a proving ground to reduce background influences from other traffic participants. Previously conducted test drives based on the RDE-compliant test cycle did not show a clear correlation between the driving dynamics and particle emissions due to the open sampling system configuration and the high number of disturbance variables in public road traffic. Therefore, the maneuver sequence of the RDE cycle was reproduced on the test track. However, due to the layout of the test site, the motorway segments could not be reproduced to full extend resulting in a shorter cycle distance of 37 km. TRWP emissions mainly occur during accelerated driving maneuvers as a result of the force transmission. The largest contribution of tire emissions is observed during cornering. Furthermore, the relative velocity between the tire and the road (slip velocity) is of importance.
P C ˙ = f d p , ρ p , P b , t , e
Based on the measurement data, various methods for the prediction of brake wear, exhaust and TRWP were evaluated. These include artificial neural networks, statistical approximation equations and semi-physical models. It was found that even though it is a strong simplification, vehicle emissions can be estimated as a function of power transmission. The frictional power, transmitted at the vehicle brakes and tires, is primarily converted into thermal energy. A further power component is responsible for the wear generation. Therefore, a proportionality between power transmission P b , t , e and the particle emission factor P C ˙ is assumed, which can be describe by a transfer function f d p , ρ p , taking into account particle properties such as diameter d p and density ρ p .
The frictional power transmitted during braking P b is calculated based on the brake pressure p b applied on the contact area A b between brake disc and pads, the coefficient of friction μ and the disc rotation speed v b . As shown in Figure 5, the brake pressure and the vehicle speed are two main influence parameters for brake particle emissions. The frictional power transmitted at the tire-road interface P t is determined based on the wheel forces acting in longitudinal and lateral direction as well as the relative velocity v s between the tire and the road. The main component of force transmission is attributed to the acceleration   a x y of the vehicle mass m v in longitudinal and lateral direction. At higher vehicle speed v v air resistance may also play a role. Therefore, the density of air ρ L , the drag coefficient c d and the vehicle cross sectional area A v have to be taken into account. As shown in Figure 6, lateral and longitudinal acceleration are the main influence variables of TRWP formation. Similarly, exhaust emissions can be estimated as a function of engine power P e taking into account engine torque M e and engine rotational speed n e (Figure 4).
Table 1 outlines the respective emission factors for PM10 and PN as a function of power transmission while assuming a direct proportionality. Therefore, the frictional power transmitted at the front right brake and tire was calculated and related to the respective PM10 and PN concentration. Sampling losses are neglected in a first step, since the measurement efficiency factor ( M E ) cannot be validly determined. However, it has to be considered that especially the TRWP-measurement is subject to major sampling losses due to the open sampling system configuration [18].
According to Table 1 the brake system shows the highest power related emission factors. TRWP emissions occur as the second biggest particle source while exhaust emissions do not play a significant role for a test vehicle complying with the Euro6 standard. Even though the methodology is based on a strong simplification, it can be applied to a qualitative estimation of the respective particle contribution. Furthermore, it provides a framework, which can be optimized in the future.

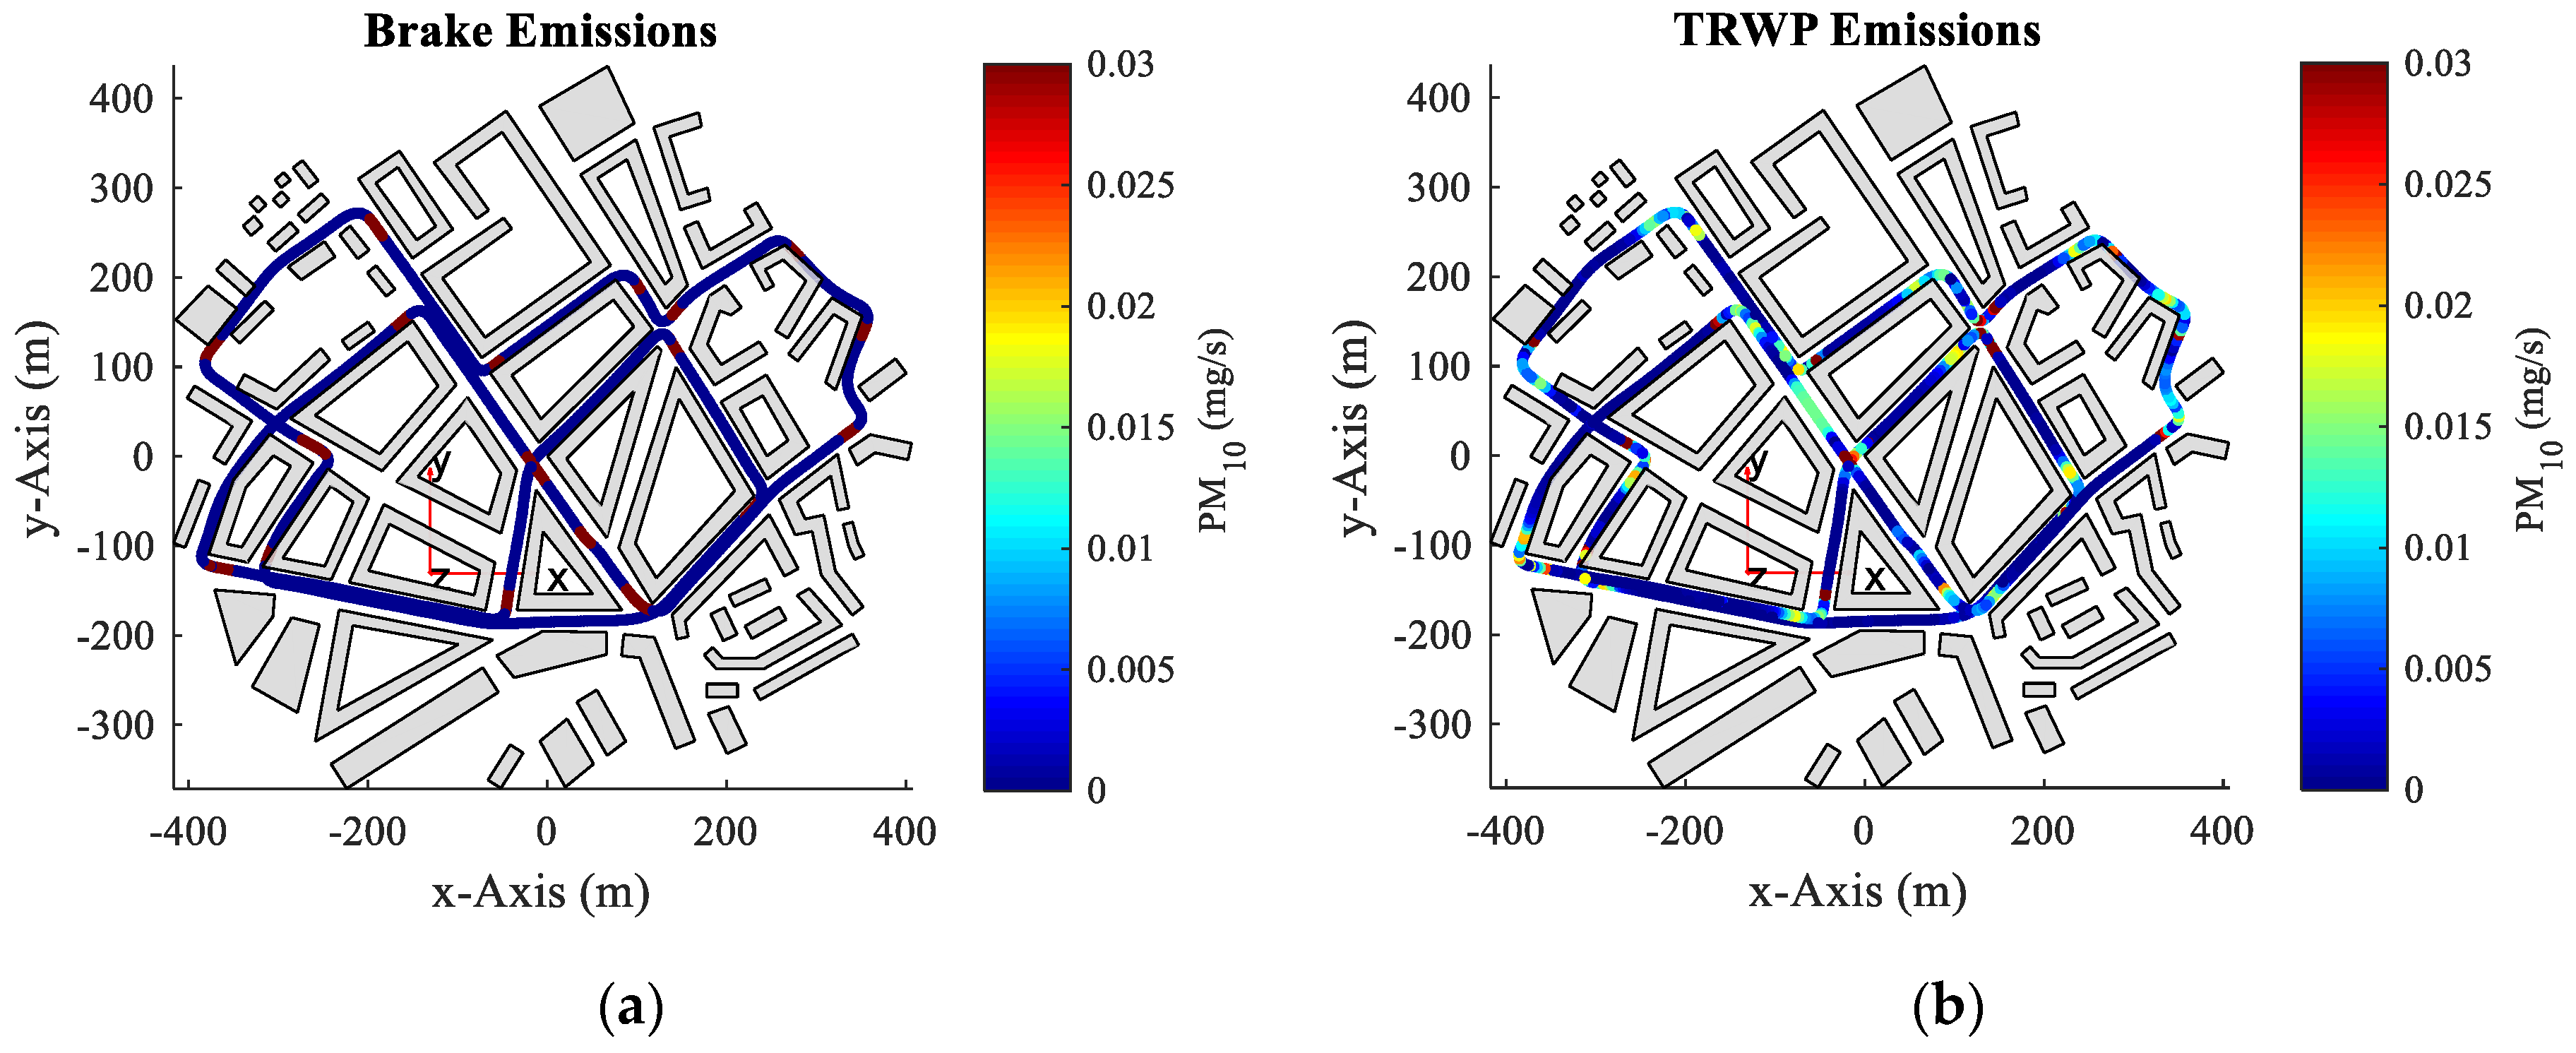
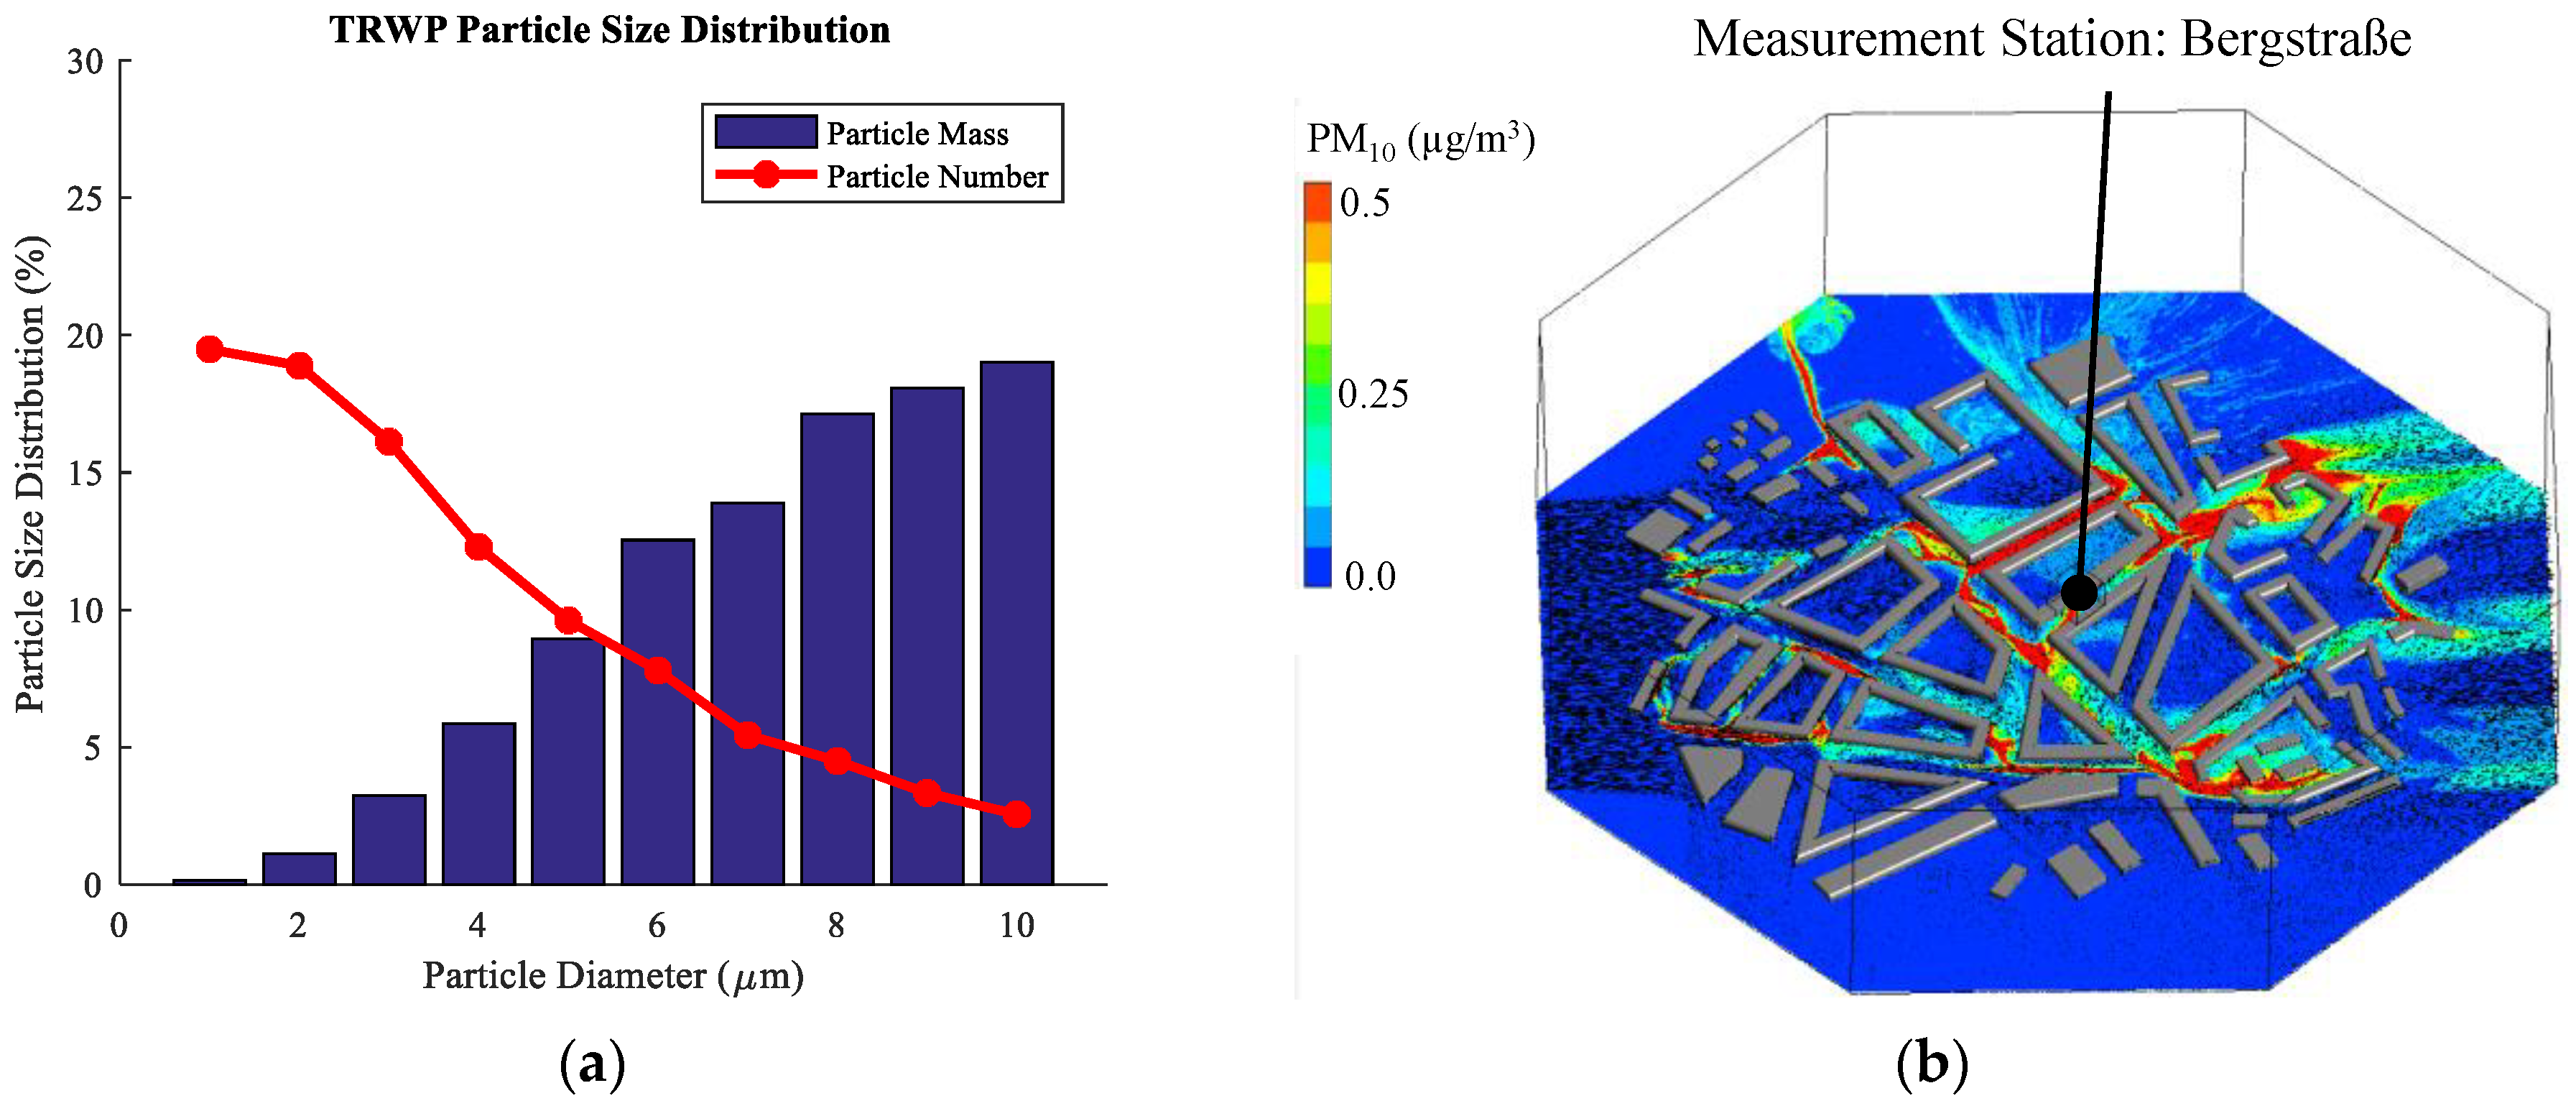
3.2. Prediction of Particle Generation

In a next step, the power-related emission factors were implemented into the vehicle simulation environment shown in Figure 3. The required vehicle parameters (i.e., velocity, longitudinal and lateral acceleration, slip velocity, brake pressure, engine torque and engine speed) were used as input variables. In the next step, a test cycle of 8 km length was conducted within the virtual test environment to investigate the local PM10 contribution of each particle source.
Figure 7 demonstrates the predicted brake wear, TRWP and exhaust particle emissions (PM10) along the vehicle trajectory. As expected, brake wear emission hot spots occur mainly in front of corners and traffic light intersections, where a reduction in speed or braking to a standstill is required. TRWP emissions are found in the braking area before and the acceleration area after corners and intersections. However, maximum values are observed during cornering. Exhaust emissions are found in areas where acceleration is required to reach the desired speed.
Based on the estimation, brake wear appears to be the biggest source of vehicle-related particle emissions for a vehicle with conventional combustion engine. TRWP is responsible for the second highest contribution while exhaust particles do not have a significant influence for vehicles with modern exhaust-after-treatment systems. It also has to be taken into account that potential sampling losses for brake and TRWP emissions were not considered. Taking into account the speed profile of the virtual test cycle, it would be possible to calculate emission factors per distance ([#/km] and [mg/km]). However, it was avoided, since the measurement of brake and TRWP emissions is subject to considerable uncertainties (e.g., in relation to the measurement efficiency). Therefore, it would be risky to compare emission factors with current legal regulation values for exhaust particles.

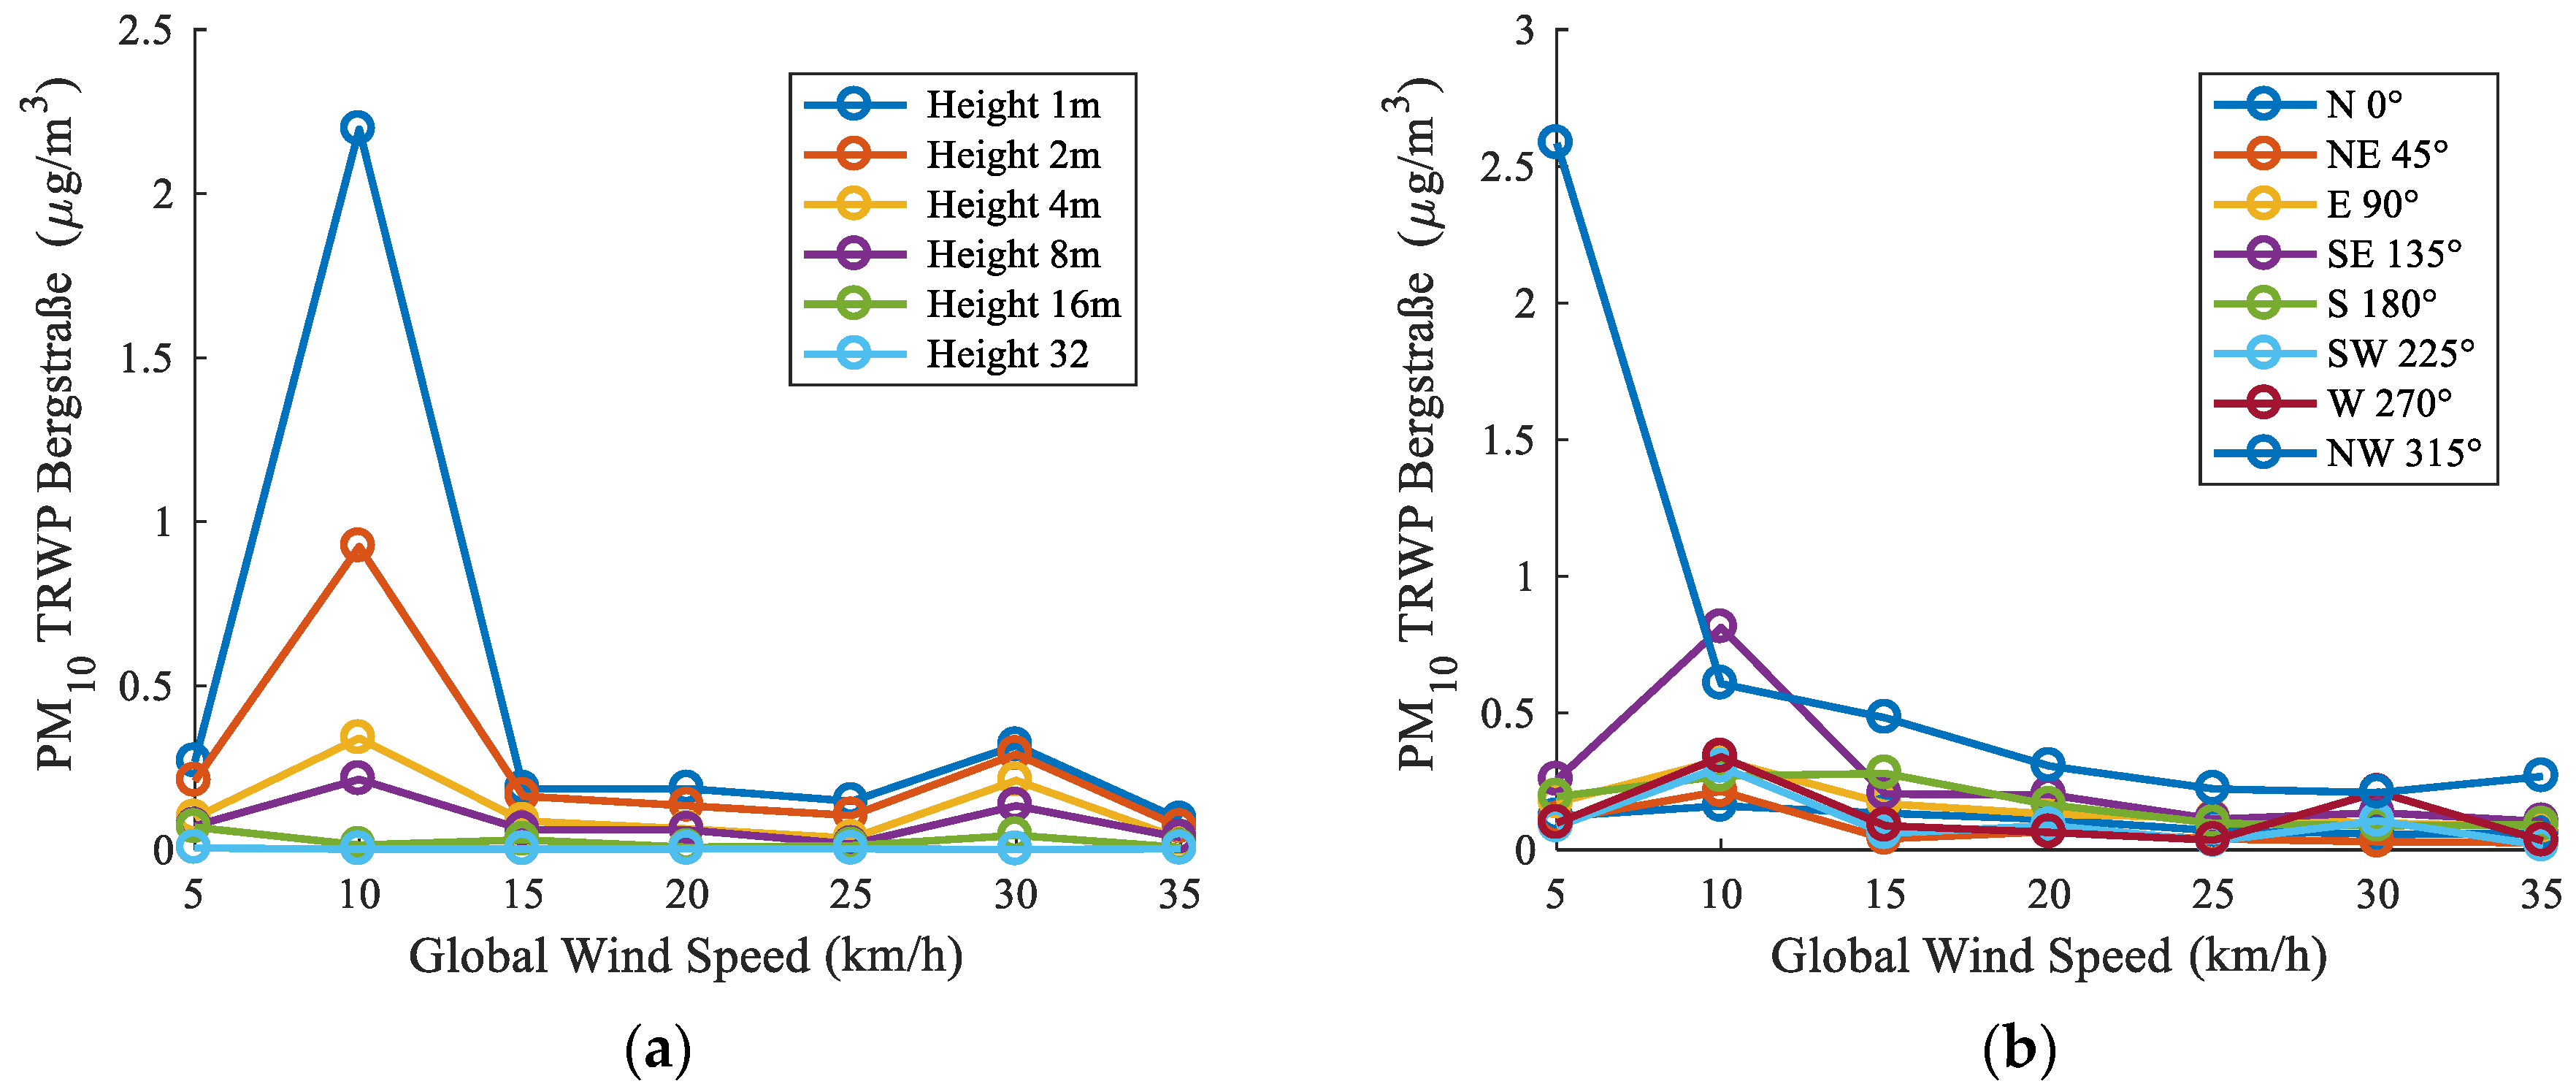
3.3. Prediction of Particle Dispersion in the Environment

In the next step, the correlation between particle emissions and the ambient wind condition is investigated. Furthermore, local PM10 concentrations are determined. Therefore, the previously predicted emissions are transferred into the flow model described in Figure 3. Furthermore, the particle size distribution (PSD) must be taken into account. The size distribution describes the fraction of particles, which lie within a specific size range relative to total number or mass of the dust sample. Depending on the particle diameter and density, particle trajectories deviate from the streamlines of the flow. Fine particles ( d p < 1 μm) tend to follow the air flow and remain in the ambient air for a long period of time. Rather coarse particles ( d p > 1 μm) deviate from the streamlines resulting in a higher deposition rate and a shorter residence time. To consider the different aerodynamic properties, the previously predicted particle streams are divided into several sub-streams according to the particle size distribution.
Figure 8a shows the number and mass related particle size distribution of a TRWP sample, which was collected on a filter during the test drive. The sample was analyzed based on an optical microscope (magnification: 400×). The number of particles and the related particle sizes were determined using an image recognition software. According to the mass related size distribution, the previously predicted TRWP particle stream was subdivided into ten discrete particle streams (size range: 1 μm–10 μm). The particle streams were injected into the flow field to determine the local PM10 concentration as a result of the TRWP contribution.
The flow model is used to estimate the particle concentration within a specific area and for defined wind conditions. The subject of further investigation is a control volume (40 × 40 × 40 m3) placed in the street “Bergstraße”, where the environmental measurement station is located. Furthermore, the effect of the global wind speed and the global wind direction was investigated. The dispersion of the particles within the urban area was analyzed for different wind speeds ranging from 5 to 35 km/h and eight global wind directions. A wind speed of 5 km/h corresponds to the minimum, 10 km/h to the average and 35 km/h to the maximum wind speed measured during the year 2022. Wind from the west is the most common global wind direction in the city of Erfurt (25% in 2022). Furthermore, six differed measurement heights were investigated ranging from 1 to 32 m above the road surface. The height of the aerosol inlet of an environmental measurement station according to 2008/50/EG should be 1–4 m above the ground level.
Figure 9 shows the ambient PM10 concentration (Bergstraße) as a result of the predicted TRWP particle mass flow. The variations in the global wind speed, the wind direction, and the measurement height lead to major PM10 concentration differences. As expected, the highest concentration values occur near the road surface. The concentration level decreases with increasing distance. A higher global wind speed, however, does not necessarily lead to lower PM10 values due to increased dilution. This is attributed to the fact that the local wind speed in the street canyon can deviate from the global wind. Furthermore, depending on the wind direction, particles can be trans-located from high emission areas and influence the local PM10 concentration elsewhere. The results show that the correlation between vehicle-related particle emissions and the PM10 concentration in the ambient air is highly complex and highly influenced by wind conditions and the location of the measurement inlet.

4. Discussion

The aim of this work was to analyze the correlation between vehicle-related particle emissions and the ambient PM10 concentration. In a first step, particle measurement was conducted based on a test vehicle to create an emission data base. Therefore, time resolved particle measurements (exhaust, brake wear, TRWP) as well as vehicle parameters were recorded. In a next step, the major influence parameters were identified. The major influence parameters of particle formation were found to be engine rotational speed and torque for exhaust particle emissions, vehicle speed and brake pressure for brake particle emissions and lateral and longitudinal acceleration as well as slip velocity for TRWP emissions. Consequently, a methodology for the prediction of particle emissions based on power transmission was derived. Even though this methodology has a simplified character and does not cover all relevant influence factors, it can be applied to estimate and compare vehicle-related emission sources qualitatively. The models need to be refined in the future based on further parameters (i.e., tire temperature, disc temperature, material properties, etc.).
In the next step, a virtual city model was set up within a vehicle simulation environment. The emission predictors for all three vehicle-related particle sources were implemented to investigate the local particle contribution of each source. It was found that for modern vehicles (Euro6) with conventional combustion engines, brake wear and TRWP emissions are especially relevant. Emission hotspots mainly occur at traffic intersections, as a result of the adaptation of vehicle speed and driving direction.
To investigate the influence on the ambient PM10 concentration, a corresponding CFD-based flow model of the city environment was set up as well. Furthermore, a methodology was developed to transfer the predicted emissions into the flow model while considering the aerodynamic properties of the particles (particle size distribution). Finally, the resulting ambient PM10 concentration was estimated as a function of the global wind speed, wind direction and the inlet height. It was found that the highest ambient concentrations occur close to the road surface and show a decreasing tendency with increasing distance. Higher wind speed is linked to lower particle concentration levels as a result of increased dilution. However, the effect of particle trans-location and change of local wind speed within the street canyons as a function of wind direction were also observed. In general, it showed that ambient PM10 concentration levels vary greatly due to wind conditions even when the same particle contribution is applied.
The presented method allows the estimation of the generation of particle emissions from different sources depending on the vehicle type and driving behavior. Furthermore, the influence on the ambient air quality can be estimated taking into account global and local wind conditions as well as particle transport within the street canyons (heat map). Therefore, the presented approach represents an excellent tool for the assessment of the effectiveness of protective measures (i.e., speed limits, bans for certain vehicle types, etc.).

Author Contributions

Conceptualization, T.F., F.B., M.K. and J.R.; methodology, T.F., F.B. and J.R.; software, T.F. and J.R.; investigation, T.F., F.B. and J.R.; data curation, T.F. and J.R.; writing—original draft preparation, T.F. and J.R.; writing—review and editing, T.F., F.B., M.K. and V.I.; visualization, T.F.; supervision, K.A., V.I., D.H. and S.G.; project administration, K.A. and V.I. All authors have read and agreed to the published version of the manuscript.

Funding

This work relates to the scientific activities of the research group MOSYS (2019 FGR 0089) funded by the state of Thuringia (Germany) and the European Social Fund ESF. We acknowledge support for the publication costs by the Open Access Publication Fund of the Technical University Ilmenau.

Institutional Review Board Statement

Not applicable.

Informed Consent Statement

Not applicable.

Conflicts of Interest

The authors declare no conflict of interest.

Abbreviations

List of abbreviations
AbbreviationName
PNParticle Number
PMParticulate Matter
TRWPTire and Road Wear Particles
CFDComputational Fluid Dynamics
ANNArtificial Neural Network
UFPUltra Fine Particles
EFMExhaust Flow Meter
CVSConstant Volume Sampling
DPMDiscrete Phase Model
PSDParticle Size Distribution
RDEReal Driving Emissions
List of nomenclature
SymbolQuantityUnit
P C ˙ Particle flow (number/mass)(#/s) (mg/s)
V ˙ Sample volume flow(m3/s)
M E Measurement efficiency (%)
d p Particle diameter(m)
ρ p Particle density(kg/m3)
P b Frictional power (brake)(W)
P t Frictional power (tire)(W)
P e Engine power(W)
p b Brake pressure(bar)
A b Brake pad contact area(m2)
μ b Coefficient of friction (disc/pad)(-)
v b Brake disc velocity(m/s)
m v Vehicle mass(kg)
a x y Longitudinal/lateral acceleration(g)
ρ a Density (air)(kg/m3)
c d Drag coefficient (-)
A v Cross sectional area (vehicle)(m2)
v v Vehicle speed(m/s)
v s Slip velocity(m/s)
n e Engine rpm(1/s)
M e Engine torque(Nm)

References

  1. Grigoratos, T.; Martini, G. Non-Exhaust Traffic Related Emissions Literature Review; Publications Office of the European Union: Luxembourg, 2014. [Google Scholar] [CrossRef]
  2. Domínguez-Sáez, A.; Rattá, G.; Barriosa, C. Prediction of exhaust emission in transient conditions of a diesel engine fueled with animal fat using Artificial Neural Network and Symbolic Regression. Energy 2018, 149, 675–683. [Google Scholar] [CrossRef]
  3. Ghiasi, R.; Ettefagh, M.; Sadeghi, V. Prediction of a diesel engine exhaust gases physical properties with artificial neural network. In Proceedings of the 2014 IEEE International Symposium on Innovations in Intelligent Systems and Applications (INISTA), Alberobello, Italy, 23–25 June 2014; pp. 304–308. [Google Scholar] [CrossRef]
  4. Ricciardi, V. Advanced Control Functions of Automotive Brake Systems for the Optimization of Braking Performance, Brake Wear and Particle Emissions. Ph.D. Thesis, Technische Universität Ilmenau, Ilmenau, Germany, 2020. [Google Scholar] [CrossRef]
  5. Riva, G.; Valota, G.; Perricone, G.; Wahlström, J. An FEA approach to simulate disc brake wear and airborne particle emissions. Tribol. Int. 2019, 138, 90–98. [Google Scholar] [CrossRef]
  6. Saša, V.; Glisovic, J.; Stojanovic, N.; Grujic, I. Application of neural networks in predictions of brake wear particulate matter emission. J. Automob. Eng. 2022, 236, 1579–1594. [Google Scholar] [CrossRef]
  7. Nguyen, V.H.; Zheng, D.; Schmerwitz, F.; Wriggers, P. An advanced abrasion model for tire wear. Wear 2018, 396–397, 75–85. [Google Scholar] [CrossRef]
  8. Braghin, F.; Cheli, F.; Melzi, S.; Resta, F. Tyre Wear Model: Validation and Sensitivity Analysis. Meccanica 2006, 41, 143–156. [Google Scholar] [CrossRef]
  9. Ivanov, R. Tire Wear Modeling. Transp. Probl. 2016, 11, 111–120. [Google Scholar] [CrossRef] [Green Version]
  10. Feißel, T.; Hesse, D.; Ricciardi, V.; Schiele, M.; Augsburg, K. Novel approaches for measuring and predicting particulate emissions from automotive brakes and tires. In 12th International Munich Chassis Symposium 2021; Springer: Berlin/Heidelberg, Germany, 2021; pp. 708–728. [Google Scholar] [CrossRef]
  11. Wingstedt, E.; Reif, B.A.P. Numerical Simulations of Particle Dispersion in an Urban Area; Norwegian Defence Research Establishment (FFI): Oslo, Norway, 2012. [Google Scholar]
  12. Nikolova, I.; Janssen, S.; Vos, P.; Vrancken, K.; Mishra, V.; Berghmans, P. Dispersion modelling of traffic induced ultrafine particles in a street canyon in Antwerp, Belgium and comparison with observations. Sci. Total Environ. 2011, 412–413, 336–343. [Google Scholar] [CrossRef] [PubMed]
  13. Gidhagen, L.; Johansson, C.; Langner, J.; Olivares, G. Simulation of NOx and ultrafine particles in a street canyon in Stockholm, Sweden. Atmos. Environ. 2004, 38, 2029–2044. [Google Scholar] [CrossRef]
  14. Amorim, J.H.; Rodrigues, V.; Tavares, R.; Valente, J.; Borrego, C. CFD modelling of the aerodynamic effect of trees on urban air pollution dispersion. Sci. Total Environ. 2013, 461–462, 541–551. [Google Scholar] [CrossRef] [PubMed]
  15. Wang, Y.J.; Zhang, K.M. Modeling Near-Road Air Quality Using a Computational Fluid Dynamics Model, CFD-VIT-RIT. Environ. Sci. Technol. 2009, 43, 7778–7783. [Google Scholar] [CrossRef] [PubMed]
  16. Pospisil, J.; Jicha, M. Particle re-suspension in street canyon with two-way traffic. Int. J. Environ. Pollut. 2011, 44, 271–279. [Google Scholar] [CrossRef]
  17. Camelli, F.; Hanna, S.; Lohner, R. FEFLO CFD model study of flow and dispersion as influenced by tall buildings in New York city. In Proceedings of the Sixth Symposium on the Urban Environment, Atlanta, GA, USA, 31 January 2006. [Google Scholar]
  18. Feißel, T.; Hesse, D.; Augsburg, K.; Gramstat, S. Measurement of Vehicle Related Non Exhaust Particle Emissions under Real Driving Conditions. Eurobrake 2020, 1, 1–8. [Google Scholar] [CrossRef]
  19. Ninawe, G. Review of Vehicle Emission Measurement and Sampling System. Int. J. Innov. Res. Sci. Eng. Technol. 2015, 4, 7510–7516. [Google Scholar] [CrossRef]
  20. Hesse, D. Beitrag zur Experimentellen und Analytischen Beschreibung Partikelförmiger Bremsenemissionen. Ph.D. Thesis, Technische Universität Ilmenau, Ilmenau, Germany, 2020. [Google Scholar] [CrossRef]
Figure 1. Methodology for particle measurement (creation of a database), virtual emission prediction and particle tracking within the environment.
Atmosphere 13 01924 g001
Figure 2. Test setup for vehicle-based particle emission measurement: (a) schematic illustration of sampling systems for brake wear (blue) and TRWP particles (red)—(b) measurement setup mounted to the test vehicle [18].
Atmosphere 13 01924 g002
Figure 3. Simulation environment (Erfurt, Germany): (a) vehicle simulation model (b) CFD model (global wind direction: west/global wind speed 10 km/h).
Atmosphere 13 01924 g003
Figure 4. Correlation between vehicle dynamics and particle generation: exhaust emissions as a function of (a) vehicle acceleration, (b) engine torque and velocity.
Atmosphere 13 01924 g004
Figure 5. Correlation between vehicle dynamics and particle generation: brake wear emissions as a function of (a) vehicle deceleration, (b) brake pressure and vehicle speed.
Atmosphere 13 01924 g005
Figure 6. Correlation between vehicle dynamics and particle generation: TRWP emissions as a function of (a) longitudinal and lateral acceleration and (b) slip velocity.
Atmosphere 13 01924 g006
Figure 7. Estimated vehicle-related PM10 contribution within a virtual city environment: (a) brake wear, (b) TRWP (c) exhaust emissions (d) virtual PM10 and PN emission factors.
Atmosphere 13 01924 g007aAtmosphere 13 01924 g007b
Figure 8. Transfer of a predicted particle emission stream into the flow model considering the particle size distribution: (a) particle size distribution of a TRWP sample (b) dispersion of TRWP particles within the road canyons of the city model (global wind direction: west/global wind speed 10 km/h).
Atmosphere 13 01924 g008
Figure 9. Correlation between global wind conditions and local PM10 concentrations (Bergstraße): (a) influence of global wind speed (global wind direction: west)—(b) influence of the global wind direction (height above the road surface: 4 m).
Atmosphere 13 01924 g009
Table 1. Estimation of vehicle-related particle emissions (PM10 and PN) as a function of power transmission.
SourcePower (Kw)PM10 (mg/kWs)PN (#/kWs)
Brake P b = p b A b μ b v b ~ 0.184 ~ 1.15 10 9
TRWP P t = m v a x y + 0.5 ρ L c d A v v v 2 v s ~ 0.051 ~ 4.21 10 8
Exhaust P e = 2 π M e n e ~ 2.86 10 7 ~ 3.97 10 5
Publisher’s Note: MDPI stays neutral with regard to jurisdictional claims in published maps and institutional affiliations.

