Article

Seasonal Characteristics of Atmospheric PM2.5 in an Urban Area of Vietnam and the Influence of Regional Fire Activities

1
Faculty of Environmental Engineering, Hanoi University of Civil Engineering (HUCE), 55 Giai Phong, Hanoi 100000, Vietnam
2
Research Group for Clean Air Solutions (ReCAS), Hanoi University of Civil Engineering (HUCE), 55 Giai Phong, Hanoi 100000, Vietnam
*
Author to whom correspondence should be addressed.
Atmosphere 2022, 13(11), 1911; https://doi.org/10.3390/atmos13111911
Submission received: 21 September 2022 / Revised: 11 November 2022 / Accepted: 13 November 2022 / Published: 16 November 2022
(This article belongs to the Special Issue Wildland Fire under Changing Climate)

Abstract

:
This study investigated the seasonal variation and chemical characteristics of atmospheric PM2.5 at an urban site in Hanoi City of Vietnam in summer (July 2020) and winter (January 2021) periods. The study results showed that the average value of daily PM2.5 concentrations observed for the winter period was about 3 times higher than the counterpart for the summer period. The concentrations of major species in atmospheric PM2.5 (SO42−, NH4+, K+, OC and EC) measured during the winter period were also significantly higher than those during the summer period. The contribution of secondary sources to the measured OC (the largest contributor to PM2.5) was larger than that of primary sources during the winter period, compared to those in the summer period. The correlation analysis among anions and cations in PM2.5 suggested that different sources and atmospheric processes could influence the seasonal variations of PM2.5 species. The unfavorable meteorological conditions (lower wind speed and lower boundary layer height) in the winter period were identified as one of the key factors contributing to the high PM2.5 pollution in this period. With the predominance of north and northeast winds during the winter period, the long-range transport of air pollutants which emitted from the highly industrialized areas and the intensive fire regions in the southern part of China and Southeast Asia region were likely other important sources for the highly elevated concentrations of PM2.5 and its chemical species in the study area.

1. Introduction

Long-term and short-term exposure to PM2.5 (fine particles with aerodynamic diameter < 2.5 µm) could cause adverse health impacts, as pointed out by previous studies [1,2]. The possible sources and transformation process of aerosols in the atmosphere could be identified by analyzing the chemical compositions of PM2.5 [3]. Anthropogenic species, such as sulphate (SO42−), nitrate (NO3), and ammonium (NH4+), have been generally reported as the main components of atmospheric aerosols [4]. SO42− and NO3 can be formed through the oxidation of SO2 and NOx, respectively, which are released from anthropogenic sources (e.g., industry, power plants, traffic emissions). According to [4], NO3 exists in both aerosol and gaseous phases (in the form of nitric acid vapor), while SO42− is only found in the aerosol phase. NH3 which is emitted from various sources (i.e., livestock and fertilizer, industrial activities, traffic emission) can react with acidic aerosols to form the neutralized ammonium salts (e.g., NH4NO3, (NH4)2SO4, NH4HSO4) in the atmosphere [5,6]. The other species in PM2.5 including carbonaceous components (organic carbon (OC) and elemental carbon (EC)) and potassium (K+) have been commonly considered as the tracers of biomass burning [7]. Since PM2.5 secondary species have been realized to have negative effects on both human health and the climate [8], the understanding of PM2.5 chemical compositions in particular areas plays an important role in formulating air quality management policies and strategies.
According to [9], in the big cities of Vietnam, such as Ho Chi Minh City and Hanoi, heavy air pollution usually occurs, which can pose severe health risks. Hanoi is the second largest city and the capital of Vietnam, with a population of about 8.25 million people. During recent years, the rapid urban population growth, urbanization, economic development, and motorization might have contributed significantly to the increased air pollution in Hanoi [10]. There was an increasing trend of PM2.5 pollution in Hanoi during the period of 2017–2020 [11]. Recently, heavily polluted events with significantly high PM2.5 concentrations occurred more frequently in Hanoi, especially during the transition and winter seasons when the unfavorable meteorological conditions were endured [12]. Key sources of air pollution in Hanoi were reported, including transportation, industry, domestic coal combustion, open burning of biomass, and long-range transported air pollutants [11]. It was reported that traffic emission was one of the largest contributors to urban air pollution in Hanoi [13]. The number of private vehicles (mainly cars and motorcycles) has been increasing from year to year in Hanoi. According to [14], there were 787,000 cars and about 6 million motorcycles in Hanoi by the end of 2019. The strong impact of traffic emission on local air pollution in Hanoi was also indicated by the trend of increased concentrations of NOx and CO during rush hours in the morning and evening [15]. In addition to the primary emission sources as mentioned above, secondary aerosol has been pointed out as one of the significant sources of PM2.5 pollution in Hanoi as well [10]. On the other hand, the local PM2.5 pollution in Hanoi could be also impacted by other factors (i.e., pattern of air mass, local/regional fire sources) that could vary from season to season. Although fire activities have been reported as one of the major sources of air pollution in Southeast Asia [10], the seasonal impact of fire sources on the PM2.5 pollution in Hanoi is poorly understood. Moreover, due to the impact of climate change, the frequency of fire activities might be increased, which could exacerbate the local air pollution. In the situation of increased PM2.5 pollution in Hanoi, it is of significance to investigate the seasonal variation and chemical characteristics of atmospheric PM2.5 to gain a better understanding of how the key sources and atmospheric processes affecting PM2.5 are measured in Hanoi. Recently, the government of Vietnam has approved the National Plan on Air Quality Management for the Period of 2021–2025, in which one of the key solutions was the implementation of scientific research to identify the contribution of different emission sources to PM2.5 pollution and to provide strong evidence for the government to develop robust air quality management policies and strategies towards reducing PM2.5 pollution and protecting public health. In response to this demand, this study aimed to (1) investigate the seasonal variation of mass concentration and chemical characteristics of PM2.5 measured in an urban area of Hanoi City; (2) analyze the relationship among PM2.5 chemical compositions and identify the key sources and atmospheric processes impacting the seasonal variation of atmospheric PM2.5 and its components; and (3) investigate the influences of seasonal meteorological conditions and regional fire activities on the characteristics of PM2.5 and its components.

2. Materials and Methods

2.1. Sampling Site

In the present study, the PM2.5 sampling site was situated on the roof of the two-floor building of the Hanoi University of Civil Engineering, 55 Giai Phong Road, Hai Ba Trung District in Hanoi (Figure 1). The sampling site (Lat 21.003 N, Long 105.842 E) was considered as an urban mixed site that was impacted by various anthropogenic sources such as motor vehicle emission, construction activities, and nearby industrial activities. There are many significant anthropogenic emission sources in the areas surrounding Hanoi, such as the steel, cement, and coal-fired power plants which are situated in the east, southeast, and north directions (Figure 1). When wind is blowing from these directions, air pollutants originating from those sources could be transported to the study area in Hanoi [10].

2.2. PM2.5 Sampling and Chemical Analysis

The two intensive 24-h integrated PM2.5 sampling campaigns were carried out daily during the summer (from 8 to 30 July 2020) and winter (from 5 to 30 January 2021) periods. A total of eighteen (for summer) and seventeen (for winter) 24-h PM2.5 samples were obtained using Whatman quartz fiber filters which were placed in an air sampler (Met One E-FRM-200, Grants Pass, OR, USA) operated at a flow rate of 16.7 L/min. Before sampling, the filters were heated at 900 °C in an electric furnace for three hours to remove carbonaceous contaminants. After sampling, the filters were brought to the laboratory and stored in the refrigerator at 4 °C to avoid the evaporation of volatile constituents before performing chemical analysis. Field blanks were also collected using the procedures, identical to those applied for collecting PM2.5 samples, however without operating the air sampler. Before and after sampling, the filters were weighed gravimetrically to determine the PM2.5 total mass. The filters were equilibrated for 48 h in a climate-controlled room prior to pre- and post-weighing. During the equilibration period, the relative humidity and air temperature in the weighing room were maintained at about 40% and 22 °C, respectively. Prior to weighing, the balance weighing chamber was cleaned by a fine brush. The surfaces near the micro-balance were also cleaned with alcohol-moistened disposable laboratory wipes. The filters were placed on the balance pan for at least 30 s and the mass data was then recorded. Each filter was weighed three times.
Water-soluble inorganic ions (WSIIs) consisting of Na+, NH4+, K+, Mg2+, Ca2+, Cl, F, SO42−, NO3) in PM2.5 were determined using ion chromatography (IC, Thermo Scientific, Waltham, MA, USA, Dionex 600). A piece of filter sample was placed in the Erlenmeyer flask with 10 mL of ultra-pure water and treated in the ultrasonic cleaner for about 30 min. The extract was then filtrated through 0.45 μm nylon syringe filters and injected to the IC. The AS4A-SC analytical column (4 × 250 mm) was employed to analyze anions with the eluent of 1.8 mM Na2CO3 and 1.7 mM NaHCO3 (flow rate of 2 mL/min). The CS12A analytical column (2 × 250 mm) was utilized to analyze cations with the eluent mixture of 22 mM H2SO4 (flow rate of 0.25 mL/min). The Dionex IC injection volume (25 μL), column temperature (35 °C), and run time (30 min) were kept the same for the chemical analysis of both cations and anions. The blank filters were routinely analyzed to remove contaminants from blank filters using the same procedures applied for the field samples, and the results were subtracted from the sample values.
The analysis of carbonaceous species (OC and EC) in PM2.5 was performed following the NIOSH 870 thermal/optical transmittance protocol using the carbon analyzer (Model 5L, Sunset Laboratory Inc., Portland, OR, USA). A piece of filter sample was heated in the quartz oven at different temperatures (310, 475, 615, and 870 °C) in the pure helium (oxygen-free environment) to analyze four OC fractions (OC1, OC2, OC3, and OC4). The temperature of the oven was then decreased to 550 °C and six fractions of EC including EC1, EC2, EC3, EC4, EC5, and EC6 were determined by subsequently heating at 550, 625, 700, 775, 850, and 870 °C in the environment of 98% He and 2% O2. The carbon vapour from the heating process was oxidized to carbon dioxide (CO2) in the oxidation oven. The CO2 was then reduced to methane (CH4) in nickel catalyst and quantitatively measured with a flame ionization detector. The instrument’s detection limit was 0.1 μg C/cm2 and the analytical uncertainty was equal to ±(OC/EC concentration × 0.05) + instrument blank concentration.

2.3. Meteorological Data

The ERA5 reanalysis data for hourly meteorological parameters (wind direction, wind speed, relative humidity, ambient temperature, and boundary layer height) obtained from the European Centre for Medium-Range Weather Forecasts (https://cds.climate.copernicus.eu, accessed on 15 March 2021) was extracted for the study area in Hanoi and used to assess the influence of seasonal meteorological condition on the variation of PM2.5 and its components.

2.4. MODIS Fire Radiative Power Data

In order to identify biomass burning regions in the Asia region and assess their effect on the variation of PM2.5 and its components measured in the study area, the cumulative fire radiative power (FRP) data acquired from NASA’s FIRMS website (https://www.earthdata.nasa.gov/learn/find-data/near-real-time/firms, accessed on 15 March 2021) was used. The FRP data was derived by the MODIS Collection 6 active fire-detection algorithm [16].

2.5. Air Mass Backward Trajectories

In the present study, the analysis of three-day air mass backward trajectories arrived at the sampling site in Hanoi was carried out to identify and assess the likely impact of fire source regions in the Asia region to PM2.5 and its components measured in Hanoi. Three days were expected to be enough time for most trajectories to pass through possible source regions in the Asia region. The web-based version of the hybrid single-particle Lagrangian integrated trajectory (HYSPLIT) model [17] provided at https://www.ready.noaa.gov/HYSPLIT.php (accessed on 15 March 2021) and NCEP GDAS data was employed to generate the air mass backward trajectories. The starting height of 1500 m above-ground level was selected and air mass trajectories were calculated every 1 h.

3. Results and Discussion

3.1. Seasonal Variation of Concentrations of PM2.5 and Its Chemical Compositions

The daily mean PM2.5 concentrations and meteorological parameters observed in the study area during the summer and winter periods are expressed in Figure 2. For the summer period, there were five measurement days (out of eighteen measurement days) where the daily concentrations of PM2.5 were higher than the corresponding value for PM2.5 (50 µg m−3) regulated by the national standard for ambient air quality. For the winter period, the daily concentrations of PM2.5 were much higher than the national standard for all measurement days, which clearly indicated heavy PM2.5 pollution. Especially for several days in the winter period, the daily concentrations of PM2.5 were over 200 µg m−3. The statistical values of PM2.5 total mass, PM2.5 chemical compositions, and meteorological conditions during the summer and winter measurement periods were summarized in Table 1. The average value (40.20 µg m−3) for the daily PM2.5 concentrations estimated for the summer period was about 3 times lower than the counterpart (122.90 µg m−3) for the winter period. Compared to those reported for the urban areas in the other Asian countries (Table 2), the average value of PM2.5 concentration (80.37 ± 55.63 µg m−3) estimated for the whole study period in Hanoi was much higher than those for Kampar [18], Kuala Lumpur [19], and Johor Bahru [20,21] in Malaysia; Singapore [22]; Bangkok, Thailand [23]; Bandung, Indonesia [24]; Ho Chi Minh City, Vietnam [25]; Shanghai, China [26]; and Beijing, China [27]. Even compared to those measured during the smoke haze periods in Kuala Lumpur, Malaysia [19] and Chiang Mai, Thailand [28], the average value of PM2.5 concentration observed in Hanoi in this study was still relatively higher. However, compared to those observed for several urban areas in India, the PM2.5 concentration measured in Hanoi was lower than the values reported for Chandigarh [29], Delhi, Varanasi, and Kolkata [30].
With respect to the seasonal meteorological conditions (Table 1), the average values for daily wind speed, boundary layer height, ambient temperature, and relative humidity estimated for the summer period were about 1.31, 1.26, 2.02, and 1.06 times higher than the counterparts for the winter period. It was seen that the values of wind speed, relative humidity, boundary layer height, and ambient temperatures varied from day to day in both the summer and winter measurement periods (Figure 2). The daily variation trend of boundary layer height and wind speed was somewhat similar in both the summer and winter period. Further discussion on the impact of seasonal meteorological conditions on the variation of PM2.5 and its components are provided in a later section of this paper.
Figure 3 shows the daily mean concentrations for PM2.5 chemical species. As displayed in Figure 3 and Table 1, WSII (Cl, NO3, SO42−, Na+, NH4+, K+, and Ca2+) and carbonaceous species (OC and EC) were recognized as the major components in PM2.5 in the study area. The total mass concentrations of WSII and carbonaceous species accounted for about 52.71 ± 20.82% (range 20.26–82.39%) and 41.28 ± 7.27% (range 24.37–56.14%) of the total PM2.5 mass concentrations for the summer and winter periods, respectively. For the summer period, the mean concentrations of the four major anions followed the sequence of SO42− > NO3 > Cl > F, while the five major cations ranked in the order of NH4+ > Ca2+ > K+ > Na+ > Mg2+. However, for the winter period, those orders were SO42− > Cl > F > NO3 and NH4+ > K+ > Ca2+ > Na+ > Mg2+. Among the WSII species, SO42− and NH4+ were the most dominant ones in both seasons, in which their concentrations accounted for 67.5% and 78.2% of total concentrations of WSII species in the summer and winter periods, respectively. The average values for daily concentration of Cl, SO42−, NH4+, and K+ measured during the winter period were significantly higher than those during the summer period. On the other hand, a contrasting seasonal pattern was seen for F, NO3, Na+, and Mg2+ (Table 1).
OC was clearly seen to be the largest contributor to total mass of PM2.5, which were 29.81 ± 9.70% and 25.25 ± 5.99% for the summer and winter periods, respectively. The mean value ± standard deviation for daily concentrations of OC for the winter period was 30.20 ± 12.01 µg m−3 (range 12.80–52.07 µg m−3), which was much higher than the counterpart for the summer period (mean value ± standard deviation of 11.85 ± 6.43 µg m−3, range 4.74–28.20 µg m−3). These results indicated the elevated concentration and large variability of OC during the winter period, owing to its complex sources (both primary and secondary ones) as investigated in the later sections. The mean value for daily concentrations of EC in the winter period was also 1.8 times higher than that in the summer period. The elevated concentrations of carbonaceous species, especially OC, contributed largely to the high pollution of PM2.5 during the winter period. Since OC was the largest contributor to PM2.5 for both seasons, this study further investigated the contribution of primary organic carbon (POC) and secondary organic carbon (SOC) to the measured OC. It is well known that OC could be directly released as POC from various sources such as natural and geological activities, industrial emissions, and fuel combustions. OC could be also found in the form of SOC when the chemical transformation of semi-volatile as well as volatile organic compounds and the nucleation or condensation occurs [31]. In order to calculate the concentrations of POC and SOC in OC measured in the study area, the method of OC/EC minimum ratio [32] was employed as the following:
SOC = OC − (OC/EC)min × EC
POC = OC − SOC
where (OC/EC)min is the OC/EC minimum ratio found in PM2.5 samples measured in the study area and EC and OC are the concentrations of elemental carbon and organic carbon determined in the PM2.5 samples, respectively.
As the fractions of primary carbon might be strongly influenced by the source regions, source types, and atmospheric processes during different measurement periods, the OC/EC minimum ratios could be largely variable. For example, the OC/EC ratios of 0.8, 2.2, 4.15, 12.7, and 14.5 were reported for heavy-duty diesel vehicles, light-duty gasoline vehicles, wood combustion, natural gas home appliances, and forest fires, respectively [33]. In the present study, the OC/EC minimum ratio of 5.315 (seen on 10 July 2020) was used. A significantly positive correlation (R = 0.856) between OC and EC in the summer period implied the dominance of primary emission sources (i.e., traffic emissions, coal combustion). Therefore, the above OC/EC minimum ratio was applicable to estimate the concentrations of POC and SOC in the measured OC. The results for the daily concentrations of POC and SOC in the study areas are displayed in Figure 4. The concentrations of POC and SOC estimated for the summer period were 7.13 ± 4.11 µg m−3 and 4.72 ± 3.60 µg m−3, respectively, which were about 60.16% and 39.84% of the OC concentration. Meanwhile, the counterparts for the winter period were 12.74 ± 4.79 µg m−3 and 17.46 ± 10.75 µg m−3, respectively, accounting for 42.19% and 57.81% of the measured OC. These findings implied the larger contribution of secondary sources than that of primary sources to OC measured during the winter period, compared to those during the summer period.
In this study, organic mass (OM), a key component of PM2.5, was calculated from the OC measured at the sampling site by multiplying the concentration of OC with a factor to account for the presence of oxygen and hydrogen atoms. According to [34], a factor of 1.6 ± 0.2 was recommended for urban areas worldwide [35,36]. Since there is currently no data reported for urban areas in Vietnam, the value of 1.6 was selected for the present study. The OM concentrations estimated for the summer and winter periods were 18.97 ± 10.28 µg m−3 and 51.34 ± 20.42 µg m−3 which accounted for 47.70% and 42.92% of the PM2.5 total mass, respectively (Figure 3). This suggested that OM is one of the predominant species in ambient air in Hanoi City. However, it should be noted that adopting the factor of 1.6 to estimate the fraction of OM in the measured PM2.5 could present some uncertainties. It is recommended that those uncertainties should be addressed in the future studies.

3.2. Analysis of Relationship among PM2.5 Chemical Components

Analysis of the relationships between mass concentration of PM2.5 and its chemical compositions would help to identify the key chemical species controlling the temporal variability of PM2.5. The Pearson correlation coefficients among PM2.5 species measured in the study area for the summer and winter periods were shown in Table 3. The results in Table 3 and the proportion of PM2.5 chemical compositions (Figure 3) indicated that the daily variability of PM2.5 was largely driven by OC (or OM) and EC (R = 0.725 and 0.689, respectively), and to a lesser extent by NO3 NH4+, and SO42− (R = 0.598, 0.476, and 0.454, respectively), in the summer period. Meanwhile, OC (R = 0.835), followed by SO42−, NH4+, K+, Cl, and EC (R = 0.950, 0.914, 0.864, 0.649, and 0.387, respectively) were the main species controlling the daily variability of PM2.5 in the winter period.
Analysis of the correlation between cations and anions in PM2.5 could suggest the atmospheric formation processes as well as the key sources for aerosol components [3]. According to [37], SO42−, NO3, and NH4+ are usually considered as the secondary species which are formed by the transformation of SO2, NOx, and NH3, respectively, in the atmosphere. As seen in Table 3, NH4+ was strongly correlated with SO42− (R = 0.973 and R = 0.983 for the summer and winter periods, respectively). This suggested that there were common sources and/or processes influencing these two species in both the summer and winter periods [38]. A relatively strong correlation between SO42− and NO3 (R = 0.742) for the summer period implied that there was a common trend in source and atmospheric processes of two species. However, for the winter period, there was a low correlation between SO42− and NO3 which suggested different sources and processes affecting the variation of these species. The mass ratio of NO3/SO42− has been widely applied to investigate the role of mobile sources (motor vehicle emissions) vs. stationary sources (emissions from coal combustion) in contributing to atmospheric PM2.5 [39,40]. The high mass ratio of NO3/SO42− would suggest the predominant role of mobile sources over stationary sources, and vice versa [41]. Figure 5 indicated that the NO3/SO42− mass ratios measured for the summer period (mean ± standard deviation of 0.25 ± 0.21, range 0.02–0.69) were much higher than those for the winter period (mean ± standard deviation of 0.003 ± 0.002, range 0.001–0.008). These results implied the more important role of local traffic emission sources than that of stationary emission sources in contributing to anthropogenic air pollutants during the summer period in this study. However, emissions from stationary sources (i.e., coal burning for cement, steel, and coal-fired power plants in the surrounding provinces of Hanoi) were likely the significant sources of local air pollution through atmospheric transport process during the winter period (discussed in the later section). However, compared to the other studies, the NO3/SO42− mass ratios in this study were still lower than those reported for Beijing (0.71) [37], Shanghai (0.43) [40], and Qingdao (0.35) [42] in China.
According to [43], atmospheric Mg2+ and Ca2+ usually originate from crustal sources (i.e., soil, construction, and re-suspended road dust). For the summer period, a slightly positive correlation between Mg2+ and Ca2+ was seen, which suggested that the sources contributing to Mg2+ and Ca2+ during this period might be different. However, for the winter period, a significant positive correlation for Mg2+ and Ca2+ was found, which suggested the common crustal sources for these cations. For sea salt aerosol, a low correlation for Na+ and NO3/Cl were observed for the summer period. This was likely due to the fact that NO3/Cl were firstly balanced with NH4+ as discussed above. Thus, after balancing with NH4+, the free NO3/Cl were not significantly associated with Na+. However, for the winter period, Na+ was strongly correlated with Cl, while Na+ was moderately correlated with NO3. These results suggested the more important role of sea salt aerosol as a contributor to PM2.5 measured for the winter period.
Because K+, Cl, EC, and OC are commonly reported as the tracers for biomass burning activities [44,45], the possible influence of biomass burning sources on the PM2.5 measured in the study area was assessed. As presented in Table 3, moderate positive correlations (K+ vs. EC, K+ vs. Cl, EC vs. Cl, OC vs. Cl) were found for both the summer and winter periods, which implied the possible impact of biomass burning source to the measured PM2.5, which will be further explored in a later section. This point was also confirmed by the strong correlation between EC and OC (R = 0.856) for the summer period which implies that the key sources of EC and OC were somewhat similar for this period [46]. However, as SOC contributed more to the measured OC during the winter period (Figure 4), the strength of the correlation between OC and EC decreased for this period. It was reported that the emission sources for EC are mainly the primary sources and they are relatively stable. Whereas OC include both POC released directly from combustion and other sources and SOC formed by gas-to-particle transformation [47]. The OC/EC ratio has been widely used to assess the sources of carbonaceous species. For example, [48] reported the OC/EC ratios of 1.1, 2.7, and 9.0 for traffic emission, coal combustion, and biomass burning activities, respectively. In another study [49], the OC/EC ratios >2 were reported as the indicators for the formation of SOC. In the present study, the daily values of OC/EC ratio for the summer (mean ± standard deviation of 9.70 ± 2.75, range 5.32–17.58) and winter (mean ± standard deviation of 13.93 ± 9.46, range 6.55–48.64) periods were very high. This suggested that the high concentration of OC measured in the study area could be impacted by either SOC formation or biomass burning activities, as discussed in the above section. Furthermore, the highly variable OC/EC daily ratios (Figure 5) during both the summer and winter periods also suggested the possible impacts of complex sources and processes, changes in source regions or sources strengths, and different synoptic meteorological conditions during the study periods.

3.3. Influences of Seasonal Meteorological Conditions and Regional Fire Activities on the Variation of PM2.5 and Its Chemical Compositions

In the present study, the relationships between meteorological parameters and mass concentrations of PM2.5 as well as its major species (Table 4) were analyzed to gain a better understanding of the impact of seasonal meteorological conditions on atmospheric PM2.5 measured in the study area. There were moderately positive correlations between relative humidity and PM2.5 for both the summer and winter periods, which suggested that relative humidity played a certain role in enhancing PM2.5 pollution in the study area. With respect to the major species in PM2.5, SO42− and NH4+ were positively correlated with relative humidity in both the summer and winter periods. A good positive correlation between SOC and relative humidity was also seen for the summer period. Since SO42− and NH4+ are usually species with strong hygroscopicity [50,51], the relatively high relative humidity during both the summer and winter periods in the study area (Table 1) might enhance the hygroscopic growth of atmospheric particles and increase the aqueous-phase reactions [52,53]. It was reported that at the relative humidity >70%, the hygroscopic growth of atmospheric particles could strongly happen and the liquid water content in PM2.5 was found to positively correlate with relative humidity, SO42−, and NH4+ [10].
When considering the impacts of wind speed on the variation of atmospheric PM2.5 and its chemical components, the moderate to strong negative correlations between wind speed and PM2.5 as well as most of PM2.5 chemical species were generally observed for both the summer and winter periods. A similar result was also seen when examining the effects of boundary layer height on the variation of atmospheric PM2.5. These findings implied that the higher values of wind speed and boundary layer height might lead to the enhanced atmospheric dispersion and in turn lead to reduced concentrations of air pollutants near the surface, and vice versa. In terms of seasonal variation, the lower values of wind speed and boundary layer height during the winter period (Table 1) were favorable for the trapping of air pollutants in the ground, and could contribute to the increased concentration of PM2.5 and its chemical compositions in the winter period [54,55].
Table 4 showed the significant negative correlations between ambient temperature and the secondary species (NO3, SO42−, NH4+, and SOC) during the summer period. Since nitrate has a relatively high volatility, the high temperature in summer could increase its concentration in the gaseous phase, and thus cause the lower concentration in the particle phase. Ambient temperature generally also had moderate to strong negative correlations with concentration of the other species in PM2.5. These results implied that the high temperature in the summer period could enhance the atmospheric convection, subsequently leading to the dilution and dispersion of air pollutants [56,57]. In contrast, during the winter period, there were the moderate positive correlations between ambient temperature and the secondary species (SO42−, NH4+, and SOC). The previous studies [58,59] also showed the increased concentration of those secondary particles with the increased ambient temperature. The correlations between ambient temperature and PM2.5 were similar to those for the secondary species (SO42−, NH4+, and SOC) in the summer and winter periods since these species were the major contributors to PM2.5 in both seasons in the study area.
In order to identify the possible impact of the distant sources located in the provinces near Hanoi, the relationship between wind direction and concentration of key chemical compositions in PM2.5 was explored. During the summer period, the southeast wind was the most prevailing wind sector, followed by the south and east winds (Figure 6a). The highest concentrations of Cl, NO3, Na+, K+, Ca2+, and EC were corresponding to the southeast wind. Meanwhile, SO42− and NH4+ reached their highest concentrations with respect to both the southeast and east winds, which suggested the common sources for these species during the summer period. The elevated concentrations of OC corresponded to the east wind. There are many large industrial sources (cement, steel, and coal-fired power plants) situated in the northern, eastern, and southern provinces near Hanoi (Figure 1). Thus, under certain meteorological conditions in the summer period, wind could bring air pollutants released from those sources towards the study area in Hanoi and contribute to the elevated concentrations of PM2.5 and its chemical components. Meanwhile, the dominant winds in the winter period were the southeast, northeast, and north winds (Figure 6b). The high concentrations of Cl, NH4+, and Ca2+ were related to the north wind. Meanwhile, the highest concentration of NO3 were associated with the southeast wind which was quite similar to that in the summer period. The highest concentrations of SO42− and Na+ were found with both the southeast and north winds. K+ showed its diverse source regions in the winter period, where its highest concentrations were seen more frequently with the southeast wind, followed by the north, northeast, and east winds. The highest concentrations of OC and EC were seen with the northeast and southeast winds, respectively. From these results, it could be inferred that in addition to the southeast wind, either the north or northeast winds might partly contribute to the increased concentration of PM2.5 in the winter period via the transport of air pollutants released from the regional sources to the study area. In summary, the change in seasonal wind directions, and subsequently the change in the source regions, could influence the variation of concentration of PM2.5 and its major species in the study area.
Biomass burning has been reported as one of the important regional and/or local sources of poor air quality in Southeast Asian countries [10,31,60,61,62,63,64,65,66,67,68]. As an effort to further identify the source regions of fires associated with the seasonal air masses which influence the seasonal variation of atmospheric PM2.5, the integrated maps of MODIS cumulative FRP and air mass trajectories at the measurement site for the summer period (July 2020) and winter period (January 2021) are displayed in Figure 7. It was observed that during the summer period, air masses originated from the south, southwest, and southeast directions, and passed over both the continental (central region of Vietnam, Laos, and Thailand) and maritime (the East Sea) environment before arriving at the sampling site in Hanoi. On the other hand, air masses mainly originating from the north and northeast directions travelled through the Pearl River Delta region in the southern part of China (a highly industrialized area) before arriving at the measurement site during the winter period. The MODIS fire maps showed that fire sources occurring in the southern part of China and the Southeast Asia region (Vietnam, Laos, Thailand, and Myanmar) during the winter period were much more intensive than those during the summer period. As air masses traveled across the highly industrialized and intensive fire regions during the winter period, they might have carried a large amount of air pollutants, released from those regional sources, to the study area and resulted in the highly elevated concentrations of PM2.5 and its anthropogenic/biomass burning species (SO42−, NH4+, K+, OC, and EC, as presented in Table 1). The strong impact of long-range transport on the local PM2.5 pollution has been also reported by the other studies [10,64,65,69]. In contrast, the occurrence of air masses passing through the maritime environment (which was not strongly influenced by anthropogenic sources) and the less intensive fire regions during the summer period was identified as the main reason for the lower concentrations of PM2.5 and its anthropogenic/biomass burning species (SO42−, NH4+, K+, EC, and OC) and the higher concentrations of species associated with seawater (Na+ and Mg2+).

4. Conclusions

In this study, the seasonal variation and chemical characteristics of atmospheric PM2.5 in an urban area of Hanoi City, Vietnam were investigated. The two intensive PM2.5 sampling campaigns were carried out for summer (July 2020) and winter (January 2021) periods. Based on the findings of this study, the following key conclusions can be drawn:
  • The concentration of PM2.5 and its key components (Cl, SO42−, NH4+, K+, OC, and EC) measured in the winter period were significantly higher than those measured in the summer period, implying heavy PM2.5 pollution in the winter period.
  • The estimation of SOC showed the larger contribution of secondary sources than of primary sources to OC observed during the winter period, compared to those in the summer period.
  • The correlation analysis among anions and cations in atmospheric PM2.5 suggested that different sources and atmospheric processes could influence the seasonal variations of PM2.5 species.
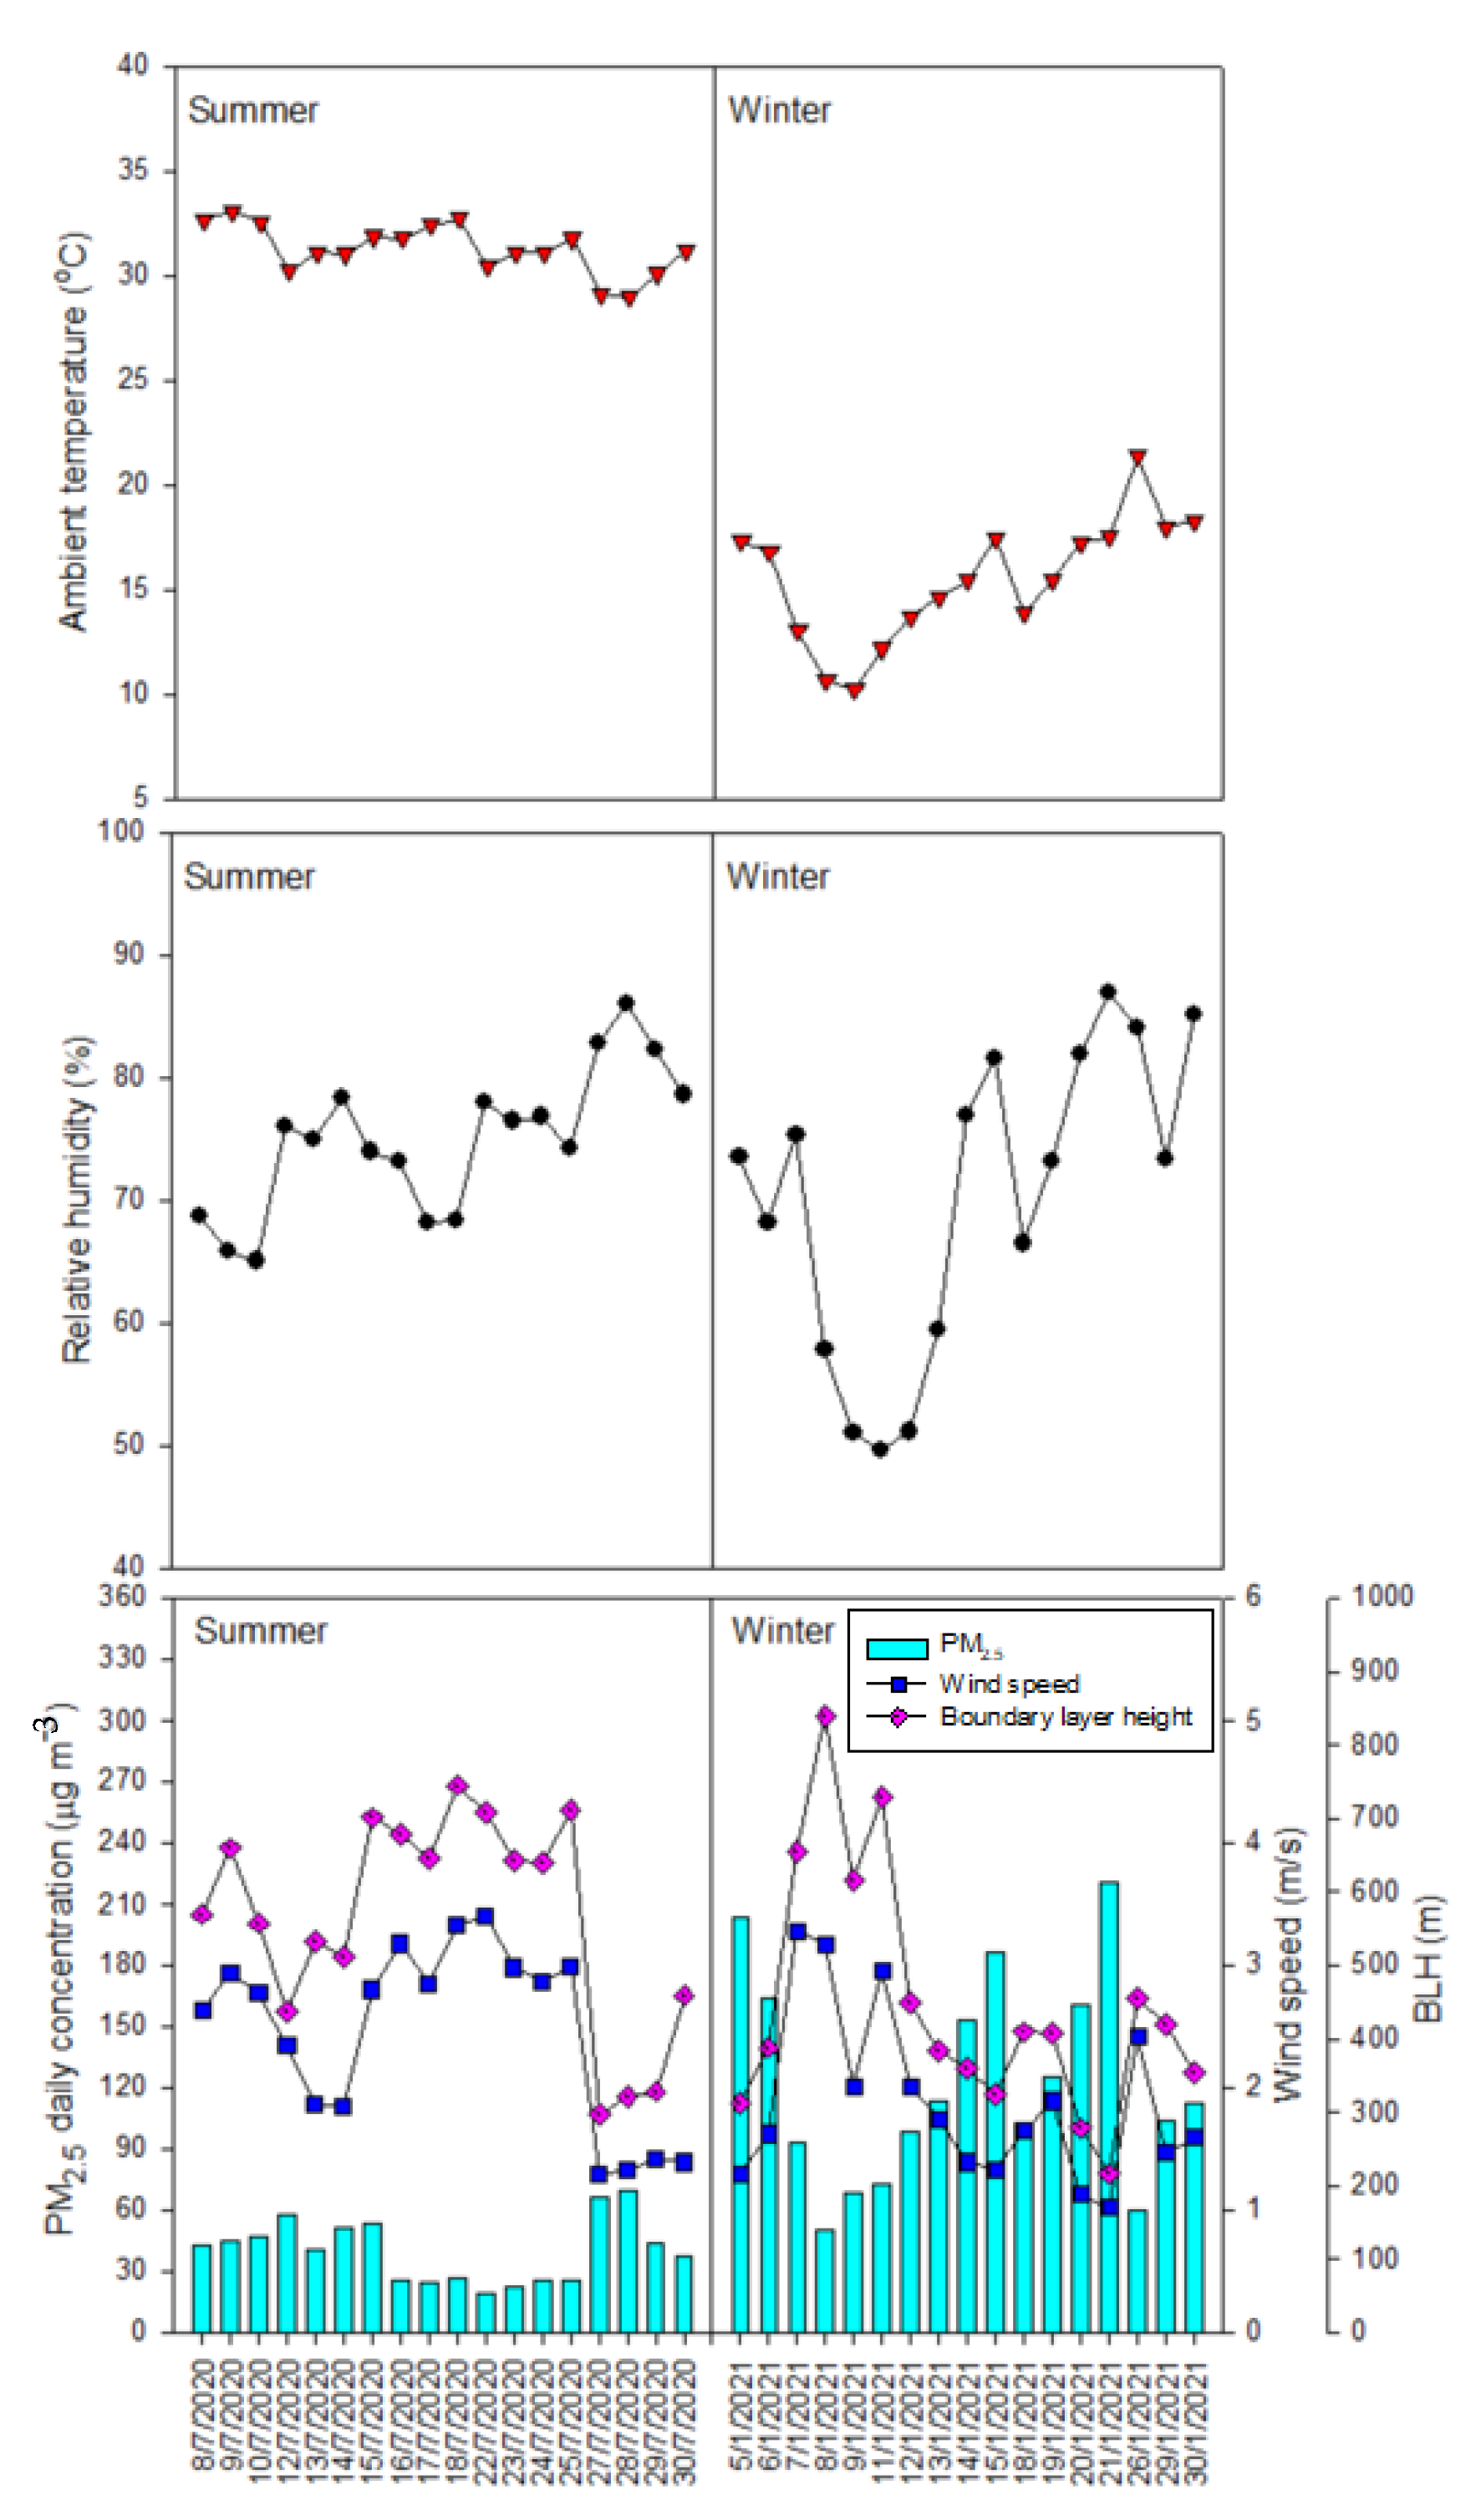
  • The analysis of the relationship between meteorological parameters and mass concentrations of PM2.5, as well as its major species, demonstrated that the unfavorable meteorological condition (lower wind speed and lower boundary-layer height) in the winter period was one of the key factors contributing to the increased PM2.5 pollution in this season.
  • Due to the dominance of north and northeast winds during the winter period, the impact of long-range transport of air pollutants emitting from the largely industrialized and intensive fire regions in the southern China and Southeast Asia region was likely another important source for the increased PM2.5 pollution in the winter period.

Author Contributions

Conceptualization, writing—original draft, Q.T.B. and D.L.N.; data, visualization, Q.T.B.; data analysis, D.L.N. and T.H.B.; review and editing, T.H.B. All authors have read and agreed to the published version of the manuscript.

Funding

This research received funding from Vietnam Ministry of Education and Training (MOET) under the grant number B2020-XDA-04.

Institutional Review Board Statement

Not applicable.

Informed Consent Statement

Not applicable.

Data Availability Statement

The data presented in this study are available on reasonable request from the corresponding author.

Acknowledgments

The authors would like to thank MOET for providing the financial support for this research under the grant number B2020-XDA-04. The authors also would like to thank the Laboratory for Analysis and Control of Environmental Pollution, Faculty of Environment, University of Science, Vietnam National University Ho Chi Minh City, Vietnam for the support in carbonaceous analysis. The authors gratefully acknowledge the NOAA Air Resources Laboratory for the provision of the HYSPLIT trajectory model and/or READY website (https://www.ready.noaa.gov/HYSPLIT.php, accessed on 12 May 2021) used in this publication.

Conflicts of Interest

The authors declare no conflict of interest.

References

  1. Katsouyanni, K.; Touloumi, G.; Samoli, G.; Gryparis, A.; Le Tertre, A.; Monopolis, Y.; Rossi, G.; Zmirou, D.; Ballester, F.; Boumghar, A.; et al. Confounding and effect modification in the short-term effects of ambient particles on total mortality: Results from 29 European cities within the APHEA2 project. Epidemiology 2011, 12, 521–531. [Google Scholar] [CrossRef] [PubMed] [Green Version]
  2. Pope, C.A.; Dockery, D.W. Health effects of fine particulate air pollution: Lines that connect. J. Air Waste Manag. Assoc. 2006, 56, 709–742. [Google Scholar] [CrossRef] [PubMed]
  3. Eleftheriadis, K.; Klaus, M.O.; Theopisti, L.; Angeliki, K.; Panayiotis, R.; Maria, O.P. Influence of local and regional sources on the observed spatial and temporal variability of size resolved atmospheric aerosol mass concentrations and water-soluble species in the Athens metropolitan area. Atmos. Environ. 2014, 97, 252–261. [Google Scholar] [CrossRef]
  4. Danalatos, D.; Glavas, S. Gas phase nitric acid, ammonia and related particulate matter at a Mediterranean coastal site, Patras, Greece. Atmos. Environ. 1999, 33, 3417–3425. [Google Scholar] [CrossRef]
  5. Querol, X.; Alastuey, A.; Rodriguez, S.; Plana, F.; Ruiz, C.R.; Cots, N.; Massague, G.; Puig, O. PM10 and PM2.5 source apportionment in the Barcelona metropolitan area Catalonia Spain. Atmos. Environ. 2010, 35, 6407–6419. [Google Scholar] [CrossRef]
  6. Zhu, L.; Daven, K.H.; Jesse, O.B.; Karen, E.C.P.; Mark, W.S.; Ming, L.; Shannon, L.C. Sources and Impacts of Atmospheric NH3: Current Understanding and Frontiers for Modeling Measurements and Remote Sensing in North America. Curr. Pollut. Rep. 2015, 1, 95–116. [Google Scholar] [CrossRef] [Green Version]
  7. Chen, J.; Chunlin, L.; Zoran, R.; Andelija, M.; Yuantong, G.; Mohammad, S.I.; Shuxiao, W.; Jiming, H.; Hefeng, Z.; Congrong, H.; et al. A review of biomass burning: Emissions and impacts on air quality, health and climate in China. Sci. Total Environ. 2017, 579, 1000–1034. [Google Scholar] [CrossRef] [Green Version]
  8. Reiss, R.; Anderson, E.L.; Cross, C.E.; Hidy, G.; Hoel, D.; McClellan, R.; Moolgavkar, S. Evidence of health impacts of sulfate- and-nitrate-containing particles in ambient air. Inhal. Toxicol. 2007, 19, 419–449. [Google Scholar] [CrossRef]
  9. World Bank. Available online: https://www.worldbank.org/en/country/vietnam/overview (accessed on 18 April 2022).
  10. Nguyen, D.L.; Hieu, B.T.; Trung, B.Q.; Dat, M.V.; Duy, N.V.; Dinh, P.V.; Hien, T.T.; Hiep, N.H. Investigation of sources and processes influencing variation of PM2.5 and its chemical compositions during a summer period of 2020 in an urban area of Hanoi city, Vietnam. Air. Qual. Atmos. Health. 2022, 15, 235–253. [Google Scholar] [CrossRef]
  11. Ministry of Natural Resources and Environment (MONRE). Report on the Implementation of National Action Plan on Air Quality Management to 2020, Vision to 2025; 2020. (In Vietnamese)
  12. CEM. Air Quality Report for Hanoi City in 2019; Vietnam Environment Administration, Ministry of Natural Resources and Environment: Hanoi, Vietnam, 2019. (In Vietnamese)
  13. Nguyen, D.L.; Nowarat, C. Strategic environmental assessment application for sustainable transport-related air quality policies: A case study in Hanoi City Vietnam. Environ. Dev. Sustain. 2011, 13, 565–585. [Google Scholar] [CrossRef]
  14. Tran, N.Q.; Nguyen, T.H.; Mac, V.D.; Tran, L.K.; Thai, H.P.; Morawska, L.; Thai, K.P. Motorcyclists have much higher exposure to black carbon compared to other commuters in traffic of Hanoi, Vietnam. Atmos. Environ. 2021, 245, 118–129. [Google Scholar] [CrossRef]
  15. Sakamoto, Y.; Shoji, K.; Bui, M.T.; Pham, T.H.; Vu, T.A.; Ly, B.T.; Kajii, Y. Air quality study in Hanoi, Vietnam in 2015–2016 based on a one-year observation of NOx, O3, CO and a one-week observation of VOCs. Atmos. Pollut. Res. 2018, 9, 544–551. [Google Scholar] [CrossRef]
  16. Giglio, L.; Schroeder, W.; Justice, C.O. The collection 6 MODIS active fire detection algorithm and fire products. Remote Sens. Environ. 2016, 178, 31–41. [Google Scholar] [CrossRef] [PubMed] [Green Version]
  17. Draxler, R.R.; Rolph, G.D. HYSPLIT (HYbrid SINGLE-Particle Lagrangian Integrated Trajectory); Model Access, NOAA Air Resources Laboratory, Silver Spring; 2019. Available online: http://www.arl.noaa.gov/ready/hysplit4.html (accessed on 18 March 2022).
  18. Ahmed, M.; Guo, X.X.; Xing, M.Z. Determination and analysis of trace metals and surfactant in air particulate matter during biomass burning haze episode in Malaysia. Atmos. Environ. 2016, 141, 219–229. [Google Scholar] [CrossRef]
  19. Sulong, N.A.; Latif, M.T.; Khan, M.F.; Amil, N.; Ashfold, M.J.; Wahab, M.I.A.; Sahani, M. Source apportionment and health risk assessment among specific age groups during haze and non-haze episodes in Kuala Lumpur Malaysia. Sci. Total Environ. 2017, 601, 556–570. [Google Scholar] [CrossRef]
  20. Dahari, N.; Latif, M.T.; Muda, K.; Hussein, N. Influence of Meteorological Variables on Suburban Atmospheric PM2.5 in the Southern Region of Peninsular Malaysia. Aerosol Air. Qual. Res. 2020, 20, 14–25. [Google Scholar] [CrossRef]
  21. Alias, N.F.; Khan, M.F.; Sairi, N.A.; Zain, S.M.; Suradi, H.; Rahim, H.A.; Tirthankar, B.; Aynul Bari, M.; Murnira, O.; Mohd, T.L. Characteristics, emission sources, and risk factors of heavy metals in PM2.5 from southern Malaysia. ACS Earth Space Chem. 2020, 4, 1309–1323. [Google Scholar] [CrossRef]
  22. Zhang, Z.; Khlystov, A.; Norford, L.K.; Tan, Z.; Balasubramanian, R. Characterization of traffic-related ambient fine particulate matter (PM2.5) in an Asian city: Environmental and health implications. Atmos. Environ. 2017, 161, 132–143. [Google Scholar] [CrossRef]
  23. ChooChuay, C.; Siwatt, P.; Danai, T.; Oramas, S.; Woranuch, D.; Qiyuan, W.; Li, X.; Guohui, L.; Yongming, H.; Jittree, P.; et al. Impacts of PM2.5 sources on variations in particulate chemical compounds in ambient air of Bangkok, Thailand. Atmos. Pollut. Res. 2020, 11, 1657–1667. [Google Scholar] [CrossRef]
  24. Santoso, M.; Lestiani, D.D.; Kurniawati, S.; Damastuti, E.; Kusmartini, I.; Atmodjo, D.P.D.; Sari, D.K.; Hopke, P.K.; Mukhtar, R.; Muhtarom, T.; et al. Assessment of Urban Air Quality in Indonesia. Aerosol Air. Qual. Res. 2020, 20, 2142–2158. [Google Scholar] [CrossRef]
  25. Hien, T.T.; Chi, N.D.T.; Nguyen, N.T.; Vinh, L.X.; Takenaka, N.; Huy, D.H. Current Status of Fine Particulate Matter (PM2.5) in Vietnam’s Most Populous City, Ho Chi Minh City. Aerosol Air. Qual. Res. 2019, 19, 2239–2251. [Google Scholar] [CrossRef] [Green Version]
  26. Zeng, J.; Zhang, L.; Yao, C.; Xie, T.; Rao, L.; Lu, H.; Liu, X.; Wang, Q.; Lu, S. Relationships between chemical elements of PM2.5 and O3 in Shanghai atmosphere based on the 1-year monitoring observation. J. Environ. Sci. 2020, 95, 49–57. [Google Scholar] [CrossRef] [PubMed]
  27. Luo, L.; Bai, X.; Liu, S.; Wu, B.; Liu, W.; Lv, Y.; Guo, Z.; Lin, S.; Zhao, S.; Hao, Y.; et al. Fine particulate matter (PM2.5/PM1.0) in Beijing, China: Variations and chemical compositions as well as sources. J. Environ. Sci. 2022, 121, 187–198. [Google Scholar] [CrossRef] [PubMed]
  28. Thepnuan, D.; Chantara, S. Characterization of PM2.5–bound Polycyclic Aromatic Hydrocarbons in Chiang Mai Thailand during Biomass Open Burning Period of 2016. Appl. Environ. Res. 2020, 42, 11–24. [Google Scholar] [CrossRef]
  29. Ravindra, K.; Singh, T.; Sinha, V.; Sinha, B.; Paul, S.; Attri, S.D.; Mor, S. Appraisal of regional haze event and its relationship with PM2.5 concentration, crop residue burning and meteorology in Chandigarh, India. Chemosphere 2021, 273, 128562. [Google Scholar] [CrossRef]
  30. Jain, S.; Sharma, S.K.; Srivastava, M.K.; Chatterjee, A.; Vijayan, N.; Tripathy, S.S.; Kumari, K.M.; Mandal, T.K.; Sharma, C. Chemical characterization, source apportionment and transport pathways of PM2.5 and PM10 over Indo Gangetic Plain of India. Urban Clim. 2021, 36, 100805. [Google Scholar] [CrossRef]
  31. Nguyen, D.L.; Viet, H.T.; Hieu, B.T.; Trung, B.Q.; Ha, V.V. Evaluating carbonaceous species in fine particle PM2.5 in an urban area in Hanoi. J. Sci. Technol. Civ. Eng. STCE-HUCE 2021, 15, 9–17. [Google Scholar] [CrossRef]
  32. Siciliano, T.; Siciliano, M.; Malitesta, C.; Proto, A.; Cucciniello, R.; Giove, A.; Iacobellis, S.; Genga, A. Carbonaceous PM10 and PM2.5 and secondary organic aerosol in a coastal rural site near Brindisi (Southern Italy). Environ. Sci. Pollut. Res. 2018, 25, 23929–23945. [Google Scholar] [CrossRef]
  33. Volkamer, R.; Jimenez, J.L.; Martini, F.S.; Dzepina, K.; Zhang, Q.; Salcedo, D.; Molina, L.T.; Worsnop, D.R.; Molina, M.J. Secondary organic aerosol formation from anthropogenic air pollution: Rapid and higher than expected. Geophys. Res. Lett. 2006, 33, L17811. [Google Scholar] [CrossRef] [Green Version]
  34. Turpin, B.J.; Lim, H.J. Species contributions to PM2.5 mass concentrations: Revisiting common assumptions for estimating organic mass. Aerosol Sci. Technol. 2001, 35, 602–610. [Google Scholar] [CrossRef]
  35. Huang, X.F.; Yun, H.; Gong, Z.H.; Li, X.; He, L.Y.; Zhang, Y.H.; Hu, M. Source apportionment and secondary organic aerosol estimation of PM2.5 in an urban atmosphere in China. Sci. China Earth Sci. 2014, 57, 1352–1362. [Google Scholar] [CrossRef]
  36. Mancilla, Y.; Herckes, P.; Fraser, M.P.; Mendoza, A. Secondary organic aerosol contributions to PM2.5 in Monterrey Mexico: Temporal and seasonal variation. Atmos. Res. 2015, 153, 348–359. [Google Scholar] [CrossRef]
  37. Wang, Y.; Zhuang, G.S.; Tang, A.H.; Yuan, H.; Sun, Y.L.; Chen, S.; Zheng, A. The ion chemistry and the source of PM2.5 aerosol in Beijing. Atmos. Environ. 2005, 39, 3771–3784. [Google Scholar] [CrossRef]
  38. Mirante, F.; Salvador, P.; Pio, C.; Alves, C.; Artiñano, B.; Caseiro, A.; Revuelt, M.A. Size fractionated aerosol composition at roadside and background environments in the Madrid urban atmosphere. Atmos. Res. 2014, 138, 278–292. [Google Scholar] [CrossRef]
  39. Arimoto, R.; Duce, R.A.; Savoie, D.L.; Prospero, J.M.; Talbot, R.; Cullen, J.D.; Tomza, U.; Lewis, N.F.; Ray, B.J. Relationships among aerosol constituents from Asia and the North Pacific during Pem-West A. J. Geophys. Res. Atmos. 1996, 101, 2011–2023. [Google Scholar] [CrossRef]
  40. Yao, X.; Chan, C.K.; Fang, M.; Cadle, S.; Chan, T.; Mulawa, P.; He, K.; Ye, B. The water-soluble ionic composition of PM2.5 in Shanghai and Beijing, China. Atmos. Environ. 2002, 36, 4223–4234. [Google Scholar] [CrossRef]
  41. Cao, J.J.; Zhenxing, S.; Judith, C.C.; Guowei, Q.; John, G.W. Seasonal variations and sources of mass and chemical composition for PM10 aerosol in Hangzhou, China. Particuology 2009, 7, 161–168. [Google Scholar] [CrossRef]
  42. Hu, M.; He, L.; Zhang, Y.; Wang, M.; Kim, Y.P.; Moon, K.C. Seasonal variation of ionic species in fine particles at Qingdao, China. Atmos. Environ. 2002, 36, 5853–5859. [Google Scholar] [CrossRef]
  43. Sun, Z.; Yujing, M.; Yanju, L.; Longyi, S. A comparison study on airborne particles during haze days and non-haze days in Beijing. Sci. Total Environ. 2013, 456–457, 1–8. [Google Scholar] [CrossRef]
  44. Adachi, K.; Buseck, P.R. Internally mixed soot, sulfates, and organic matter in aerosol particles from Mexico City. Atmos. Chem. Phys. 2008, 8, 6469–6481. [Google Scholar] [CrossRef]
  45. Reid, J.S.; Koppmann, R.; Eck, T.F.; Eleuterio, D.P. A review of biomass burning emissions part II: Intensive physical properties of biomass burning particles. Atmos. Chem. Phys. 2005, 5, 799–825. [Google Scholar] [CrossRef] [Green Version]
  46. Cao, J.J.; Lee, S.C.; Chow, J.C.; Ho, K.F.; Zhang, X.Y.; Zou, S.C.; Fung, K.K.; Chow, J.C.; Watson, J.G. Characteristics of carbonaceous aerosol in Pearl River Delta Region, China during 2001 winter period. Atmos. Environ. 2003, 37, 1451–1460. [Google Scholar] [CrossRef]
  47. Wang, P.; Cao, J.J.; Shen, Z.X.; Han, Y.M.; Lee, S.C.; Huang, Y.; Zhu, C.S.; Wang, Q.Y.; Xu, H.M.; Huang, R.J. Spatial and seasonal variations of PM2.5 mass and species during 2010 in Xi’an China. Sci. Total Environ. 2015, 508, 477–487. [Google Scholar] [CrossRef] [PubMed]
  48. Watson, J.G.; Chow, J.C.; Houck, J.E. PM2.5 chemical source profiles for vehicle exhaust vegetative burning geological material and coal burning in Northwestern Colorado during 1995. Chemosphere 2001, 43, 1141–1151. [Google Scholar] [CrossRef]
  49. Hildemann, L.M.; Markowski, G.R.; Cass, G.R. Chemical composition of emissions from urban sources of organic aerosol. Environ. Sci. Technol. 1991, 25, 744–759. [Google Scholar] [CrossRef] [Green Version]
  50. Bai, Z.; Ji, Y.; Pi, Y.; Yang, K.; Wang, L.; Zhang, Y.; Zhai, Y.; Yan, Z.G.; Han, X.D. Hygroscopic analysis of individual Beijing haze aerosol particles by environmental scanning electron microscopy. Atmos. Environ. 2018, 172, 149–153. [Google Scholar] [CrossRef]
  51. Sjogren, S.; Gysel, M.; Weingartner, E.; Baltensperger, U.; Cubison, M.J.; Coe, H.; Zardini, A.A.; Marcolli, C.; Krieger, U.K.; Peter, T. Hygroscopic growth and water uptake kinetics of two-phase aerosol particles consisting of ammonium sulfate adipic and humic acid mixtures. J. Aerosol Sci. 2007, 38, 157–171. [Google Scholar] [CrossRef]
  52. Liu, F.; Tan, Q.; Jiang, X.; Yang, F.; Jiang, W. Effects of relative humidity and PM2.5 chemical compositions on visibility impairment in Chengdu China. J. Environ. Sci. 2019, 86, 15–23. [Google Scholar] [CrossRef]
  53. Ma, Q.; Wu, Y.; Zhang, D.; Wang, X.; Xia, Y.; Liu, X.; Tian, P.; Han, Z.; Xia, X.; Wang, Y.; et al. Roles of regional transport and heterogeneous reactions in the PM2.5 increase during winter haze episodes in Beijing. Sci. Total Environ. 2017, 599–600, 246–253. [Google Scholar] [CrossRef]
  54. Lim, H.J.; Turpin, B.J. Origins of primary and secondary organic aerosol in Atlanta: Results of time-resolved measurements during the Atlanta supersite experiment. Environ. Sci. Technol. 2002, 36, 4489–4496. [Google Scholar] [CrossRef]
  55. Qiao, T.; Zhao, M.; Xiu, G.; Yu, J. Simultaneous monitoring and compositions analysis of PM1 and PM2.5 in Shanghai: Implications for characterization of haze pollution and source apportionment. Sci. Total Environ. 2016, 557–558, 386–394. [Google Scholar] [CrossRef] [PubMed]
  56. Luo, J.; Du, P.; Samat, A.; Xia, J.; Che, M.; Xue, Z. Spatiotemporal Pattern of PM2.5 Concentrations in Mainland China and Analysis of Its Influencing Factors using Geographically Weighted Regression. Sci. Rep. 2017, 7, 40607. [Google Scholar] [CrossRef] [PubMed] [Green Version]
  57. Yang, Q.; Yuan, Q.; Li, T.; Shen, H.; Zhang, L. The Relationships between PM2.5 and Meteorological Factors in China: Seasonal and Regional Variations. Int. J. Environ. Res. Public Health. 2017, 14, 1510. [Google Scholar] [CrossRef] [PubMed] [Green Version]
  58. Pateraki, S.; Asimakopoulos, D.N.; Flocas, H.A.; Maggos, T.; Vasilakos, C. The role of meteorology on different sized aerosol fractions (PM10, PM2.5, PM2.5–10). Sci. Total Environ. 2012, 419, 124–135. [Google Scholar] [CrossRef] [PubMed]
  59. Vassilakos, C.; Pateraki, S.; Veros, D.; Maggos, T.; Michopoulos, J.; Saraga, D.; Helmis, C.G. Temporal determination of heavy metals in PM2.5 aerosols in a suburban site of Athens, Greece. J. Atmos. Chem. 2007, 57, 1–17. [Google Scholar] [CrossRef]
  60. Bui, T.H.; Nguyen, D.L.; Nguyen, H.H.; Bui, Q.T. Comparison of aerosol products retrieved from AERONET and MODIS over an urban area in Hanoi city, Vietnam. J. Sci. Technol. Civ. Eng. STCE-HUCE 2018, 12, 99–108. [Google Scholar] [CrossRef]
  61. Bui, T.H.; Nguyen, D.L.; Nguyen, H.H. Study of aerosol optical properties at two urban areas in the north of Vietnam with the implication for biomass burning impacts. Environ. Sci. Pollut. Res. 2021, 29, 41923–41940. [Google Scholar] [CrossRef]
  62. Bui, T.H.; Nguyen, D.L.; Nguyen, H.H.; Bui, Q.T.; Do, H.D. Inter-comparison between MODIS satellite-based and AERONET ground-based Aerosol Optical Depth products in Viet Nam. Vietnam. J. Sci. Technol. 2020, 58, 124–132. [Google Scholar] [CrossRef]
  63. Huang, K.; Fu, J.S.; Hsu, N.C.; Gao, Y.; Dong, X.; Tsay, S.C.; Lam, Y.F. Impact assessment of biomass burning on air quality in Southeast and East Asia during BASE-ASIA. Atmos. Environ. 2012, 78, 291–302. [Google Scholar] [CrossRef] [Green Version]
  64. Lasko, K.; Vadrevu, K.P.; Tran, V.T.; Ellicott, E.; Nguyen, T.T.N.; Bui, H.Q.; Justice, C. Satellites may underestimate rice residue and associated burning emissions in Vietnam. Environ. Res. Lett. 2017, 12, 085006. [Google Scholar] [CrossRef]
  65. Nguyen, D.L.; Hieu, B.T.; Hiep, N.H. Contrasting seasonal pattern between ground-based PM2.5 and MODIS satellite-based aerosol optical depth (AOD) at an urban site in Hanoi, Vietnam. Environ. Sci. Pollut. Res. 2022, 29, 41971–41982. [Google Scholar] [CrossRef]
  66. Nguyen, D.L.; Hieu, B.T.; Vy, V.H.; Thuy, P.T. Studying the optical and physical properties of aerosol in an urban area of Hanoi City. Version B Vietnam. J. Sci. Technol. 2022, 64, 1–6. [Google Scholar] [CrossRef]
  67. Trung, B.Q.; Nguyen, D.L.; Hieu, B.T.; Dat, M.V.; Duy, N.V.; Chinh, P.M.; Viet, H.T. Evaluating concentration of element and carbon in atmospheric PM10 measured in an urban area in Hanoi during summer 2020. J. Sci. Technol. Civ. Eng. STCE-HUCE 2021, 15, 62–70. [Google Scholar] [CrossRef]
  68. Trung, B.Q.; Nguyen, D.L.; Hieu, B.T.; Dat, M.V.; Duy, N.V.; Chinh, P.M.; Viet, H.T.; Hoa, H.X. Evaluating ionic and carbonaceous species in fine particle PM2.5 measured during winter in an urban area in Hanoi. J. Sci. Technol. Civ. Eng. STCE-HUCE 2022, 16, 54–64. [Google Scholar] [CrossRef]
  69. Ngoc, B.A.P.; Delbarre, H.; Deboudt, K.; Dieudonné, E.; Tran, D.N.; Thanh, S.L.; Pelon, J.; Ravetta, F. Key factors explaining severe air pollution espisodes in Hanoi during 2019 winter season. Atmos. Pollut. Res. 2021, 12, 101068. [Google Scholar] [CrossRef]
Figure 1. Study area and sampling site for PM2.5 measurement in Hanoi, Vietnam.
Atmosphere 13 01911 g001
Figure 2. PM2.5 daily mean concentration and meteorological conditions for the summer and winter periods.
Atmosphere 13 01911 g002
Figure 3. Daily PM2.5 chemical composition measured at the sampling site for the summer and winter periods.
Atmosphere 13 01911 g003
Figure 4. Daily variation of EC, OC, POC, and SOC concentration for the summer and winter periods.
Atmosphere 13 01911 g004
Figure 5. Daily variation of NO3/SO42− and OC/EC mass ratio for the summer and winter periods.
Atmosphere 13 01911 g005
Figure 6. Spatial pattern of concentration of key chemical compositions in PM2.5 in relation to wind direction during: (a) summer period; (b) winter period (for interpretation of the references to color in this figure legend, the reader is referred to the web version of this article).
Atmosphere 13 01911 g006
Figure 7. MODIS cumulative fire radiative power over the Southeast Asian region and three-day air mass backward trajectories (indicated by the black curves) arrived at the sampling site in Hanoi during the summer period (July 2020) and winter period (January 2021).
Atmosphere 13 01911 g007
Table 1. Statistical summary of daily PM2.5 measurement and meteorological conditions.
Mean ± Standard Deviation (Range)
SummerWinterAll Data
PM2.5 and its chemical compositions (µg m−3)
PM2.540.20 ± 15.36 (19.79–69.92)122.90 ± 50.88 (49.83–220.41)80.37 ± 55.63 (19.79–220.41)
F0.12 ± 0.02 (0.05–0.14)0.02 ± 0.009 (0.008–0.039)0.07 ± 0.05 (0.008–0.14)
Cl0.21 ± 0.20 (0.03–2.06)2.19 ± 1.04 (0.54–4.49)1.17 ± 1.28 (0.03–4.49)
NO30.85 ± 1.24 (0.14–4.86)0.018 ± 0.009 (0.005–0.043)0.44 ± 0.47 (0.01–4.86)
SO42−3.63 ± 2.60 (0.87–10.44)10.28 ± 7.41 (1.71–27.17)6.86 ± 6.37 (0.87–27.17)
Na+0.31 ± 0.07 (0.20–0.45)0.21 ± 0.09 (0.08–0.39)0.26 ± 0.09 (0.08–0.45)
NH4+1.45 ± 1.32 (0.32–4.98)4.05 ± 2.60 (0.74–10.42)2.71 ± 2.40 (0.32–10.42)
K+0.41 ± 0.25 (0.10–1.12)1.04 ± 0.52 (0.37–1.90)0.72 ± 0.51 (0.10–1.90)
Mg2+0.09 ± 0.10 (0.03–0.47)0.06 ± 0.03 (0.01–0.11)0.07 ± 0.07 (0.01–0.47)
Ca2+0.47 ± 0.25 (0.19–0.98)0.47 ± 0.20 (0.17–0.88)0.47 ± 0.22 (0.17–0.98)
EC1.34 ± 0.77 (0.27–2.79)2.40 ± 0.90 (1.07–3.96)1.85 ± 0.98 (0.27–3.96)
OC11.85 ± 6.43 (4.74–28.20)30.20 ± 12.01 (12.80–52.07)20.76 ± 13.23 (4.74–52.07)
Trace elements (*)1.98 ± 0.78 (0.82–3.69)1.25 ± 0.49 (0.29–2.20)1.62 ± 0.74 (0.29–3.69)
Meteorology
Wind speed (m/s)2.46 ± 0.73 (1.29–3.41)1.88 ± 0.69 (1.02–3.28)2.18 ± 0.76 (1.02–3.41)
Boundary layer height (m)563.93 ± 143.71 (296.77–745.62)447.12 ± 167.48 (215.94–840.02)507.19 ± 164.42 (215.94–840.02)
Ambient temperature (°C)31.32 ± 1.19 (29.01–33.09)15.51 ± 2.95 (10.24–21.39)23.64 ± 8.31 (10.24–33.09)
Relative humidity (%)74.91 ± 5.91 (65.06–86.01)70.36 ± 12.51 (49.63–86.96)72.70 ± 9.82 (49.63–86.96)
Note: (*) Trace elements including Al, Ti, V, Cr, Mn, Fe, Co, Ni, Cu, Zn, Sr, Mo, Ag, Cd, Sb, Ba, Pb.
Table 2. Comparison of PM2.5 concentrations in this study and other studies.
Location, CountryType of Sampling SiteStudy PeriodPM2.5 Concentration
(µg m−3)
References
Kampar, MalaysiaSemi-UrbanAugust–October 201555.89[18]
Kuala Lumpur, MalaysiaUrbanJune 2015–January 2016 [19]
-Pre-haze period24.5 ± 12.0
-Haze period72.3 ± 38.0
-Post-haze period14.3 ± 3.58
Johor Bahru, MalaysiaSuburbanAugust 2017–January 2018 (Southwest monsoon)21.85[20]
Johor Bahru, MalaysiaUrbanJanuary–March 201926.28 ± 4.32[21]
SingaporeUrbanNovember 2015–February 201613.02 ± 2.73[22]
Bangkok, ThailandUrbanAugust 2017–March 201877.0 ± 21.2[23]
Bandung, IndonesiaUrbanMay 2012–December 201718 ± 8[24]
Ho Chi Minh, VietnamUrban roadsideMarch 2017–March 201836.3 ± 13.7[25]
Shanghai, ChinaUrbanMay 2018–March 201939.35 ± 35.74[26]
Beijing, ChinaUrbanDecember 2018–November 201966.58 ± 60.17[27]
Chiang Mai, ThailandUrbanMarch–April 2016
(Smoke haze period)
65.3 ± 17.6[28]
Chandigarh, IndiaUrbanOctober–November 2015
(Haze period)
161.7[29]
Delhi, IndiaUrbanJanuary 2015–December 2016135 ± 64[30]
Varanasi, IndiaUrban99 ± 33
Kolkata, IndiaUrban116 ± 38
Hanoi, VietnamUrbanJuly 2020 and January 202180.37This study
Table 3. Pearson correlation coefficients among PM2.5 chemical compositions measured during the summer and winter periods.
PM2.5FClNO3SO42−Na+NH4+K+Mg2+Ca2+OCEC
Summer
PM2.51.000−0.1670.5720.5980.454−0.3160.4760.3290.4360.0010.7250.689
F 1.0000.1870.142−0.0140.3270.0720.292−0.2080.077−0.072−0.086
Cl 1.0000.9600.6770.1510.8160.5500.2980.0120.6310.519
NO3 1.0000.7420.1800.8400.3490.5340.0560.6600.450
SO42− 1.000−0.1110.9730.2860.585−0.4090.8290.536
Na+ 1.000−0.043−0.118−0.0540.509−0.406−0.526
NH4+ 1.0000.4190.493−0.3450.8240.574
K+ 1.000−0.395−0.3690.4650.717
Mg2+ 1.0000.0520.5230.145
Ca2+ 1.000−0.477−0.538
OC 1.0000.856
EC 1.000
Winter
PM2.51.0000.7930.6490.0740.9500.6370.9140.8640.7870.6410.8350.387
F 1.0000.601−0.0130.7560.5950.7740.7060.6860.4770.7430.176
Cl 1.0000.6040.7300.8910.7580.6490.8620.8670.5760.777
NO3 1.0000.1790.4330.1850.2530.5150.5390.2280.624
SO42− 1.0000.7040.9830.8880.8360.7700.7580.491
Na+ 1.0000.7560.5800.8170.7080.4170.538
NH4+ 1.0000.8600.8140.7800.7110.477
K+ 1.0000.8180.7300.8350.404
Mg2+ 1.0000.8370.6820.545
Ca2+ 1.0000.5410.769
OC 1.0000.449
EC 1.000
Table 4. Pearson correlation coefficients among PM2.5, PM2.5 chemical compositions, and meteorological parameters.
Relative HumidityWind SpeedBoundary Layer HeightAmbient Temperature
SummerWinterSummerWinterSummerWinterSummerWinter
PM2.50.3830.548−0.701−0.775−0.749−0.799−0.4830.462
Cl0.4880.401−0.513−0.748−0.584−0.769−0.6020.371
NO30.551−0.040−0.518−0.352−0.574−0.339−0.6520.092
SO42−0.7510.577−0.633−0.793−0.665−0.794−0.7430.484
Na+−0.1070.6590.368−0.7530.493−0.8190.2060.601
NH4+0.7200.644−0.616−0.817−0.675−0.839−0.7450.565
K+−0.0420.438−0.285−0.743−0.410−0.766−0.0730.440
Mg2+0.4560.512−0.331−0.750−0.343−0.776−0.4670.473
Ca2+−0.0850.3790.025−0.5820.158−0.6470.1110.282
OC0.5120.128−0.656−0.704−0.805−0.688−0.6030.294
POC0.171−0.087−0.478−0.449−0.685−0.411−0.348−0.065
SOC0.7190.182−0.626−0.586−0.655−0.585−0.6800.358
EC0.171−0.087−0.478−0.449−0.685−0.411−0.348−0.065
Publisher’s Note: MDPI stays neutral with regard to jurisdictional claims in published maps and institutional affiliations.

