Article

UAV Inspection of Compliance of Fuel Sulfur Content of Sailing Ships in the Pearl River Delta, China

Laboratory of Environmental Protection in Water Transport Engineering, National Engineering Research Center of Port Hydraulic Construction Technology, Tianjin Research Institute for Water Transport Engineering, M.O.T., Tianjin 300456, China
*
Author to whom correspondence should be addressed.
Atmosphere 2022, 13(11), 1894; https://doi.org/10.3390/atmos13111894
Submission received: 17 October 2022 / Revised: 4 November 2022 / Accepted: 9 November 2022 / Published: 12 November 2022
(This article belongs to the Special Issue Atmospheric Shipping Emissions and Their Environmental Impacts)

Abstract

:
Air pollutants emitted by ships are one of the major causes of global environmental and human health problems, especially for sulfur oxides (SO2). In this study, a mini-sniffing sensor was mounted on the unmanned aerial vehicle (UAV) to monitor the concentration relationship between CO2 and SO2 in the exhaust gas of sailing ships, then the sulfur content of the ship’s fuel oil was estimated to evaluate the compliance of the fuel sulfur content (FSC) with IMO regulations. In the experiment, the measurement results of the exhaust gas of sailing ships in the Pearl River Delta were presented, the data set from February to April 2022 was provided, and 445 ships were comprehensively analyzed from the perspectives of ship length and ship type. From the experimental results, considering the error of the sensor, the compliance rate of the FSC of sailing ships entering and leaving the Pearl River reached 93.7%. To some extent, the current situation for meeting the 0.5% (m/m) limit is basically optimistic. The results represent the effectiveness of DECA policy implementation. This paper demonstrates the effectiveness and reliability of the UAV monitoring method in monitoring emissions from ships, and in more effectively monitoring the impact of shipping on air quality. Furthermore, an accurate and non-contact monitoring method is proposed, which can allow law enforcement officers to judge in advance whether the ships sailing is suspected of illegally using high-sulfur fuels. It can improve the efficiency of law enforcement and reduce the cost of supervision.

1. Introduction

With the rapid development of ship transportation, air pollution has become the most challenging environmental issue in the shipping industry. SO2 is one of the important air pollutants and is also considered a non-negligible component of ship emissions [1,2]. SO2 can participate in atmospheric chemical reactions to produce aerosols and acid rain, which have a negative impact on air quality, climate system, and human health, as well as lead to the acidification of terrestrial and marine ecosystems [3,4]. Ships move approximately 80% of the world’s goods. When compared to other forms of transportation, marine shipping is the most energy-efficient way to move large volumes of cargo. While essential to the world’s economy and well-being, the commercial marine shipping industry is a major contributor to global air pollution. SO2 is the most significant contributor to the strength of air pollutants in port areas (National Institute of Environmental Research (NIER), 2021). Ship-source pollutants most closely linked to climate change and public health impacts include carbon dioxide (CO2), nitrogen oxides (NOx), sulphur oxides (SOx) and particulate matter [5]. Regarding sulfur dioxide (SO2) and nitrogen dioxide (NO2) emissions as percentages of total global air emissions, shipping accounts for 18–30% of the nitrogen oxide, and 9% of the sulfur oxides. From 2002–2018, CO2 emissions increased from 962 million tons to 1056 million tons, which constitutes an increase of about 9.3% (actually 9.8%), and the global proportion of emissions increased from 2.76% to 2.89%. Global SO2 emissions rose since 2013, with a peak of 10 megatons reached in 2017. While the SO2 emissions of MDO have declined since 2015 as a result of ECA regulations, the average Sulphur content of HFO increased, causing the total SO2 emissions to increase, and sulfur oxide (SOx) emissions increased by 5.5% [6]. Even with emission reduction regulations, it is estimated that SO2 emissions from ships will lead to the premature deaths of up to 250,000 people worldwide every year [7].
China not only has the world’s busiest inland navigation system, but also has a long coastline connecting more than 50 coastal ports. Inland and coastal shipping, as well as port networks play a key role in supporting trade and promoting economic growth in inland and coastal cities. Shipping activity in China has grown substantially since the turn of the century, keeping pace with the country’s rapid economic growth. From 2002 to 2018, freight turnover at inland ports increased nine-fold, coastal ports increased six-fold, and freight transported through seaports more than quadrupled. In China, in major port cities in the Yangtze and Pearl River deltas, shipping emissions have become one of the main sources of local air pollution. Pollutants emitted by ships play important roles in air quality, human health, and climate [8,9,10]. They not only affect air quality in coastal areas, but even in inland areas hundreds of kilometers away from emission sources [11].
In October 2019, the “2020 Implementation Plan for the Global Marine Fuel Sulfur Restriction Order” was officially released with the decision to implement the regulation that the sulfur content of marine fuel oil should not exceed 0.5% (m/m) after 1 January 2020. Developed countries in Europe and the United States were the first to set up a ship emission control area for air pollutants (ECA) with stricter implementation standards. Since 2015, ships entering the ECA have been required to use fuel oil with a sulfur content of no more than 0.1% (m/m) [12,13]. To control air pollution from ships, China implemented a Domestic Emission Control Area (DECA) in 2016, including the Pearl River Delta (PRD), the Yangtze River Delta (YRD), and the Bohai Rim (Beijing-Tianjin-Hebei region) [14]. The DECA regulations initially required ships to use fuel with a sulfur content of no more than 0.5% (m/m) when berthing at major Chinese ports, and were later expanded to include all ships operating in the three DECA areas. In 2019, the scope of application of the DECA regulations was further expanded, and all ships sailing in China’s territorial waters were required to use fuel with a sulfur content of no more than 0.5%. In addition, since 1 January 2020, regional ocean-going ships designated in the inland river DECA on the Yangtze and Xijiang (a tributary of the Pearl River) must use fuel with a sulfur content of no more than 0.1% (m/m); since 2022, ocean-going ships sailing in Hainan waters must also use fuel with a sulfur content of no more than 0.1% (m/m) [15].
With the improvement of laws and regulations, the level of ship fuel compliance has increased. However, the main issue is still how to effectively monitor compliance with the FSC. At present, the main means of monitoring the sulfur content of ships’ fuel oil is through boarding sampling and testing. During the time when the ship is in port, maritime law enforcement officers board the ship to take oil samples from designated locations, and use a rapid fuel oil sulfur content detector to check whether the fuel oil meets the requirements. If there is any doubt, the oil samples can be sent to a qualified laboratory for laboratory analysis. The results of laboratory analysis can verify the compliance of ships’ FSC and impose administrative penalties on non-compliant ships if necessary. However, the detection efficiency of this inspection method is low, and most inspections are blind and ineffective, and cannot supervise ships underway. Therefore, there is an urgent need for an efficient, accurate, non-contact monitoring method, which can help maritime law enforcement officers to determine whether a ship is suspected of illegally using high-sulfur oil before boarding inspection. That is, the technology for estimating the FSC by remote measurement of ship exhaust is needed. It can effectively solve the blind spot of ship supervision, identify whether the ship exhaust after-treatment device is activated, and greatly reduce supervision costs.
Remote sensing technology has the advantages of fast detection speed, simple operation, and a high degree of automation. In this paper, small-sized sniffer technology was used to measure the exhaust gas of sailing ships, and then monitor the compliance with the FSC. In this study, a mini-sniffing sensor was mounted on the UAV to monitor the concentration relationship between CO2 and SO2 in the exhaust gas of ships, so as to evaluate the compliance of the FSC with the IMO regulations. The experiment comprehensively analyzed the exhaust gas data of 445 ships, and effectively evaluated the compliance rate of the sulfur content of ships entering and leaving the Pearl River.

2. Methodology

2.1. Measurement Site

The Pearl River is the second largest river and the third longest river in China. At the end of 2020, there were 32 inland ports, with about 1700 berths for production. The port’s annual comprehensive throughput capacity is 624 million tons, of which the annual container throughput capacity is 17.47 million TEU. It has about 15,000 inland waterway ships, and the average deadweight of cargo ships is about 1400 tons. At the end of 2020, the navigable mileage of inland waterways was 15,764.3 km, accounting for 12.3% of the total mileage of inland waterways in China. Among them, the mileage of waterways above grade level was 10,335.7 km, accounting for 65.6% of the total mileage of inland waterways.
As shown in Figure 1, ship exhaust monitoring was conducted on the east bank of the Pearl River Channel, which is near Nansha Bridge. The area here is open; it is about 1 km away from the upward channel and 0.6 km away from ships in the downward channel, which meet the requirements of UAV telemetry for ship exhaust, and can monitor ships entering and leaving Guangzhou Port and Dongguan Port at the same time. The monitoring location area is rural, with vast land and sparse population, and there is no obvious source of air pollution. Therefore, the location of monitoring points is relatively low for CO2 and SO2.

2.2. Measurement Method

The state-of-the-art techniques which are currently in use all over the world include highly sensitive sniffer techniques [16,17,18,19], small-sized sniffer techniques [20], and optical remote sensing techniques [21,22,23]. These technologies are used to remotely measure the FSC of by-passing vessels. Small sniffer-sized technology was used to measure the exhaust gas of ships in this paper.
The sniffing method realizes the non-contact detection of the characteristics of the object itself that release flavor in the distance by smelling. In this paper, the sniffing method was used to estimate the FSC by monitoring the exhaust gas composition of sailing ships, which helps the maritime department to identify suspected ships that use high-sulfur oil in the emission control area without boarding the ship.
The sniffing method is based on three hypotheses: First, the carbon content in the fuel oil of ships with different sulfur content is not very different, and they are all about 87%; Second, most of the C and S elements in the oil are burned to generate CO2 and SO2, and the proportions of other carbon oxides and sulfates can be ignored; thirdly, CO2 and SO2 are diluted with wind diffusion, but the ratio remains unchanged, and the difference in sedimentation rate caused by molecular weight difference can be ignored in the process of wind diffusion.
Hypothesis 1 postulates that there is more oil testing data to support, and the reason why oil can burn is because C and H elements account for more than 95% of its content [24].
Hypothesis 2 comes from the material balance formula, which is established during the short-term diffusion process when the exhaust gas has not been fully integrated into the background. In the sulfur oxides produced by combustion, SO2 accounts for more than 95% [25], and the amount of insufficient combustion accounts for only a very small amount after combustion [26].
Hypothesis 3 is based on the basic common sense of dry deposition research of atmospheric components, that is, dry deposition is often a phenomenon dominated by meteorological factors at large space-time scales [27], and does not need to be considered at the hour-space scale; SO2 is converted to sulfate at a rate of 20–30% per hour, but the loss is still very small in the first few minutes. Based on the above three hypotheses, the CO2 and SO2 concentrations of the exhaust gas can be simultaneously measured somewhere downwind of the ship, and the sulfur content in the oil can be reversed.
The theoretical basis is that the carbon content in marine fuel oil is 87 ± 1.5%, and most of the elements, such as sulfur and carbon in the fuel oil, are converted into gases, such as SO2 and CO2, after combustion [28,29,30]. By monitoring the concentration ratio of SO2 and CO2 in the exhaust gas, it can be judged whether the fuel sulfur content exceeds the standard 0.5% (m/m). The FSC mass percent can be calculated as follows:
F S C ( % ) = S ( k g ) F u e l ( k g ) = M ( S ) g / m o l × ( S O 2 S O 2 , b k g ) d t ( p p b ) M ( C ) g / m o l 0.87 × ( C O 2 C O 2 , b k g ) d t ( p p m ) = ( S O 2 S O 2 , b k g ) d t ( p p b ) ( C O 2 C O 2 , b k g ) d t ( p p m ) × 0.232 %
where A (S) is the relative atomic mass of sulfur, and A (C) is the relative atomic mass of carbon. Using this Formula (1), it is relatively simple to calculate the FSC for each set of peaks.

2.3. Instrumentation

Using electrochemical (EC) and small-sized non-dispersive infrared (NDIR) sensors, a smaller, lighter, and lower energy consuming sniffer system was achieved. The system was small enough to be used as a payload for unmanned aerial vehicles (UAVs).
As shown in Figure 2. The DJI Phantom 4 Pro V2.0 UAV was purchased from SZ DJI Technology Co., Ltd., Shenzhen, China. It was used as the flight carrier of the mini-sniffing sensor. The mini-sniffing sensor mainly included a SO2 and CO2 sensor, a power supply module, a processor, and a communication module. The concentrations of SO2 and CO2 were continuously measured using separate sensors, which were combined in a small carbon fiber box to ensure stable measurement conditions while providing a compact and portable setup. SO2 and CO2 were measured with an electrochemical sensor and non-dispersive infrared sensor from Shenzhen Singoan Electronic Technology Co., Ltd., Shenzhen, China.
For SO2: SGA-700B-SO2 is a high-precision diffuse sulfur dioxide sensor based on the electrochemical method. The principle of the electrochemical SO2 sensor is measured by reacting with SO2 gas and generating an electrical signal proportional to the gas concentration. The detection range of the SO2 sensor is 0–1 ppm, the detection accuracy is 10 ppb, and the response time T90 is less than 30 s.
For CO2: SGA-700B-CO2 is a high-precision diffuse carbon dioxide sensor based on the non-dispersive infrared method. The selected CO2 sensor has a detection range of 0–2000 ppm, a detection accuracy of 5 ppm, a response time T90 of less than 30 s.

3. Results and Discussion

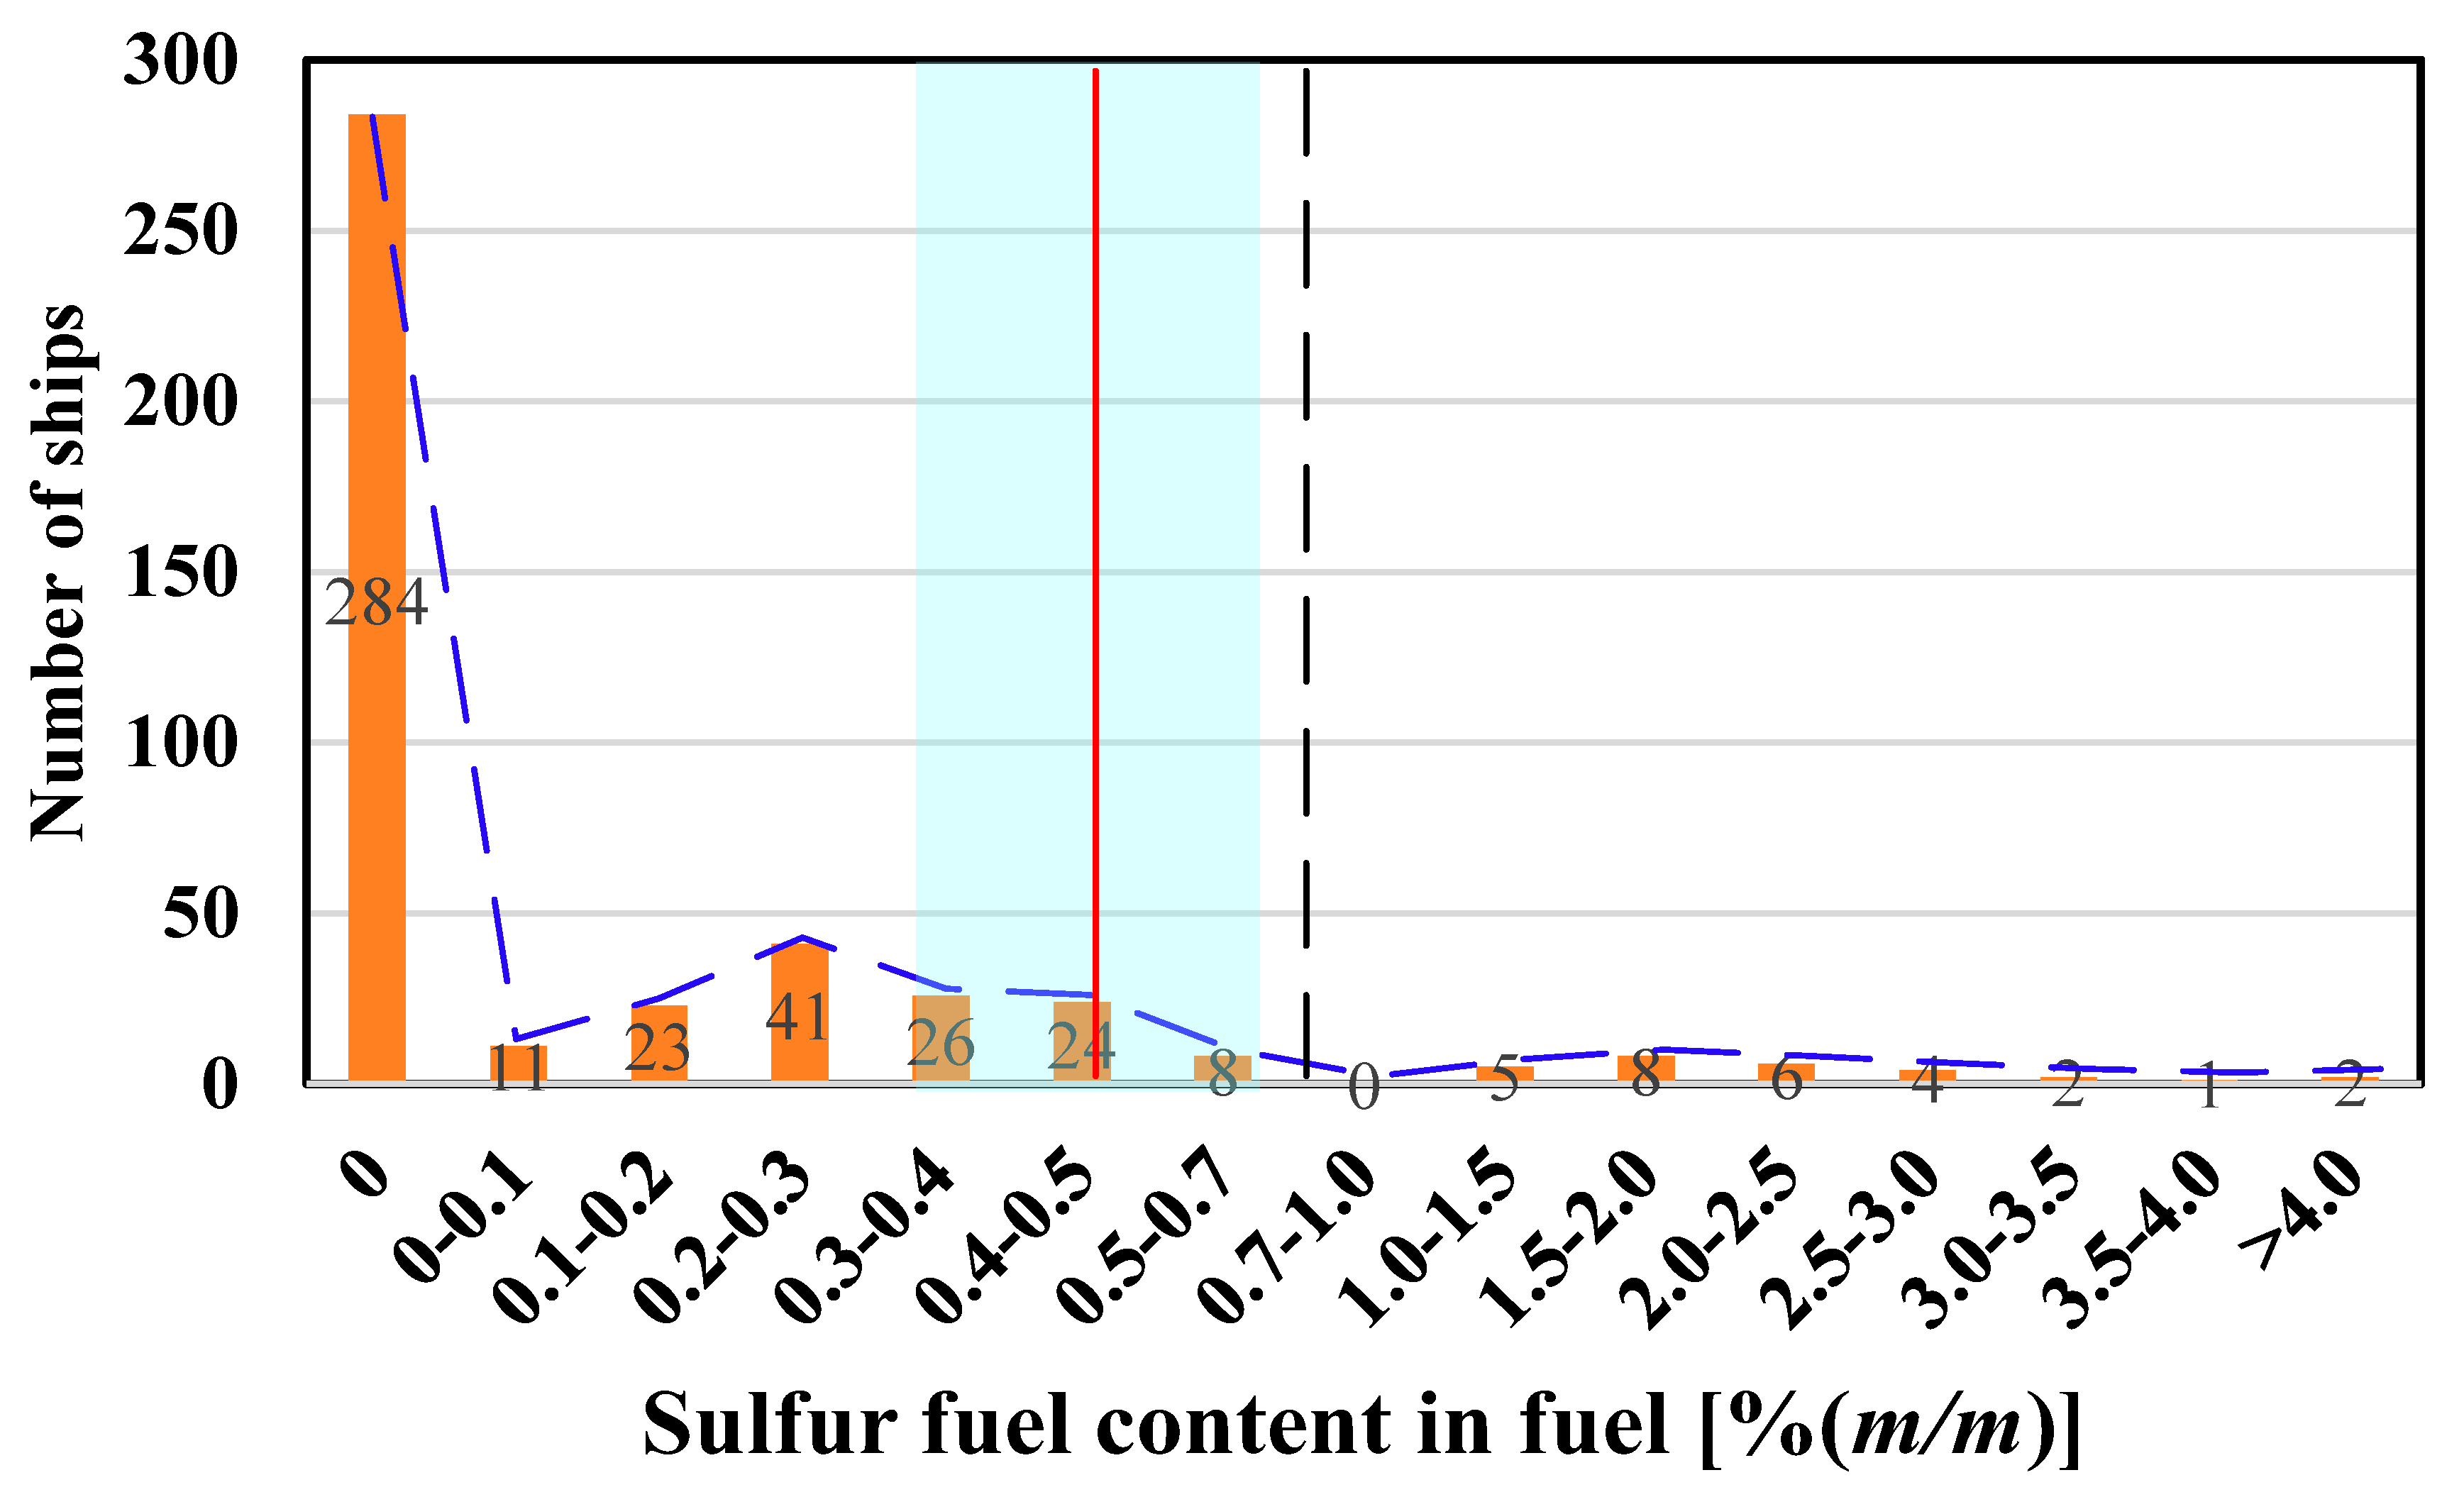
3.1. Analysis of Monitoring Results in Pearl River Delta

In the experiment, 445 ships were observed in Pearl River waters. 28 possible offending ships were reported to local maritime authorities. Among them, five ships were inspected and fuel samples were collected, and the final laboratory results were all confirmed to exceed the standard 0.5% (m/m). Figure 3 shows the statistical distribution of the FSC of 445 measured ships. The blue dotted line represents the FSC distribution trend of all measured ships, the red line represents the limit of 0.5% (m/m), and the shaded area represents the upper limit uncertainty of 20%. The black dotted line is the estimated non-compliance FSC limit of 0.7% (m/m), which takes into account the error (accuracy and deviation) of the sensor. Among all the ships measured, 284 ships used diesel fuel oil (DFO), 133 ships used low sulfur fuel oil (LSFO), and 28 ships used high sulfur fuel oil (HSFO). It can be seen from Figure 3 that the FSC of the ships using HSFO far exceeded the 0.5% (m/m) limit.
Figure 4 shows the distribution of the number of ships exceeding the corresponding FSC threshold and the level of fuel compliance for all monitored ships. In Figure 4, the X-axis represents the FSC range of all tested ships, the blue curve represents the number of ships whose FSC is greater than the corresponding threshold, and the red curve represents the compliance rate level of all tested ships whose FSC is less than the corresponding threshold. According to the different FSC thresholds, different compliance levels could be obtained. If an FSC threshold of 0.5% (m/m) was used, 37 non-compliant ships were observed, corresponding to a compliance level of 92% and a non-compliance level of 8%. Accounting for sensor error (accuracy and bias), if the FSC threshold of 0.7% (m/m) was used, which seemed to be the more correct approach, 28 ships were found to be non-compliant, which corresponded to a compliance level of 93.7% and a non-compliance level of 6.3%. A global cap on the FSC in marine fuel was reduced to 0.5% (m/m) in 2020 and has already been implemented in China. According to our monitoring results, to some extent, the current situation for meeting the 0.5% (m/m) limit is basically optimistic. Compared with the monitoring results of Wvr et al. in the Belgian North Sea area, the compliance rate was 92% [31], which is basically similar to the monitoring results in the Pearl River Delta in this paper. The results represent the effectiveness of the DECA policy implementation, and can reflect the achievements of international ports around the world after the implementation of ECA.

3.2. Analysis of Monitoring Results of Different Ship Lengths

A total of 445 ships were monitored, and the lengths of all ships tested were divided into 6 intervals: 60–80 m, 80–120 m, 120–160 m, 160–200 m, 200–240 m, and 240–280 m.
The comparison of compliance levels between ship lengths is shown in Figure 5. The length of the ship in steps of 40 m is color coded in Figure 5. It can be seen from Figure 5 that ships with lengths less than 80 m basically did not use fuel with a sulfur content higher than 0.5% (m/m), which was likely because their engines could not handle HSFO. The FSC of 28 ships was suspected of violating IMO regulations; 25 ships were 80–120 m in length, 2 ships were 120–160 m in length, and 1 ship was 200–240 m in length. It can be concluded that the violation rate of small seagoing ships was high, and most of the violation ships were about 80–160 m long, which provides a general direction for MLE in the future.

3.3. Analysis of Monitoring Results of Different Ship Types

The ship type of the monitored ships was mainly divided into cargo ships, tankers and container ships. The comparison of compliance levels between ship types is shown in Figure 6. A total of 445 ships were monitored in the experiment, including 244 cargo ships, 159 tankers, and 42 container ships. 28 ships were suspected of violating fuel sulfur content regulations. Among them, 23 were cargo ships, 4 were tankers and 1 was a container ship. When comparing compliance levels between cargo ships, tankers, and container ships, a relatively higher level of non-compliance was observed for cargo ships, while the violation rate of container ships was the lowest. It can be concluded that the probability of exceeding 0.5% (m/m) of FSC for cargo ships was very high.

4. Conclusions

In this study, the UAV telemetry system based on the sniffing method was adopted to monitor the compliance of sailing ships with FSC regulations. The experiment was conducted using UAV measurements of ship exhaust in the vicinity of the Nansha Bridge in the waters of the Pearl River, and provided a large dataset of 445 ship plumes. The exhaust gas data of 445 ships were comprehensively analyzed from the perspectives of ship length and ship type. The experimental data showed that the FSC of the vast majority (92%) of all ships measured did meet the new regulation of 0.5% (m/m). Therefore, effective inspection of these 8% of non-compliant ships was critical to ensure maximum compliance with emission limits. Compared with the monitoring results of Hu et al. in the North Sea region of Belgium, the compliance level was basically similar to that of the monitoring in the Pearl River Delta in this paper. Compared with the monitoring results of Wvr et al. in the Belgian North Sea area, the compliance rate was basically similar to that of the monitoring in the Pearl River Delta. The results represent the effectiveness of DECA policy implementation.
So far, the UAV-based measurement method has not been used as legal evidence, but merely for port inspection of suspected offending ships. This paper demonstrates that the monitoring UAV sniffer method for sulfur emission measurement was scientifically proved and reliable. By setting a reasonable confidence interval, the high-quality measurement of ship exhaust may be used as legal evidence for administrative punishment at some time in the future.
In summary, this technology can not only solve the blind spots of traditional supervision means, but can also improve the efficiency of law enforcement, as well as reduce costs. In addition, the measured data of suspected ships can also be used in the future to establish a list of suspected ships for the Maritime Safety Administration in order to narrow the scope of inspection. In the future, SO2 emission reduction will be promoted by strengthening the regulatory capacity and reducing the violation rate.

Author Contributions

J.H. designed the study and authored the article. M.D. and Z.Q. analyzed the experimental data. M.D. and J.H. contributed to the experiments. J.H. contributed to setting instruments. M.D., S.P., and J.H. provided constructive comments on this research. All authors have read and agreed to the published version of the manuscript.

Funding

This research was supported by the Central Government Guides Local Science and Technology Development Funds (22ZYQYGX00140), the joint research on the ecological intelligent monitoring and impact assessment of inland waterway engineering (grant no. 2019YFE0121000), the Sino-UAE Joint Laboratory of Green and Ecological Port Construction Technology (grant no. 2022YEE0113500), and the Fundamental Research Funds for the Central Public Welfare Research Institutes (TKS20220206).

Institutional Review Board Statement

Not applicable.

Informed Consent Statement

Informed consent was obtained from all subjects involved in the study. Written informed consent was obtained from the subjects to publish this paper.

Data Availability Statement

The data presented in this study are available upon request from the corresponding author. The data are not publicly available due to privacy.

Acknowledgments

The authors thank Shitao Peng and Mengtao Deng for their support in the process of paper writing and experimentation.

Conflicts of Interest

The authors declare no conflict of interest.

References

  1. Eyring, V.; Isaksen, I.; Berntsen, T.; Collins, W.; Corbett, J.; Endresen, O.; Grainger, R.; Moldanova, J.; Schlager, H.; Stevenson, D. Transport impacts on atmosphere and climate: Shipping. Atmos. Environ. 2010, 44, 4735–4771. [Google Scholar] [CrossRef]
  2. Matthias, V.; Bewersdorff, I.; Aulinger, A.; Quante, M. The contribution of ship emissions to air pollution in the North Sea regions. Environ. Pollut. 2010, 158, 2241–2250. [Google Scholar] [CrossRef] [PubMed] [Green Version]
  3. Berglen, T.F.; Bernsten, T.K.; Isaksen, I.S.A.; Sundet, J.K. A global model of the coupled sulfur/oxidant chemistry in the troposphere: The sulfur cycle. J. Geophys. Res. Atmos. 2004, 109, D19. [Google Scholar] [CrossRef]
  4. Seinfeld, J.H.; Pandis, S.N. Atmospheric Chemistry and Physics: From Air Pollution to Climate Change, 2nd ed.; John Wiley and Sons: New York, NY, USA, 2006. [Google Scholar]
  5. World Health Organization. Ambient Air Pollution: Health Impacts. Health Risks; World Health Organization: Geneva, Switzerland, 2018.
  6. Jasper Shinichi, H.; Zhang, S.; Paula, P.; Bryan, C.; Elena, H.; Wendela, S.V.D.L.; Tristan, S.; Zhang, Y.; Hiroyuko, K.; Masaki, A.; et al. Fourth IMO GHG Study 2020: Full Report; International Maritime Organization: London, UK, 2020. [Google Scholar]
  7. Sofiev, M.; Winebrake, J.J.; Johansson, L.; Carr, E.W.; Prank, M.; Soares, J.; Vira, J.; Kouznetsov, R.; Jalkanen, J.P.; Corbett, J.J. Cleaner fuels for ships provide public health benefits with climate tradeoffs. Nat. Commun. 2018, 9, 406. [Google Scholar] [CrossRef] [Green Version]
  8. Lai, H.K.; Tsang, H.; Chau, J.; Lee, C.H.; McGhee, S.M.; Hedley, A.J.; Wong, C.M. Health impact assessment of marine emissions in Pearl River Delta region. Mar. Pollut. Bull. 2013, 66, 158–163. [Google Scholar] [CrossRef]
  9. Liu, H.; Fu, M.; Jin, X.; Shang, Y.; Shindell, D.; Faluvegi, G.; Shindell, C.; He, K. Health and climate impacts of ocean-going vessels in East Asia. Nat. Clim. Change. 2016, 6, 1037–1041. [Google Scholar] [CrossRef]
  10. Yang, D.; Kwan, S.; Lu, T.; Fu, Q.; Cheng, J.; Streets, D.G.; Wu, Y.; Li, J. An emission inventory of marine vessels in shanghai in 2003. Environ. Sci. Technol. 2007, 41, 5183–5190. [Google Scholar] [CrossRef]
  11. Lv, Z.; Liu, H.; Ying, Q.; Fu, M.; Meng, Z.; Wang, Y.; Wei, W.; Gong, H.; He, K. Impacts of shipping emissions on PM2.5 pollution in China. Atmos. Chem. Phys. 2018, 18, 15811–15824. [Google Scholar] [CrossRef] [Green Version]
  12. IMO: Revised MARPOL Annex IV. 2008. Available online: https://www.bahamasmaritime.com/wp-content/uploads/2021/12/MN059-MARPOL-Annex-IV-Sewage-Pollution-Prevention-v1.0.pdf (accessed on 1 November 2022).
  13. International Maritime Organization (IMO): Sulphur Oxides (SOx) and Particulate Matter (PM)–Regulation 14. 2016. Available online: https://www.imo.org/en/OurWork/Environment/Pages/Sulphur-oxides-(SOx)-%E2%80%93-Regulation-14.aspx (accessed on 1 November 2022).
  14. MOT. Implementation of the Ship Emission Control Area in Pearl River Delta, the Yangtze River Delta and the Bohai Rim (Beijing–Tianjin–Hebei Area), Ministry of Transport, C., Beijing, China, 2015. Available online: http://www.gov.cn/xinwen/2015-12/04/content_5019932.htm (accessed on 1 November 2022).
  15. MOT. Implementation Scheme of the Domestic Emission Control Areas for Atmospheric Pollution from Vessels, Ministry of Transport, C., Beijing, China, 2018. Available online: https://www.msa.gov.cn/public/documents/document/mte1/odi2/~edisp/20190124115826051.pdf (accessed on 1 November 2022).
  16. Kattner, L.; Mathieu-üffing, B.; Burrows, J.P.; Richter, A.; Schmolke, S.; Seyler, A.; Wittrock, F. Monitoring compliance with sulfur content regulations of shipping fuel by in situ measurements of ship emissions. Atmos. Chem. Phys. 2015, 15, 10087–10092. [Google Scholar] [CrossRef] [Green Version]
  17. Alföldy, B.; Lööv, J.B.; Lagler, F.; Mellqvist, J.; Berg, N.; Beecken, J.; Weststrate, H.; Duyzer, J.; Bencs, L.; Horemans, B.; et al. Measurements of air pollution emission factors for marine transportation in SECA. Atmos. Meas. Tech. 2013, 6, 1777–1791. [Google Scholar] [CrossRef]
  18. Balzani Lööv, J.M.; Alfoldy, B.; Gast, L.F.L.; Hjorth, J.; Lagler, F.; Mellqvist, J.; Beecken, J.; Berg, N.; Duyzer, J.; Westrate, H.; et al. Field test of available methods to measure remotely SOx and NOx emissions from ships. Atmos. Meas. Tech. 2014, 7, 2597–2613. [Google Scholar] [CrossRef] [Green Version]
  19. Mellqvist, J.; Ekholm, J.; Beecken, J.; Salo, K. Identification of gross polluting ships to promote a level playing field within the shipping sector. In Final Report to Vinnova (2008-03884), Technical Report, Earth and Space Sciences; Chalmers University of Technology: Göteborg, Sweden, 2014. [Google Scholar]
  20. Anand, A.; Wei, P.; Gali, N.K.; Sun, L.; Yang, F.; Westerdahl, D.; Zhang, Q.; Deng, Z.; Wang, Y.; Liu, D.; et al. Protocol development for real-time ship fuel sulfur content determination using drone-based plume sniffing microsensor system. Sci. Total Environ. 2020, 744, 140885. [Google Scholar] [CrossRef]
  21. Berg, N.; Mellqvist, J.; Jalkanen, J.-P.; Balzani, J. Ship emissions of SO2 and NO2: DOAS measurements from airborne platforms. Atmos. Meas. Tech. 2012, 5, 1085–1098. [Google Scholar] [CrossRef] [Green Version]
  22. Seyler, A.; Wittrock, F.; Kattner, L.; Mathieu-Üffing, B.; Peters, E.; Richter, A.; Schmolke, S.; Burrows, J.P. Monitoring shipping emissions in the German Bight using MAX-DOAS measurements. Atmos. Chem. Phys. 2017, 17, 10997–11023. [Google Scholar] [CrossRef] [Green Version]
  23. Seyler, A.; Meier, A.C.; Wittrock, F.; Kattner, L.; Mathieu-Üffing, B.; Peters, E.; Richter, A.; Ruhtz, T.; Schönhardt, A.; Schmolke, S.; et al. Studies of the horizontal inhomogeneities in NO2 concentrations above a shipping lane using ground-based multi-axis differential optical absorption spectroscopy (MAX-DOAS) measurements and validation with airborne imaging DOAS measurements. Atmos. Meas. Tech. 2019, 12, 5959–5977. [Google Scholar] [CrossRef] [Green Version]
  24. Cooper, D.A. HCB, PCB, PCDD and PCDF emissions from ships. Atmos. Environ. 2005, 39, 4901–4912. [Google Scholar] [CrossRef]
  25. Eggleston, H.S.; Buendia, L.; Miwa, K.; Ngara, T.; Tanabe, K. 2006 IPCC Guidelines for National Greenhouse Gas Inventories. Intergovernmental Panel on Climate Change; Institute for Global Environmental Strategies (IGES): Hayama, Japan, 2006. [Google Scholar]
  26. Jana, M.; Erik, F.; Olga, P.; Benjamin, D.; Victoria, T.; Alessandro, F.; Cristian, F. Characterisation of particulate matter and gaseous emissions from a large ship diesel engine. Atmos. Environ. 2009, 43, 2632–2641. [Google Scholar]
  27. Shi, C.; Wang, S.; Huang, M.; Yao, K. SO2 and SO2−4 Dry Deposition Velocities Computed Using Resistance Model and MM5. J. Univ. Sci. Technol. China 2003, 33, 692–700. [Google Scholar]
  28. Beecken, J.; Mellqvist, J.; Mellqvist, J. Remote Measurements of Gas and Particulate Matter Emissions from Individual Ships. Ph.D. Thesis, Chalmers University of Technology, Gothenburg, Sweden, 2015. [Google Scholar]
  29. Beecken, J.; Mellqvist, J.; Salo, K.; Ekholm, J.; Jalkanen, J.P. Airborne emission measurements of SO2, NOx and particles from individual ships using a sniffer technique. Atmos. Meas. Tech. 2014, 7, 1957–1968. [Google Scholar] [CrossRef]
  30. Hu, J.; Zhu, J.; Peng, S.; Zhao, H.; Hong, N. Sniffing method: A technique to estimate sulfur content in marine fuel through in situ measurements of ship emissions. J. Waterw. Harbor 2018, 39, 619–625. [Google Scholar]
  31. Wvr, A.; Rs, A.; Bvr, A.; Ks, A.; Avn, A.; Fm, B. Airborne monitoring of compliance to sulfur emission regulations by ocean-going vessels in the Belgian North Sea area. Atmos. Pollut. Res. 2022, 13, 101445. [Google Scholar]
Figure 1. (a) The location of the Pearl River Estuary. (b) The area of the Pearl River Estuary. (c) The area and scope monitored by UAVs.
Atmosphere 13 01894 g001
Figure 2. The ship exhaust mini-sniffing UAV.
Atmosphere 13 01894 g002
Figure 3. Measurements of FSC distribution.
Atmosphere 13 01894 g003
Figure 4. Statistics of 28 ships out of 445 with FSC measured above 0.5% (m/m) in Pearl River Delta.
Atmosphere 13 01894 g004
Figure 5. Comparison of compliance levels between ship lengths.
Atmosphere 13 01894 g005
Figure 6. Comparison of compliance levels between ship types.
Atmosphere 13 01894 g006
Publisher’s Note: MDPI stays neutral with regard to jurisdictional claims in published maps and institutional affiliations.

