Article

Aerosol Analysis of China’s Fenwei Plain from 2012 to 2020 Based on OMI Satellite Data

College of Geography and Environmental Sciences, Northwest Normal University, Lanzhou 730070, China
*
Author to whom correspondence should be addressed.
Atmosphere 2022, 13(10), 1728; https://doi.org/10.3390/atmos13101728
Submission received: 17 September 2022 / Revised: 18 October 2022 / Accepted: 18 October 2022 / Published: 20 October 2022
(This article belongs to the Section Aerosols)

Abstract

:
The Fenwei Plain plays an essential role for China’s three-year action plan to protect the air environment. At present, the high-value area and maximum value of atmospheric aerosol have been effectively controlled, but the governance situation is not stable. Therefore, based on the daily ultraviolet aerosol index (UVAI) data retrieved by Ozone Monitoring Instrument (OMI) from 2012 to 2020, combined with precipitation and temperature and air pressure and lifting index data, this paper analyzes the spatiotemporal distribution characteristics and some influencing factors of UVAI in the Fenwei Plain. The results show that the overall trend of the annual average UVAI value of the Fenwei Plain in 9 years showed two “peaks” in 2013 and 2018, respectively. The high UVAI values are mainly concentrated in the southwest and central areas of the Fenwei Plain. In the study area, UVAI was highest in winter, followed by autumn and spring, and lowest in summer. There were significant negative correlations between precipitation and UVAI and between temperature and UVAI. There were significant positive correlations between air pressure and UVAI and between lifting index and UVAI. According to the backward trajectory clustering results, during the autumn and winter seasons in this area, due to the sand and dust brought by the northwest and the input of aerosols in the coal-producing area and coal-fired heating area, the UVAI value of this time period is higher.

1. Introduction

Atmospheric aerosols refer to solid or liquid particles mixed into the atmosphere [1]. Studies have shown that the aerosol content of the atmosphere is closely related to local climatic conditions. Aerosol particles act as cloud condensation nuclei or ice cores that change the microphysical and optical properties of a cloud and so affect precipitation efficiency, thereby indirectly affecting the climate [2]. Interaction between aerosols and solar radiation can reduce the height of the boundary layer in the atmosphere, which in turn affects the concentration of haze near the ground [3]. The environmental conditions caused by aerosols also affect the ecosystem and can affect the physiological health of humans in particular. Cong et al. [4] studied the relationship between pollution caused by atmospheric particulate matter and daily human mortality in 625 cities and found that the daily mortality rate increased as the concentration of particulate matter increased. Lin et al. [5] studied the impact of atmospheric particulate matter pollution on the health of the population in the coastal areas of Fujian from 2017 to 2018 and found that the increase in the concentration of particulate matter in the coastal areas of Fujian has a statistically significant increase in the risk of non-accidental deaths and deaths from cardiovascular and cerebrovascular diseases. Therefore, research on the concentrations of effects of atmospheric aerosols on human health is very important.
The main methods used for monitoring atmospheric aerosols are ground-based observation and satellite remote sensing. Ground-based observations include manual and online monitoring. Online monitoring can provide high-precision hourly data, but employs fewer observation points with higher construction and maintenance costs than manual observations. Satellite remote sensing monitoring can cover a wide area, provide macroscopic change data, and help researchers to realize long-distance real-time monitoring; it has other advantages that make up for the lack of a spatial distribution of ground monitoring sites [6,7,8,9]. Combined with GIS software to visualize the data, one can intuitively understand the spatial distribution and temporal changes of the data in the research area [10,11,12]. At present, many researchers worldwide are conducting research on the atmospheric environment based on remote-sensing data. Jing et al. [13] compared the optical characteristics of aerosols and aerosol source areas during periods of winter and summer pollution in Nanjing and concluded that atmospheric aerosols are mainly affected by urban pollution, seasonal biomass combustion, and the aerosol that is migrated from the northwestern region of China. For example, based on OMI data products, Zhang et al. [14] studied the spatial and temporal distribution characteristics of the ultraviolet aerosol index (UVAI) in Ningxia Hui Autonomous Region from 2008 to 2017, and the results showed that the seasonal characteristics of the UVAI value in winter were significantly greater than in summer. The year 2013 was when the UVAI in the region changed from a low value to a high value. In 2017, the UVAI reached the highest value of the decade. Nandita et al. [15] used cluster analysis and concentration-weighted air quality inverse trajectories to establish a possible transmission mechanism for biomass flue gas and then analyzed the aerosol chemistry, transportation, and climate effects during extreme biomass combustion and emissions in the Ganges Plain in India. Through analysis, it is found that biomass flue gas has a close relationship with the changes of total aerosol concentration and fine-mode aerosol concentration. In the season after the monsoon, the observation results show that the concentrations of both are relatively high. Li et al. [16] analyzed and discussed the temporal and spatial distribution of the Absorbent Aerosol Index (UVAI) and related factors in Gansu Province from 2008 to 2017 based on the daily products of OMAERUV data. The UVAI showed a gradual decrease from northwest to southeast and a gradual increasing trend over time. Meteorological factors including precipitation and temperature were significantly positively correlated with the UVAI. Human activity factors include the regional gross domestic product, and the output value of various industries also had an obvious positive correlation with the UVAI.
There are 11 representative cities in the Fenwei Plain, of which six cities were exposed to air pollution for nearly or more than half of the time in the autumn and winter of 2013–2018; when air pollution occurred, most of these representative cities experienced at least a moderate level of pollution [17]. In 2018, the Fenwei Plain was listed in the State Council’s “Notice on Printing and Distributing the Three-Year Action Plan for Winning the Blue-Sky Defense War” and was listed as a national key management area for the atmospheric environment. The “War” has now become an air pollution prevention and control action in Beijing, Tianjin, Hebei, and the surrounding areas, including the Yangtze River Delta and the Fenwei Plain. Since 2018, air quality in the Fenwei Plain has been effectively improved; the annual mean amount of ultraviolet-absorbing aerosols has gradually decreased, but the governance situation has not remained stable.
Therefore, this paper selects the ultraviolet aerosol index from 2012 to 2020 and the Global Data Assimilation System (GDAS) data from 2017 to 2019 in the OMI remote-sensing data. By using GIS software to process OMI data, the spatial and temporal distribution characteristics of aerosols in this area were discussed on the scale of year and season. In the monthly variation, this paper uses the Pearson correlation analysis method to discuss the correlation distribution of UVAI and precipitation, air temperature and air pressure, and lifting index data. Combined with the Lagrangian mixed single-particle orbit model, the external transmission paths of air masses in the Fenwei Plain area were analyzed, and the distribution and variation rules of aerosols in this area were obtained, in order to provide an effective reference for atmospheric control in this area.

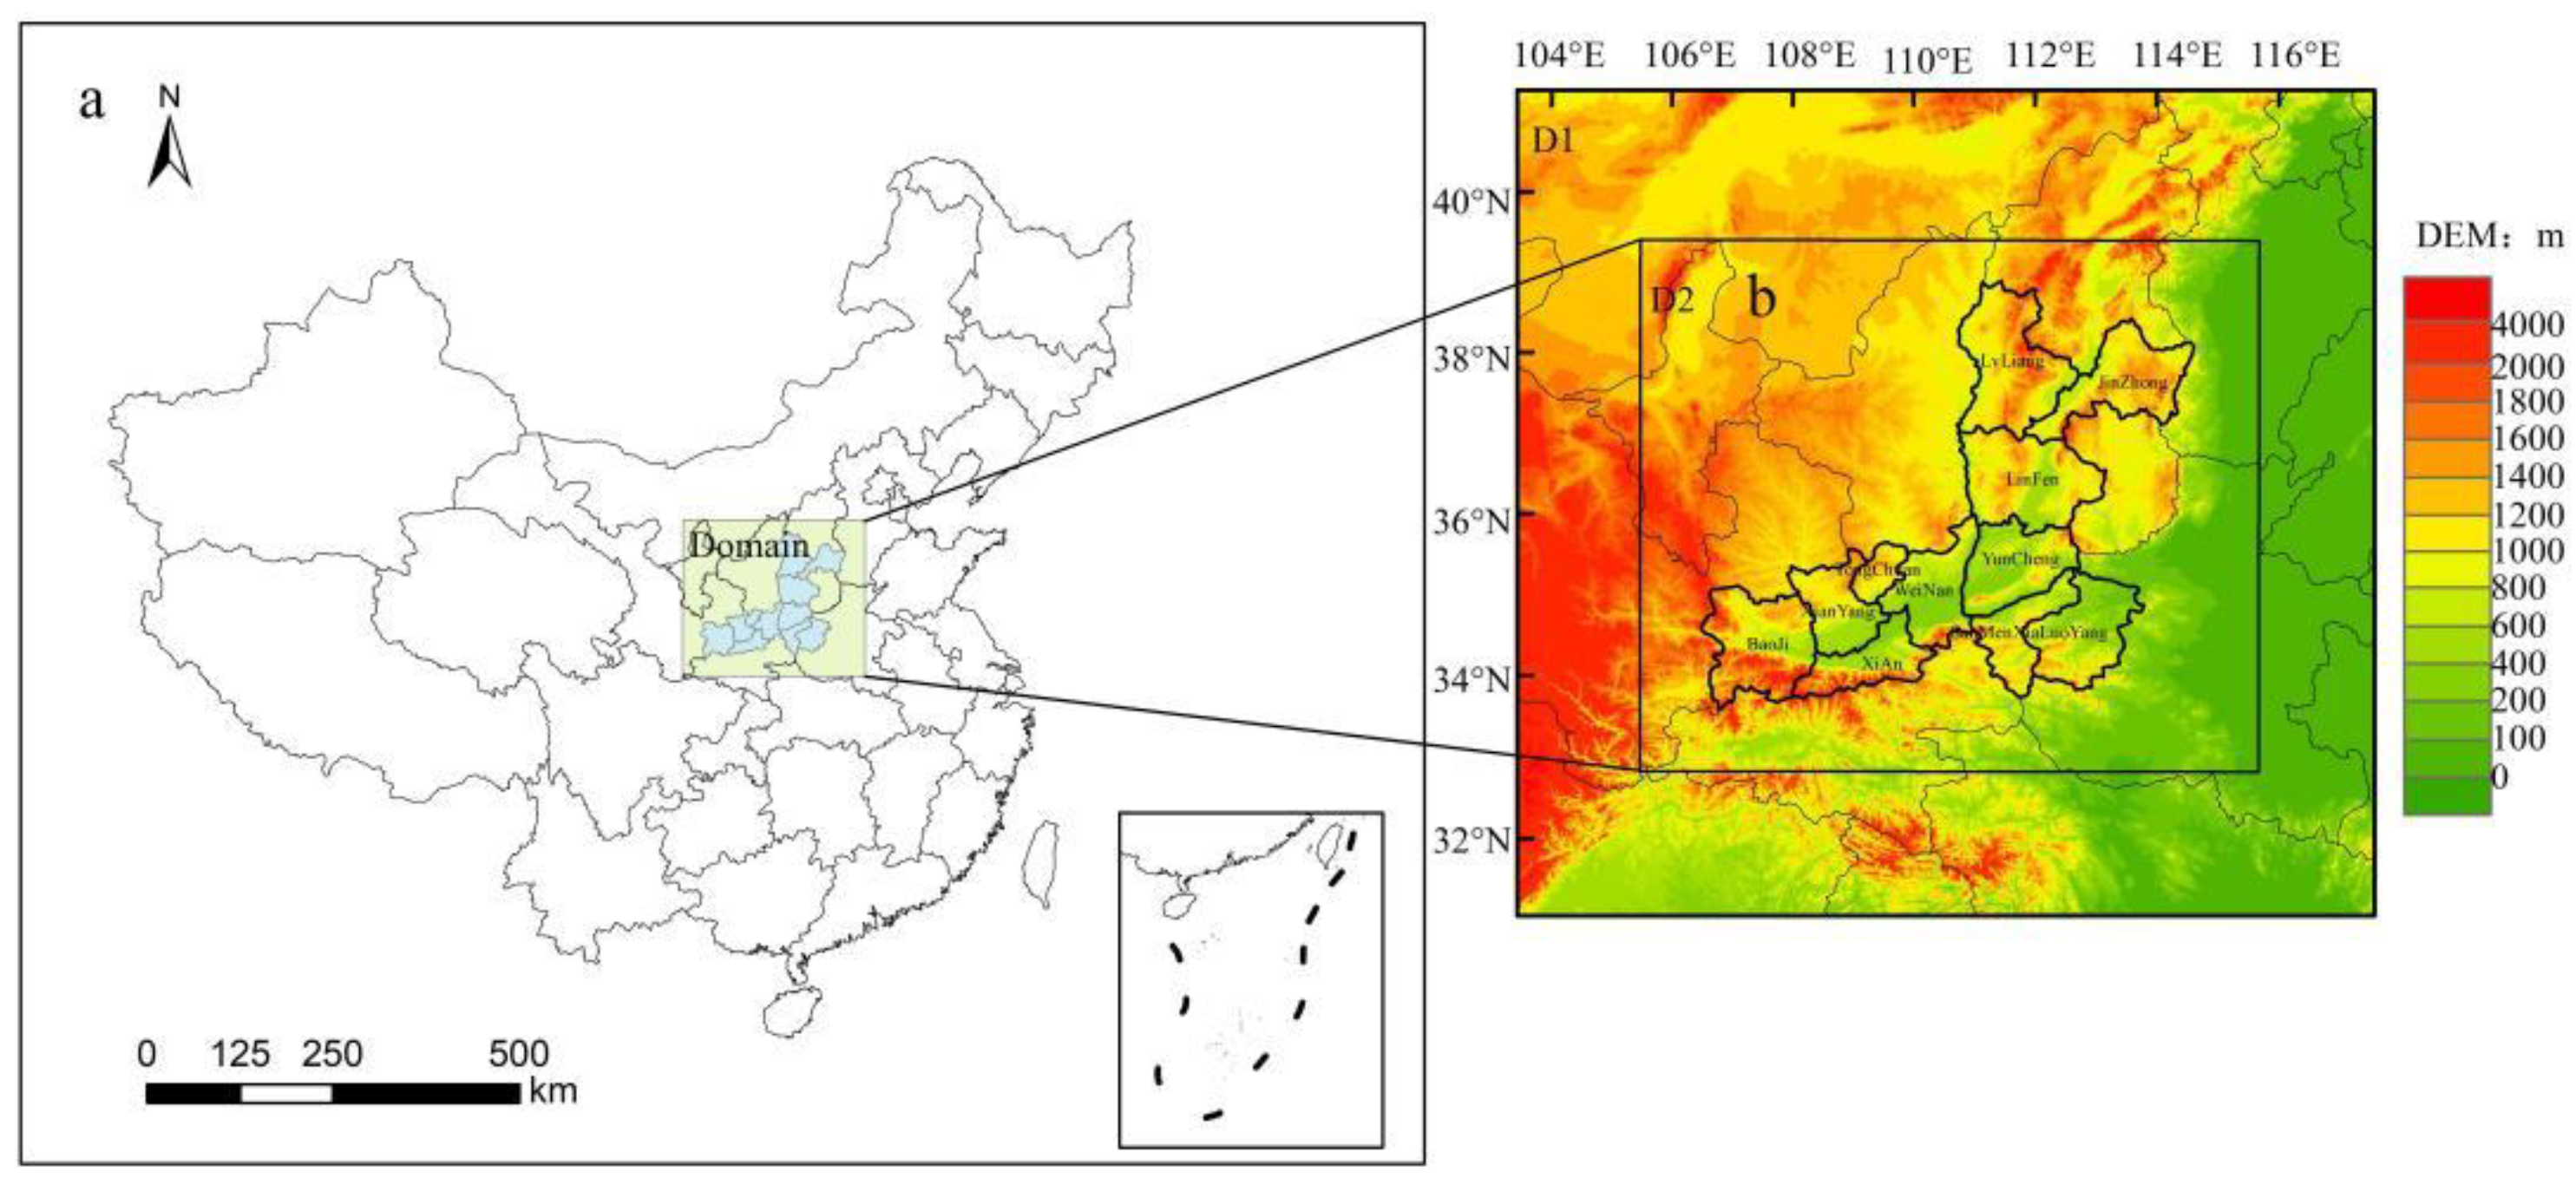
Introduction to the Study Area

The Fenwei Plain (33–39° N, 106–115° E) is a general term for the Fenhe or Weihe plains and the surrounding platform terraces of the Yellow River Basin. This forms the largest alluvial plain in the middle reaches of the Yellow River and the fourth largest plain in China. The plain can be referred to as the “main battlefield” of the so-called “blue sky defense war”. This concept was defined in the “Three-year Action Plan for Winning the Blue Sky Defense”, and it covers the following 11 prefectures: Xi’an, Baoji, Xianyang, Weinan, and Tongchuan in Shaanxi province, Jinzhong, Lvliang, Linfen, and Yuncheng in Shanxi province, along with Luoyang and Sanmenxia in Henan province. The study area conducts analysis and discussion. The study area is located in a valley surrounded by mountains. The study area extends across 70,000 km2, covers a landscape in a northeast–southwest direction, and has a long and narrow terrain form with numerous mountain ranges [18]. The Fenwei Plain lies in a warm temperate zone with semi-arid and semi-humid climates. The climate of the Fenwei Plain has obvious zonal differences. The climate is warmer in the east than in the western part of the study area, while the west and south receive more precipitation than the east and northern parts [19]. The Fenwei Plain is an economically developed area with parts of three provinces, Shaanxi, Shanxi, and Henan provinces, and the region has densely populated cities with many industries and excellent transportation infrastructure. In addition, the energy sources in the region are dominated by coal, and the heavy industries such as steel, coking, and aluminum production consume much of the energy produced in the area [20]. Statistical yearbook data from the three provinces show that the gross regional product of the Fenwei Plain in 2019 was valued at about CNY 2.836 trillion; the regional population was about 50.74 million. Figure 1 provides a schematic diagram of the location and topography of the Fenwei Plain.

2. Data and Methods

2.1. Data Sources and Data Products

In this study, the ultraviolet aerosol index (UVAI) and O3 data were derived from the OMI sensor of the Aura satellite on the U.S. National Aeronautics and Space Administration Earth Observation System (EOS). Precipitation data were acquired from the National Earth System Science Data Center, National Science and Technology Infrastructure of China (http://www.geodata.cn accessed on 24 March 2020). These data are based on 0.5° global climate data released by the Climate Research Unit (CRU) and global high-resolution climate data released by WorldClim. These data were down-scaled for China through the Delta space downscaling program and used 496 independent data points. The meteorological observation point data were verified, and the verification result is credible. The temperature data come from the NCEP/NCAR re-analysis dataset jointly provided by the U.S. National Center for Environmental Prediction (NCEP) and the U.S. National Center for Atmospheric Research (NCAR). The dataset covers the period from 1948 to the present. The grid data employed here were formed by re-analyzing global meteorological data using observational data, forecast models, and assimilation systems. The backward trajectory data in this paper were from meteorological data of the Global Data Assimilation System for the corresponding time period provided by the U.S. National Environmental Forecast Center, with a spatial horizontal resolution of 1 × 1°. Using the meteorological data provided by the NCEP to analyze and study the air mass transportation routes in the study area can provide an effective method for monitoring and controlling atmospheric pollution.

2.2. Data Processing

This study selected the daily aerosol data from 2012 to 2020 from the level 2 data product in OMI. The OMAERUV product is written as a HDF-EOS5 strip file for storage, in order to facilitate the subsequent processing software ArcGIS 10.3 to read and identify the data. In this paper, Python programming language and ArcGIS 10.3 software were used to obtain the annual, seasonal, and monthly mean values of UVAI in Fenwei Plain. The spatial and temporal distribution characteristics of UVAI in Fenwei Plain were studied by using the obtained data. At the same time, the precipitation, temperature, air pressure, and uplift index data that may affect the UVAI data from 2012 to 2020 were obtained under the above operation and then compared and analyzed with the UVAI data.
Pearson’s correlation coefficient was used to measure the correlation between UVAI and precipitation, as well as three influencing factors (air temperature, air pressure, and lifting index). The formula for calculating the correlation coefficient between UVAI and precipitation is shown in (1):
r x y = i = 1 n [ ( x i x ¯ ) ( y i y ¯ ) ] i = 1 n ( x i x ¯ ) 2 i = 1 n ( y i y ¯ ) 2
rxy is the correlation coefficient between x and y, and the value is between [−1, 1]; xi is the mean value of UVAI in the i month; yi is the monthly average precipitation of the i month; x ¯ is the multi-month average of UVAI; y ¯ is monthly average precipitation; n is the number of samples.
This paper uses Statistical Product Service Solutions (SPSS) software to conduct principal component analysis on the data of influencing factors such as precipitation, temperature, air pressure, and lifting index. First, standardize the relevant data to eliminate the dimension and magnitude effect between different indicators and then use the Kaiser–Meyer–Olkin (KMO) test statistic and the Bartlett sphericity test to judge the correlation between the data to determine whether the variables are suitable for factor analysis and then select the principal components with cumulative variance contribution rate >70% and eigenvalue >1.
This study employed backward trajectory data from 2017 to 2019 and used Hysplits (National Oceanic and Atmospheric Administration, Boulder, CO, USA) and TrajStat MeteoInfo (Chinese Academy of Meteorological Sciences, Beijing, China) software to perform trajectory clustering analysis. Through the operation, the corresponding result map is obtained for analysis to identify the transportation path that has a greater impact on the air pollution in the Fenwei Plain.

3. Results

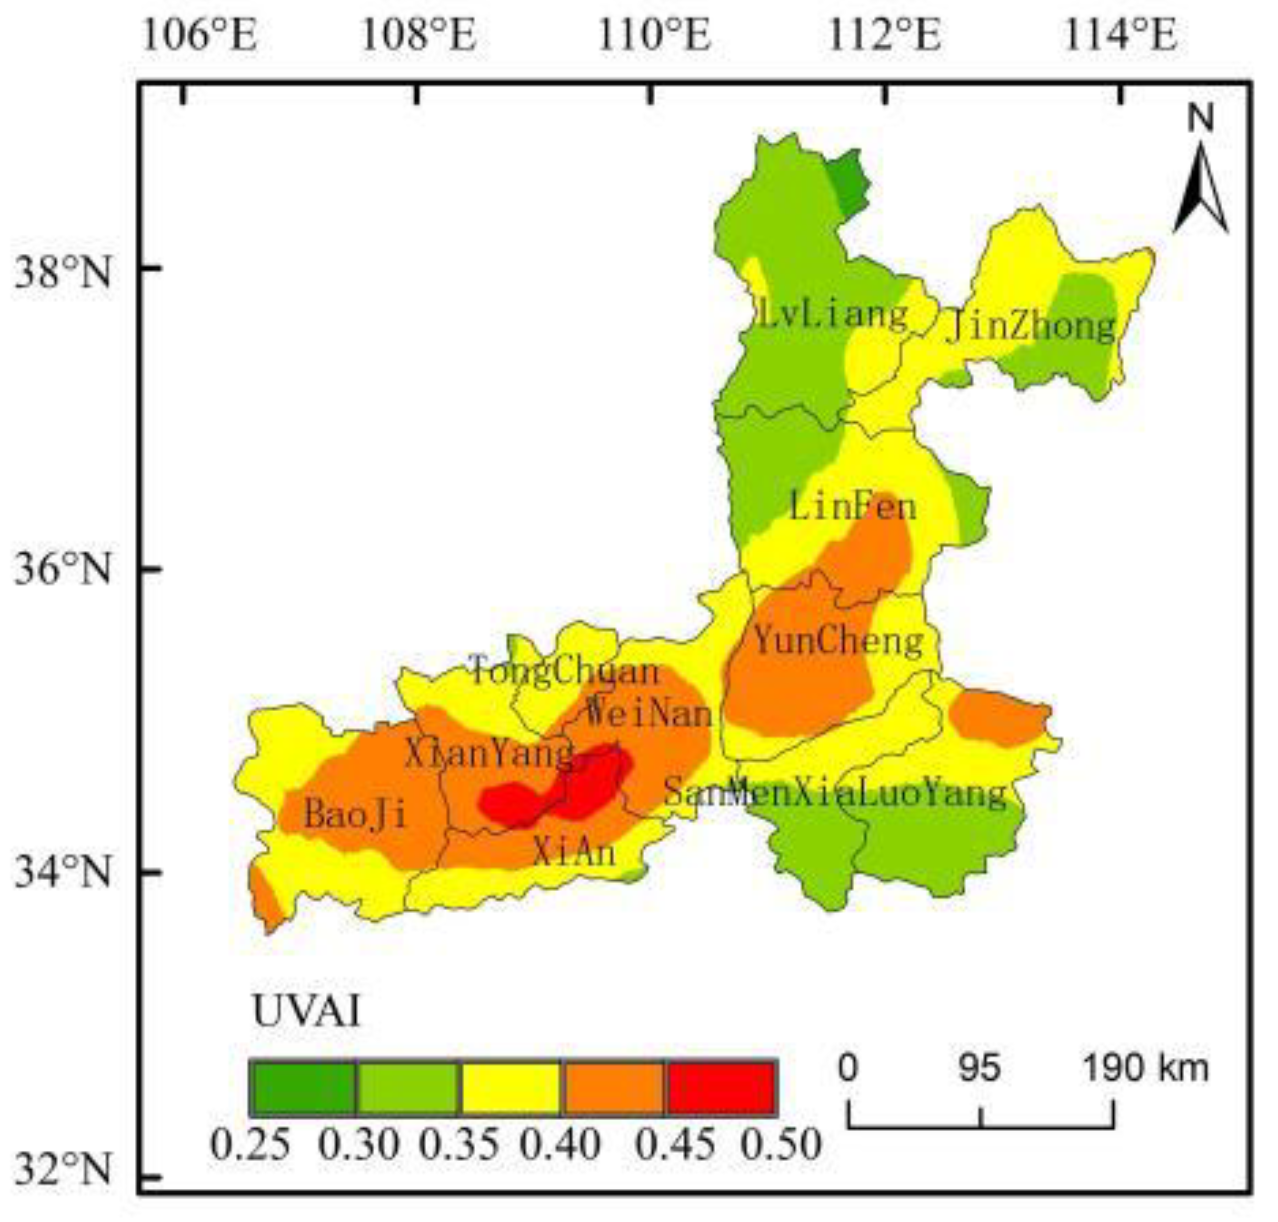
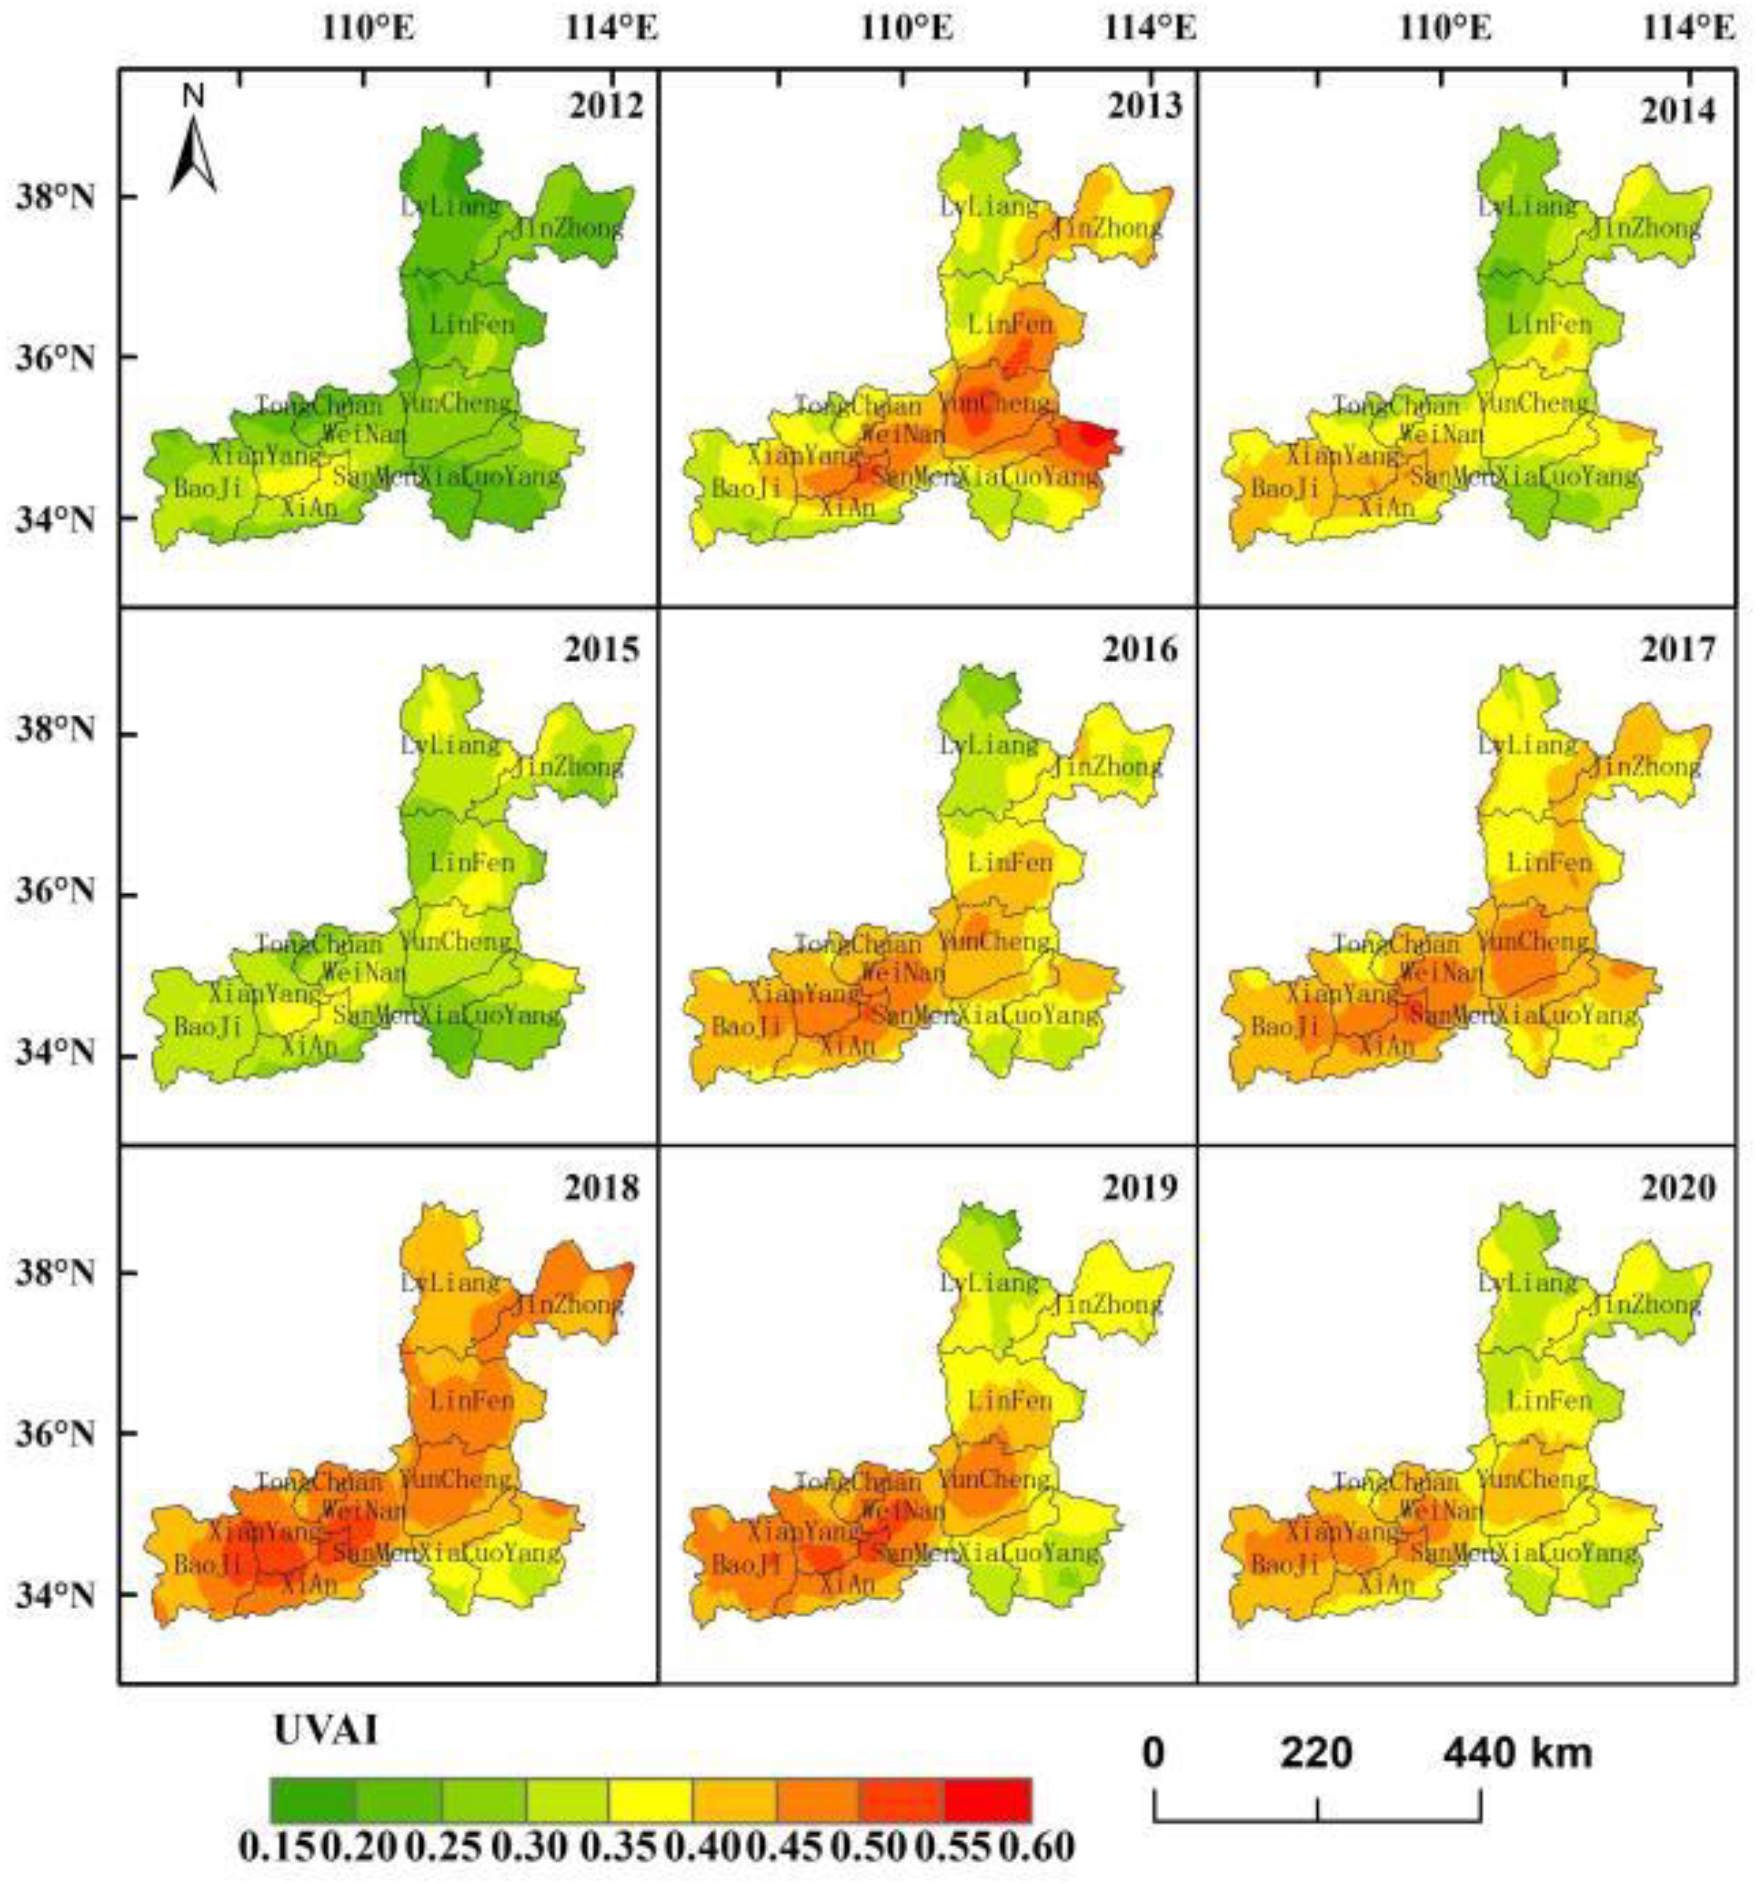
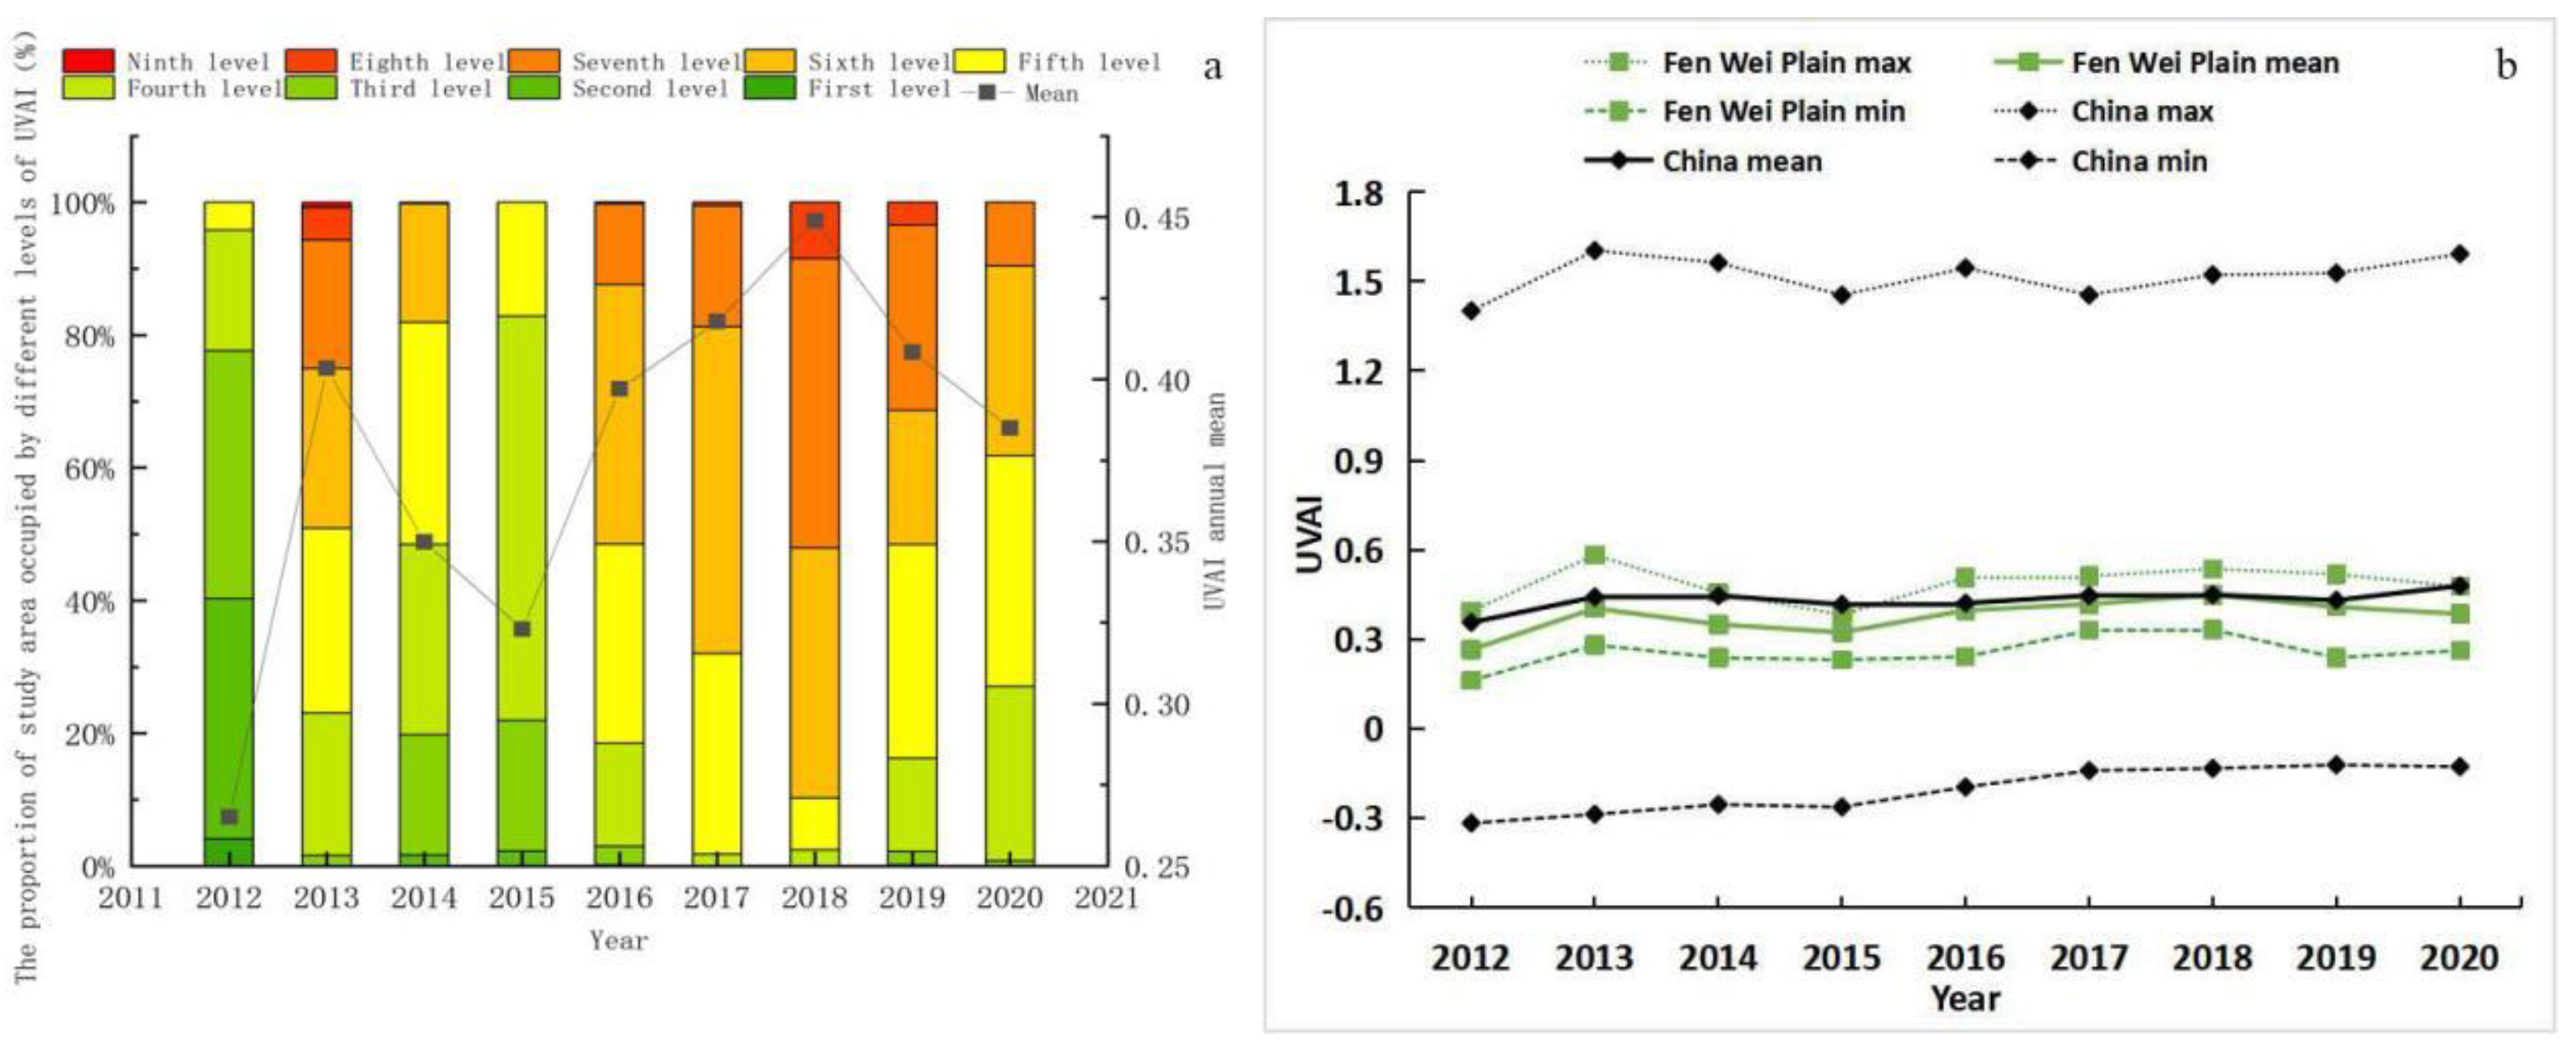
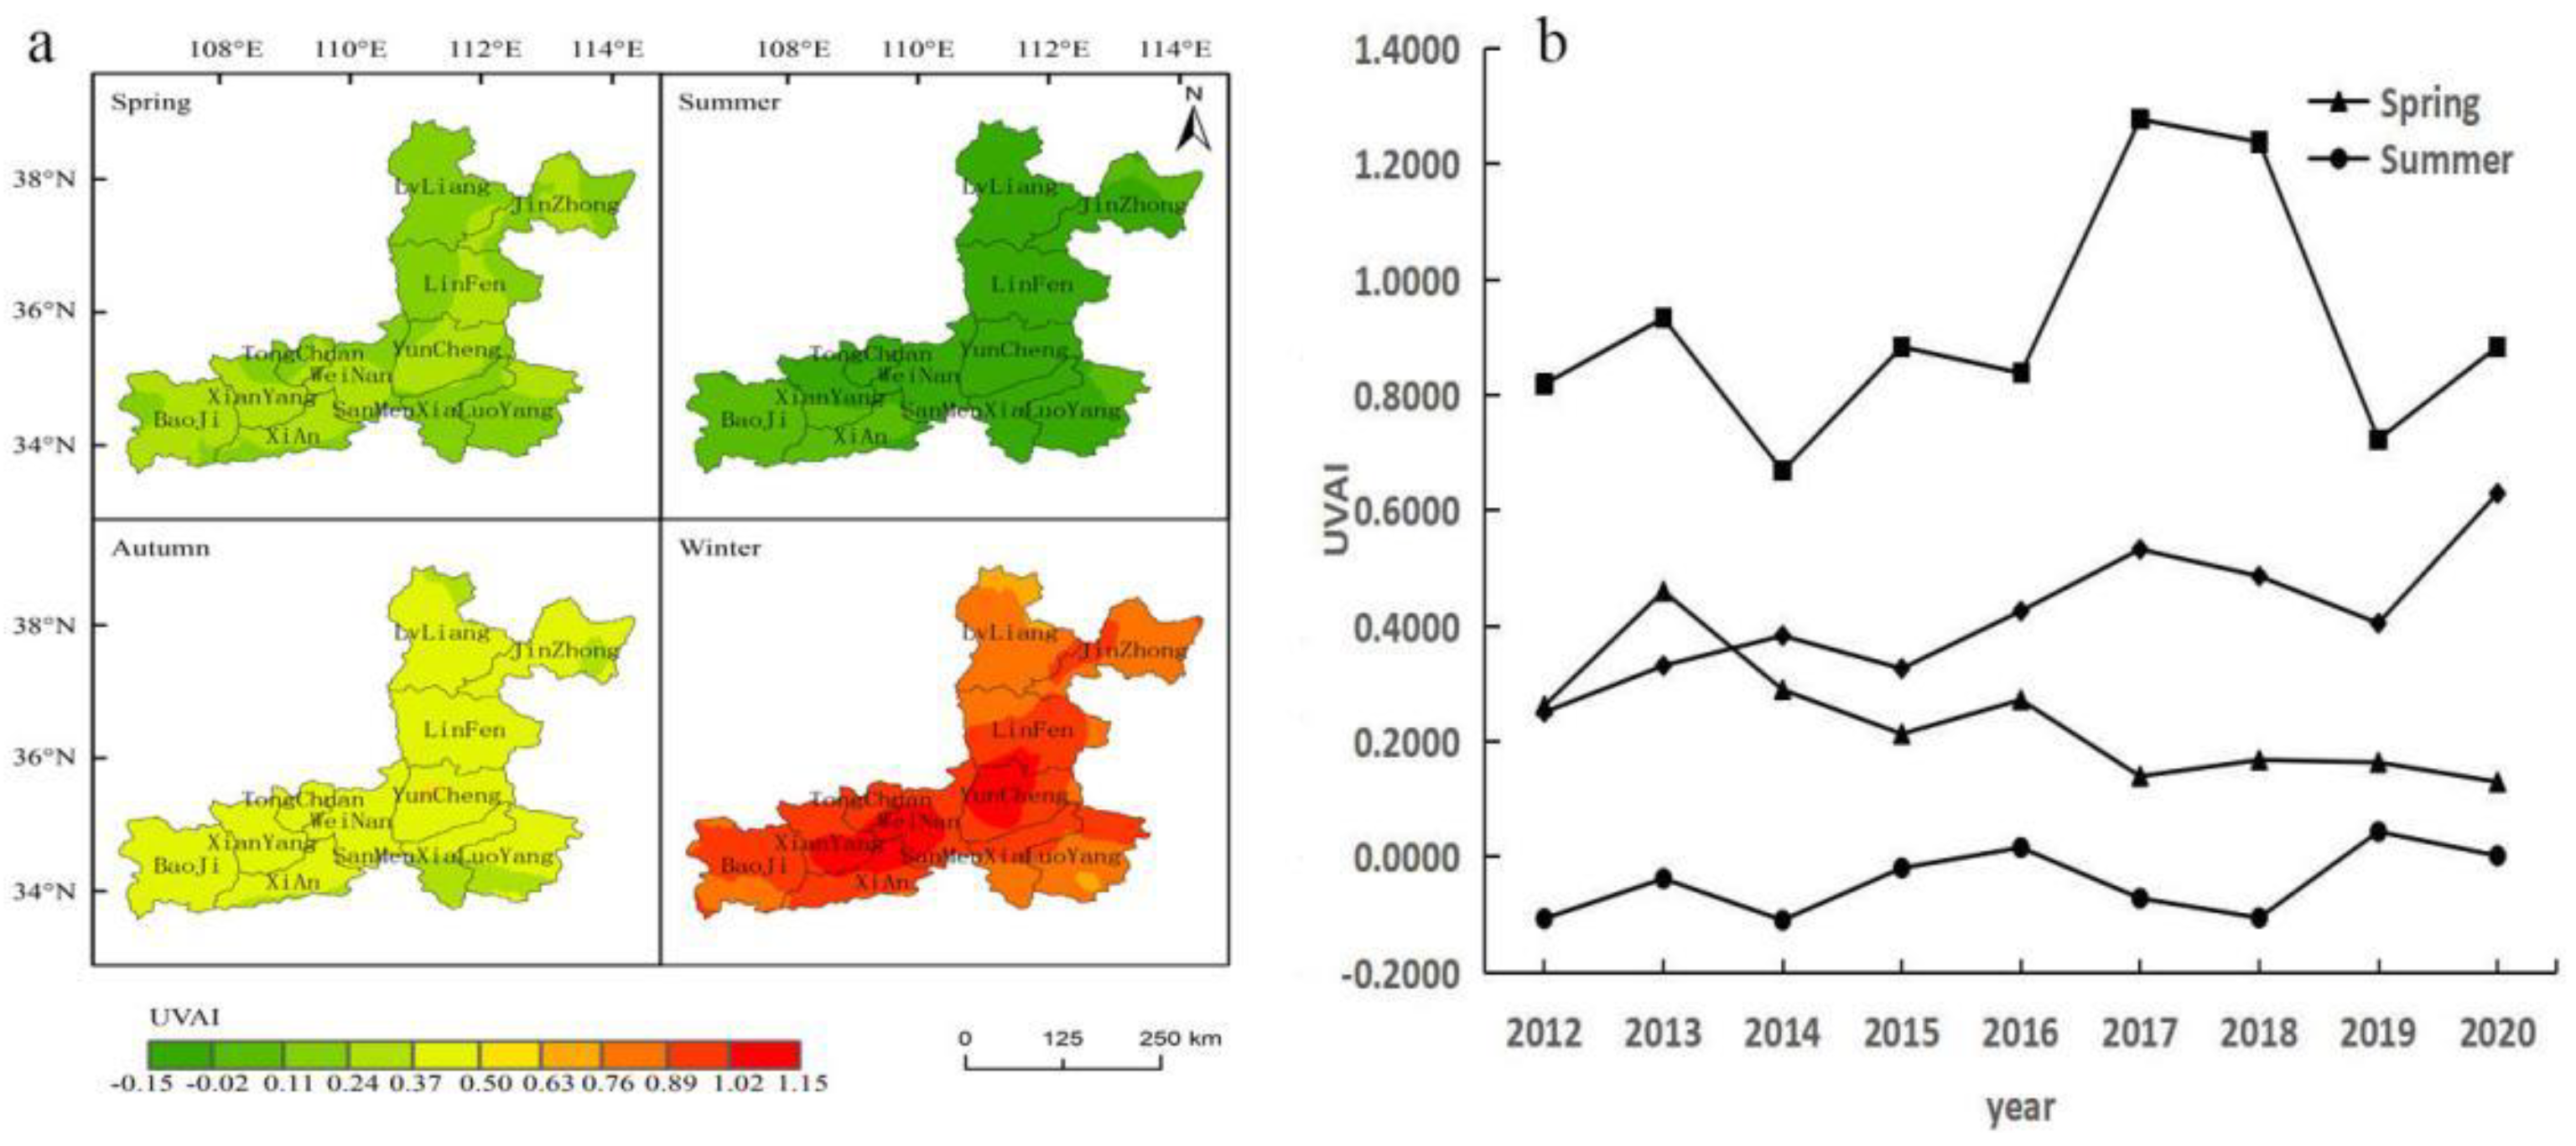
3.1. Interannual Variation of UVAI in Fenwei Plain

Based on the processed data, this paper draws the overall UVAI spatial distribution map of the Fenwei Plain from 2012 to 2020, as shown in Figure 2. The figure divides the UVAI index into five levels. From the spatial pattern, the distribution characteristics of aerosols decreased with the increase of altitude. The high value of UVAI was distributed in the low-altitude areas of the study area, mainly in the southwestern and central areas of the Fenwei Plain. Among them, areas with slightly higher elevations such as northern Lvliang city and the cities of Sanmenxia and southern Luoyang had lower UVAI, with the second level dominating medium-elevation areas in Baoji, Xianyang, Xi’an, Tongchuan, Weinan, and Yuncheng. It is divided into the third and fourth levels, and the fourth level occupies a large area; the fifth level is mainly distributed in Xianyang, Weinan, and Xi’an at lower elevations. Qin et al. [21] also came to a similar conclusion through the temporal and spatial distribution of the frequency of polluted days, that is, the most polluted areas in the Fenwei Plain are mainly concentrated in Xi’an, Xianyang, Weinan, Yuncheng in the lower reaches of the Weihe River, and Linfen in the lower reaches of the Fenhe River.
Figure 3 shows the annual mean distribution of UVAI in the Fenwei Plain from 2012 to 2020. This article divides the resulting UVAI levels into nine levels listed sequentially from levels one to nine. From 2012 to 2018, the UVAI value of the Fenwei Plain has fluctuated upwards. From 2015 to 2018, the expansion of high-value areas has continued to increase, and the high-value areas in 2019–2020 will be controlled to a certain extent. The main areas with high UVAI gradually shifted westward from Luoyang, Linfen, Yuncheng, and Xi’an in 2013. In 2018, the high UVAI areas were mainly distributed in Xi’an, Weinan, Xianyang, and Baoji.
According to the classification of the mean annual change of UVAI in Figure 3, the proportion of the area occupied by different levels of UVAI was calculated for 9 years (Figure 4a). Figure 4a shows that from 2012 to 2020, the Fenwei Plain as a whole was dominated by 0.35–0.45 of UVAI, followed by the frequency of the fourth level. In general, the annual average change trend of UVAI showed in 2013 and 2018, but the average value in the past five years was significantly greater than the previous four years. From 2012 to 2015, the main UVAI values of the Fenwei Plain were 0.30–0.40, followed by 0.25–0.30, and the lowest UVAI in the 9-year period appeared in 2012. From 2016 to 2020, the values are mainly distributed in 0.35–0.45, followed by 0.45–0.50, while the highest UVAI in the nine-year period appeared in 2018.
Figure 4b shows the comparison of the maximum, minimum, and mean UVAI values between the Fenwei Plain and the entire country from 2012 to 2020. This figure shows that the annual mean value of the UVAI fluctuated in the range of −0.32 to 1.60 throughout the country over 9 years; the annual mean value of the UVAI in the Fenwei Plain fluctuated in the range of 0.16–0.58. From the change in the range of the UVAI and trend shown in the broken line in Figure 4, it can be seen that the annual mean UVAI of the Fenwei Plain was slightly lower than the national mean; the changes in the Fenwei Plain and the entire country have increased or decreased during the two periods of 2013–2014 and 2019–2020. This was inconsistent, manifested by the decrease in the UVAI value of Fenwei Plain and the increase of national UVAI value, but both showed a slow growth trend in the overall trend over 9 years.

3.2. Seasonal Variation of UVAI in Fenwei Plain

According to the classification of four seasons, the seasonal variation trend map and seasonal spatial distribution map of UVAI in the Fenwei region from 2012 to 2020 are shown in Figure 5a,b. As can be seen from the figure, the UVAI values in each season have fluctuated slightly in recent years. The UVAI value in spring has shown a slow downward trend year by year since the highest value of 0.46 in 2013. The highest values in summer and autumn appeared in 2019 and 2020, and their UVAI values were 0.04 and 0.63, respectively. With the significant increase in global temperature in recent years, the UVAI value of the Fenwei Plain in summer and autumn showed a slow upward trend. The maximum value of UVAI in winter was 1.28, which appeared in 2017. Since 2018, the UVAI value in winter has dropped significantly, and the percentage of decrease in 2018–2019 reached 42%.
The figure also shows that the seasonal average of UVAI in Fenwei region is the highest in winter (0.92), followed by autumn (0.42) and spring (0.23), and the lowest in summer (−0.04). According to the UVAI value classification of the four seasons, it can be seen that the high value mainly occurs in winter, that is, the eighth grade (0.76–0.89), the ninth grade (0.89–1.02), and the tenth grade (1.02–1.15), and the ninth and eighth grades occupy the largest area, accounting for 46% and 37%, respectively. In terms of spatial distribution, Linfen city, Yuncheng city, and Xianyang city were mainly polluted, which is similar to the results obtained by Li et al. [22] in the evaluation and analysis of the air quality of cities in the Fenwei Plain in different seasons. Li believed that this phenomenon was closely related to the low coverage rate of central heating in the Guanzhong area of Shanxi province in winter and the weakened Brownian diffusion motion of aerosol plasmid in winter.

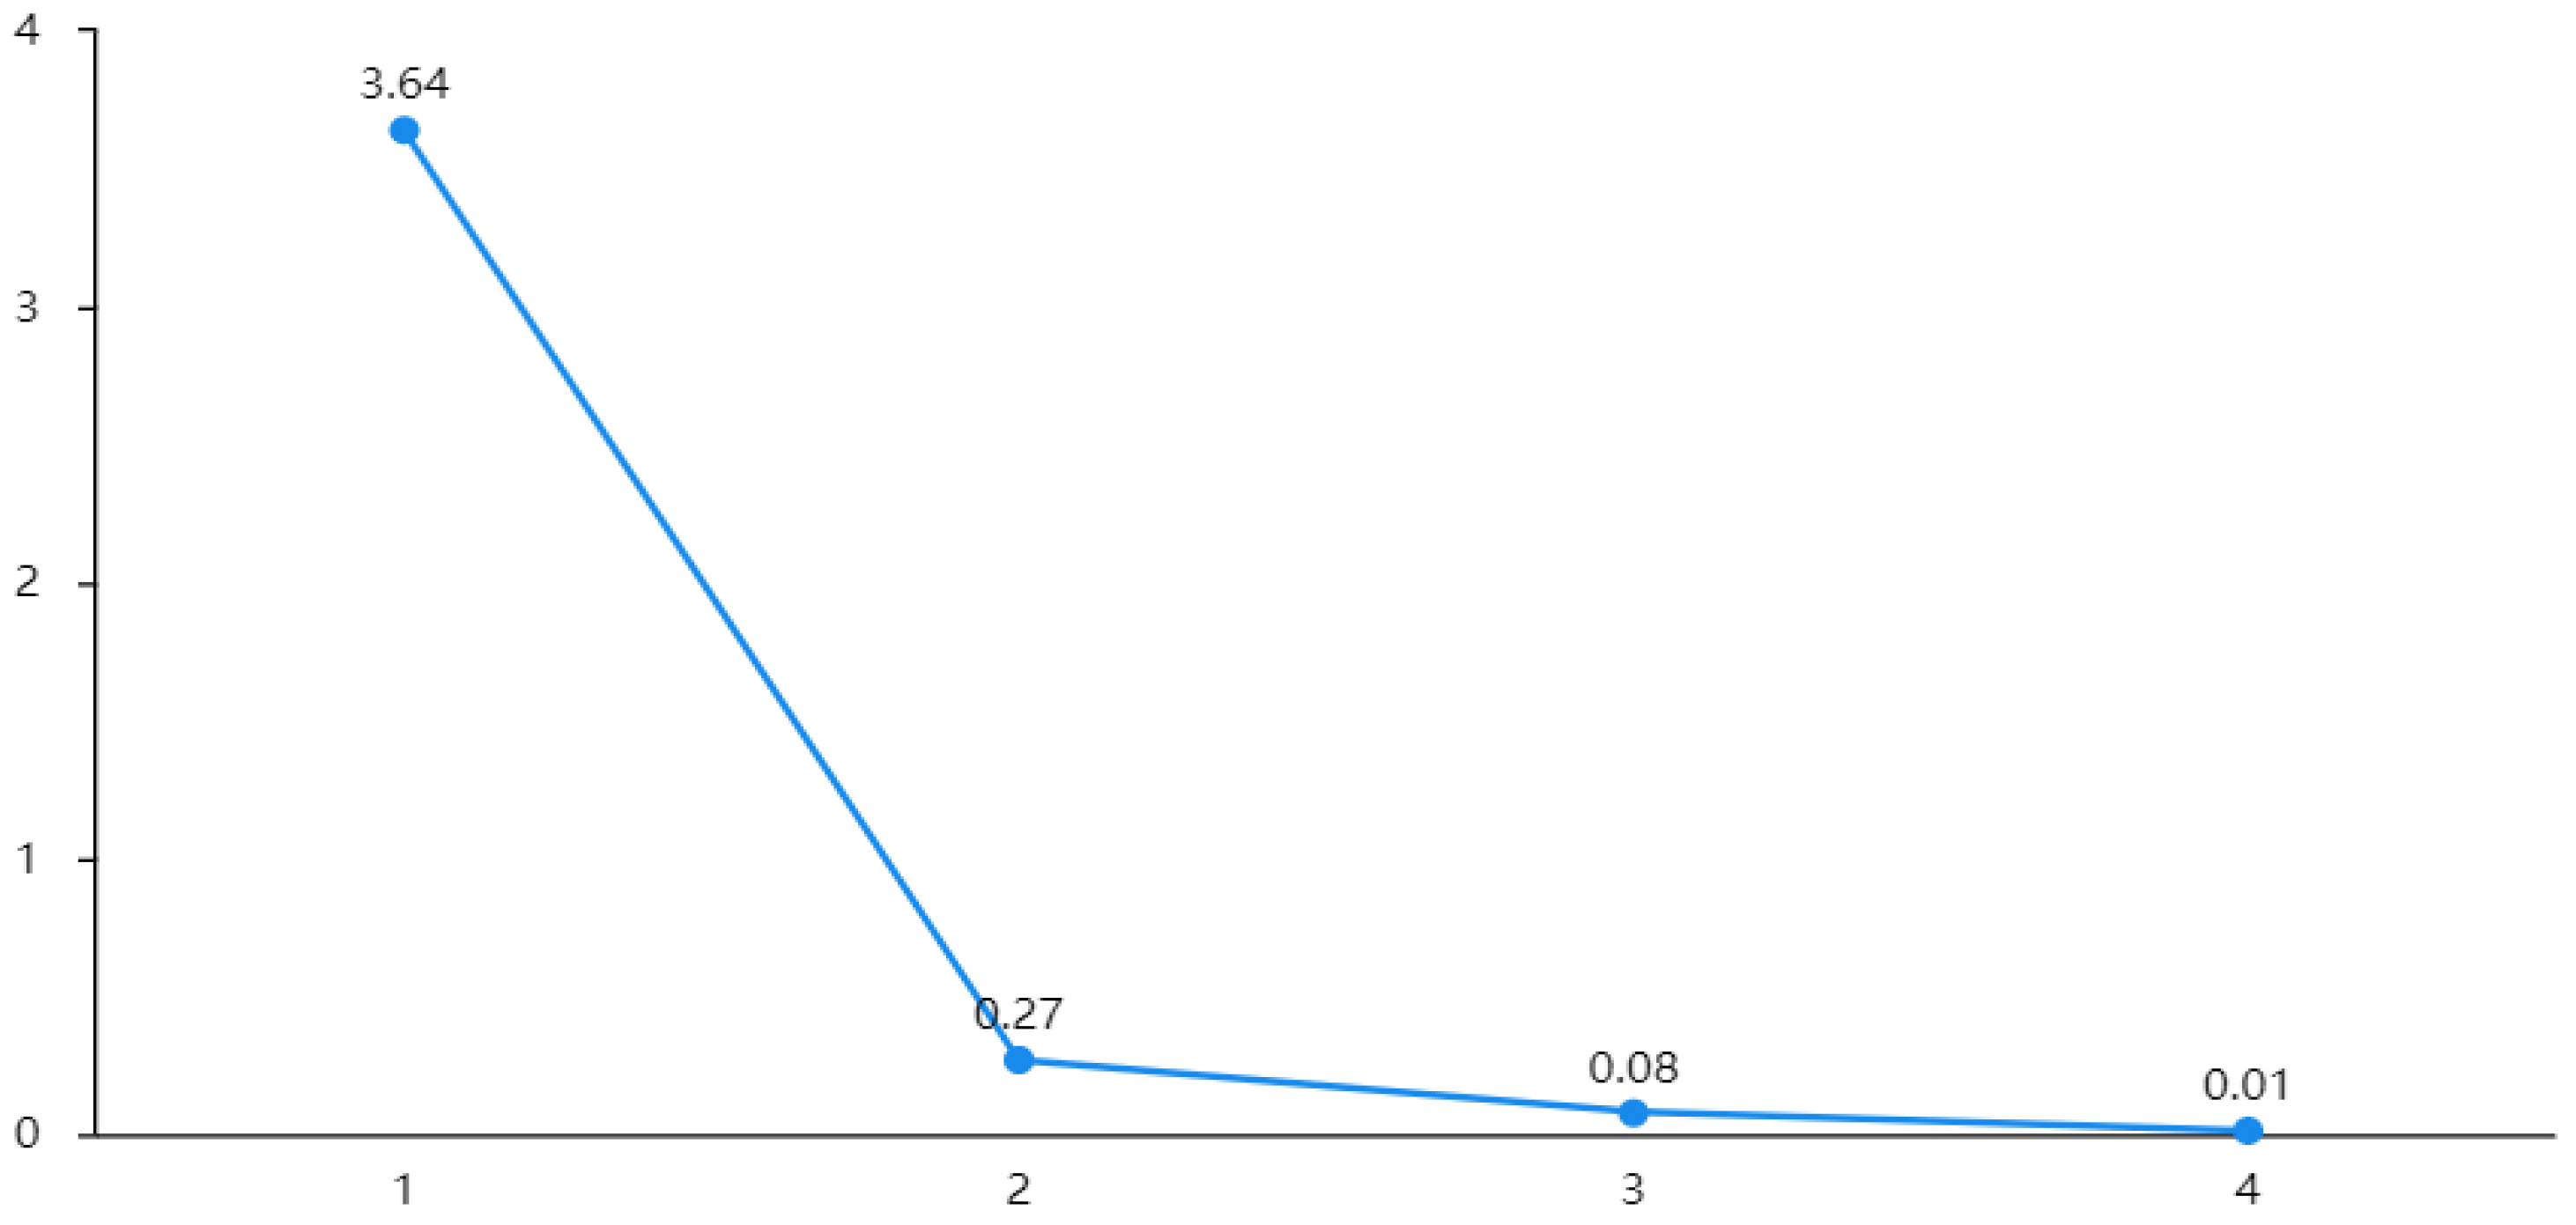
3.3. Relationship between UVAI and Impact Factors

In order to understand the relationship between precipitation, temperature, air pressure, lifting index (the lifting index is the index of unstable energy area above the height of free convection, and its value can indicate the instability and stability of atmospheric junction) and UVAI, and to judge the effect of the above data on UVAI, this paper conducts correlation analysis and principal component analysis.
Table 1 shows the Pearson correlation analysis results of the precipitation, temperature, air pressure, lifting index and other influencing factors in the Fenwei Plain from 2012 to 2020 and UVAI. It can be seen from the table that precipitation, air temperature, and UVAI are all significantly negatively correlated, while air pressure and lifting index are significantly positively correlated with UVAI. With the enhancement of convection in summer, stable precipitation has a diluting and sedimentation effect on absorptive aerosol particles, thereby reducing absorptive aerosols [23,24,25]. In the study, it was found that the relationship between air temperature and UVAI can be divided into two types. The increase in temperature can promote vertical convection in the atmosphere, thereby accelerating the diffusion of pollutants, but for ultrafine aerosols, the increase in temperature will accelerate atmospheric chemical reactions. It is beneficial to the generation of secondary aerosols [26,27,28]. Therefore, it can be speculated that the aerosol particles are relatively coarse in most areas of the Fenwei Plain. At the same time, through the direct radiation effect of aerosols, on the one hand, the atmospheric stability between the ground and the boundary atmosphere increases; on the other hand, the cooling of the ground in different regions causes temperature differences, and atmospheric densities at different temperatures form pressure differences [29,30,31]. This is consistent with the conclusion drawn in this paper that UVAI is significantly positively correlated with air pressure and lifting index.
According to Table 2, Figure 6, and Table 3 of the principal component analysis results, it can be seen that the relationship equation between the principal components and the research items is established according to the component score coefficient matrix, such as precipitation, air temperature, air pressure, and lifting index, as follows: The   composition   yields   1 = 0.256 × precipitation + 0.273 × temperature 0.251 × pressure 0.269 × lifting   index . As can be seen from the weight, the positive effect of temperature is the largest, followed by the negative effect of lifting index, the positive effect of precipitation, and finally the negative effect of air pressure. That is, the change of the aerosol index is affected by the four factors. The conclusion is consistent with the increasing trend of UVAI from 2020 to 2020. At the same time, the influence of wind speed and wind direction changes on the changes of UVAI caused by the interaction between aerosols and the four influencing factors cannot be ignored.

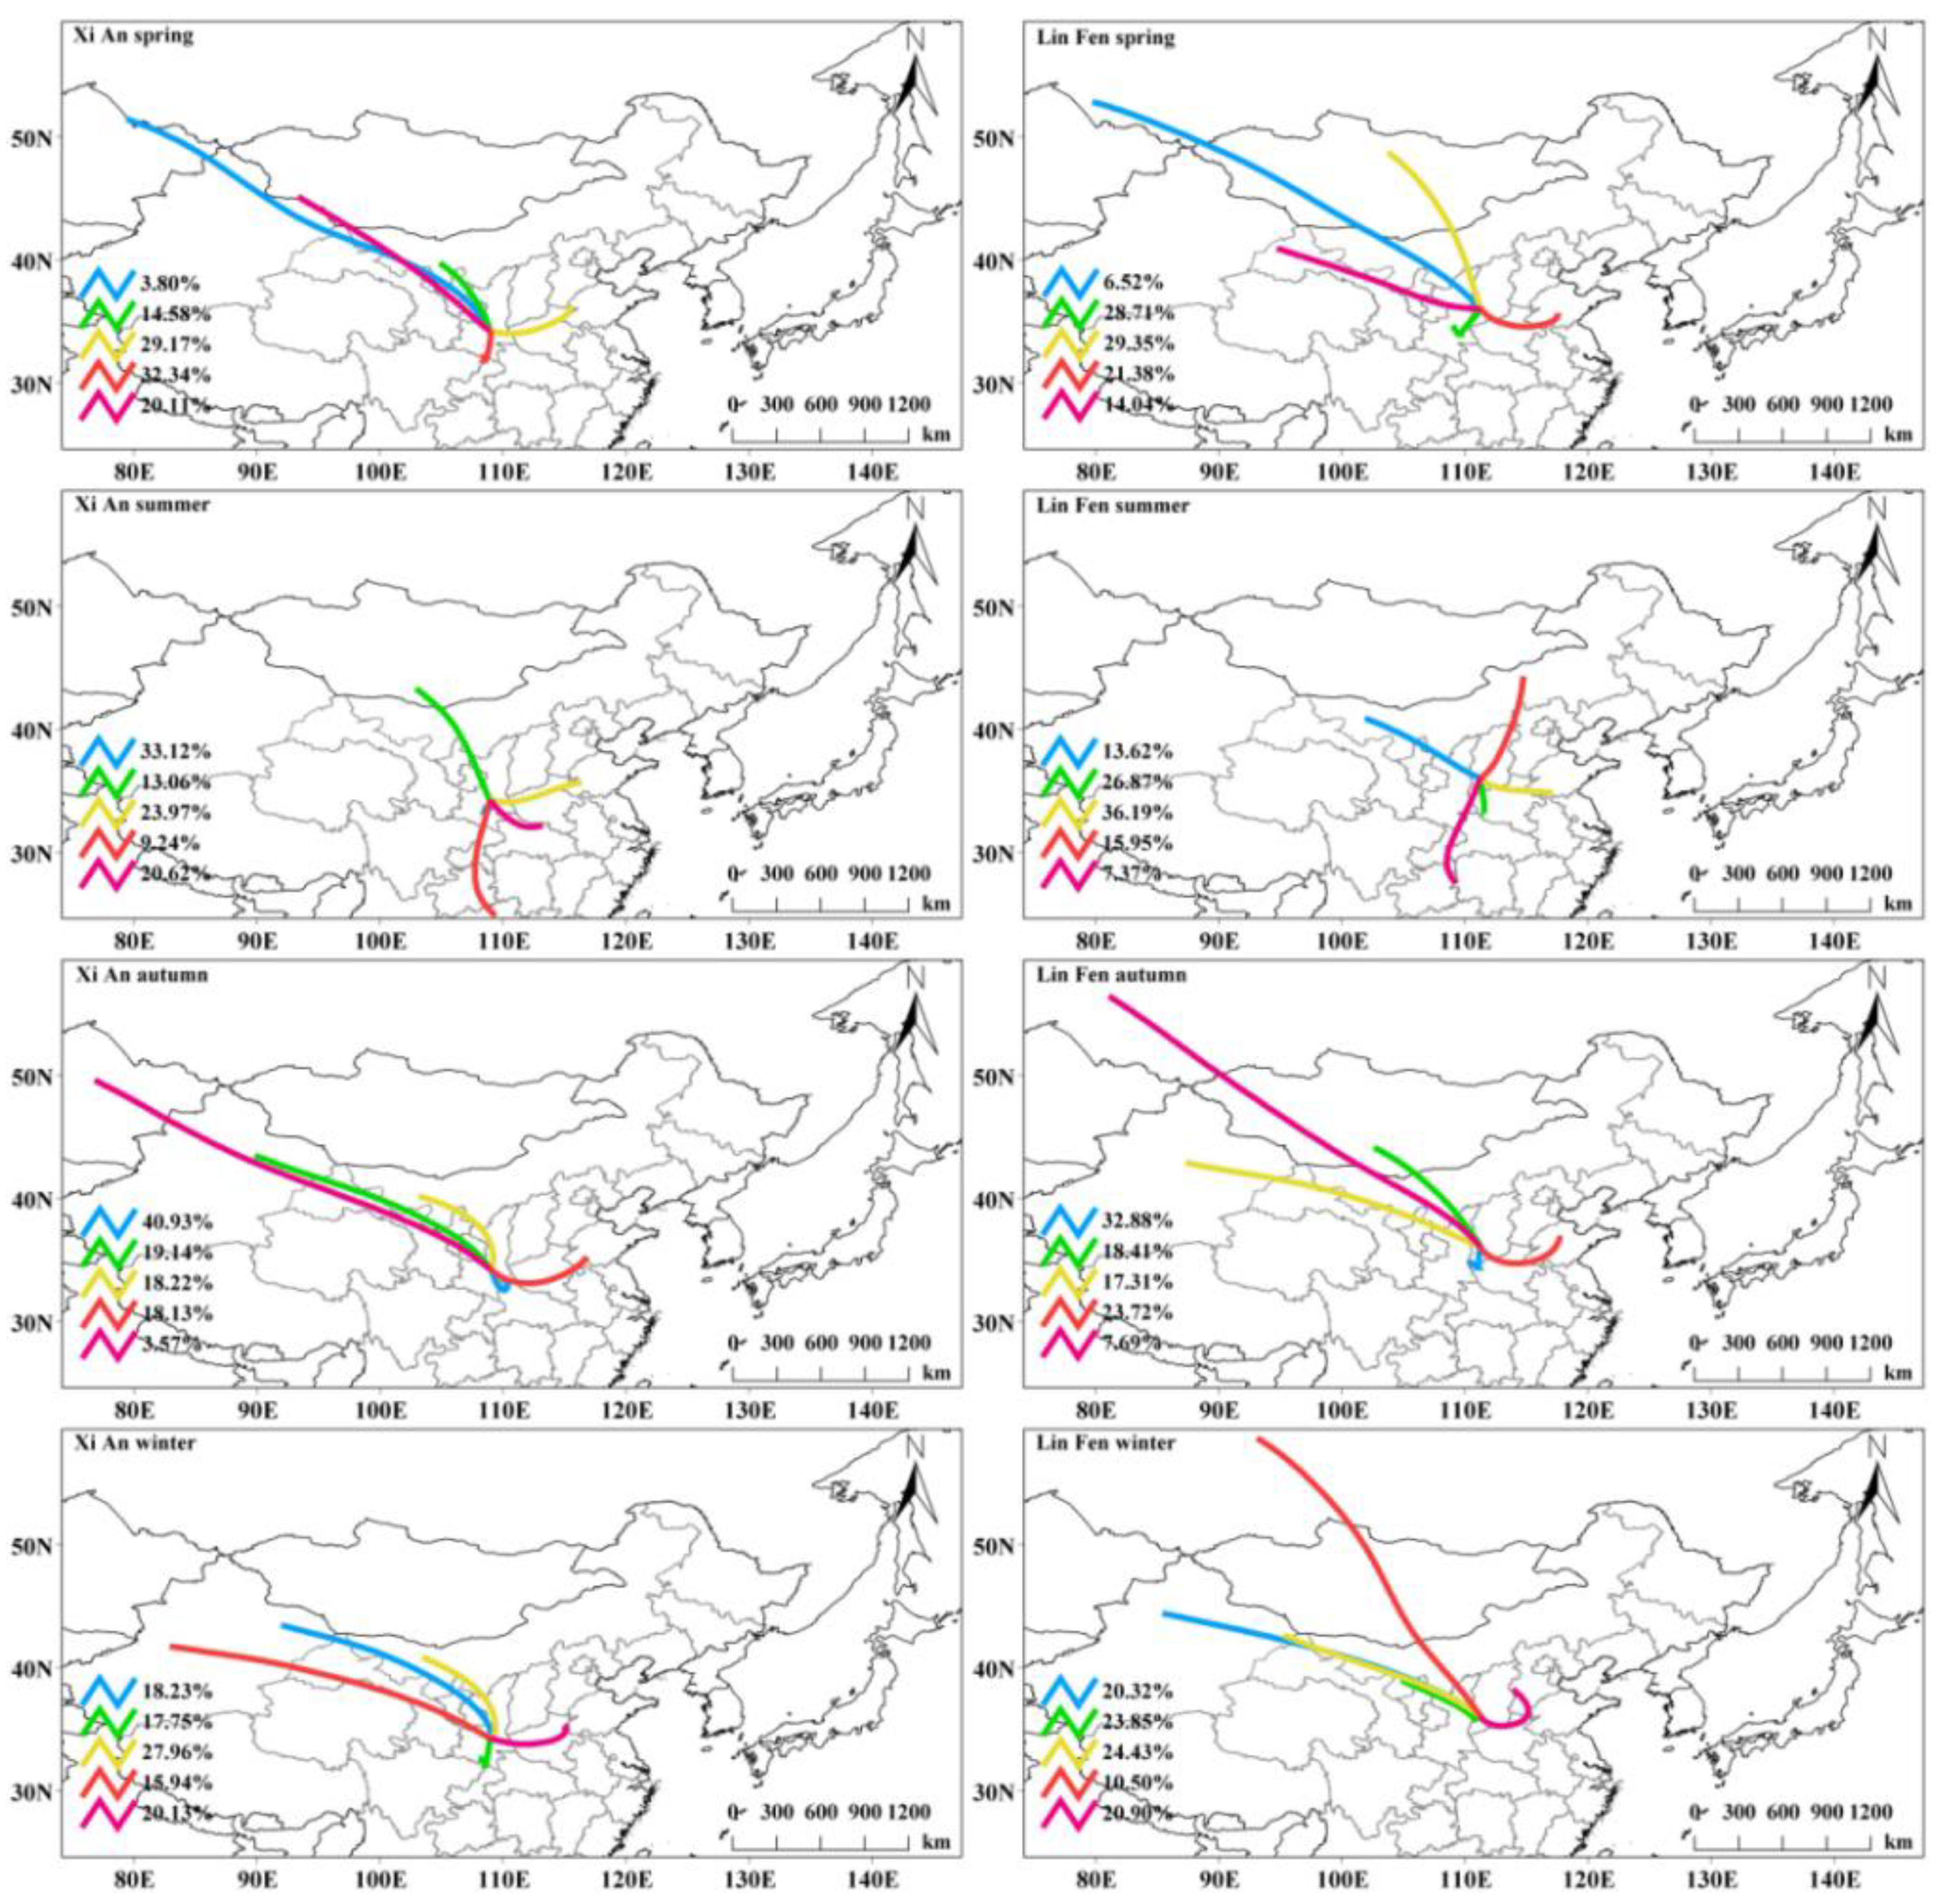
3.4. Analysis of External Transmission in Fenwei Plain

Through data review, it has been found that aerosols can be divided into local source aerosols and regional transport source aerosols according to the different origins of aerosols in a certain study area [32]. This paper selects the backward trajectory data from 2017 to 2019 based on the annual average value of UVAI. The specific reason is that the annual mean of UVAI from 2017 to 2019 years is more than 0.4, which is higher among the nine annual means. Therefore, the data of these three years are specially selected for analysis. Due to the large range of the Fenwei Plain, this paper mainly takes Xi’an (34.27° N, 108.95° E) and Linfen (36.04° N, 111.30° E) as the research points. Figure 7 is obtained by using the clustering algorithm to analyze the exogenous transport path of UVAI in the Fenwei Plain. In this paper, the transportation routes of each season are divided into five.
It can be seen from the left panel of Figure 7 that the main paths of spring air mass in Xi’an come from Shaanxi, Shandong, Inner Mongolia, Kazakhstan and Mongolia, of which Ankang city, Shaanxi province accounts for the largest proportion, reaching 32.34%; the summer air mass mainly comes from Shaanxi, Shandong, Hubei, Guangxi, and Mongolia, and Ankang city in Shaanxi province accounts for 33.12% of the total; the main routes of autumn air mass come from Shaanxi, Shandong, Inner Mongolia, Xinjiang and Kazakhstan, among which Shangzhou of Shaanxi province accounts for the largest proportion, reaching 40.93%. In winter, the air mass mainly comes from Xinjiang, Inner Mongolia, Shandong and Shaanxi, and Alxa Left Banner of Inner Mongolia accounts for 27.96%. There are two transport routes in Xinjiang, Hami city, and Awati county, accounting for 18.23% and 15.94%, respectively. There are two sources of transportation routes in Xinjiang, Hami city and Awati counties, accounting for 18.23% and 15.94%, respectively. It can be seen from this that the air mass transport paths in Xi’an in spring and summer are mainly in the east and southeast directions, and in autumn and winter, the northwest wind is the main direction. This is similar to the analysis results of Tang Zhiyi et al. on the meteorological conditions in Xi’an. The dominant wind direction does not change much in the winter half year, with northwesterly prevailing, followed by westerly [33].
Figure 7 shows that from the graph on the right side of Figure 7 that the main paths of the spring air mass in Linfen city come from Gansu, Shandong, Shaanxi, Russia and Mongolia, of which the Mongolia region accounts for the largest proportion of 29.35%; the main paths of the summer air mass come from Inner Mongolia and Shandong, Henan and Guizhou regions, and Jining city, Shandong province accounted for 36.19%, and Inner Mongolia has two sources of transportation routes—Xilinhot City and Alxa Left Banner—accounting for 15.95% and 13.62%, respectively; the main path of the autumn air mass comes from Xinjiang, Shanxi, Shandong, Russia and Mongolia, of which Yuncheng city in Shanxi province accounts for the largest proportion, reaching 32.88%; the main routes of the air mass in winter come from Xinjiang, Inner Mongolia, Hebei and Russia, and there are two sources of transport routes in Xinjiang, Hami City and Shawan county, accounting for 24.43% and 20.32%, respectively. It can be seen from this that the transportation path of the solar term in Linfen city in summer and autumn is mainly in the southeast direction, and the solar term in winter and spring is mainly in the northwesterly direction. Similarly, by analyzing the sources of air pollutants in Linfen city, Wei Xingpeng [34] found that the pollution of northwest and southeast transmission channels had a great impact on the external pollution of Linfen city, which was similar to the results of this paper. Moreover, Wei Xingpeng speculated that in autumn, the southeast transmission channel may be affected by the pollution of the layout of Jincheng city, which aggravated the air pollution in Linfen [34].
Combining with the distribution law of UVAI in the Fenwei Plain, UVAI was highest in winter, followed by autumn and spring, and lowest in summer. It can be seen that the sand and dust transported from the northwest in autumn and winter and the aerosols in the coal-producing area and the coal-fired heating area in the transmission channel contributed significantly to the UVAI values of Xi’an and Linfen during this time period. It can be seen from the above external transmission results that more attention should be paid to the influence of the atmospheric environment of Ankang city and Shangzhou city on Xi’an city; for Linfen city, more attention should be paid to the influence of Mongolia, Jining city, and Yuncheng city on the atmospheric environment of Linfen city. In order to reduce the aerosol index in the Fenwei Plain, a scientific and reasonable urban ventilation corridor should be formed according to the wind direction transmission problem in the study area combined with urban planning and construction, and cross-regional pollution control with related cities should also be strengthened.

4. Conclusions

The temporal and spatial variation characteristics of the Fenwei Plain are as follows: the distribution of aerosols decreases with the increase of altitude. The most polluted areas of the Fenwei Plain are distributed in the lower altitudes of Xianyang, Weinan, and Xi’an. The trend of the annual averages value of UVAI fluctuates upwards, with two “peaks” in 2013 and 2018, respectively. The average value of UVAI in the past 5 years is significantly larger than that in the previous 4 years, and the high-value area and the highest value of the Fenwei Plain from 2019 to 2020 have both shrunk and decreased compared with the previous year, but they have shown slow growth in the overall trend in the past 9 years. The seasonal averages of UVAI from 2012 to 2020 were the highest in winter (0.92), followed by autumn (0.42) and spring (0.23), and the lowest in summer (−0.04). It showed a slow downward trend in spring and winter and a slow upward trend in summer and autumn.
According to the correlation analysis between the Fenwei Plain and the influencing factors, it can be seen that precipitation, air temperature, and UVAI were all significantly negatively correlated, while air pressure and lifting index were significantly positively correlated with UVAI. As can be seen from the weight, the positive effect of temperature is the largest, followed by the negative effect of lifting index, the positive effect of precipitation, and finally the negative effect of air pressure.
The clustering results of the backward trajectory of the air masses in Xi’an and Linfen show that the sand and dust are generally transported from the northwest in autumn and winter to the Fenwei Plain. These transmitted aerosols may have been produced in the coal-producing area and the area with coal-fired heat sources. The contribution of these aerosols to increasing the UVAI is more significant during autumn and winter than at other times of year. In addition, the transportation path in Xi’an in the spring and summer brings air masses mainly from the east and southeast; the northwest wind in autumn and winter mainly brings air masses to the areas surrounding Ankang and Shangzhou. The transportation path in Linfen in summer and autumn mainly brings air masses from the southeast. Northwest winds prevail in winter and spring and bring air masses from Mongolia, Jining, and Yuncheng. Therefore, strengthening both the prevention of natural air pollution and the control of the release of industrial air pollutants will be a necessary part of future air quality management.
Based on the research results of UVAI value changes in the Fenwei Plain in the past nine years, it can be seen that the governance effect of Fenwei Plain was obvious after it was set as a key area in 2018. At the seasonal scale, the decline of UVAI value in winter was significantly reflected. However, on the annual scale, UVAI is still in the rising state, so the governance of the atmosphere in this region needs further study. In the governance of UVAI, planning and policy considerations can be taken into account, such as the establishment of urban ventilation corridors or the strengthening of links with related cities to promote cross-regional governance.

Author Contributions

S.L.: conceptualization, formal analysis, methodology, data curation, writing—original draft; T.J.: software, resources, project administration, writing—review and editing; B.P.: writing—review and editing; M.L.: investigation; S.P.: investigation. All authors have read and agreed to the published version of the manuscript.

Funding

This work was supported by the National Natural Science Foundation of China (2016YFC0500907) and the Natural Science Foundation of Gansu Province (CN) (17YF1FA120) at the Key Laboratory of Resource Environment and Sustainable Development of Oasis, Gansu province.

Data Availability Statement

The data that support the findings of this study are available from NASA (https://aura.gesdisc.eosdis.nasa.gov/data/Aura_OMI_Level2/OMAERUV.003/ accessed on 5 March 2021), but restrictions apply to the availability of these data, which were used under license for the current study and so are not publicly available. Data are however available from the authors upon reasonable request and with permission of NASA (https://aura.gesdisc.eosdis.nasa.gov/data/Aura_OMI_Level2/OMAERUV.003/ accessed on 5 March 2021).

Conflicts of Interest

The authors have no relevant financial or non-financial interests to disclose.

References

  1. Huang, J. Application of Satellite Remote Sensing Aerosol Optical Properties in Air Pollution Monitoring. Master’s Thesis, Ocean University of China, Qingdao, China, 2011. [Google Scholar]
  2. Zhu, E.; Ma, H. Research status of atmospheric aerosols in China. Environ. Sci. Manag. 2008, 33, 57–59. [Google Scholar] [CrossRef]
  3. Li, Z. A review of the impact of aerosols on China’s weather, climate and environment. J. Atmos. Sci. 2020, 43, 76–92. [Google Scholar] [CrossRef]
  4. Liu, C.; Chen, R.; Sera, F.; Vicedo-Cabrera, A.M.; Guo, Y.; Tong, S.; Coelho, M.S.Z.S.; Saldiva, P.H.N.; Lavigne, E.; Matus, P.; et al. Ambient Particulate Air Pollution and Daily Mortality in 652 Cities. N. Engl. J. Med. 2019, 381, 705–715. [Google Scholar] [CrossRef] [PubMed]
  5. Lin, L.; Jiang, D.; Zhong, W.; Huang, Y.; Huang, S.; Lin, X.; Li, L.; Zhu, Y.; Hu, Q.; Chen, J.; et al. The impact of atmospheric particulate matter pollution in coastal areas of Fujian on human health in 2017–2018. Strait Sci. 2020, 21–26+30. [Google Scholar] [CrossRef]
  6. Chen, M. Research on PM_(2.5) Inversion of Shenyang City Based on MODIS Data. Master’s Thesis, Shenyang Agricultural University, Shenyang, China, 2016. [Google Scholar]
  7. Cetin, M.; Agacsapan, B.; Cabuk, S.N.; Kurkcuoglu, M.A.S.; Pekkan, O.I.; Argun, E.B.; Dabanlı, A.; Kucukpehlivan, T.; Yilmazel, B.; Cabuk, A. Assessment of the Ecological Footprint of Eskisehir Technical University–Iki Eylul Campus. J. Indian Soc. Remote Sens. 2021, 49, 2311–2327. [Google Scholar] [CrossRef]
  8. Cetin, M. Climate comfort depending on different altitudes and land use in the urban areas in Kahramanmaras City. Air Qual. Atmos. Health Int. J. 2020, 13, 991–999. [Google Scholar] [CrossRef]
  9. Cetin, I.Z.; Ozel, H.B.; Varol, T. Integrating of settlement area in urban and forest area of Bartin with climatic condition decision for managements. Air Qual. Atmos. Health Int. J. 2020, 13, 1013–1022. [Google Scholar] [CrossRef]
  10. Cetin, M.; Adiguzel, F.; Gungor, S.; Kaya, E.; Sancar, M.C. Evaluation of thermal climatic region areas in terms of building density in urban management and planning for Burdur, Turkey. Air Qual. Atmos. Health 2019, 12, 1103–1112. [Google Scholar] [CrossRef]
  11. Cetin, M.; Aksoy, T.; Cabuk, S.N.; Kurkcuoglu, M.A.S.; Cabuk, A. Employing remote sensing technique to monitor the influence of newly established universities in creating an urban development process on the respective cities. Land Use Policy 2021, 109, 105705. [Google Scholar] [CrossRef]
  12. Kilicoglu, C.; Cetin, M.; Aricak, B.; Sevik, H. Integrating multicriteria decision-making analysis for a GIS-based settlement area in the district of Atakum, Samsun, Turkey. Arch. Meteorol. Geophys. Bioclimatol. Ser. B 2020, 143, 379–388. [Google Scholar] [CrossRef]
  13. Wang, J.; de Leeuw, G.; Niu, S.; Kang, H. Contrasting Aerosol Optical Characteristics and Source Regions during Summer and Winter Pollution Episodes in Nanjing, China. Remote Sens. 2019, 11, 1696. [Google Scholar] [CrossRef] [Green Version]
  14. Zhang, G.; Ju, T.; Wang, Q.; Li, F.; Zhang, Y.; Ma, C. Research on the temporal and spatial distribution of absorptive aerosols in Ningxia and its influencing factors. China Environ. Sci. 2020, 40, 2371–2380. [Google Scholar] [CrossRef]
  15. Singh, N.; Banerjee, T.; Raju, M.P.; Deboudt, K.; Sorek-Hamer, M.; Singh, R.S.; Mall, R.K. Aerosol chemistry, transport, and climatic implications during extreme biomass burning emissions over the Indo-Gangetic Plain. Atmos. Chem. Phys. 2018, 18, 14197–14215. [Google Scholar] [CrossRef] [Green Version]
  16. Li, F.; Ju, T.; Ma, C.; Xian, L. Research on absorptive aerosols in Gansu Province based on satellite remote sensing. China Environ. Sci. 2019, 39, 4082–4092. [Google Scholar] [CrossRef]
  17. Gao, X.; Gui, H.; Pan, L.; Wang, N.; Wang, J. Analysis of air pollution in the Fenwei Plain based on satellite remote sensing and ground observation data. J. Meteorol. Environ. 2020, 36, 36–44. [Google Scholar] [CrossRef]
  18. Sun, B.; Li, F. The dilemma of smog control in the Fenwei Plain and its solution: Based on the perspective of inter-governmental collaborative governance. Adm. Law 2020, 47–53. [Google Scholar] [CrossRef]
  19. Lei, X.; Li, H.; Zhang, G.; Li, H.; Wang, J.; Lei, T. Analysis of the current situation and evolution of drought and flood in the Fenwei Plain. Chinese Meteorological Society. In The 31st Annual Meeting of the Chinese Meteorological Society S5 Drought Disaster Risk Assessment and Prevention and Control; Chinese Meteorological Society: Beijing, China, 2014; Volume 8. [Google Scholar]
  20. Li, Y.; Li, J.; Zeng, S.; Zhu, L.; Wang, W. Analysis of the characteristics of atmospheric particulate matter pollution in the eastern Fenwei Plain in 2017. Environ. Sci. Res. 2020, 33, 63–72. [Google Scholar] [CrossRef]
  21. Qin, Z.; Liao, H.; Chen, L.; Zhu, J.; Qian, J. The influence of air quality and meteorological elements on the daily and interannual variability in Fenwei Plain. Atmos. Sci. 2021, 45, 1–19. [Google Scholar] [CrossRef]
  22. Li, Y.; Cong, T.; Jia, J. Fuzzy comprehensive evaluation of urban air quality in fenwei plain based on entropy weight method. Environ. Eng. 2020, 38, 236–243+206. [Google Scholar] [CrossRef]
  23. Gao, X. Aerosol Optical Properties and Climate Effects in Typical Regions of China. Doctoral Thesis, Lanzhou University, Lanzhou, China, 2018. [Google Scholar]
  24. Li, F. Research on Absorptive Aerosols in China Based on OMI Data. Master’s Thesis, Northwest Normal University, Lanzhou, China, 2020. [Google Scholar]
  25. Zhou, B.; Liu, D.; Wei, J.; Peng, H.; Niu, W.; Xia, J. Preliminary analysis of the scavenging effect of precipitation on aerosol particles. Resour. Environ. Yangtze River Basin 2015, 24, 160–170. [Google Scholar] [CrossRef]
  26. Zhang, T.; Wang, Y.; Cheng, B. Long-term variation of aerosol optical depth in Sichuan Basin from 1961 to 2013 and its relationship with air temperature. J. Environ. Sci. 2017, 37, 793–802. [Google Scholar] [CrossRef]
  27. Liu, Y.; Jin, X.; Yan, X.; Ma, N.; Li, F. Analysis of aerosol variation characteristics and its relationship with meteorological conditions in Yinchuan City. Environ. Sci. Technol. 2014, 37, 123–128. [Google Scholar] [CrossRef]
  28. Liu, T.; Huang, X.; Gao, Q.; Ma, Z.; Xie, B.; Hu, S. Spatial and temporal distribution characteristics of aerosols under different meteorological conditions. Environ. Sci. Res. 2013, 26, 122–128. [Google Scholar] [CrossRef]
  29. Xu, X.; Yu, X.; Zhu, Y.; Dai, J.; Dong, Z. Effects of aerosols on low-level wind speed in mid-latitude summer in China. Plateau Meteorol. 2021, 40, 367–373. [Google Scholar] [CrossRef]
  30. Shi, Q. Temporal and spatial variation and mechanism of tropospheric potential temperature, mixing ratio and lifting index in Tianshan Mountains. J. Mt. Sci. 2018, 36, 844–856. [Google Scholar] [CrossRef]
  31. Zhao, C.; Wang, Y.; Wang, Y.; Zhang, H.; Zhao, B. Spatiotemporal distribution of PM_(2.5) and PM_(10) pollution levels in winter and spring in Beijing and their relationship with meteorological conditions. Environ. Sci. 2014, 35, 418–427. [Google Scholar] [CrossRef]
  32. Shi, C.; Yu, X. Local and Regional Sources of Aerosol Pollution in Beijing; China Science and Technology Papers Online: Beijing, China, 2012; Available online: http://www.paper.edu.cn/releasepaper/content/201206-270 (accessed on 27 September 2021).
  33. Tang, Z.; Xu, J.; Zhang, Y.; Luo, H.; Yang, X. Analysis of the characteristics of automobile exhaust pollutants and meteorological conditions in Xi’an. Meteorol. Environ. Sci. 2020, 43, 70–78. [Google Scholar] [CrossRef]
  34. Wei, X.; Zhao, X. Source Analysis of Air Pollutants in Linfen City Based on Trajectory Model. Yunnan Chem. Ind. 2018, 45, 193–195. [Google Scholar] [CrossRef]
Figure 1. Overview of the study area: (a) location of the study area within the provinces and other administrative boundaries of China and (b) digital elevation map of the study area.
Atmosphere 13 01728 g001
Figure 2. Spatial distribution of the daily ultraviolet aerosol index (UVAI) in the Fenwei Plain during 2012–2020.
Atmosphere 13 01728 g002
Figure 3. The average annual change of UVAI value in the Fenwei Plain from 2012 to 2020.
Atmosphere 13 01728 g003
Figure 4. Temporal changes of UVAI values in the Fenwei Plain from 2012 to 2020: (a) the proportion of different grades of the annual average UVAI value and the change of the annual average value and (b) the comparison chart of the UVAI value change between the Fenwei Plain and China.
Atmosphere 13 01728 g004
Figure 5. Seasonal changes of UVAI in the Fenwei Plain from 2012 to 2020: (a) the four-season spatial distribution of UVAI values and (b) the four-season temporal change of UVAI values.
Atmosphere 13 01728 g005
Figure 6. Gravel diagram of principal component analysis of meteorological factors in Fenwei Plain.
Atmosphere 13 01728 g006
Figure 7. Air mass transport path in the four seasons of 2017–2019 in the Fenwei Plain.
Atmosphere 13 01728 g007
Table 1. Pearson correlation-standard format.
ProjectUVAIPrecipitationTemperaturePressureLifting Index
UVAI1
Precipitation−0.788 **1
Temperature−0.909 **0.911 **1
Pressure0.823 **−0.736 **−0.900 **1
Lifting index0.952 **−0.897 **−0.977 **0.846 **1
** p < 0.01.
Table 2. KMO and Bartlett’s test.
KMO and Bartlett’s Test
KMO value0.706
Bartlett’s sphericity testApproximate chi-square221.168
df6
p-value0.000
Table 3. Linear combination coefficients and weight results.
Linear Combination Coefficients and Weight Results
NamePrincipal Component 1Comprehensive Score CoefficientWeights
Characteristic root3.638
Variance interpretation rate90.95%
Precipitation0.48740.487424.39%
Temperature0.52120.521226.08%
Pressure0.47800.478023.92%
Lifting index0.51210.512125.62%
Publisher’s Note: MDPI stays neutral with regard to jurisdictional claims in published maps and institutional affiliations.

