Article

Characteristics of Ozone Pollution and the Impacts of Related Meteorological Factors in Shanxi Province, China

1
Shanxi Institute of Meteorological Science, Taiyuan 030002, China
2
Wutaishan Cloud Physics Field Experiment Base, China Meteorological Administration, Taiyuan 030002, China
3
Key Laboratory of Cloud-Precipitation Physics and Severe Storms, Institute of Atmospheric Physics, Chinese Academy of Sciences, Beijing 100029, China
4
School of Earth and Planetary Sciences, University of Chinese Academy of Sciences, Beijing 100049, China
5
Jinzhong Meteorological Bureau of Shanxi Province, Jinzhong 030600, China
6
Shanxi Ecological Environment Monitoring and Emergency Support Center, Taiyuan 030024, China
*
Author to whom correspondence should be addressed.
Atmosphere 2022, 13(10), 1729; https://doi.org/10.3390/atmos13101729
Submission received: 5 October 2022 / Revised: 14 October 2022 / Accepted: 17 October 2022 / Published: 20 October 2022
(This article belongs to the Special Issue Air Pollution in China (2nd Edition))

Abstract

:
Based on environmental monitoring data and meteorological observation data of the Chinese major energy province, Shanxi, from 2015 to 2020, using the satellite remote sensing data of Atmospheric Infrared Sounder Instrument (AIRS) and Ozone Monitoring Instrument (OMI) in 2017, we analyzed the characteristics of surface ozone (O3) pollution and its correlation with meteorological factors, as well as the vertical distribution of O3 in typical pollution cities in Shanxi Province. The results showed that surface O3 became the primary pollutant in Shanxi. Surface O3 has shown a zonal distribution with a high level in the south and a low level in the north region since 2017. Surface O3 pollution was severe in 2019, and the maximum daily 8 h running average of O3 (MDA8 O3) decreased, but annual mean O3 in northern and central regions showed a slow rising trend in 2020. Comprehensive analyses of the influence of meteorological factors on surface O3 indicated that O3 pollution in Linfen, Yuncheng and Taiyuan was mainly caused by local photochemical reactions, while that in Jincheng, Xinzhou, Lvliang and Yangquan resulted from regional transports. O3 volume mixing ratios (VMR) in the middle and lower troposphere generally increased with altitude, peaking at 120 ppbv at approximately 400 hPa. The positive vertical gradient of O3 in the boundary layer was obvious in Taiyuan in summer and significant in the surface layer in Taiyuan and Linfen during winter and spring, which was associated with greater atmospheric dynamic stability and suppressed vertical mixing. Due to the lack of direct detection of O3 in the lower troposphere in this region, O3 vertical distribution retrieved by satellite observation is critical for the study of vertical mixing and transport of local O3, as well as its regional transport characteristics.

1. Introduction

Ozone (O3) is an important trace gas found mostly (approximately 90%) in the stratosphere, with the remainder (10%) in the troposphere [1], which can not only effectively absorb solar ultraviolet radiation but also is a strong greenhouse gas [2]. Changes in O3 affect the balance of atmospheric vertical radiation and the distribution of the energy budget, thus influencing the climate [3,4]. Human activities have caused decreases in stratospheric O3 and increases in tropospheric O3 [5]. On the one hand, this leads to stratospheric cooling and prolonging the lifetime of cold air masses, promoting the loss of O3. On the other hand, it has directly increased tropospheric ultraviolet radiation, aggravating the greenhouse effect and having long-term negative effects on the Earth’s organisms [2].
Tropospheric O3 mainly comes from stratospheric downward transport and tropospheric photochemical processes [6], and atmospheric photochemistry is much more important to surface O3 [7,8]. Nitrogen oxides (NOx = NO + NO2), volatile organic compounds (VOCs) and carbon monoxide (CO) produced by automobile exhaust and industrial emissions are the primary precursors of tropospheric O3 photochemical reactions [9], while photolysis rates of each precursor are different [10]. NOx, alkenes, aromatics and aldehydes have higher photochemical reactivity and shorter lifetimes, have limited transmission distance and are mainly produced from local pollution, while alkanes have lower photochemical reactivity and longer lifetimes so that they can be transported a further distance from their sources [11]. Photochemical reaction rate and production of O3 are mainly affected by the concentrations of NOx and VOCs and different VOC/NOx ratios [6,12]. CO with high reaction inertia and its influence on O3 changes is less than NOx [13]. Tropospheric O3 can exist for a long time and be transported across regions [14]. Wang et al. [15] simulated the contribution of O3 precursor emissions from different regions in Beijing by using the Comprehensive Air Quality Model (CAMx model) and found that regional transport accounted for more than 50% of O3 pollution in urban areas, including approximately 70% transport of O3 and 30% transport of O3 precursors.
Local surface O3 not only depends on photochemical precursors but also associates with weather systems [16,17] and meteorological conditions. Solar ultraviolet radiation intensity directly affects photochemical processes and is highly positively correlated with O3 concentration [18,19]. Air temperature can reflect solar radiation intensity to a certain extent [20] and is positively correlated with O3 [21,22], though this correlation clearly varies with season and weather conditions [23,24]. Relative humidity represents atmospheric water vapor content. The primary sinks of tropospheric O3 are photodecomposition in the presence of water vapor [25] and heterogeneous reactions removal in the aqueous phase [6]. Atmospheric water vapor can directly affect O3 by influencing the complex chemical reactions of HOx (Hox = H + OH + HO2) [22,26]. Higher relative humidity is usually associated with higher fractions of clouds, which slows down photochemical processes by reducing radiation intensity [22] and is related to greater atmospheric instability that inhibits the diffusion of O3 [27]. Furthermore, dry deposition of O3 onto vegetation through stomatal uptake is suppressed when relative humidity is very low. Vertical and horizontal flow fields directly affect the transport of O3 and its precursors [28]. For example, a low wind speed is unfavorable for high levels of local O3 diffusion, while atmospheric dynamic transmission transports high O3 from the upper troposphere to the surface when wind speed is high, resulting in an increase in surface O3 [23] (Xu et al., 1994). Upwind O3 also has a significant impact on downwind [29]. In addition, wet deposition of precipitation [30] and anthropogenic triggering lightning can also impact O3 and its precursors [31].
At present, industrial production and automobile exhaust emissions lead to severe surface O3 pollution in China [32,33], while North China has become one of the most serious regions [34]. As a major energy province in China, Shanxi Province is located in the west of North China. Among 11 cities in Shanxi, four cities (Taiyuan, Yangquan, Changzhi and Jincheng) have been listed as “2 + 26” cities by the Beijing–Tianjin–Hebei air pollution transmission channel (Ministry of Ecology and Environment of the People’s Republic of China, MEE) [35], and four cities (Lvliang, Jinzhong, Linfen and Yuncheng) are located in the Fen-Wei Plain. In addition, Taiyuan and Linfen always rank among the ten cities of poorest air quality in China [36]. However, systematic research on Shanxi Province’s O3 pollution is relatively limited. Therefore, this paper examines the pollution and variation properties of surface O3 in Shanxi Province in the last 6 years (2015–2020), analyzes the significant meteorological factors impacting O3, and discusses the formation mechanism of O3 pollution in different cities to provide a reference for decision—making in O3 pollution prevention and control in this region.

2. Data and Methods

For surface O3, we used hourly urban air quality data derived from the environmental monitoring center of Shanxi Province and daily evaluation of urban air quality from the data center of the Ministry of Ecology and Environment (https://datacenter.mee.gov.cn/websjzx/queryIndex.vm, accessed on 10 January 2021), which included 58 national control stations in urban regions of 11 cities in Shanxi Province. Meteorological data were obtained from 11 surface meteorological observation stations closest to the environmental monitoring stations of each city (all located at the urban fringe). Based on the national Environmental Air Quality Evaluation Standards and Specifications in China [37,38], the O3 daily evaluation index is a maximum daily 8 h running average of O3 (MDA8 O3); once that value exceeds 160 μg·m−3, this means daily O3 nonattainment. O3 annual evaluation of each city is determined as the 90th percentile concentration of MDA8 O3, and the annual O3 nonattainment is identified at values exceeding 160 μg·m−3.
The O3 profile came from satellite remote sensing data of Atmospheric Infrared Sounder Instrument (AIRS) and Ozone Monitoring Instrument (OMI) (https://disc.sci.gsfc.nasa.gov/, accessed on 20 January 2021). AIRS is a high spectral resolution infrared sounder onboard the National Aeronautics and Space Administration (NASA) Aqua satellite that uses an infrared band with 26 wavelength channels near 9.6 μm wavelength to retrieve the O3 profile [39]. The data version of the AIRS O3 profile is NASA AIRS2SUP 7.0. OMI is a nadir-viewing near-UV/visible CCD spectrometer aboard NASA Aura satellite that retrieves the O3 profile using the UV1 channel (270–308.5 nm) and the first part of the UV2 channel (311.5–330 nm) [40]. The data version of OMI O3 profile is NASA OMO3PR. Aura flies in a formation approximately 15 min behind Aqua [41], so their observations can be considered simultaneous. The data in this paper were screened by a quality control process [42,43,44]. Both O3 profiles have been verified by both ozonesondes and ground stations and showed a great ability to retrieve vertical O3 in the stratosphere and upper troposphere but needed improvement in the middle and lower troposphere [40,45].

3. Result and Discussion

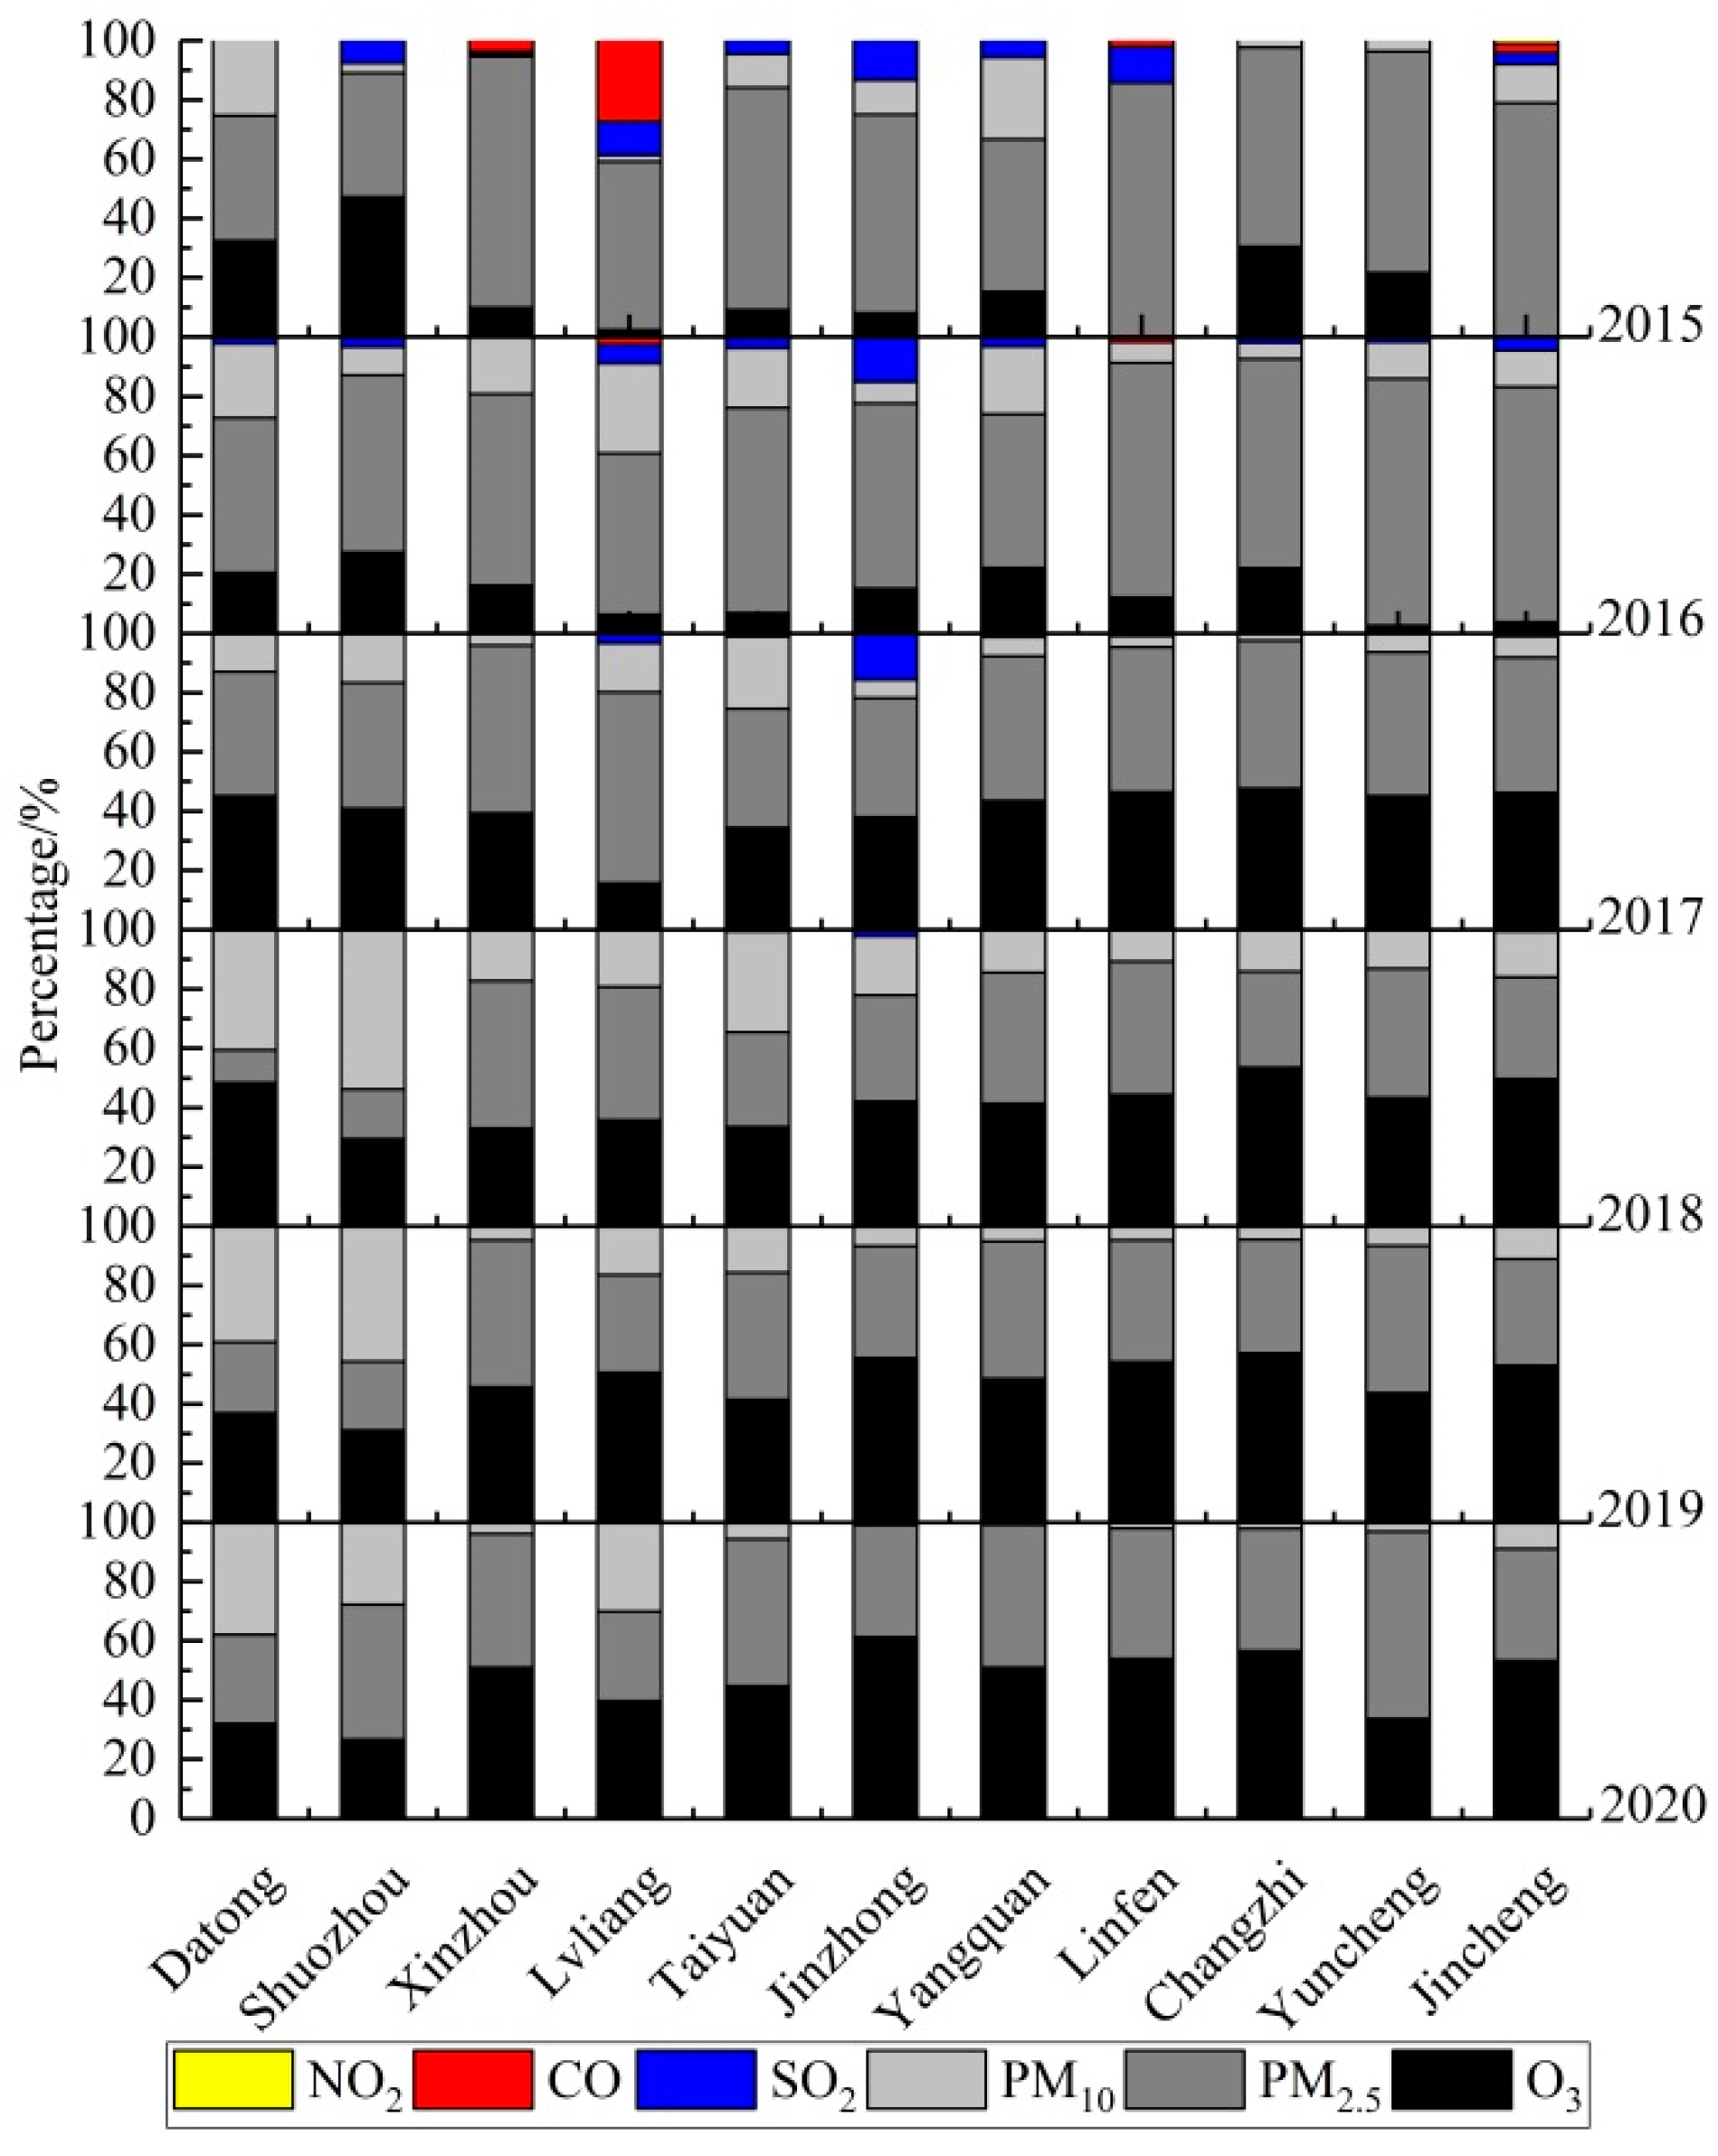
3.1. Characteristics of Surface O3 Pollution

3.1.1. Surface O3 Pollution

The topography of Shanxi is complex, with most cities located in the plains and basins between mountains. Taiyuan is the economic, political and cultural center. Figure 1 shows the topography and distribution of administrative divisions of Shanxi.
To illustrate the current air pollution situation in recent years, Figure 2 shows the variation in the proportion of nonattainment days of six primary pollutants in 11 cities in Shanxi Province from 2015 to 2020. Only Shuozhou had a relatively high proportion of O3 nonattainment days in 2015, reaching 47.62%. The primary pollutant was mainly PM2.5 in 2016, while the proportion of O3 nonattainment days remained at a low level. For 10 of the cities (excluding Lvliang), O3 was the secondary pollutant (following PM2.5) in 2017. O3 was the primary pollutant of several cities from 2018 and became the most important pollutant in the central and southern cities from 2019. In 2020, the proportion of O3 nonattainment days exceeded 60% in Jinzhong and more than 50% in Changzhi, Linfen, Jincheng, Xinzhou and Yangquan. In summary, the primary air pollutants in Shanxi were mainly PM2.5 and PM10, and the proportion of O3 nonattainment days was relatively low from 2015 to 2016. Since 2017, Shanxi has begun to show a typical trend of compound pollution [46] of both PM2.5 and O3, with PM2.5 pollution mainly occurring in autumn and winter and O3 pollution in summer. Meanwhile, the proportion of PM2.5 nonattainment days gradually decreased, while O3 increased significantly. O3 had exceeded PM2.5 in most cities, becoming the primary air pollutant in Shanxi at present, and the proportion of O3 nonattainment days was over 40% annually.
Figure 3 shows the 90th percentile of MDA8 O3. The 90th percentile of MDA8 O3 was below 160 μg·m−3 in most cities in Shanxi, except for Shuozhou in 2015, and no city exceeded the standard in 2016. From 2017 to 2019, seven or eight cities, mainly in central and southern Shanxi, exceeded the standard each year. It is worth noting that in 2020, there were still eight cities in Shanxi that exceeded the MDA8 O3 standard despite the significant reduction in overall pollution. The following is a detailed analysis of the distribution of surface O3.

3.1.2. Monthly Mean Surface O3

Figure 4 shows the variations in the monthly mean O3 mass concentration and cumulative nonattainment days. As a whole, both of these measures were higher in May to August in the summer half-year, while lower in the winter half-year. The peak values of monthly O3 and cumulative nonattainment days were low in 2015 and 2016, significantly increased in 2017 and 2018, reached the highest levels in 2019, and slightly decreased in 2020. The monthly mean O3 exceeded 100 μg·m−3 from June to July during 2017–2020 except in July 2018. In May to July 2017, June 2018, May to July 2019 and June to July 2020, there were more than a hundred cumulative O3 nonattainment days, and each city exceeded the standard by 9.1 d per month on average. Moreover, there were nearly 200 cumulative nonattainment days, and each city exceeded the standard by an average of 18.2 d in June 2020. It is worth pointing out that the values in September and October 2019 were significantly higher than those in previous years, and O3 nonattainment occurred for the first time in February. Furthermore, O3 in September 2020 remained at a high level. All these results indicated that surface O3 pollution has been worse in spring and autumn in the last two years.

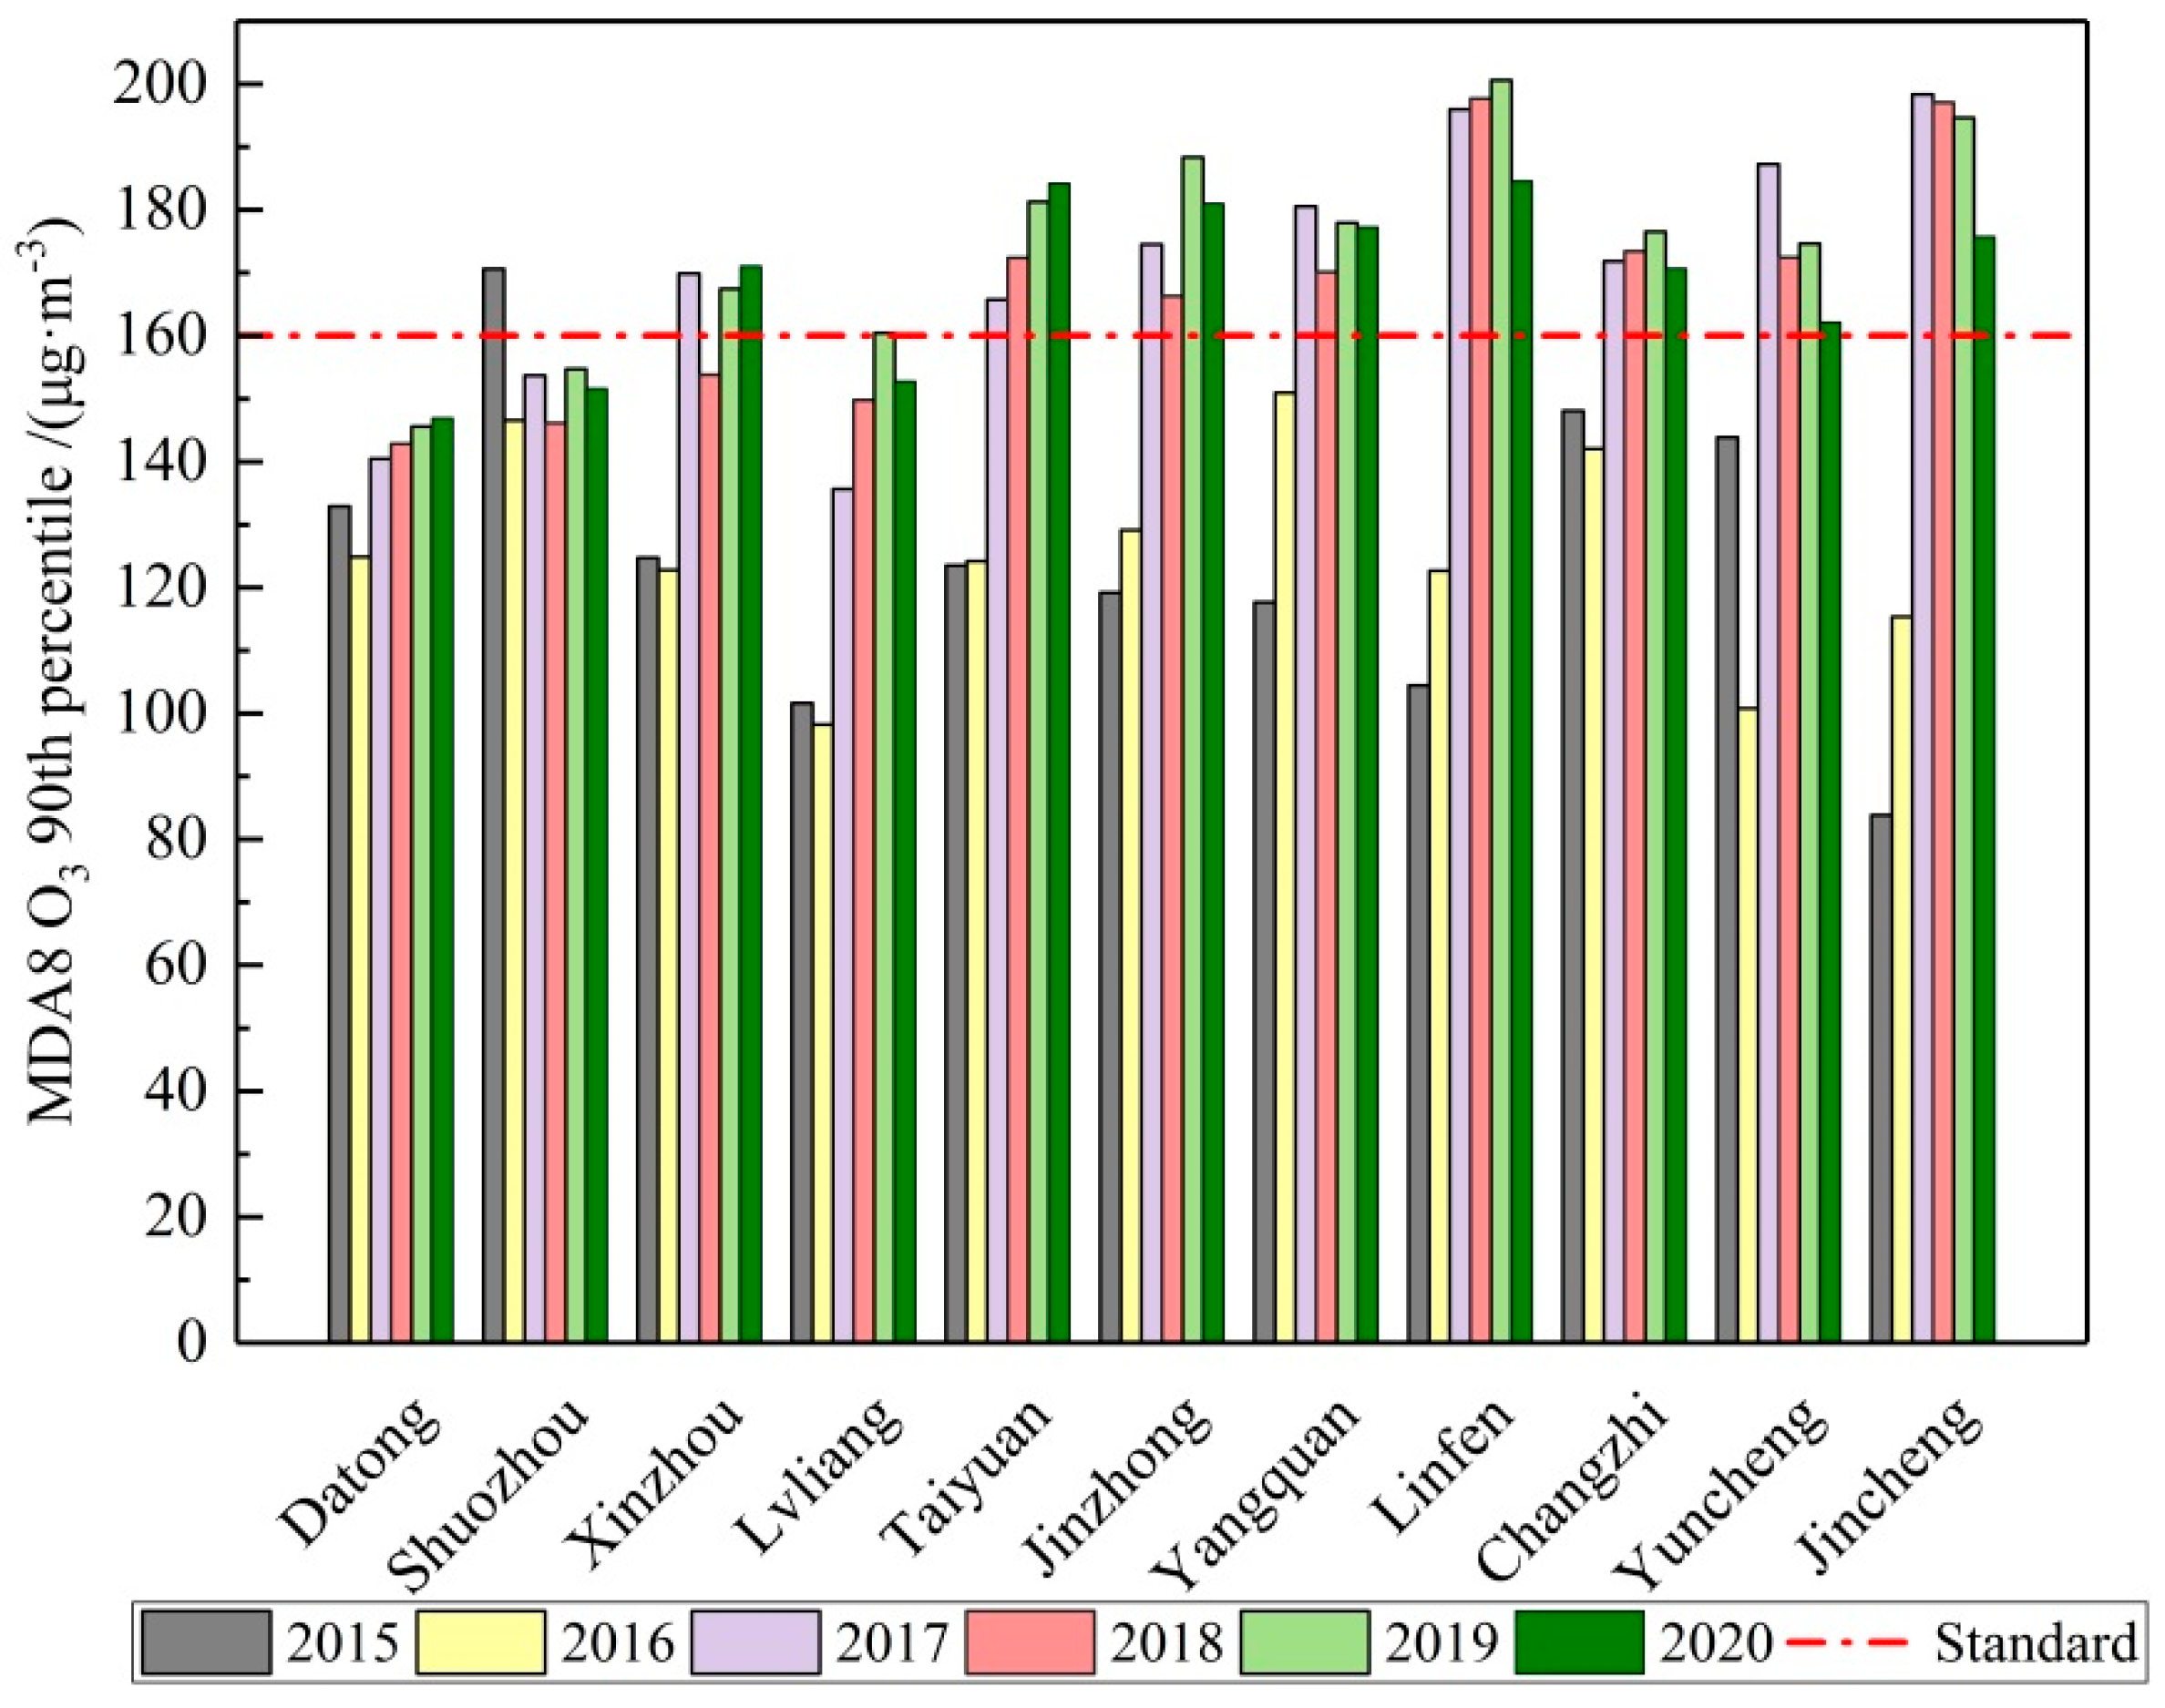
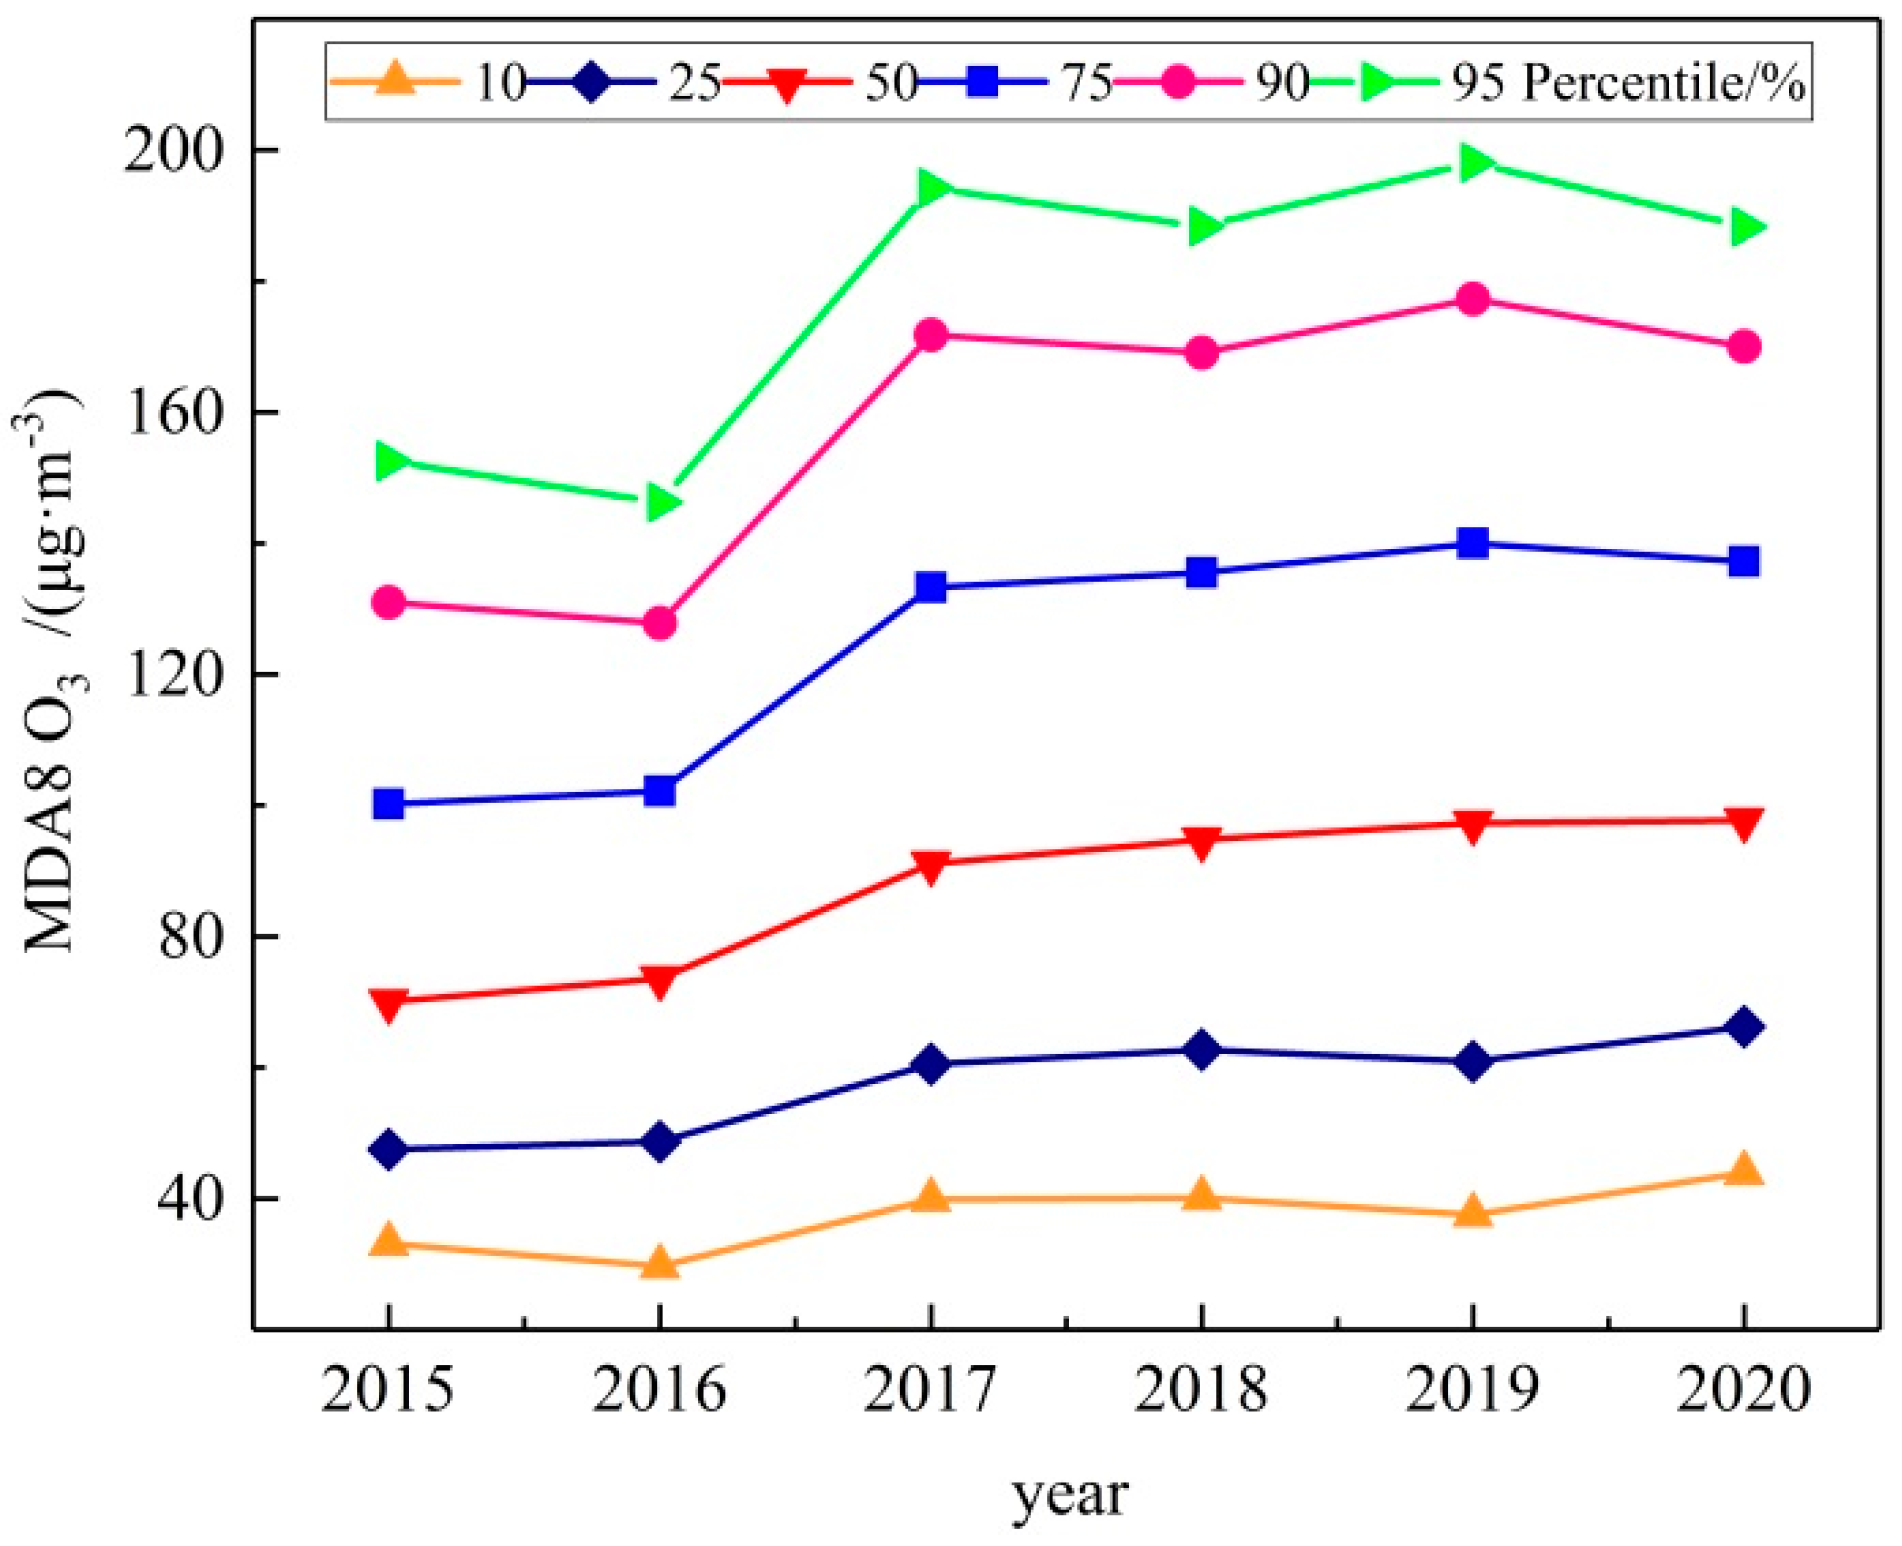
3.1.3. MDA8 O3 at Each Percentile

Figure 5 shows the percentile variation in the annual mean MDA8 O3. Compared with 2015, MDA8 O3 above the 90th percentile slightly decreased in 2016, which was consistent with the few O3 nonattainment days that year. In 2017, each percentile of MDA8 O3 sharply increased, especially above the 50th percentile, and the MDA8 O3 90th and 95th percentiles reached 172 μg·m−3 and 194 μg·m−3, respectively, indicating a high concentration and high value at high percentile levels of surface O3 pollution. MDA8 O3 slightly increased below the 75th percentile and decreased above the 90th percentile in 2018. MDA8 O3 above the 50th percentile significantly increased and reached a peak in 2019. MDA8 O3 at both the 90th and 95th percentiles exceeded 160 μg·m−3 in 2020, suggesting that high−level O3 pollution remains in Shanxi Province despite the slight decrease in high concentration.
Drastic measures have been taken to reduce SO2, NOx and dust in recent years in Shanxi Province. According to the Ecological Environment Bulletin of Shanxi Province [47], SO2 and NOx emissions in Shanxi decreased by 30.0% and 23.8%, respectively, in 2020 compared with 2015. Over the past 6 years, the annual mean surface mass concentrations of NO2 reached a peak in 2017 and decreased by 16.7% from 2018 to 2020. Meanwhile, PM10 and PM2.5 reached their highest values in 2016 to 2017 and continued to decrease by 23.9% and 25.4%, respectively, from 2018 to 2020. Surface NO2 in Shanxi was relatively low in 2015–2016, and O3 pollution was mild. However, O3 pollution intensified as surface NO2 increased in 2017 and did not lessen, although surface NO2 declined after 2018. Pollution emission reductions not only reduce the concentration of gaseous pollutants but also significantly decrease the concentration of atmospheric particulate matter. However, the relationship between surface O3 and particulate matter is quite complex. On the one hand, in terms of the direct radiative forcing of particulate matter, absorbing particulate matter can weaken the photolysis rate and lead to an increase in O3, while scattering particulate matter can enhance the photolysis rate and result in a decrease in O3 [48,49,50]. On the other hand, heterogeneous chemical reactions of particulate matter may generate or remove free radicals (such as HONO and HO2) or other active precursors (such as N2O5) in O3 photochemical reaction processes, thus inhibiting or promoting O3 generation [26,51,52,53] (Tan et al., 2017; Tan et al., 2018; Lu et al., 2019a; Lu et al., 2019b). Qu et al. [54] pointed out that the photolysis rate effect can cause a greater O3 reduction when particle concentrations are higher, while heterogeneous reactions reduce O3 mainly at low-level particle concentrations. In addition, the aerosol direct-radiation cooling effect caused by the reduction of particulate matter could change atmospheric dynamics and the photolysis rate, which may increase O3 in winter but benefit the reduction in maxima O3 in summer [55,56] (Xing et al., 2017; Yu et al., 2020). In summary, under the current background of the compound pollution of atmospheric particulate matter and surface O3, examining the synergism between these factors is important for comprehensively treating air pollution.

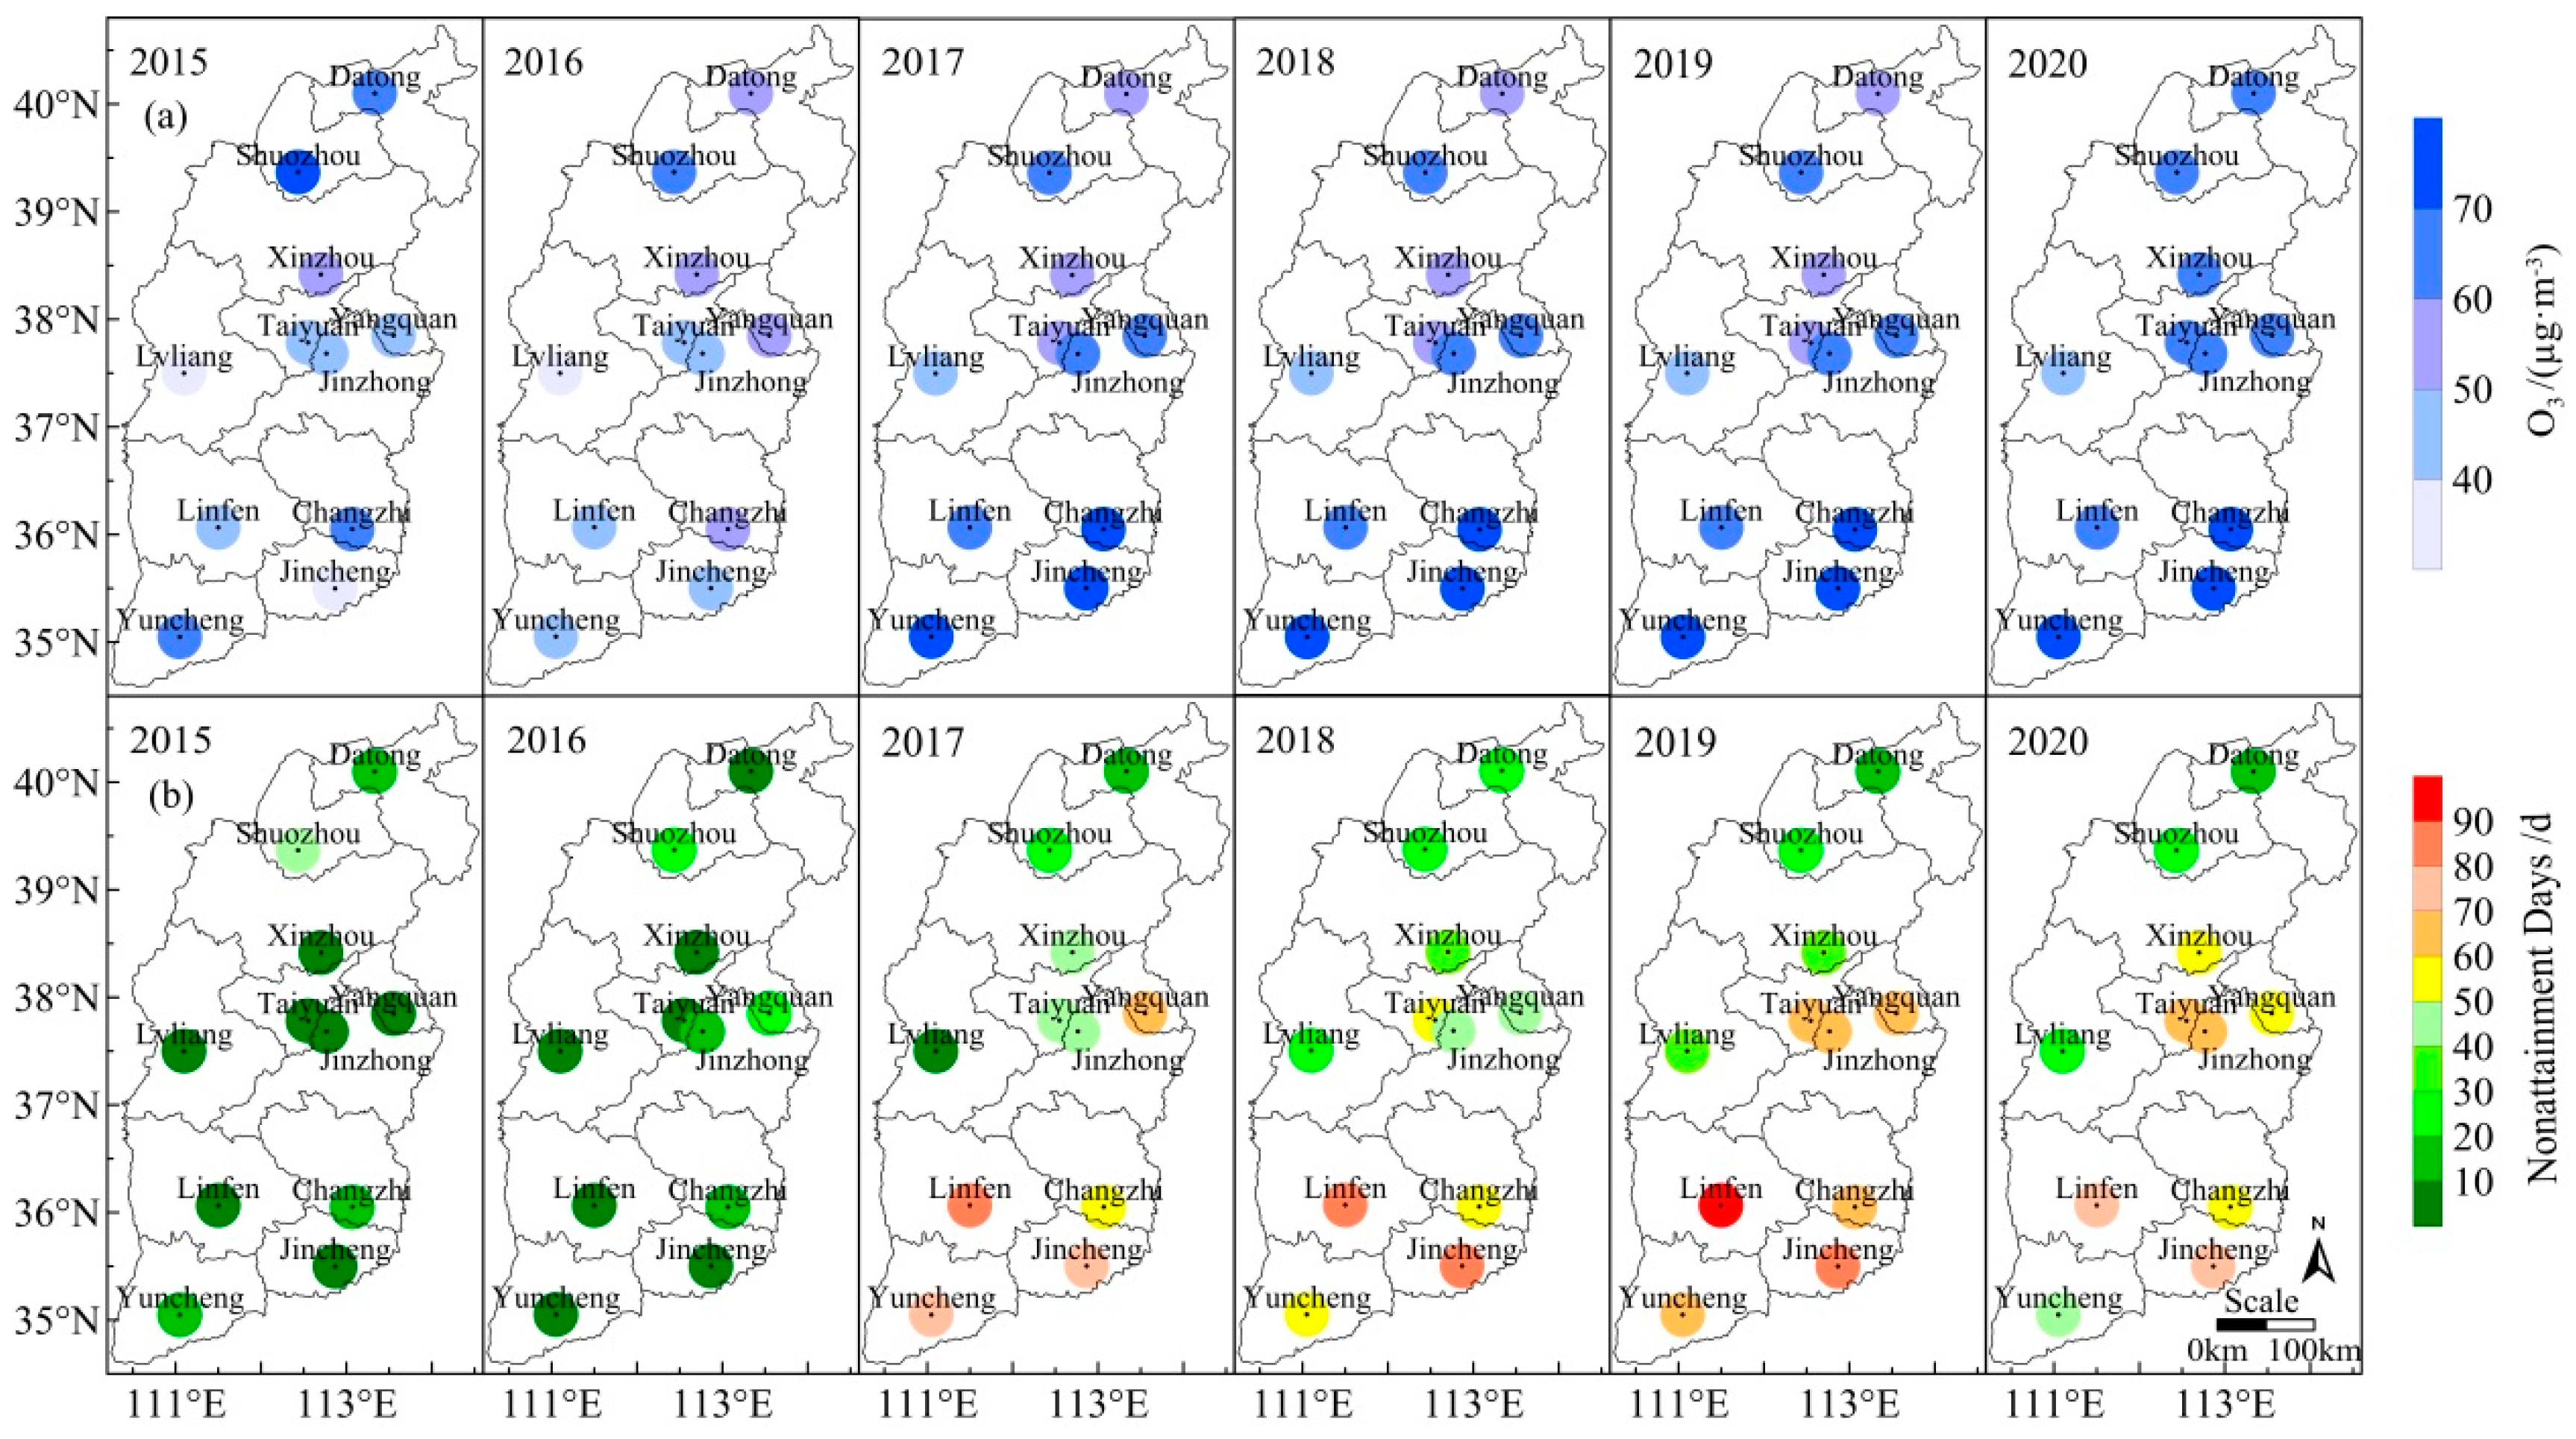
3.1.4. Surface O3 Spatial Distribution

The spatial distributions of annual mean O3 mass concentrations and MDA8 O3 nonattainment days are given in Figure 6. Both annual mean O3 concentration and MDA8 O3 nonattainment days were relatively outstanding in Shuozhou in northern Shanxi in 2015–2016. The most notable characteristic of O3 distribution was its zonal distribution, with high a level in the south and a low level in the north from 2017 to 2020. Among them, Shanxi’s surface O3 pollution was severe in 2019, but the annual mean O3 in northern and central Shanxi showed a slow rising trend in 2020.
It is worth noting that in Taiyuan, located in central Shanxi Province, surface O3 pollution was relatively slight in 2015–2016. Annual mean O3 levels were close to those of other cities in 2017–2020, but MDA8 O3 nonattainment days increased nearly every year and were significantly higher than the cities with similar annual mean O3. This indicated that high O3 concentrations accounted for a large proportion, and the high values of O3 were relatively high in Taiyuan and continued to rise throughout the year. Further analysis showed that the MDA8 O3 95th percentile in Taiyuan rose from 140 μg·m−3 to above 200 μg·m−3 during 2015–2020, while the MDA8 O3 90th percentile was also above 180 μg·m−3 in 2020. The high percentile of MDA8 O3 was higher in Taiyuan, while the level below the 50th percentile was at a lower level compared with central and northern regions, resulting in an annual mean O3 in Taiyuan that was not significantly higher.
Among the four cities (Linfen, Changzhi, Jincheng and Yuncheng) in the southern region, Linfen had the lowest annual mean O3 and highest MDA8 O3 nonattainment days. MDA8 O3 nonattainment days in Linfen exceeded 80 d a year from 2017 to 2019, then decreased slightly and even approached 80 d in 2020. From 2017 to 2020, the MDA8 O3 95th percentile in Linfen was 225 μg·m−3, 215 μg·m−3, 221 μg·m−3 and 199 μg·m−3, respectively, and the MDA8 O3 90th percentile was close to or over 200 μg·m−3. However, in Linfen, MDA8 O3 below the 50th percentile was significantly lower than that in the other three cities in the southern region, which was similar to the pattern in Taiyuan.
To further illustrate the distribution characteristics of high-level concentrations of MDA8 O3 at higher percentiles and low-level concentrations at lower percentiles in Taiyuan and Linfen, Figure 7 shows the daily variation in surface O3 mass concentration throughout the entire year (Figure 7a) and the period from May to August (Figure 7b). Nighttime O3 in Taiyuan and Linfen was lower than the mean level in cities in central and southern Shanxi but increased significantly in the daytime, which was especially obvious from May to August when surface O3 pollution was serious. The O3 photochemical accumulation rate in the daytime and depletion rate in the nighttime in these two typical cities with serious surface O3 pollution were both higher than those in their surrounding areas. NOx emissions in Taiyuan and Linfen were significantly higher than the emissions in their surrounding areas [33]; thus, O3 precursors were sufficient for photochemical reactions in the daytime, while NO titration was strong enough at night to deplete a large amount of O3 [57,58].
Shanxi spans 6° in latitude from north to south, with a 7 °C annual mean temperature difference between Datong and Yuncheng, while surface O3 pollution has an obvious zonal distribution. Shuozhou had obvious surface O3 pollution before 2016, and it has been generally more serious in the central and southern cities of Taiyuan, Linfen, Changzhi, Yuncheng, and Jincheng in recent years. The topography of Shanxi is complex, with interlocking mountains and basins. Table 1 lists the altitudes of the 11 urban areas examined (represented by the altitudes of local meteorological stations). The altitudes of Datong, Shuozhou and Changzhi are above 1000 m, significantly higher than those of other cities. Atmospheric mass is low in areas with high altitudes so ultraviolet radiation scattering and absorption are weak, resulting in more ultraviolet radiation reaching the ground [59,60], conducive to the photochemical generation of O3. Therefore, Datong and Shuozhou had high levels of annual mean surface O3. Meanwhile, Shuozhou had an extra-large open-pit coal mine and the largest thermal power plant in North China before 2016, and its higher O3 levels were related to automobile exhaust and combustion emissions, and surface O3 pollution was obvious before 2016. Subsequently, with economic transformation in Shuozhou, coal burning slightly decreased while car ownership continued to rise [61], so surface O3 pollution decreased slightly. Figure 6 also showed that the annual mean surface O3 at a higher altitude in the southern region of Changzhi was significantly higher than that in a basin at the same latitude in Linfen. For Lvliang, which had a relatively clean atmospheric environment, although its altitude was high, the concentration of O3 precursor was low. Ground monitoring data showed that NO2 concentration in Taiyuan was much higher than that in the surrounding area, as were the concentrations of atmospheric particulate matters (PM2.5 and PM10). Under the comprehensive effects of photochemical precursors and particulate matters, annual mean O3 was equivalent to or even slightly lower than that in the surrounding area, but high-level O3 accounted for a large proportion, and MDA8 O3 nonattainment days were much higher in Taiyuan. In general, although surface NO2 and particulate matters in most urban areas of Shanxi reached a peak around 2017, surface O3 pollution was serious in 2019 and maintained a high pollution level in 2020. It seems that under the typical environmental conditions of compound pollution, there are still many scientific problems to be solved regarding how to cooperatively control atmospheric particulate matter and surface O3.

3.2. The Influence of Meteorological Factors on Surface O3
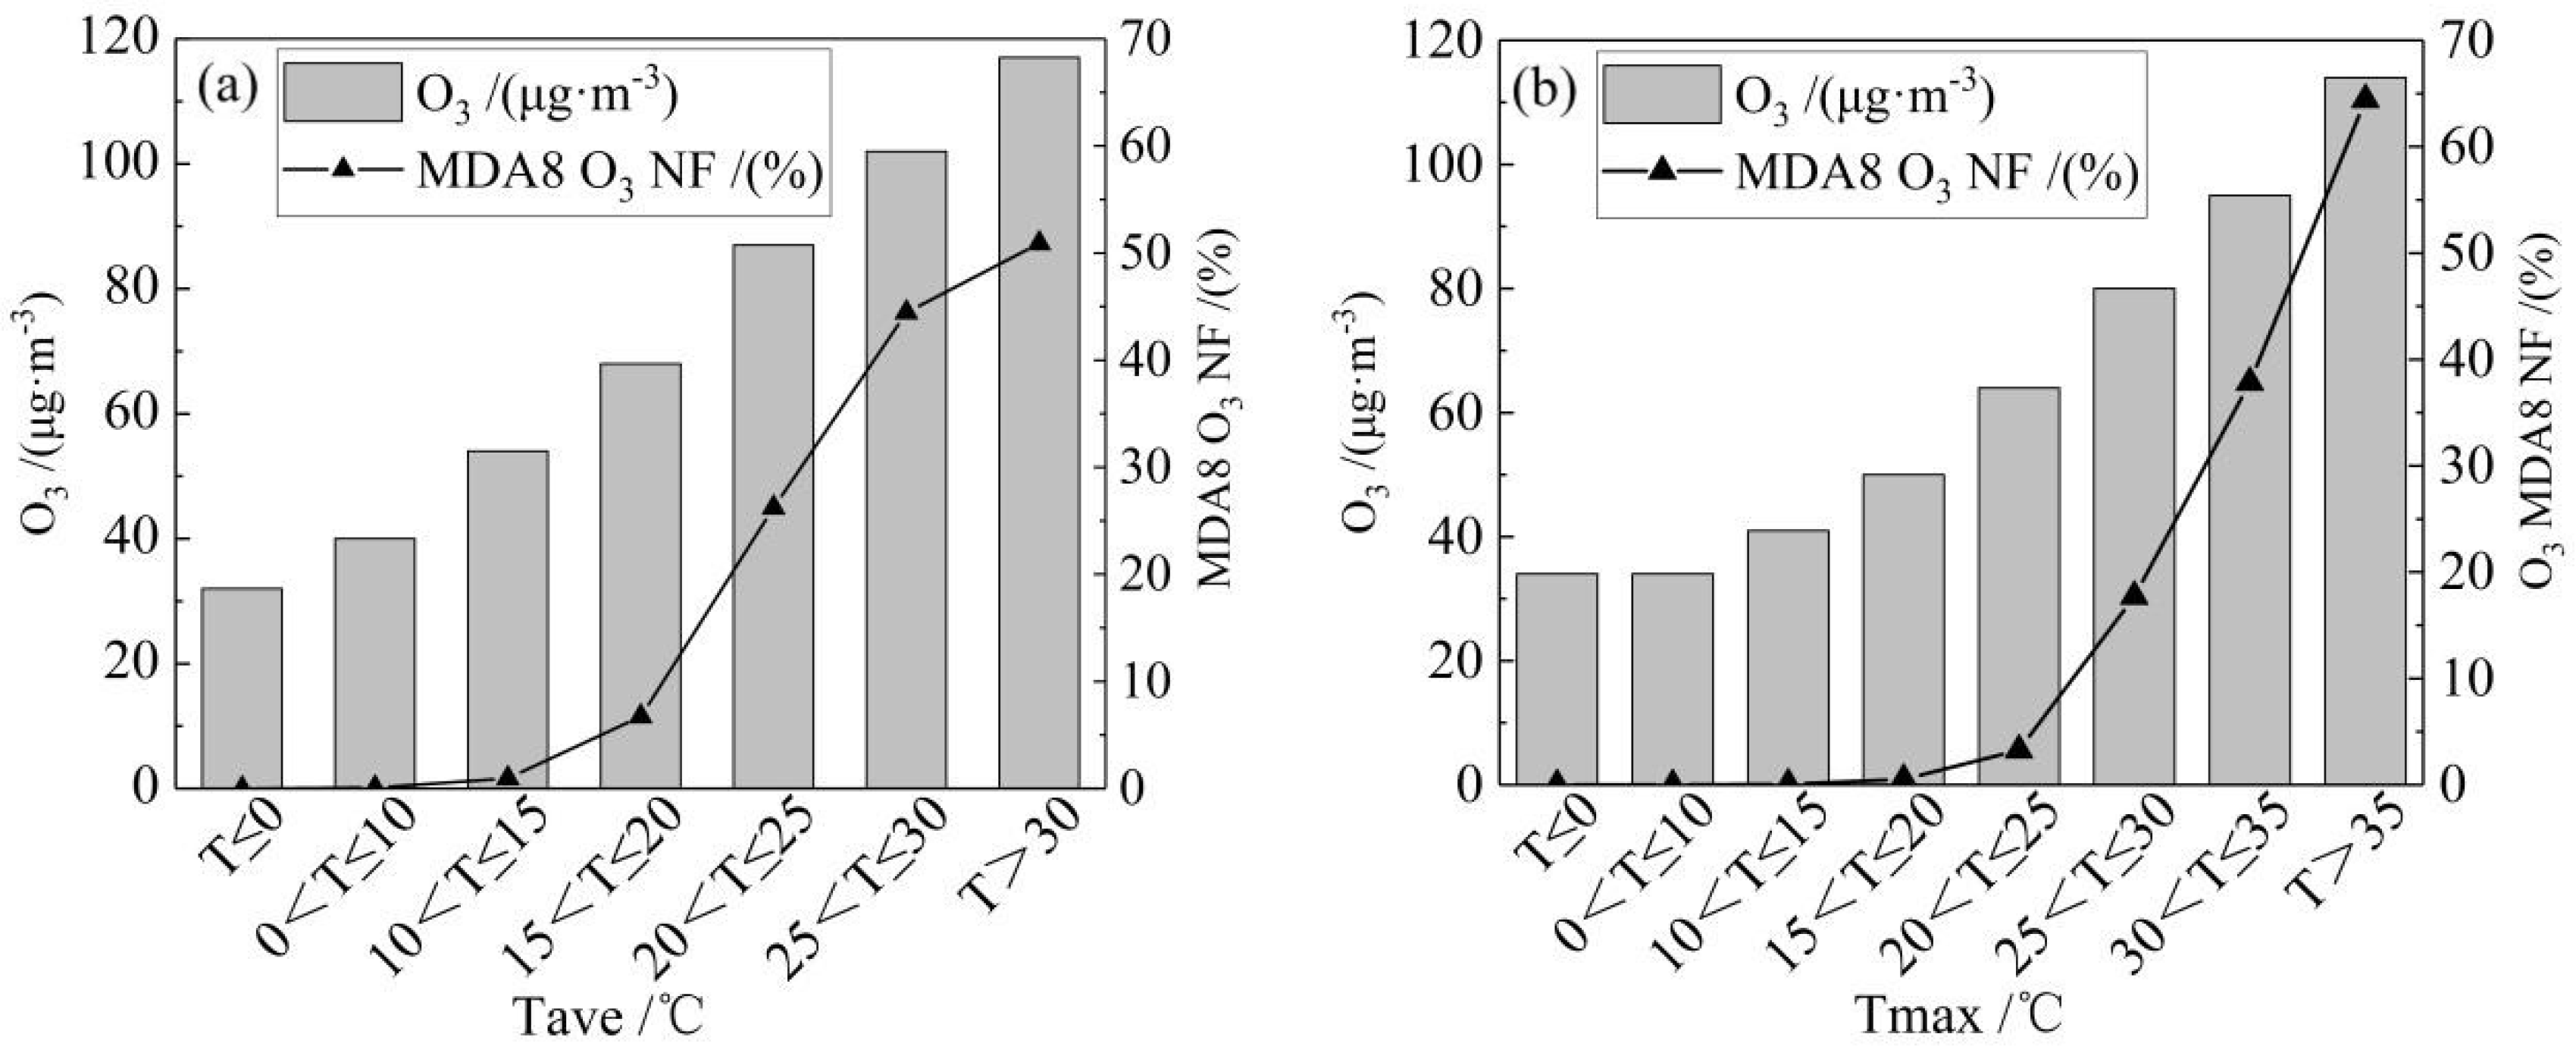
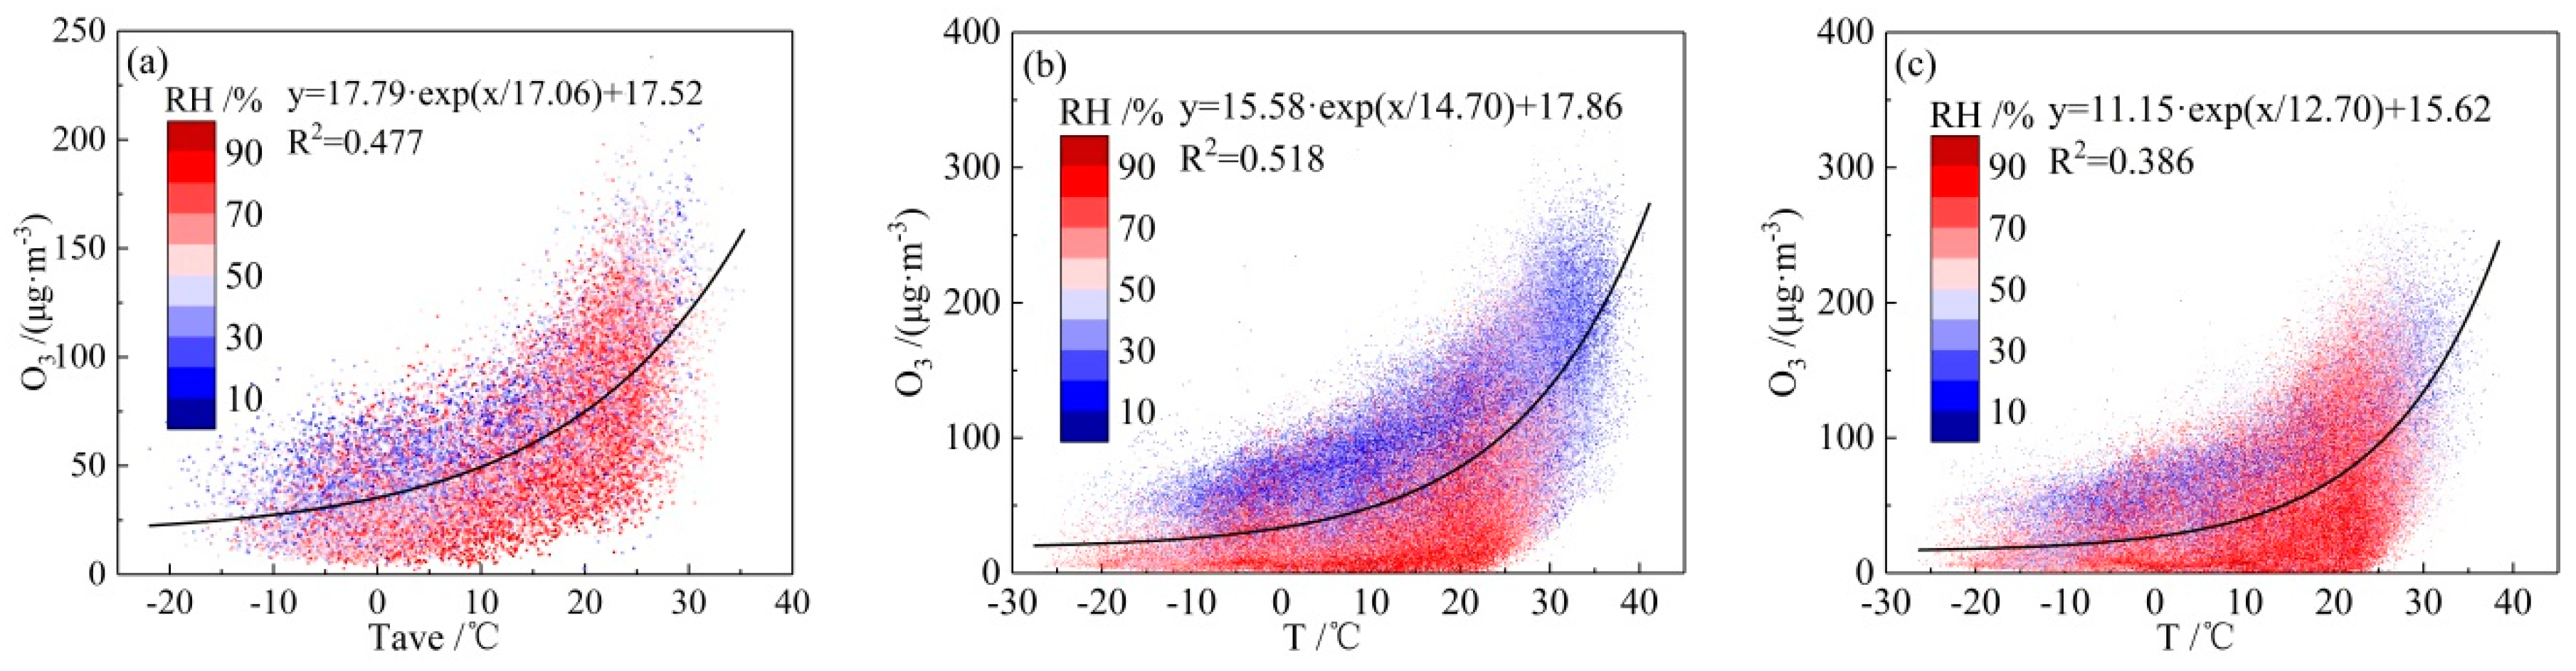
Meteorological factors have different influences on the formation and depletion of O3. Table 2 lists the comparisons of O3 concentration and primary meteorological factors observed at various sites. O3 pollution is extremely urgent in China, especially in Shanxi Province and the Beijing–Tianjin–Hebei region. Temperature, relative humidity, wind and sunshine duration may be the primary meteorological factors in most regions, and this section discusses the above meteorological factors in Shanxi Province.

3.2.1. Temperature

Figure 8 shows daily mean O3 and MDA8 O3 nonattainment frequency in different temperature ranges, along with daily average temperature (Tave) and maximum temperature (Tmax). MDA8 O3 nonattainment frequency was very low when Tave < 15 °C; when Tave > 15 °C, daily mean O3 increases gradually, while MDA8 O3 nonattainment frequency increases rapidly at a rate of 11.04%/5 °C, and it reached 50.91% when Tave > 30 °C. The change in daily mean O3 with Tmax was slightly different from that with Tave. O3 did not easily exceed the standard when Tmax < 20 °C; when 20 < Tmax ≤ 25 °C, MDA8 O3 nonattainment frequency was just 3.27%, and it rose rapidly at a rate of 15.57/5℃ once Tmax > 25. The correlation coefficients of Tave, Tmax and O3 concentration in Shanxi were 0.689 and 0.681, respectively. This result was slightly lower than that in the Yangtze River Delta region [24] but higher than that in Chengdu (Wu et al., 2017) and Guangzhou [21]. As shown in Figure 8, MDA8 O3 nonattainment frequency increased rapidly once Tmax > 25 °C or Tave > 20 °C, and then the rise rate slowed down as Tave rose, indicating that Tmax had a more significant impact on the generation of high O3 than Tave, and once temperature or radiation intensity reached a certain value, other factors may have had more prominent impacts on the accumulation of O3.
The O3 photolysis product O (1D) reacts with water vapor to generate OH, thus depleting O3. O3 in the aqueous phase can also oxidize SO2 and NO2 into SO2−4 and NO3, respectively, depleting O3 through heterogeneous reactions [6,65]. The scatter plot and fitted curve between daily mean O3 and temperatures under different relative humidity levels (RHs) are given in Figure 9a. O3 increased exponentially with increasing temperature, and lower RH corresponded to higher O3 at the same temperature. High temperature and low humidity were favorable to the generation of high O3, and this trend was more obvious when temperature was below 20 °C.
The photochemical generation of O3 occurs in the daytime with solar radiation, while depletion occurs both in the daytime and nighttime [57,58]. For further research on the impact of temperature on O3 with different water vapor levels, scatter plots and fitted curves of O3 mass concentrations with daytime and nighttime temperatures under different RH are given in Figure 9b,c. Annual mean sunrise and sunset time in Taiyuan in central Shanxi Province were selected to represent those of the whole province, with daytime defined as 06:00 to 18:00 (Beijing time, BJT), and the remaining time was considered night. The correlation between daytime temperature and O3 and the influence of RH on O3 were more significant than at nighttime. Therefore, high RH in the daytime was not conducive to high O3 accumulation, and the effect of RH on O3 depletion at nighttime was obviously less than that in the daytime.

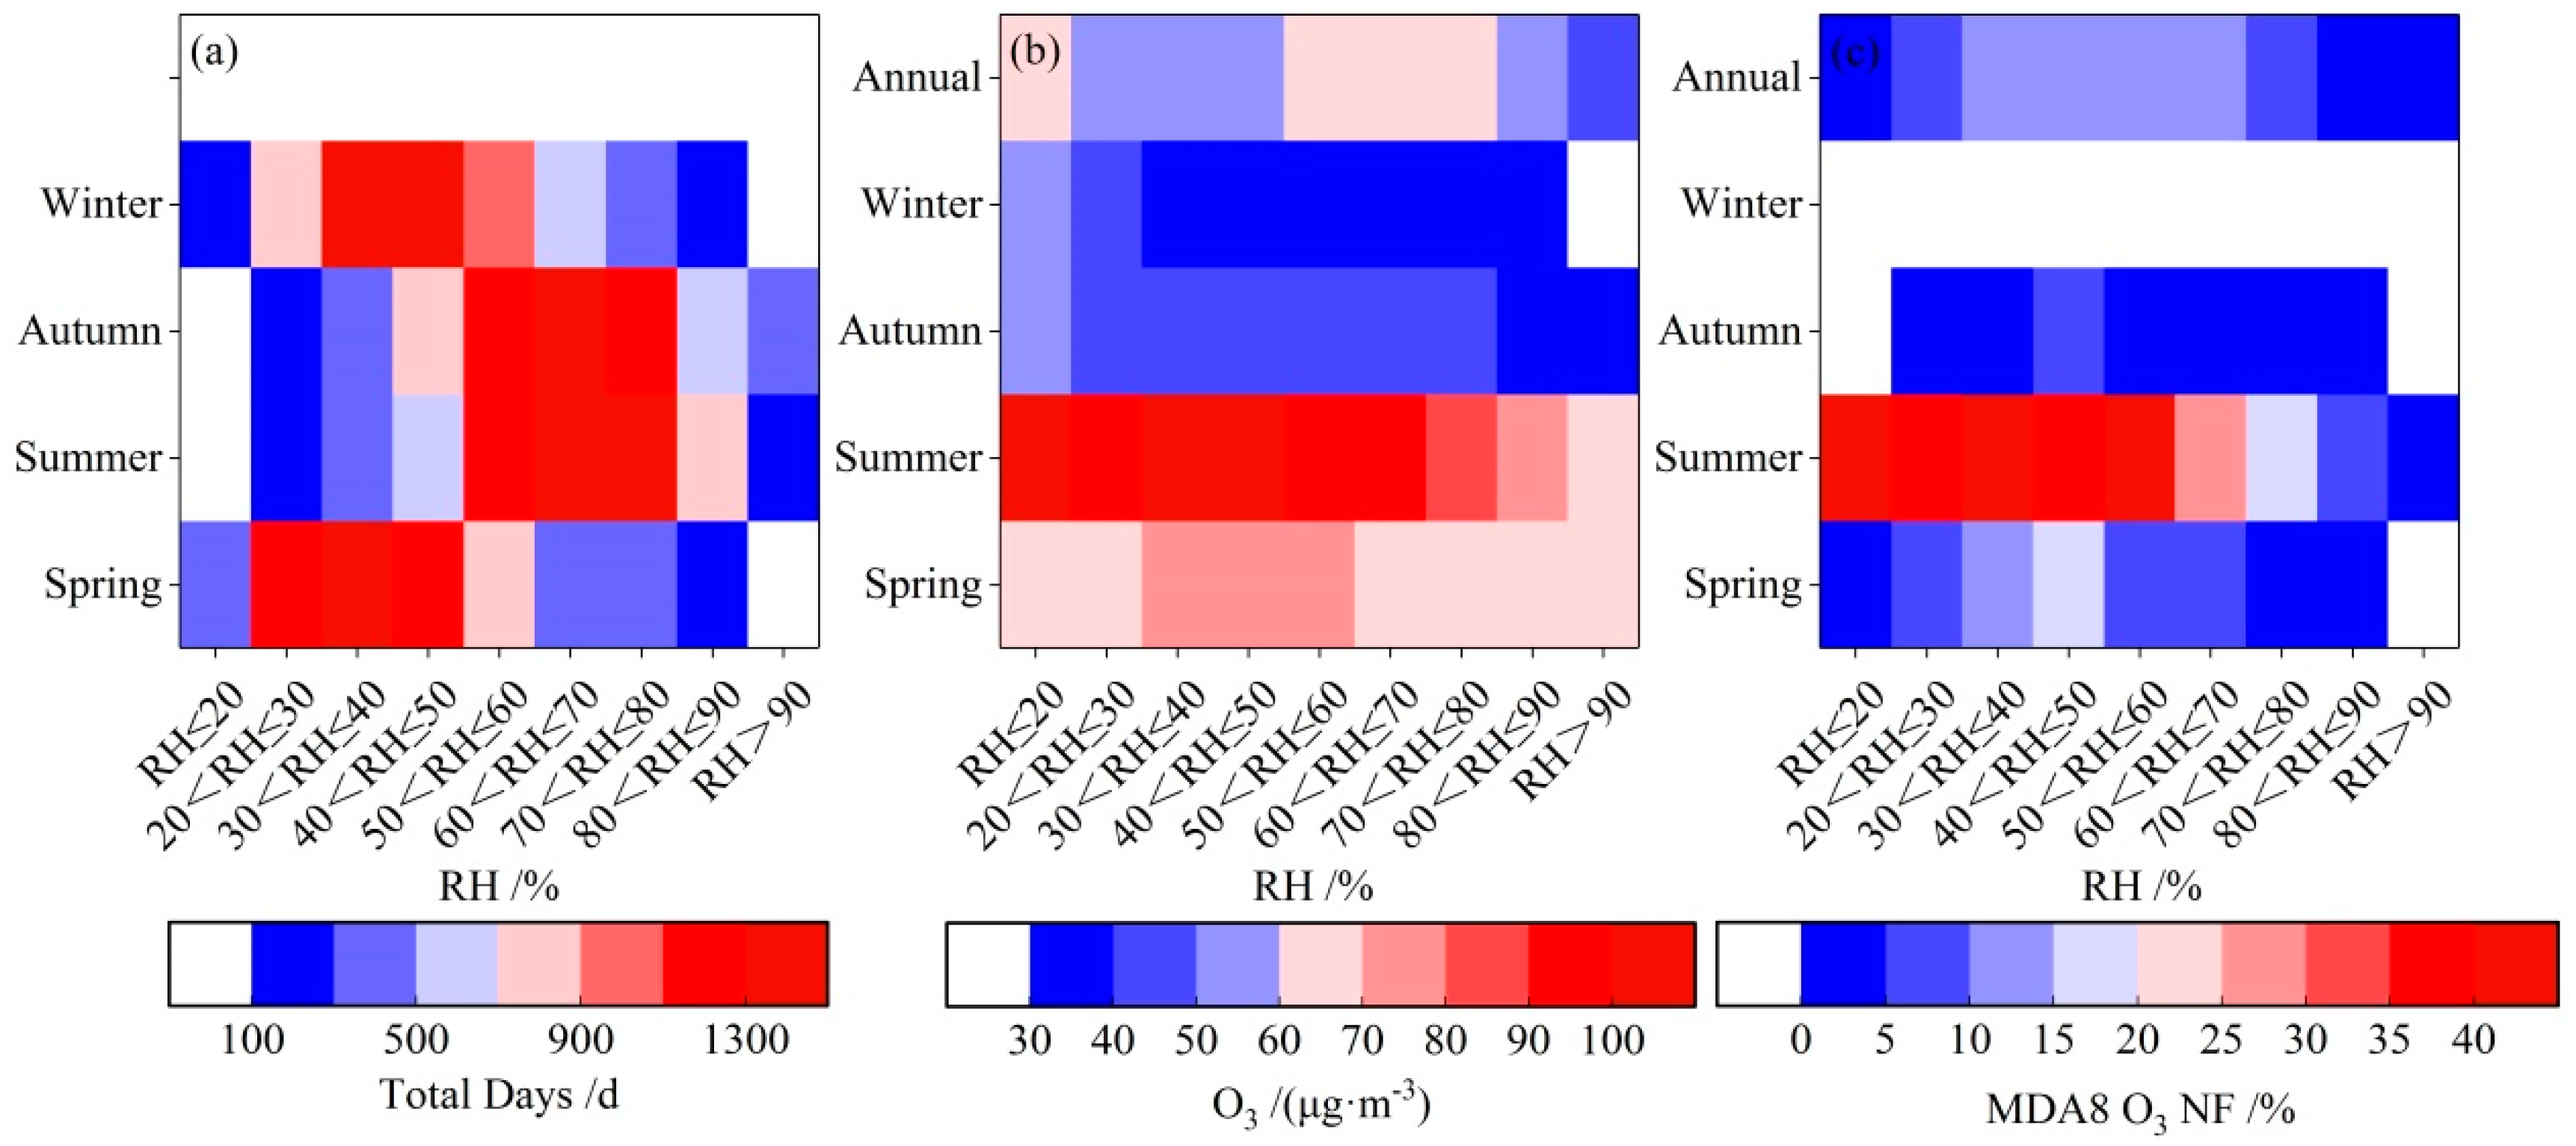
3.2.2. Relative Humidity

The correlation between RH and surface O3 varies greatly in different regions or in different seasons within the same region, and it is necessary to consider the impact of RH on O3 by season [30].
Without considering the influence of other factors, Figure 10 shows the variations in the total days, mean O3 mass concentration and MDA8 O3 nonattainment frequency corresponding to different RH ranges in each season and the whole year. RH was mostly below 60% in winter and spring, while it ranged from nearly 50% to 80% in summer and autumn. O3 was higher in summer and spring and reached a peak when 40% < RH ≤ 50%, while it was lower in autumn and winter and reached a peak when RH ≤ 30%. O3 was slightly lower at a higher RH when considering the whole year, but the difference was not significant.
MDA8 O3 nonattainment frequency in summer was much greater than that in spring and autumn, and there was no nonattainment phenomenon in winter. In summer, MDA8 O3 nonattainment frequency was over 35% when RH ≤ 60%, while it was below 10% when RH > 80%. In spring and autumn, MDA8 O3 nonattainment frequency reached a peak of 15.4% and 5.4%, respectively, and there was no nonattainment phenomenon in autumn among this RH range. MDA8 O3 nonattainment frequency was below 6% when RH < 30%, which was less than that when 30% < RH ≤ 70% in the whole year. This suggested that high temperature and low humidity were conducive to the generation of high O3, while O3 had difficulty accumulating under low temperature and low humidity. In this sense, the influence of rising temperature or solar radiation on O3 accumulation is greater than the influence of declining RH.

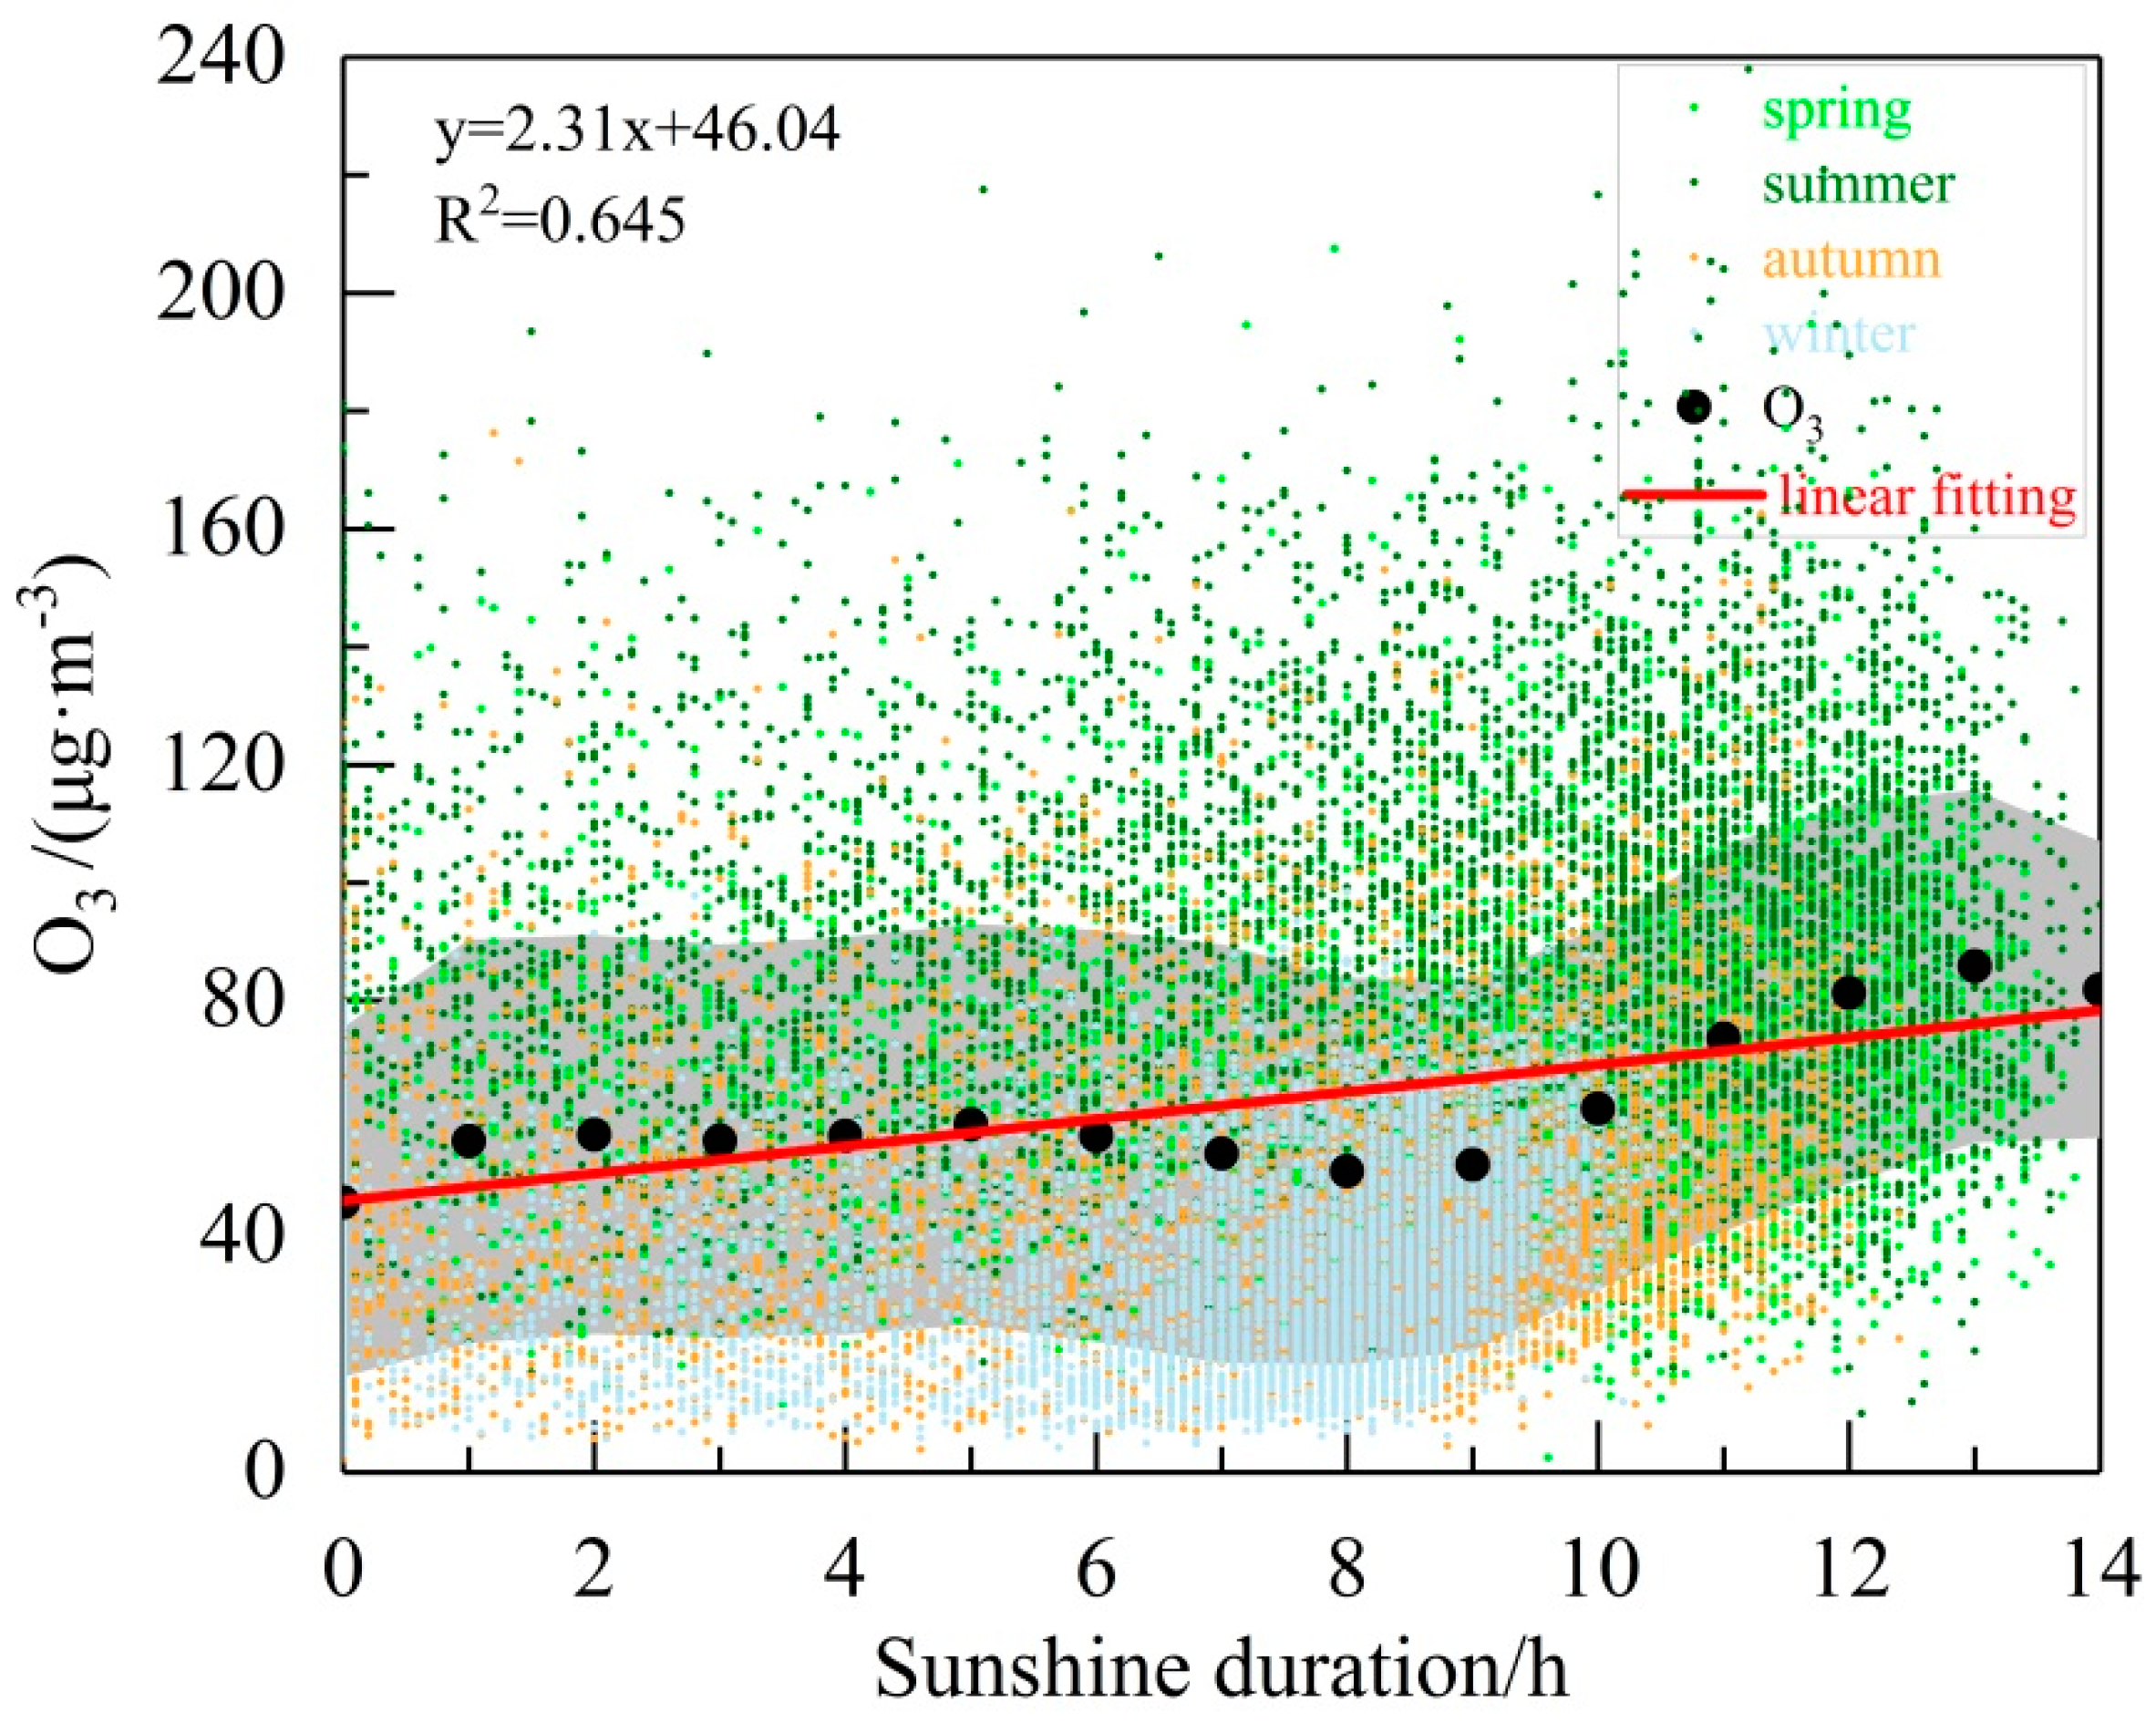
3.2.3. Sunshine Duration
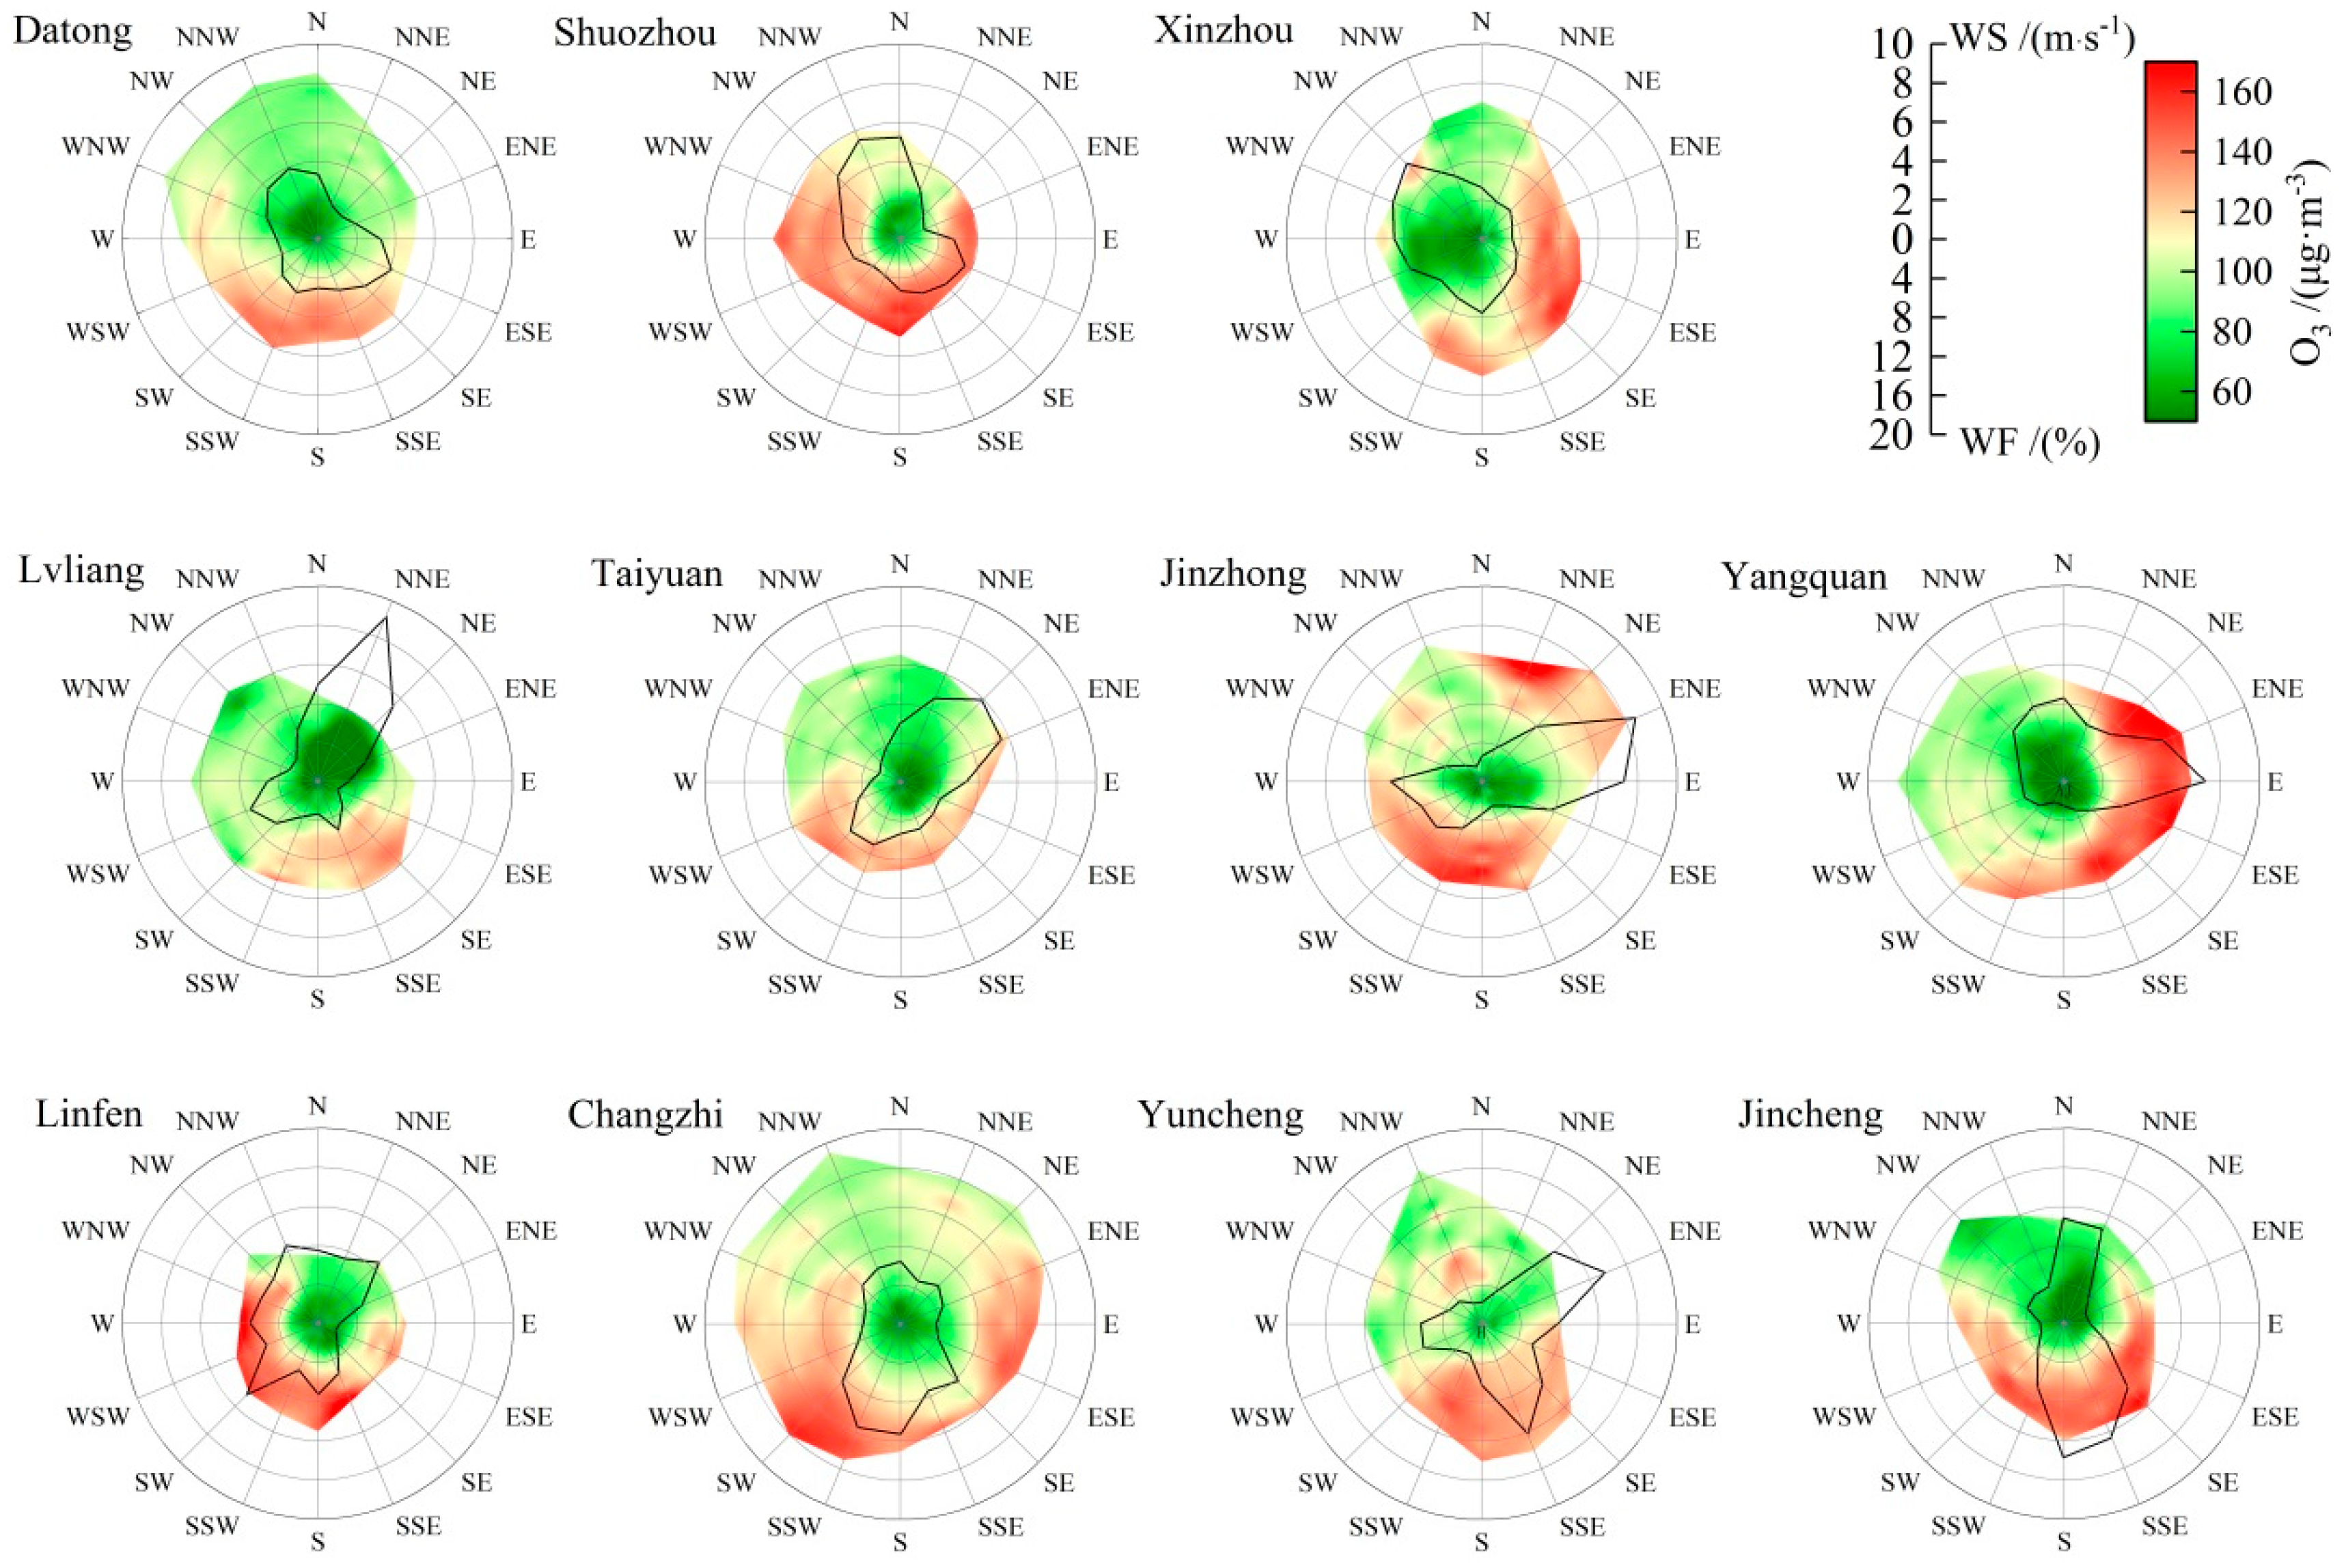
Sunshine duration affects photochemical reactions. Daily mean O3 levels corresponding to different sunshine durations and their linear fitting and the distribution of daily mean O3 in each season with sunshine duration are shown in Figure 11. Daily mean O3 increased with increasing sunshine duration, R2 = 0.645. It is worth noting that when sunshine duration ranged from 6 h to 9 h, on more than half of the days in autumn and winter, O3 was relatively low and significantly decreased compared with that at approximately 4 h to 5 h. O3 was higher in summer and spring while lower in autumn and winter with the same sunshine duration. In addition, high-level O3 nevertheless occurred at a short sunshine duration, and low-level O3 also existed when sunshine duration was above 12 h during summer and spring, which may be affected by O3 precursors, cloud condition, diffusion, transport and other factors.

3.2.4. Wind

Wind has a significant effect on the diffusion and transport of O3. The dominant wind direction of each city is quite different because of the complex topography of Shanxi. Therefore, it is necessary to analyze by city. Meanwhile, as the dominant wind direction varies greatly between different seasons, surface wind correlated with high O3 months from May to August was analyzed in this paper. Figure 12 shows the distribution of O3 at different wind directions, wind speeds and wind frequencies. Wind frequencies under 1% in each wind direction were removed in data processing to reduce the influence of very small scenes.
Low surface O3 in most cities in Shanxi was associated with northern wind, while O3 was generally high with southern wind, which may be related to upwind O3 content [66]. Except for the northern wind in Shuozhou and Linfen, low wind speeds in the other wind directions corresponded to high O3, which reflected the high capacity of local photochemical reactions. In Xinzhou, Yangquan and Lvliang, low wind speed corresponded to low O3, while O3 was obviously higher under certain wind directions, indicating that O3 pollution in these three cities was caused by regional transport to a great extent. Among the wind directions, O3 under the southeast wind was significantly higher than in other directions in Xinzhou; the high-level O3 mainly came from transport in the southeastern direction, but the frequency of wind from that direction was relatively small, so there was only a slight influence of southeast transport on annual mean O3. The distribution characteristic of high O3 in Yangquan was similar to Xinzhou, mainly transported from the east, and due to the high frequency of wind from this direction, O3 pollution easily occurred and increased the annual mean O3. Lvliang was affected by transport from the southeast direction. In Datong, Taiyuan, Jinzhong, Changzhi, Yuncheng and Jincheng, high O3 occurred under low wind speeds from each wind direction, and the southern wind corresponded to high O3 in these cities, indicating that O3 pollution was caused by the combined actions of local photochemical reactions and regional transports. Surface O3 pollution in Datong was greatly affected by transport from the southern direction. High O3 was associated with the southern wind in Taiyuan; wind speed and frequency in this direction were low, suggesting that local generation in Taiyuan accounted for a large proportion of surface O3 pollution. High O3 was usually found under low wind speed in Jinzhong, and O3 pollution occurred when the region was affected by transport from the northeast and southwest. Wind speed in each direction was higher in Changzhi, and O3 pollution was prone to happen under transport from the southwest and east. Yuncheng O3 pollution was mainly influenced by transport from the southern region. High O3 occurred under low wind speed in Jincheng, and O3 pollution increased when the region was affected by transport from the south and southwest. As the southern wind dominates in summer, the transport from this direction had a heavier impact.
In summary, upwind transport had a great influence on surface O3 from May to August; it easily caused local O3 accumulation when the dominant wind direction in Shanxi was southerly, while it reduced O3 when it was northerly. From the perspective of surface wind impact on O3, O3 pollution in Shuozhou and Linfen mainly came from local photochemical reactions, while in Xinzhou, Yangquan and Lvliang it was caused by regional transport to a great extent, especially in Yangquan, and O3 pollution occurred with easterly transport. O3 pollution in Datong, Taiyuan, Jinzhong, Changzhi, Yuncheng and Jincheng was the combination of results of local photochemical reactions and regional transports.

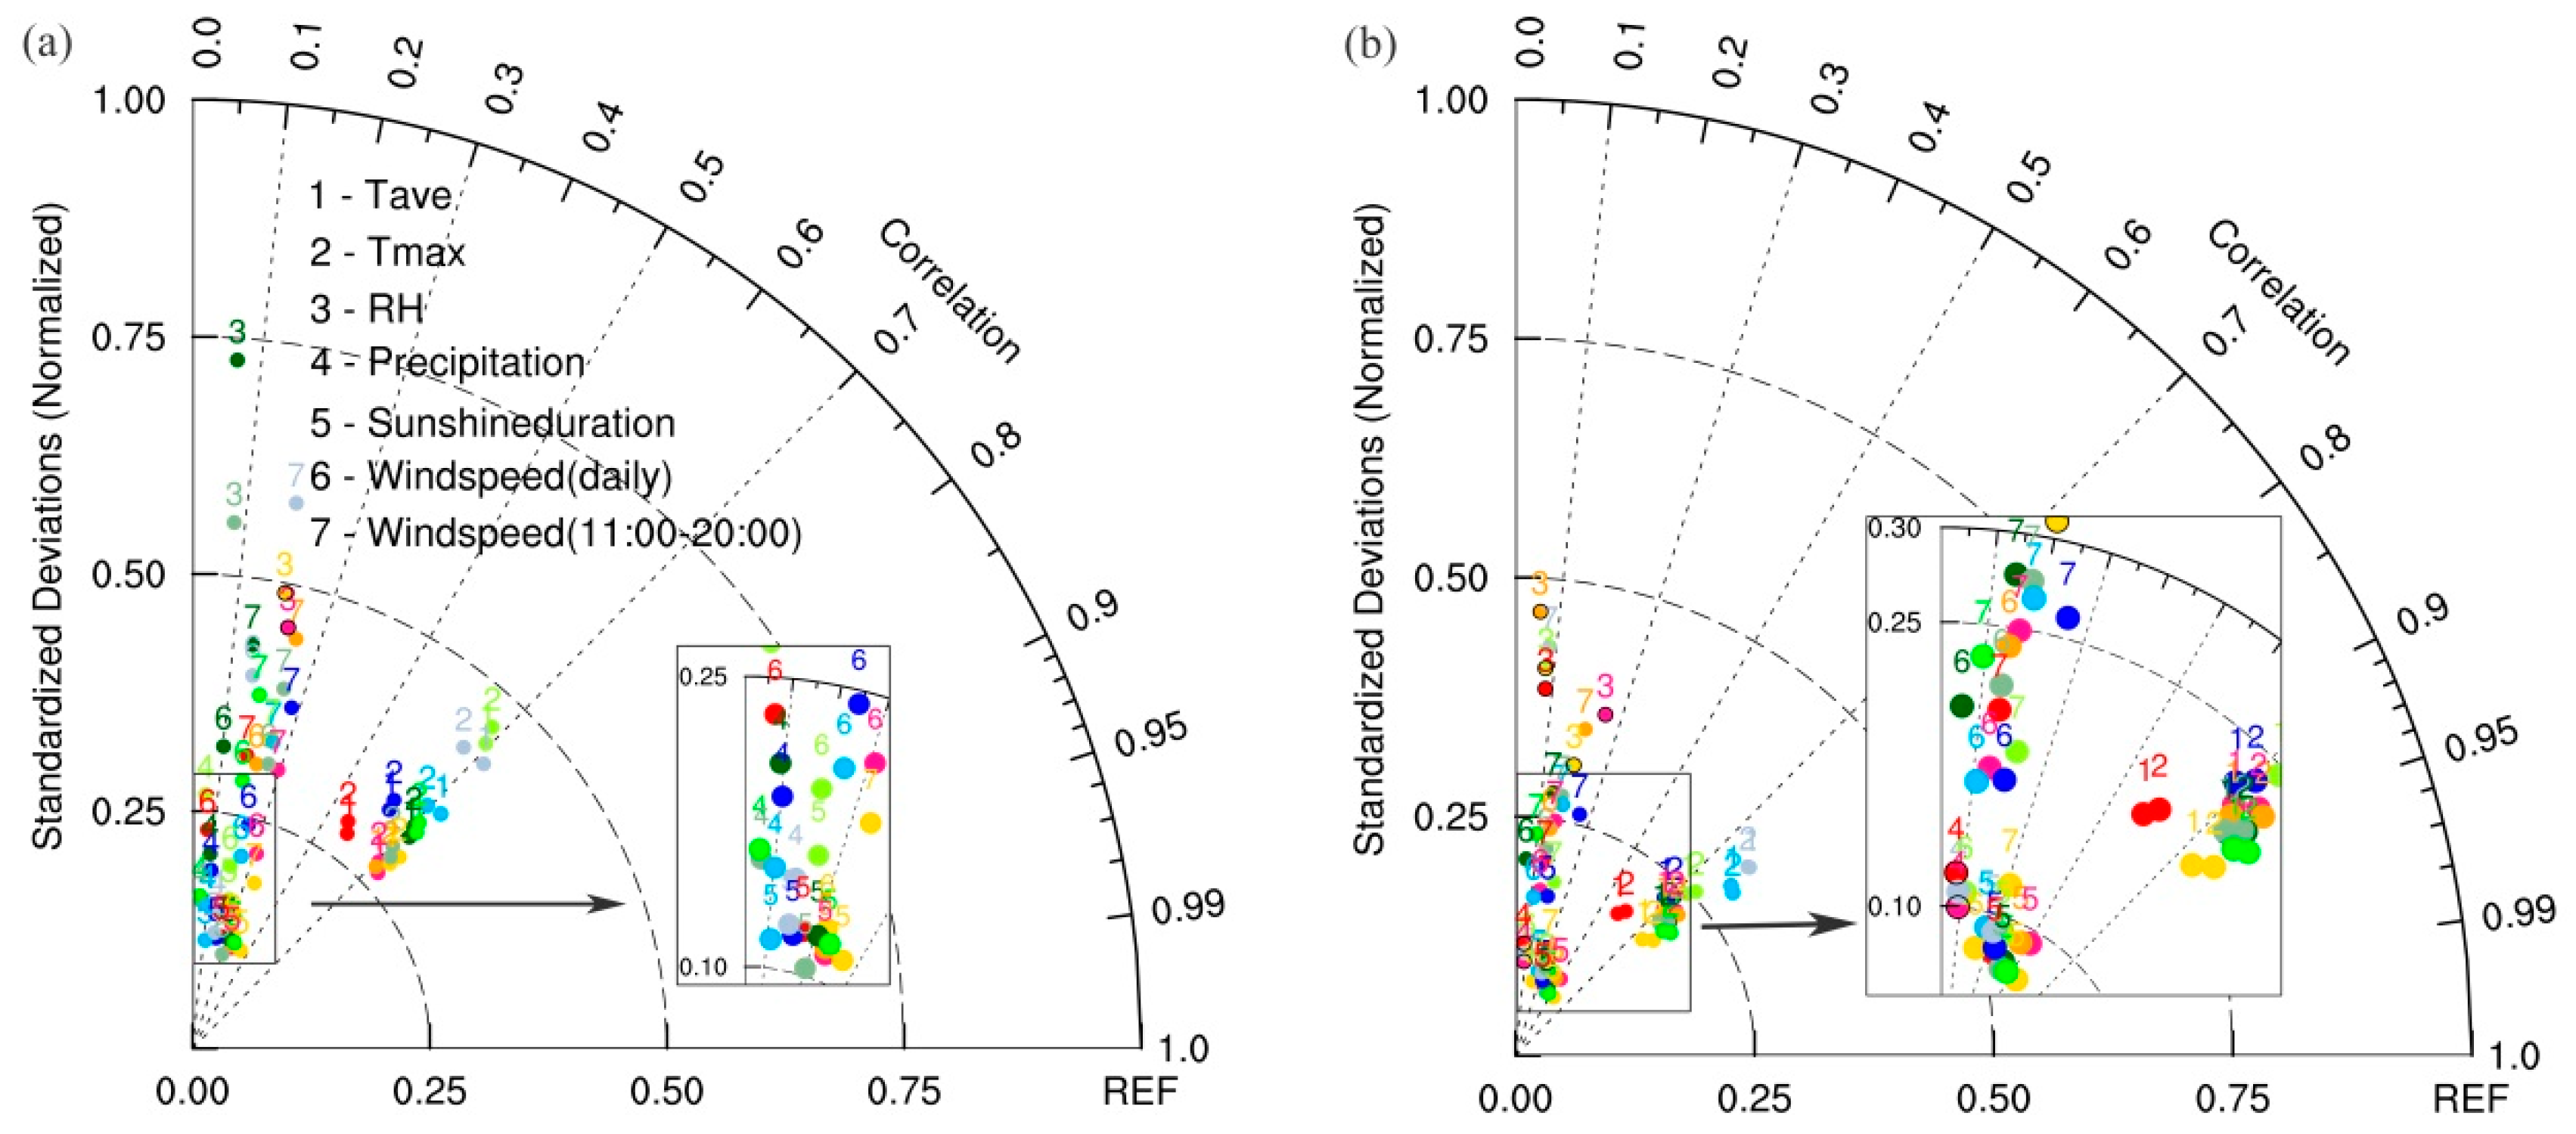
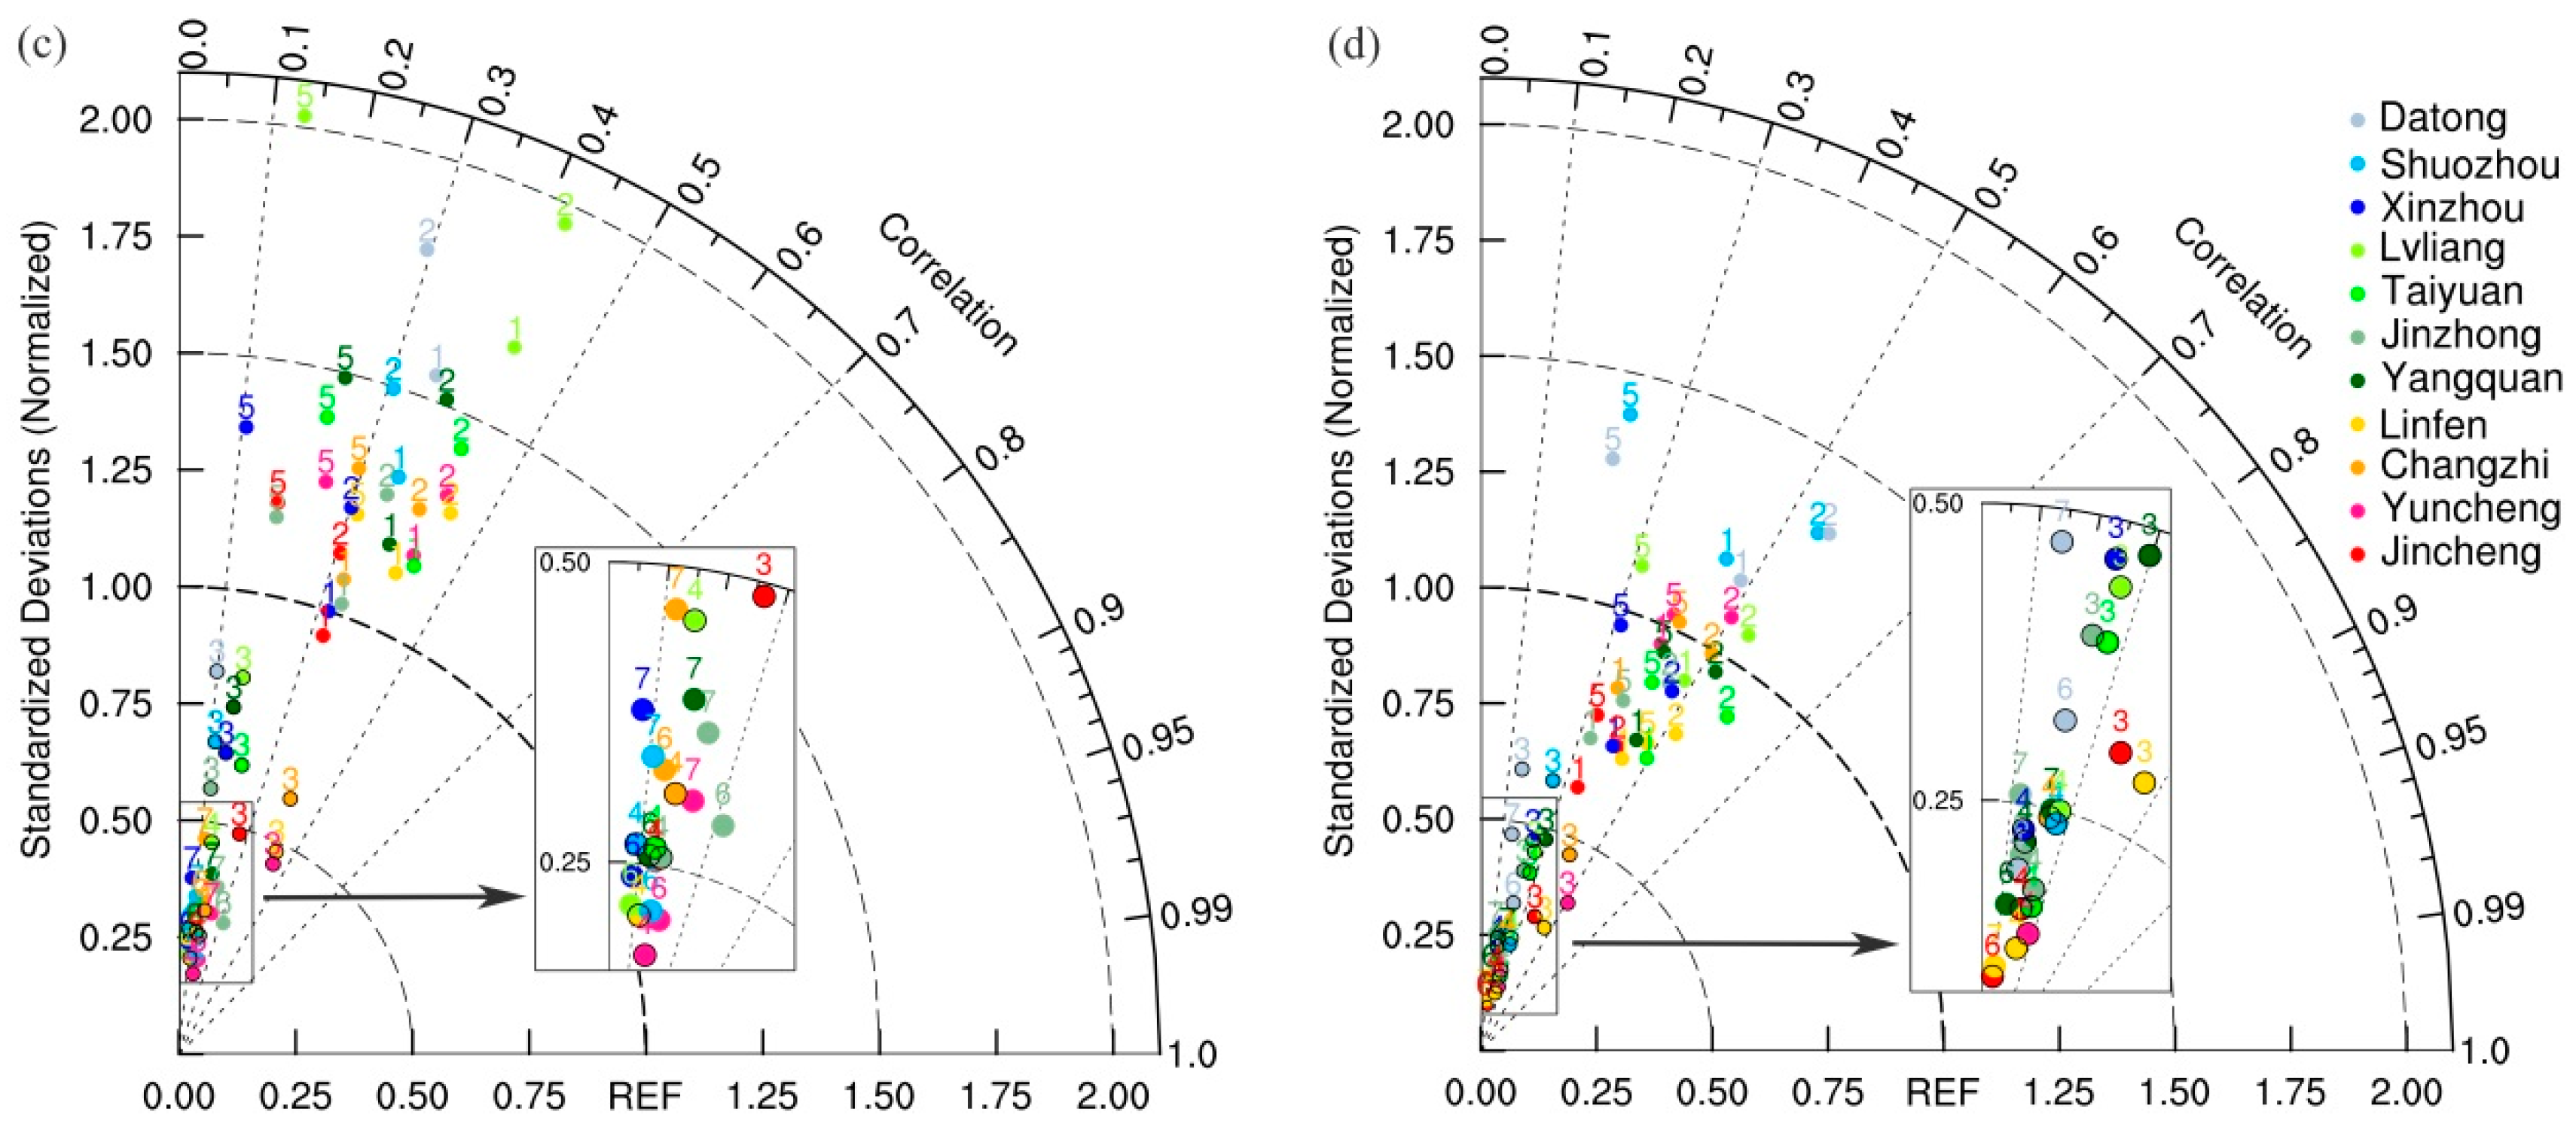
3.2.5. Comprehensive Evaluation of the Influence of Meteorological Factors on Surface O3

To comprehensively evaluate the impact of various meteorological factors on surface O3, The Taylor graphic method [67] has been cited to assess the relationship between daily mean temperature (Tave), daily maximum temperature (Tmax), relative humidity (RH), precipitation, sunshine duration, daily mean wind speed (Windspeed Daily), and average wind speed in the 10 h with the highest O3 concentration (Windspeed 11:00–20:00) and surface O3. Taylor diagrams between each meteorological factor and surface O3 are shown in Figure 13, with the annual mean value and the mean value from May to August of each meteorological factor, with mean mass concentrations of O3 and MDA8 O3 shown in four representative pictures. Standard dimensionless normalization in Taylor diagrams was performed due to different units of physical quantities [67]. The standard deviation of the O3 field was normalized by itself and was therefore always plotted at a unit distance from the origin along the abscissa (represented by REF in Figure 13). The azimuthal positions gave the correlation coefficient between O3 fields and meteorological factors fields. The dashed lines measured the distance from the REF point and represented the ratio of the standard deviation σm of each meteorological factor to the standard deviation σ O 3 of O3, which was denoted as R σ . The physical significance of   R σ is that a change in unit concentration (10−6 μg·m−3) of O3 corresponded to a change in the units of each meteorological factor. Due to the large difference in standard deviation of each physical quantity, the following standardizations were performed to facilitate comparison within the same figures: multiplying the σWindspeed(daily), σWindspeed(11:00–20:00), and σTave, σTmax, σsunshine duration by 10 represented the change in units of wind speed, temperature and sunshine duration corresponding to a 10−1 unit change in the concentration of O3 from May to August. When the correlation between a certain meteorological element and O3 in a city failed to pass the significance level test of 0.05 on both sides, it was not shown.
In terms of the whole year (Figure 13a,b), temperature had the most significant influence on O3, and the correlation coefficients were generally above 0.6. Tave had a stronger influence on the mean mass concentration of O3, while Tmax had a greater influence on MDA8 O3. The correlations between O3 and temperature in Jincheng and Xinzhou were notably less than those in other cities. The correlation between O3, RH and precipitation was generally low. Precipitation does not show an obvious wet removal effect on O3, which may be due to the complex comprehensive influence of solar radiation, clouds and particulate matter on O3 when precipitation occurs. The correlation between O3 and sunshine duration was the second most significant; furthermore, the correlation between sunshine duration and MDA8 O3 was greater than that with the mean mass concentration of O3. There was a zonal difference in correlation between O3 and sunshine duration, with high positive correlation coefficients in the southern region, but that in Jincheng was low. The correlation between O3 and wind speed varied greatly in different cities. O3 was greatly affected by wind speed during the main generation period of O3 in the daytime, and the correlation coefficients were significantly higher in Linfen and Yuncheng than in other cities.
From May to August (Figure 13c,d), the feature that was most obviously different from the whole year was that the influence of temperature on O3 was weakened, indicating that other O3 influencing factors played an increasingly important role when temperature reached a certain level in spring and summer, which was consistent with the conclusion in Section 3.2.1 above. There was a significant negative correlation between O3 and RH from May to August and the negative correlation coefficient ranged from −0.145 to −0.507. The influence of water vapor on O3 in southern cities was greater than that in central and northern cities, among which Yuncheng and Linfen had the greatest correlation. Precipitation from May to August could deplete O3 by wet deposition; the effects in Yuncheng, Lvliang and Shuozhou were obvious. Precipitation from May to August in Shanxi accounted for a large proportion of annual precipitation, indicating that heavy precipitation has a wet deposition effect on O3. Similar to temperature, the correlation between O3 and sunshine duration from May to August was weaker than that of the whole year and had the most significant impact on MDA8 O3. Wind speed mainly affected mean mass concentration of O3, with a positive correlation coefficient ranging from 0.083 to 0.321. MDA8 O3 and wind speed from 11:00 to 20:00 had a large positive correlation in Yangquan, indicating that high O3 pollution in Yangquan was obviously affected by the influence of daytime transport.
In summary, meteorological factors greatly influenced the surface O3, and the impacts on MDA8 O3 were generally greater than the mean level. Among these factors, temperature and sunshine duration had the strongest effects on local O3, while relative humidity and precipitation were relatively weak, and the impact of wind varied greatly in different cities. When local surface O3 in a city was significantly correlated with meteorological factors that affected photochemical reactions (such as temperature and sunshine duration), O3 pollution was considered to be mainly caused by local photochemical accumulation; otherwise, regional transport was the dominant reason. Thus, when considering the results alongside those in Section 3.2.4, it can be concluded that surface O3 pollution in Linfen, Yuncheng, and Taiyuan was mainly caused by local photochemical reactions, while that in Jincheng, Xinzhou, Lvliang and Yangquan mainly resulted from regional transports. Local photochemical reactions and regional transports played equally important roles in O3 accumulation in other cities in Shanxi Province.

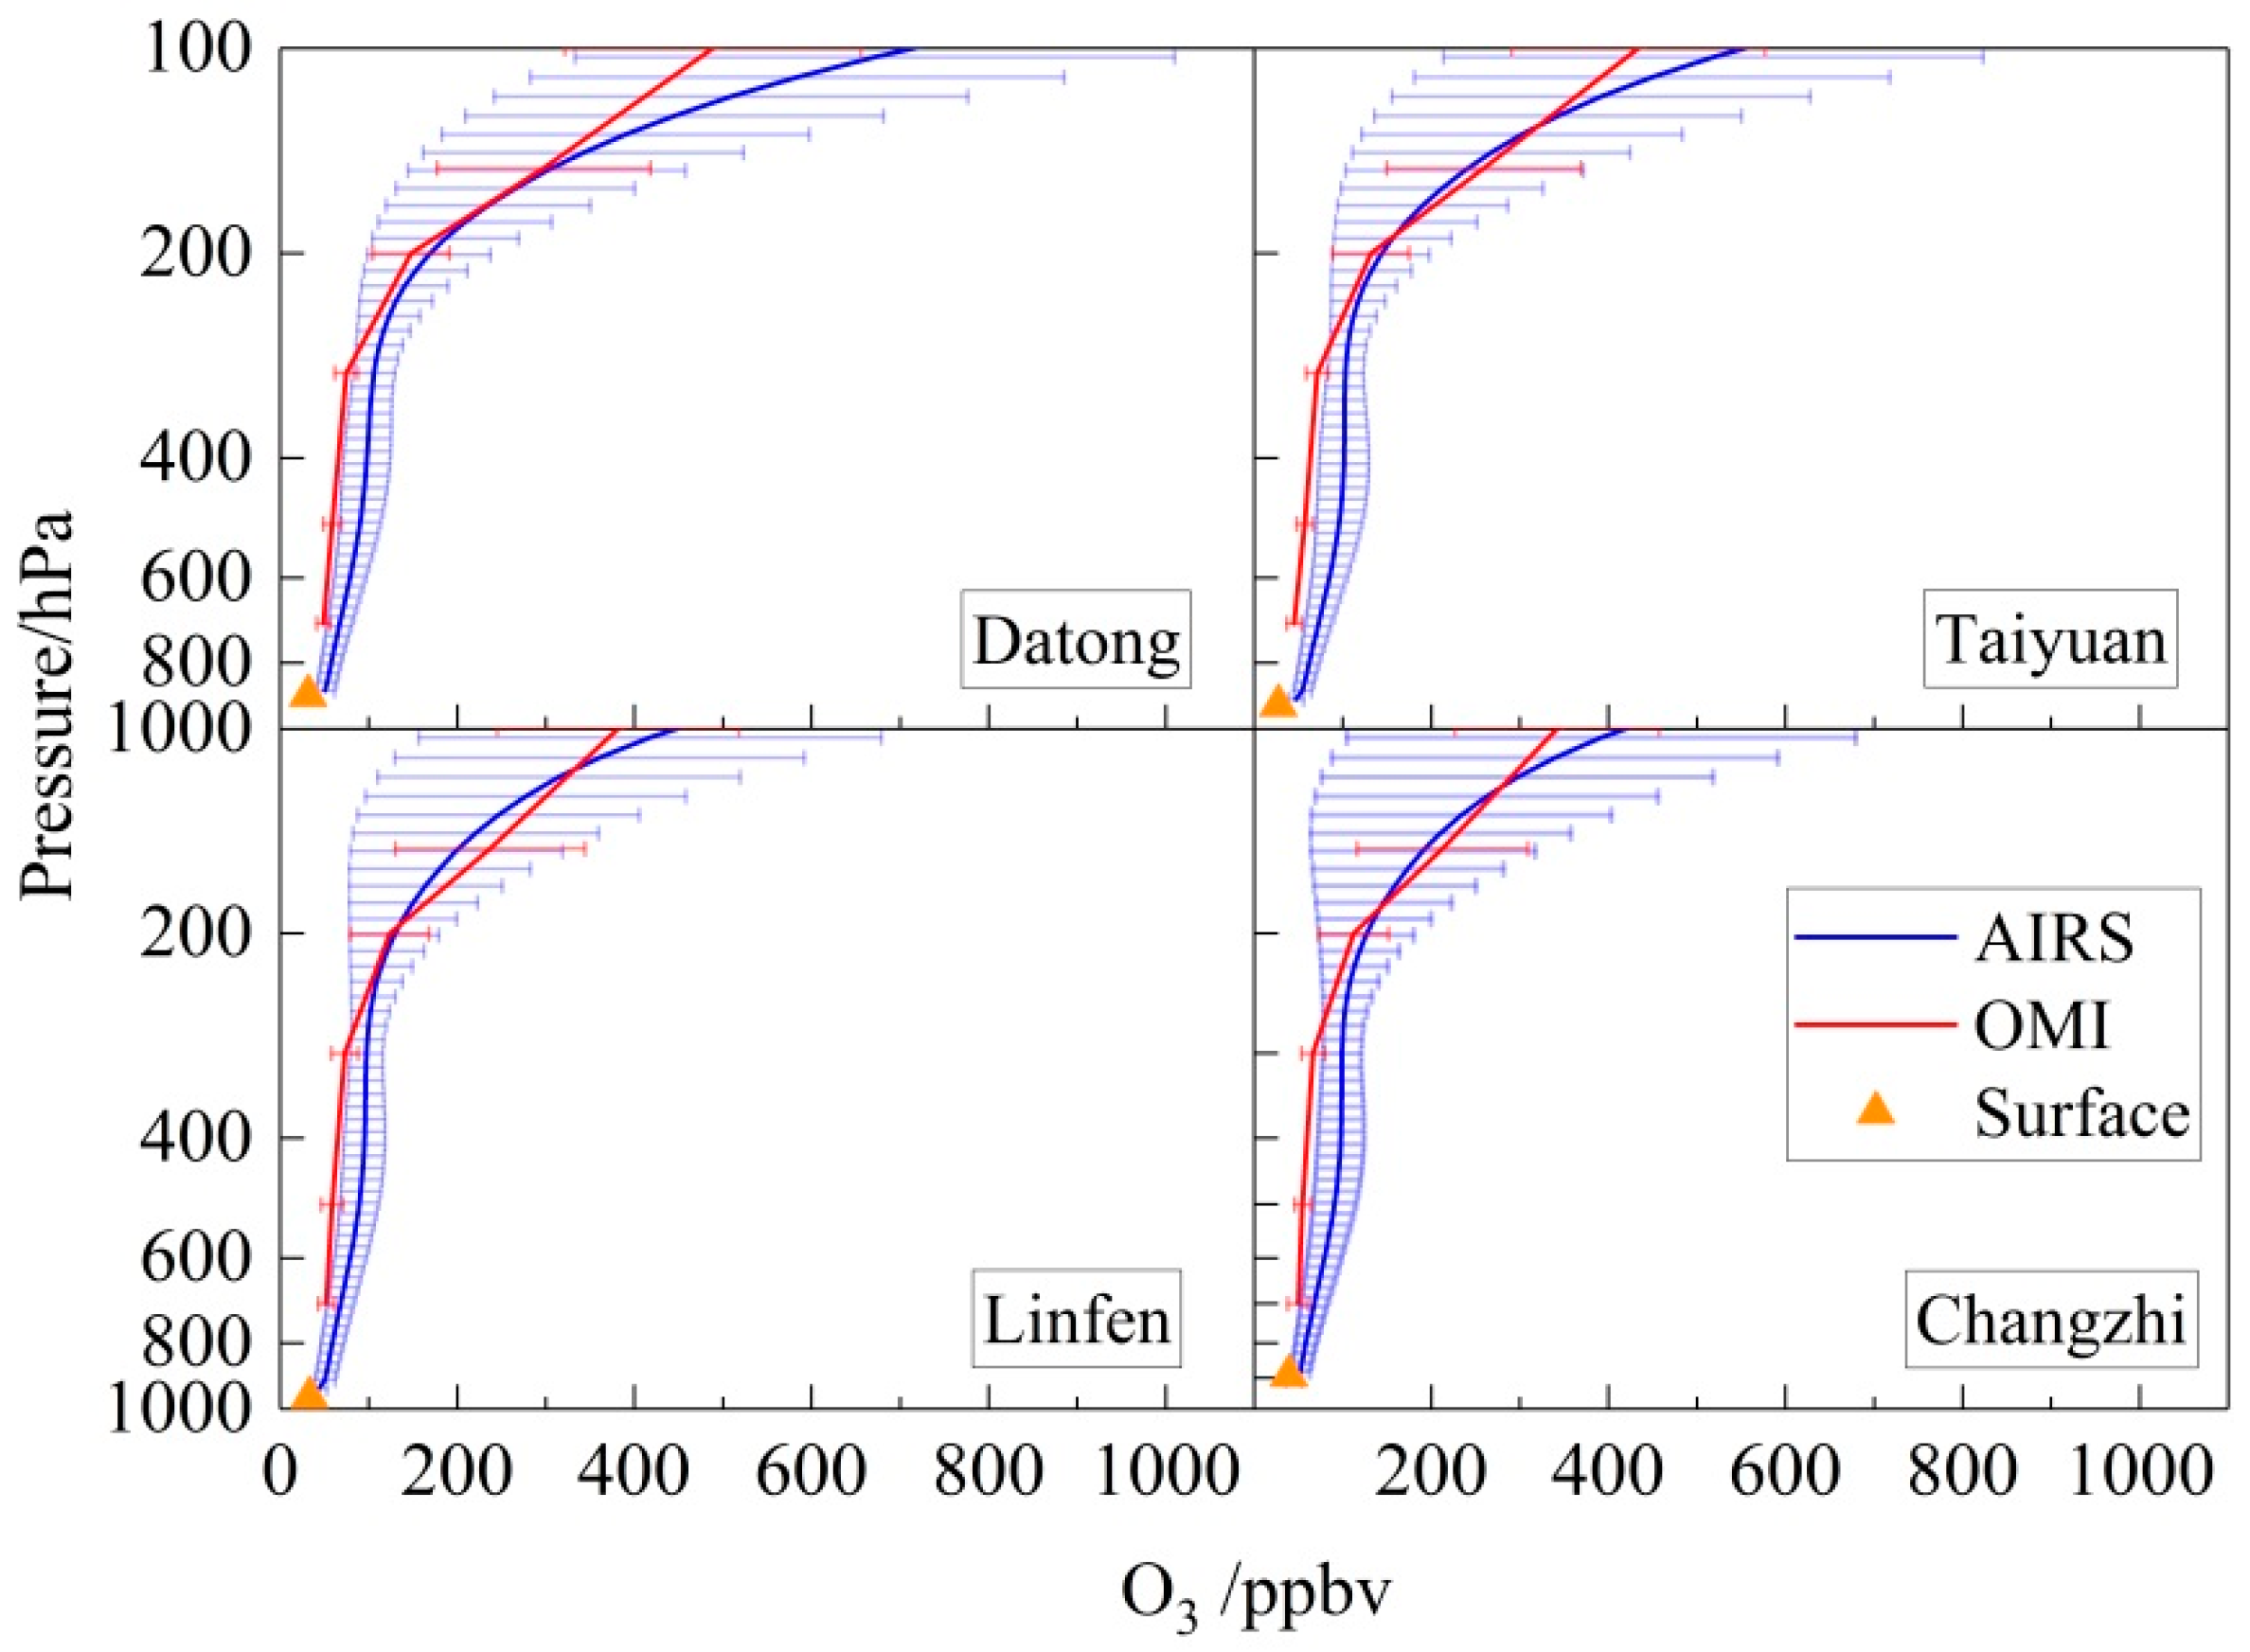
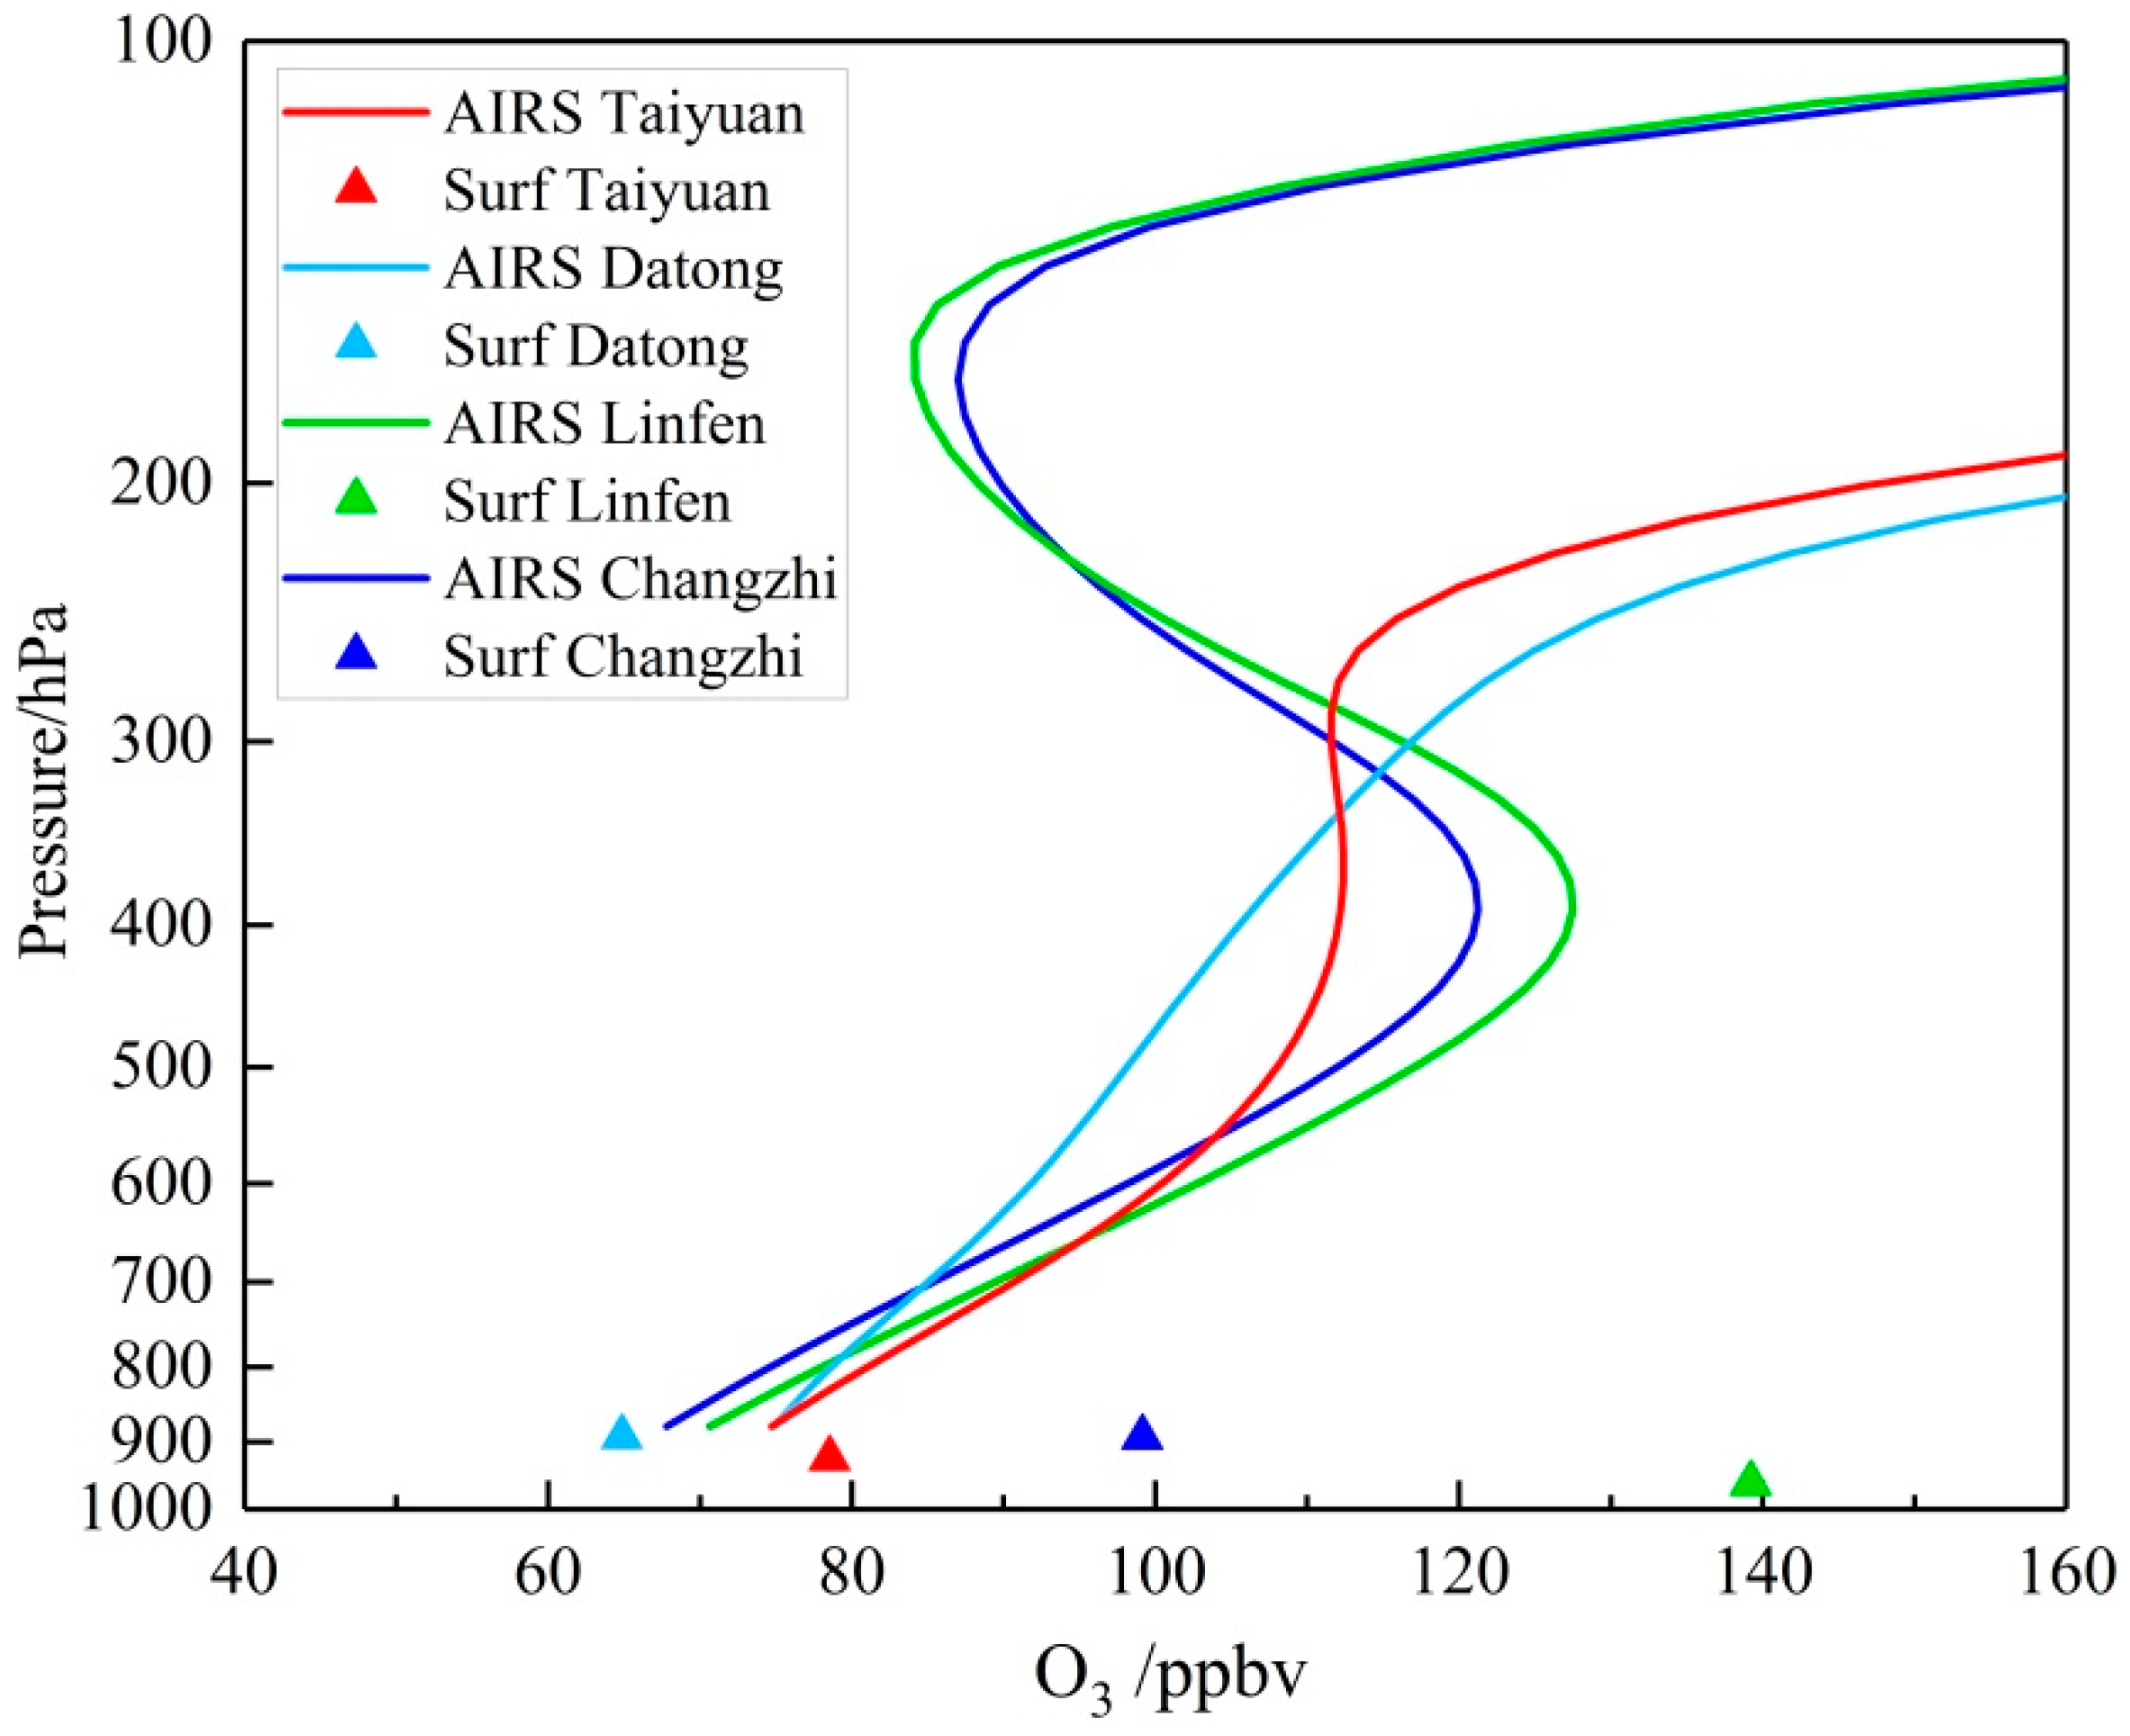
3.3. Vertical Distribution of O3 in Typical Polluted Areas

The research period was selected as 2017 as surface O3 pollution has become a prominent problem since then. Datong (40.1 ± 0.1° N, 113.3 ± 0.1° E) in northern Shanxi, Taiyuan (37.8 ± 0.1° N, 112.3 ± 0.1° E) in central Shanxi, Linfen (36.1 ± 0.1° N, 111.5 ± 0.1° E) in the southern Shanxi Basin and Changzhi (36.0 ± 0.1° N, 113.1 ± 0.1° E), at higher latitudes, were selected as typical polluted areas to analyze the vertical distribution of O3. AIRS Support Products contain profiles reported at 100 layers from 1100 hPa to 0.016 hPa, while OMI O3 profiles are retrieved at 18 layers: surface pressure, 700, 500, 300, 200, 150, 100, 70, 50, 30, 20, 10, 7, 5, 3, 2, 1, 0.5, and 0.3 hPa. The AIRS profile has high vertical resolution, especially in the lower troposphere.
The unit of OMI O3 profile is DU per layer, while AIRS provides an average volume mixing ratio per layer in ppmv; thus, DU is converted to ppmv using Equation (1):
<VMR>i = 1.2672 Ni/DPi
where Ni is the layer-column in DU, DPi is the pressure difference between the top and bottom of the layer in hPa and <VMR>i is the average volume mixing ratio in ppmv.
The annual mean O3 vertical profiles from AIRS (blue line) and OMI (red line) are given in Figure 14, including annual mean O3 volume mixing ratio (O3 VMR), O3 VMR standard deviation, and annual mean surface O3 VMR. As shown in Figure 14, O3 VMR gradually increased at heights below 100 hPa, increased slowly below 200 hPa and rose rapidly above 200 hPa. Considering the atmospheric pressure difference between the near-surface layer of AIRS and the ground, the deviation of near-surface layer O3 VMR retrieved from AIRS and ground observation over Taiyuan was significantly higher than that of the other three cities. This indicated the atmospheric stability of Taiyuan was relatively high and vertical mixing was suppressed.
Below the middle and lower stratosphere, O3 VMR and standard deviation retrieved by OMI were slightly smaller than those retrieved by AIRS, and the two inversion results were close to each other. Therefore, compared with the O3 retrieved on the AIRS infrared channel that can work the whole day, the OMI O3 profile still provides an important reference value even though it uses an ultraviolet channel to retrieve O3 and works only in the daytime and at a low vertical resolution [45].
Figure 15a shows seasonal mean O3 VMR vertical profiles of AIRS, OMI and surface O3 VMR below 100 hPa. The profiles below 500 hPa are further shown in Figure 15b to illustrate the distribution of the lower troposphere. O3 VMR rose rapidly with altitudes above 200 hPa in each season; this altitude was the transition layer between tropopause and lower stratosphere, which was lower in winter and spring at 230 hPa and could reach approximately 140 hPa in summer. O3 VMR below 100 hPa was generally higher in spring and winter, which corresponded to the seasonal variation in the O3 total column [68]. However, O3 VMR peaked at approximately 120 ppbv near 400 hPa in summer, and the peak value in Taiyuan reached 130 ppbv. This may be associated with the higher reactivity of photochemical reactions and the frequent stratospheric intrusion caused by the stronger subtropical jet stream in summer [69,70,71]. Meanwhile, the tropospheric altitude was significantly lower in winter than in other seasons.
Below 500 hPa (Figure 15b), the trend in O3 VMR from OMI inversion was consistent with AIRS. O3 deviations between near-surface retrievals from satellite and ground observations were smaller in summer but ranged from 10–30 ppbv in other seasons. O3 VMR reached 50–60 ppbv in the near-surface layer at approximately 900 hPa in summer over the four typical polluted cities. Linfen, located in the basin, had the highest near-surface O3, which was close to the ground observation results. Datong and Changzhi, at higher altitudes, had similar near-surface layer O3 levels, while Taiyuan at a moderate altitude had the lowest. In the boundary layer in summer, vertical distribution of O3 had an obvious positive gradient in Taiyuan compared with the other three cities, indicating greater atmospheric dynamic stability and suppressed vertical mixing. Furthermore, nitric oxide (NO) titration and dry deposition of the ground at night can effectively remove O3, causing a large difference in O3 between surface and upper layers [58,72], while Changzhi had a greater probability of vertical mixing, and O3 was evenly distributed. The increasing rate of O3 content with altitude was significantly higher in Taiyuan in summer, followed by Datong, while Linfen and Changzhi were slightly lower, showing that tropospheric O3 precursors were relatively sufficient for O3 accumulation in Taiyuan and Datong. The positive vertical gradients of O3 in the surface layer were obvious in Taiyuan and Linfen, which may be related to its greater atmospheric dynamic stability in winter. Vertical distributions of boundary layer O3 were similar in the four cities in spring and autumn, but positive vertical gradients of O3 in the surface layer were obvious in spring in Taiyuan and Linfen. In summary, Taiyuan had higher deviation with greater atmospheric dynamic stability than the other cities in each season. Changzhi had a greater probability of vertical mixing so that the deviation was lower in summer. Atmospheric dynamic stability of all the cities was relatively great in winter, which was consistent with the conclusion above.
A case of AIRS that scanned Datong, Taiyuan, Linfen and Changzhi at 13:00 (BJT) on 1 June 2017 was further observed. According to ground observation data, MDA8 O3 was the primary pollutant on that day in four cities, corresponding to the Air Quality Index (AQI) grades: Linfen was heavily polluted, Changzhi and Taiyuan were mildly polluted, and Datong was good.
The O3 mass concentration unit of ground observation is μg·m−3, which needs to be converted into volume mixing ratio in ppbv to be consistent with AIRS data, and the fitting formula is obtained as Equation (2):
C = C · P 0 P a · ( T 0 + t a ) T 0 · 22.4 M
where C is O3 volume mixing ratio in ppbv, C is O3 mass concentration in μg·m−3, P 0 = 1013.25 hPa, P a is pressure of surface monitoring station in hPa, T 0 = 273.15 K, t a is temperature at the measured time in °C,   M is the molecular mass of the gas (48 for O3).
Figure 16 shows O3 profiles and surface O3. Surface meteorological data showed that horizontal wind speeds were all less than 4 m·s−1 with poor horizontal transport and diffusion abilities. Surface O3 reached 155 ppbv, 104 ppbv, 87 ppbv and 73 ppbv in Linfen, Changzhi, Taiyuan and Datong, respectively. It is worth noting that the pressure deviation of near−surface retrieval from satellite and ground observation was 50 hPa in Linfen, and there was a great difference in O3 VMR between the two layers. This suggested that favorable meteorological conditions and sufficient precursors generated a large amount of surface O3 in Linfen at noon. Meanwhile, great atmospheric dynamic stability and suppressed vertical mixing caused O3 accumulation near the surface at that time. Pressure deviation of near−surface retrieval from satellite and ground observation was 45 hPa in Taiyuan, and O3 VMR was very close between the two layers, showing that great vertical mixing transported O3 upward at noon. Pressure deviations in Datong and Changzhi were approximately 15 hPa. Surface O3 VMR was close to the upper layer and coincided with the mean vertical distribution of O3 in summer, indicating a greater probability of vertical mixing in the surface layer in Datong, while O3 VMR deviation of the two layers was high in Changzhi. O3 peaked at 400 hPa, except Datong, and the altitudes of peak values in Taiyuan were slightly higher than Linfen and Changzhi, but the value was lower. O3 decreased at altitudes above 400 hPa and then rapidly increased after reaching stratosphere. Linfen and Changzhi have lower latitudes and higher tropopause than Taiyuan and Datong.
In summary, vertical distributions of O3 in typical polluted cities of Shanxi were retrieved by AIRS and OMI, and the two inversion trends were relatively consistent, while O3 VMR and standard deviation from OMI were generally smaller than those of AIRS. Although there is some uncertainty in tropospheric O3 inversion, it can reflect the overall characteristics of the vertical distribution of O3. In the middle and lower troposphere, O3 generally increases with altitude and increases rapidly above approximately 200 hPa, and O3 VMR is larger in spring and winter. Meanwhile, there is a peak near 400 hPa in summer, which is significantly higher than that of other seasons at that altitude. In the boundary layer of Taiyuan in summer, the vertical distribution of O3 had an obvious positive gradient, and the rising rate of O3 with altitude was significantly high. Positive vertical gradients of O3 in the surface layer were obvious in Taiyuan and Linfen in winter and spring, which related to greater atmospheric dynamic stability in those cities. The case of surface O3 pollution showed that favorable meteorological conditions and sufficient precursors generated a large amount of surface O3 in Linfen at noon, while great atmospheric dynamic stability and suppressed vertical mixing caused O3 accumulation near the surface. O3 peaked at 400 hPa in Taiyuan, Linfen and Changzhi, with a higher altitude and a lower peak value in Taiyuan.

4. Conclusions

Based on the national surface environmental monitoring data and meteorological observation data of Shanxi Province during the time period from 2015 to 2020, and the satellite remote sensing data from AIRS and OMI in 2017, surface O3 pollution and its related meteorological factors as well as the vertical distribution of O3 in typical O3 pollution cities in Shanxi Province were analyzed in this paper.
O3 became the primary air pollutant in Shanxi in recent years. Although surface NO2 and atmospheric particulate matter in most urban areas of Shanxi reached their peak around 2017, surface O3 pollution still maintained a high pollution level and was even worse in spring and autumn in the last two years. Surface O3 had a zonal distribution, and Linfen was the most polluted city.
The comprehensive influence of meteorological factors on surface O3 indicated that surface O3 increased exponentially with rising temperature and declining humidity, followed by increasing sunshine duration. The influence of relative humidity on O3 depletion at nighttime was notably less than that in the daytime. Upwind transport had a great influence on surface O3 from May to August. O3 pollution in Linfen, Yuncheng and Taiyuan was mainly caused by local photochemical reactions, while that in Jincheng, Xinzhou, Lvliang and Yangquan mainly resulted from regional transports. Local photochemical reactions and regional transports played equally important roles in O3 accumulation in other cities.
The trends in the vertical distribution of O3 retrieved from AIRS and OMI in four typical polluted cities of Shanxi were relatively consistent, and the O3 VMR and standard deviation of OMI were generally smaller than AIRS. In summer, near-surface O3 obtained by satellite retrieval was consistent with ground observation. O3 VMR in the middle and lower troposphere generally increased with altitude and peaked at 120 ppbv at approximately 400 hPa in summer. The positive vertical gradient of O3 in the boundary layer was obvious in Taiyuan in summer and was also significant in the surface layer in Taiyuan and Linfen during winter and spring, which was related to greater atmospheric dynamic stability in those cities. The results of surface O3 pollution suggested that favorable meteorological conditions and sufficient precursors generated a large amount of surface O3 in Linfen at noon, while great atmospheric dynamic stability and suppressed vertical mixing caused O3 accumulation near the surface.
It should be noted that the whole stations in this paper are located in urban areas and on sites close to each region, and the level of O3 precursors between urban, suburban and rural areas has remarkable influences on photochemical processes and then determines O3 production. It is necessary to separate anthropogenic emission regions with natural emission regions in further investigation. Meanwhile, under the current background of decreased atmospheric particulate matter and serious surface O3 pollution, it is important to examine the synergism between these factors to comprehensively treat air pollution. Furthermore, due to the lack of direct detection of O3 in the lower troposphere in this region, O3 vertical distribution retrieved by satellite observation is critical for the study of vertical mixing and transport of local O3, as well as its regional transport characteristics.

Author Contributions

Conceptualization, L.C.; Data curation, L.C., X.G., J.L. and R.N.; Formal analysis, L.C. and M.L.; Funding acquisition, H.X. and L.Z.; Methodology, H.X., W.W., W.G. and Y.W.; Project administration, H.X. and L.Z.; Validation, L.C. and L.M.; Visualization, L.C. and J.H.; Writing—original draft, L.C.; Writing—review & editing, H.X., L.Z. and E.C. All authors have read and agreed to the published version of the manuscript.

Funding

This work was supported by the National Key Basic Research Development Program of China (Grants 2019YFC1510301 and 2019YFC1510304), Natural Science Foundation of Shanxi (Grant 201901D111465), Key Basic Research Development Program of Shanxi (Grants 20210302124202 and 201803D31220).

Institutional Review Board Statement

Not applicable.

Informed Consent Statement

Not applicable.

Data Availability Statement

The data are not publicly available due to participants not having consented to the data being shared.

Acknowledgments

Thanks to the editors and anonymous reviewers for their positive comments and advices to this manuscript, and also very grateful to the Natural Science Foundation of China and Shanxi Province for their strong support.

Conflicts of Interest

The authors declare no conflict of interest.

References

  1. Wang, T.J.; Sun, Z.B. Development of study on ozone variation and its climatic effect. Adv. Earth Sci. 1999, 14, 37–43. (In Chinese) [Google Scholar]
  2. Jia, L.; Ge, M.F. Advances in atmospheric ozone chemistry. Prog. Chem. 2006, 18, 1565–1574. [Google Scholar]
  3. Wang, W.G.; Yuan, M.; Wang, H.Y.; Sun, J.H.; Xie, Y.Q.; Fan, W.X.; Chen, X.M. A study of ozone amount in the transition layer between troposphere and stratosphere and its heating rate. Chin. J. Geophys. 2008, 51, 1309–1320. [Google Scholar] [CrossRef]
  4. Zhou, S.W.; Yang, S.Y.; Zhang, R.H.; Li, H.; Wang, M.R. Possible causes of total ozone depletion over the Qinghai-Xizang Plateau and its relation to tropopause height in recent 30 years. Plateau Meteorol. 2012, 31, 1417–1478. [Google Scholar]
  5. Ramaswamy, V.; Chanin, M.L.; Angell, J.; Barnett, J.; Gaffen, D.; Gelman, M.; Keckhut, P.; Koshelkov, Y.; Labitzke, K.; Lin, J.J.R.; et al. Stratospheric temperature trends: Observation sand model simulations. Rev. Geophys. 2001, 39, 71–122. [Google Scholar] [CrossRef]
  6. Tang, X.Y.; Zhang, Y.H.; Shao, M. Atmospheric Environmental Chemistry, 2nd ed.; Higher Education Press: Beijing, China, 2006. [Google Scholar]
  7. Lelieveld, J.; Dentener, F.J. What controls tropospheric ozone? J. Geophys. Res. Atmos. 2000, 105, 3531–3551. [Google Scholar] [CrossRef]
  8. Young, P.J.; Archibald, A.T.; Bowman, K.W.; Lamarque, J.F.; Zeng, G. Pre-industrial to end 21st century projections of tropospheric ozone from the Atmospheric Chemistry and Climate Model Intercomparison Project (ACCMIP). Atmos. Chem. Phys. 2013, 13, 2063–2090. [Google Scholar] [CrossRef] [Green Version]
  9. Atkinson, R. Atmospheric chemistry of VOCs and NOx. Atmos. Environ. 2000, 34, 2063–2101. [Google Scholar] [CrossRef]
  10. Zou, Y.; Deng, X.J.; Zhu, D.; Gong, D.C.; Wang, H.; Li, F.; Tan, H.B.; Deng, T.; Mai, B.R.; Liu, X.T.; et al. Characteristics of 1 year of observational data of VOCs, NOx and O3 at a suburban site in Guangzhou, China. Atmos. Chem. Phys. 2015, 15, 6625–6636. [Google Scholar] [CrossRef] [Green Version]
  11. Xiao, H.; Zhu, B. Modelling study of photochemical ozone creation potential of non-methane hydrocarbon. Water Air Soil Pollut. 2003, 145, 3–16. [Google Scholar] [CrossRef]
  12. Li, R.; Xu, M.; Li, M.; Chen, Z.; Zhao, N.; Gao, B.; Yao, Q. Identifying the spatiotemporal variations in ozone formation regimes across China from 2005 to 2019 based on polynomial simulation and causality analysis. Atmos. Chem. Phys. 2021, 21, 15631–15646. [Google Scholar] [CrossRef]
  13. Wang, Z.S.; Li, Y.T.; Chen, T.; Zhang, D.W.; Sun, F.; Wang, X.; Huan, N.; Pan, L.B. Analysis on diurnal variation characteristics of ozone and correlations with its precursors in urban atmosphere of Beijing. China Environ. Sci. 2014, 34, 3001–3008. [Google Scholar]
  14. Fiore, A.M.; Dentener, F.J.; Wild, O.; Cuvelier, C.; Schultz, M.G.; Hess, P.; Textor, C.; Schulz, M.; Doherty, R.M.; Horowitz, L.W.; et al. Multimodel estimates of intercontinental source-receptor relationships for ozone pollution. J. Geophys. Res.-Atmos. 2009, 114, 1–24. [Google Scholar] [CrossRef]
  15. Wang, X.S.; Li, J.L. The contribution of anthropogenic hydrocarbons to ozone formation in Beijing areas. China Environ. Sci. 2002, 22, 501–505. [Google Scholar]
  16. Shu, L.; Xie, M.; Wang, T.J.; Gao, D.; Chen, P.L.; Han, Y.; Li, S.; Zhuang, B.L.; Li, M.M. Integrated studies of a regional ozone pollution synthetically affected by subtropical high and typhoon system in the Yangtze River Delta region, China. Atmos. Chem. Phys. 2016, 16, 15801–15819. [Google Scholar] [CrossRef]
  17. Jiang, Z.J.; Li, J.; Lu, X.; Gong, C.; Zhang, L.; Liao, H. Impact of western Pacific subtropical high on ozone pollution over eastern China. Atmos. Chem. Phys. 2021, 21, 2601–2613. [Google Scholar] [CrossRef]
  18. Li, K.F.; Jiang, X.; Liang, M.C.; Yung, Y.L. Simulation of solar-cycle response in tropical total column ozone using SORCE irradiance. Atmos. Chem. Phys. Discuss. 2012, 12, 1867–1893. [Google Scholar] [CrossRef] [Green Version]
  19. Xue, L.; Xu, S.C.; Sun, M.; Meng, H.; Wang, J.; Zhang, Y.Q.; Liu, Y.F. Effect of Meteorological Factors and Precursors on the Change of Ambient Air Ozone Concentrations in Qingdao. Environ. Monit. China 2017, 33, 179–185. [Google Scholar]
  20. Shen, Y.B.; Wang, B. Effect of surface solar radiation variations on temperature in South-East China during recent 50 years. Chin. J. Geophys. 2011, 54, 1457–1465. [Google Scholar]
  21. Huang, J.; Liao, B.T.; Wu, D.; Wang, C.L.; Lan, J.; Shen, Z.Q.; Tang, J.; Liang, G.X. Guangzhou ground level ozone concentration characteristics and associated meteorological factors. Acta Sci. Circumstantiae 2018, 38, 23–31. [Google Scholar]
  22. Han, H.; Liu, J.; Shu, L.; Wang, T.; Yuan, H. Local and synoptic meteorological influences on daily variability in summertime surface ozone in eastern China. Atmos. Chem. Phys. 2020, 20, 203–222. [Google Scholar] [CrossRef] [Green Version]
  23. Xu, J.L.; Zhu, Y.X. Effects of the meteorological factors on the ozone pollution near the ground. Chin. J. Atmos. Sci. 1994, 18, 751–757. [Google Scholar]
  24. Yi, R.; Wang, Y.L.; Zhang, Y.J.; Shi, Y.; Li, M.S. Pollution characteristics and influence factors of ozone in Yangtze River Delta. Acta Sci. Circumstantiae 2015, 35, 2370–2377. [Google Scholar]
  25. Jacob, D.J.; Winner, D.A. Effect of climate change on air quality. Atmos. Environ. 2009, 43, 51–63. [Google Scholar] [CrossRef] [Green Version]
  26. Lu, K.D.; Guo, S.; Tan, Z.F.; Wang, H.C.; Shang, D.J.; Liu, Y.H.; Li, X.; Wu, Z.J.; Hu, M.; Zhang, Y.H. Exploring atmospheric free-radical chemistry in China: The self-cleansing capacity and the formation of secondary air pollution. Natl. Sci. Rev. 2019, 6, 579–594. [Google Scholar] [CrossRef] [Green Version]
  27. Camalier, L.; Cox, W.; Dolwick, P. The effects of meteorology on ozone in urban areas and their use in assessing ozone trends. Atmos. Environ. 2007, 41, 7127–7137. [Google Scholar] [CrossRef]
  28. Xue, L.K.; Wang, T.; Gao, J.; Ding, A.J.; Zhou, X.H.; Blake, D.R.; Wang, X.F.; Saunders, S.M.; Fan, S.J.; Zuo, H.C.; et al. Ground-level ozone in four Chinese cities: Precursors, regional transport and heterogeneous processes. Atmos. Chem. Phys. 2014, 14, 13175–13188. [Google Scholar] [CrossRef] [Green Version]
  29. Chung, Y.S. Ground-level ozone and regional transport of air pollutants. J. Appl. Meteor. 1977, 16, 1127–1136. [Google Scholar] [CrossRef]
  30. Zhao, W.; Gao, B.; Liu, M.; Lu, Q.; Ma, S.X.; Sun, J.R.; Chen, L.G.; Fan, S.J. Impact of Meteorological Factors on the Ozone Pollution in Hong Kong. Environ. Sci. 2019, 40, 55–66. [Google Scholar]
  31. Fei, L.L. Effect of Lightning Activities on Surface Atmospheric Nitrogen Dioxides. Ph.D. Thesis, University of Chinese Academy of Sciences, Guangzhou, China, 2017; p. 136. [Google Scholar]
  32. Li, K.; Jacob, D.J.; Shen, L.; Lu, X.; De Smedt, I.; Liao, H. Increases in surface ozone pollution in China from 2013 to 2019: Anthropogenic and meteorological influences. Atmos. Chem. Phys. 2020, 20, 11423–11433. [Google Scholar] [CrossRef]
  33. Wang, W.; van der A, R.; Ding, J.; van Weele, M.; Cheng, T. Spatial and temporal changes of the ozone sensitivity in China based on satellite and ground-based observations. Atmos. Chem. Phys. 2021, 21, 7253–7269. [Google Scholar] [CrossRef]
  34. Ma, X.; Huang, J.; Zhao, T.; Liu, C.; Zhao, K.; Xing, J.; Xiao, W. Rapid increase in summer surface ozone over the North China Plain during 2013–2019: A side effect of particulate matter reduction control? Atmos. Chem. Phys. 2021, 21, 1–16. [Google Scholar] [CrossRef]
  35. Ministry of Ecology and Environment of the People’s Republic of China. Announcements on the Implementation of Special Emission Limits of Air Pollutants in Beijing-Tianjin-Hebei Air Pollution Transmission Channel Cities, Announcement No. 9. 2018. Available online: https://www.mee.gov.cn/gkml/hbb/bgg/201801/t20180119_429997.htm (accessed on 10 January 2020).
  36. Ministry of Ecology and Environment of the People’s Republic of China. China’s Ecological Environment Communique of 2020. 2020. Available online: http://www.mee.gov.cn/hjzl/sthjzk/zghjzkgb/202105/P020210526572756184785.pdf (accessed on 10 January 2020).
  37. GB3095-2012; Ministry of Ecology and Environment of the People’s Republic of China, and General Administration of Quality Supervision, Inspection and Quarantine of the People’s Republic of China: Ambient Air Quality Standards. China Environmental Science Press: Beijing, China; Ministry of Ecology and Environment of the People’s Republic of China: Beijing, China, 2012. Available online: http://www.mee.gov.cn/ywgz/fgbz/bz/bzwb/dqhjbh/dqhjzlbz/201203/W020120410330232398521.pdf (accessed on 10 January 2020).
  38. Ministry of Ecology and Environment of the People’s Republic of China. Technical Regulation for Ambient Air Quality Assessment (on Trial), HJ 663-2013. 2013. Available online: http://www.mee.gov.cn/ywgz/fgbz/bz/bzwb/jcffbz/201309/W020131105548549111863.pdf (accessed on 10 January 2020).
  39. Barnet, C.; Manning, E.; Rosenkranz, P.; Strow, L.; Susskind, J. AIRS Level 2 Algorithm Theoretical Basis Document, Version 4.0; 1 March 2007. Available online: https://disc.gsfc.nasa.gov/information/documents?title=AIRS%20Documentation (accessed on 16 July 2020).
  40. de Haan, J.F.; Veefkind, J.P. OMO3PR Readme Document; 28 September 2012. Available online: https://aura.gesdisc.eosdis.nasa.gov/data/Aura_OMI_Level2/OMO3PR.003/doc/README.OMO3PR.pdf (accessed on 10 July 2020).
  41. OMI Team. Ozone Monitoring Instrument (OMI) Data User’s Guide; OMI-DUG-5.0; 5 January 2012. Available online: https://docserver.gesdisc.eosdis.nasa.gov/repository/Mission/OMI/3.3_ScienceDataProductDocumentation/3.3.2_ProductRequirements_Designs/README.OMI_DUG.pdf (accessed on 17 June 2020).
  42. Veefkind, J.P.; de Haan, J.F.; Levelt, P.F.; Noordhoek, R. OMI Level 2 Ozone Profile Data Product Specification; Issue 1.1; 11 June 2009. Available online: https://docserver.gesdisc.eosdis.nasa.gov//repository/Mission/OMI/3.3_ScienceDataProductDocumentation/3.3.2_ProductRequirements_Designs/L2_profile_spec_issue11.pdf (accessed on 17 June 2020).
  43. Manning, E.; Kahn, B.; Fetzer, E.J.; Yue, Q.; Wong, S.; Kalmus, P.; Payne, V.; Olsen, E.T.; Wilson, R.C.; Blaisdell, J.; et al. AIRS/AMSU/HSB Version 7 Level 2 Product User Guide; Document Version 1.0.1; 12 July 2020. Available online: https://disc.gsfc.nasa.gov/information/documents?title=AIRS%20Documentation (accessed on 12 August 2020).
  44. Kahn, B.; Manning, E.; Blaisdell, J.; Susskind, J. AIRS/AMSU/HSB Version 7 Level 2 Quality Control and Error Estimation; Document Version 0.3.1; 8 June 2020. Available online: https://disc.gsfc.nasa.gov/information/documents?title=AIRS%20Documentation (accessed on 13 August 2020).
  45. Blaisdell, J.M.; Farahmand, A.; Fetzer, E.J.; Fishbein, E.; Griffin, E.; Iredell, L.; Irion, F.W.; Kahn, B.H.; Kalmus, P.; Manning, E.; et al. AIRS Version 7 Level 2 Performance Test and Validation Report; April 2020. Available online: https://disc.gsfc.nasa.gov/information/documents?title=AIRS%20Documentation (accessed on 14 September 2020).
  46. Zong, L.; Yang, Y.; Gao, M.; Wang, H.; Wang, P.; Zhang, H.; Wang, L.; Ning, G.; Liu, C.; Li, Y.; et al. Large-scale synoptic drivers of co-occurring summertime ozone and PM2.5 pollution in eastern China. Atmos. Chem. Phys. 2021, 21, 9105–9124. [Google Scholar] [CrossRef]
  47. Department of Ecology and Environment of Shanxi Province 2015–2019: Bulletin on the Status of Ecological Environment in Shanxi Province. Available online: https://sthjt.shanxi.gov.cn/html/hjzkgb/ (accessed on 7 May 2021).
  48. Dickerson, R.R.; Kondragunta, S.; Stenchikov, G.; Civerolo, K.L.; Doddridge, B.G.; Holben, B.N. The impact of aerosols on solar ultraviolet radiation and photochemical smog. Science 1997, 278, 827–830. [Google Scholar] [CrossRef] [PubMed] [Green Version]
  49. Castro, T.; Madronich, S.; Rivale, S.; Muhlia, A.; Mar, B. The influence of aerosols on photochemical smog in Mexico City. Atmos. Environ. 2001, 35, 1765–1772. [Google Scholar] [CrossRef]
  50. Benas, N.; Mourtzanou, E.; Kouvarakis, G.; Bais, A.; Mihalopoulos, N.; Vardavas, I. Surface ozone photolysis rate trends in the Eastern Mediterranean: Modeling the effects of aerosols and total column ozone based on Terra MODIS data. Atmos. Environ. 2013, 74, 1–9. [Google Scholar] [CrossRef]
  51. Tan, Z.; Fuchs, H.; Lu, K.; Hofzumahaus, A.; Bohn, B.; Broch, S.; Dong, H.; Gomm, S.; Häseler, R.; He, L.; et al. Radical chemistry at a rural site (Wangdu) in the North China Plain: Observation and model calculations of OH, HO2 and RO2 radicals. Atmos. Chem. Phys. 2017, 17, 663–690. [Google Scholar] [CrossRef] [Green Version]
  52. Tan, Z.; Rohrer, F.; Lu, K.; Ma, X.; Bohn, B.; Broch, S.; Dong, H.; Fuchs, H.; Gkatzelis, G.I.; Hofzumahaus, A.; et al. Wintertime photochemistry in Beijing: Observations of ROx radical concentrations in the North China Plain during the BEST-ONE campaign. Atmos. Chem. Phys. 2018, 18, 12391–12411. [Google Scholar] [CrossRef] [Green Version]
  53. Lu, K.D.; Rohrer, F.; Holland, F.; Fuchs, H.; Brauers, T.; Oebel, A.; Dlugi, R.; Hu, M.; Li, X.; Lou, S.R.; et al. Nighttime observation and chemistry of HOx in the Pearl River Delta and Beijing in summer 2006. Atmos. Chem. Phys. 2014, 14, 4979–4999. [Google Scholar] [CrossRef] [Green Version]
  54. Qu, Y.W.; Wang, T.J.; Cai, Y.F.; Wang, S.K.; Chen, P.L.; Li, S.; Li, M.M.; Yuan, C.; Wang, J.; Xu, S.C. Influence of atmospheric particulate matter on ozone in Nanjing, China: Observational study and mechanistic analysis. Adv. Atmos. Sci. 2018, 35, 1381–1395. [Google Scholar] [CrossRef]
  55. Xing, J.; Wang, J.; Mathur, R.; Wang, S.; Sarwar, G.; Pleim, J.; Hogrefe, C.; Zhang, Y.; Jiang, J.; Wong, D.C.; et al. Impacts of aerosol direct effects on tropospheric ozone through changes in atmospheric dynamics and photolysis rates. Atmos. Chem. Phys. 2017, 17, 9869–9883. [Google Scholar] [CrossRef] [PubMed]
  56. Yu, Y.J.; Meng, X.Y.; Wang, Z.; Zhou, W.; Yu, H.X. Driving Factors of the Significant Increase in Surface Ozone in the Beijing-Tianjin-Hebei Region, China, During 2013–2018. Environ. Sci. 2020, 41, 106–114. [Google Scholar]
  57. Hu, X.M.; Klein, P.M.; Xue, M.; Zhang, F.Q.; Doughty, D.C.; Forkel, R.; Joseph, E.; Fuentes, J.D. Impact of the vertical mixing induced by low-level jets on boundary layer ozone concentration. Atmos. Environ. 2013, 70, 123–130. [Google Scholar] [CrossRef] [Green Version]
  58. Chen, Q.; Li, X.B.; Song, R.F.; Wang, H.W.; Li, B.; He, H.D.; Peng, Z.R. Development and utilization of hexacopter unmanned aerial vehicle platform to characterize vertical distribution of boundary layer ozone in wintertime. Atmos. Poll. Res. 2020, 7, 1073–1083. [Google Scholar] [CrossRef]
  59. James, B.K. Understanding the factors that affect surface ultraviolet radiation. Opt. Eng. 2005, 44, 041002. [Google Scholar] [CrossRef]
  60. Aun, M.; Lakkala, K.; Sanchez, R.; Asmi, E.; Nollas, F.; Meinander, O.; Sogacheva, L.; De Bock, V.; Arola, A.; de Leeuw, G.; et al. Solar UV radiation measurements in Marambio, Antarctica, during years 2017–2019. Atmos. Chem. Phys. 2020, 20, 6037–6054. [Google Scholar] [CrossRef]
  61. Li, R.M.; Wu, Y.Y.; Peng, L.; Ma, Q.L.; Li, Y.H.; Wang, H.J.; Mu, L.; Yan, Y.L.; Bai, H.L. Characteristics and sources apportionment of ambient volatile organic compounds (VOCs) in summer in Shuozhou. Environ. Chem. 2017, 36, 984–993. [Google Scholar]
  62. Cheng, L.J.; Wang, S.; Gong, Z.Y.; Yang, Q.; Wang, Y.Y. Pollution Trends of Ozone in Ozone Monitoring Pilot Cities from 2008 to 2016. Environ. Monit. China 2017, 33, 26–32. [Google Scholar]
  63. Li, S.J.; Li, H.; Chen, M.; Cao, Z.L.; Hunag, Y.G.; Li, S. Effect of meteorological parameters on ozone and its precursors in the southwest urban area of Xi’an. J. Meteorol. Environ. 2018, 34, 59–67. [Google Scholar]
  64. Chang, K.L.; Petropavlovskikh, I.; Cooper, O.R.; Schultz, M.G.; Wang, T. Regional trend analysis of surface ozone observations from monitoring networks in eastern North America, Europe and East Asia. Elem. Sci. Anthr. 2017, 5, 50. [Google Scholar] [CrossRef] [Green Version]
  65. Xiao, H.; Carmichael, G.R.; Durchenwald, J.; Thornton, D.; Bandy, A. Long-range transport of SOx and dust in East Asia during the PEM B Experiment. J. Geophys. Res. 1997, 102, 28589–28612. [Google Scholar] [CrossRef]
  66. Cheng, L.J.; Wang, S.; Gong, Z.Y.; Yang, Q.; Wang, Y.Y. Spatial and seasonal variation and regionalization of ozone concentrations in China. China Environ. Sci. 2017, 37, 4003–4012. [Google Scholar]
  67. Taylor, K.E. Summarizing multiple aspects of model performance in a single diagram. J. Geophys. Res. 2001, 106, 7183–7192. [Google Scholar] [CrossRef]
  68. Schubert, S.D.; Munteanu, M.J. An analysis of tropopause pressure and total ozone correlations. Mon. Weather Rev. 1988, 116, 569–582. [Google Scholar] [CrossRef]
  69. Holton, J.R.; Haynes, P.H.; Mcintyre, M.E.; Douglass, A.R.; Rood, R.B.; Pfister, L. Stratosphere-troposphere exchange. Rev. Geophys. 1995, 33, 403–439. [Google Scholar] [CrossRef]
  70. Tsutsumi, Y.; Igarashi, Y.; Zaizen, Y.; Makino, Y. Case studies of tropospheric ozone events observed at the summit of Mount Fuji. J. Geophys. Res. 1998, 103, 16935–16951. [Google Scholar] [CrossRef]
  71. Ding, A.J.; Wang, T. Influence of stratosphere-to-troposphere exchange on the seasonal cycle of surface ozone at Mount Waliguan in western China. Geophys. Res. Lett. 2006, 33, L03803. [Google Scholar] [CrossRef] [Green Version]
  72. Velasco, E.; Márquez, C.; Bueno, E.; Bernabé, R.M.; Sánchez, A.; Fentanes, O.; Wöhrnschimmel, H.; Cárdenas, B.; Kamilla, A.; Wakamatsu, S.; et al. Vertical distribution of ozone and VOCs in the low boundary layer of Mexico City. Atmos. Chem. Phys. 2008, 8, 3061–3079. [Google Scholar] [CrossRef]
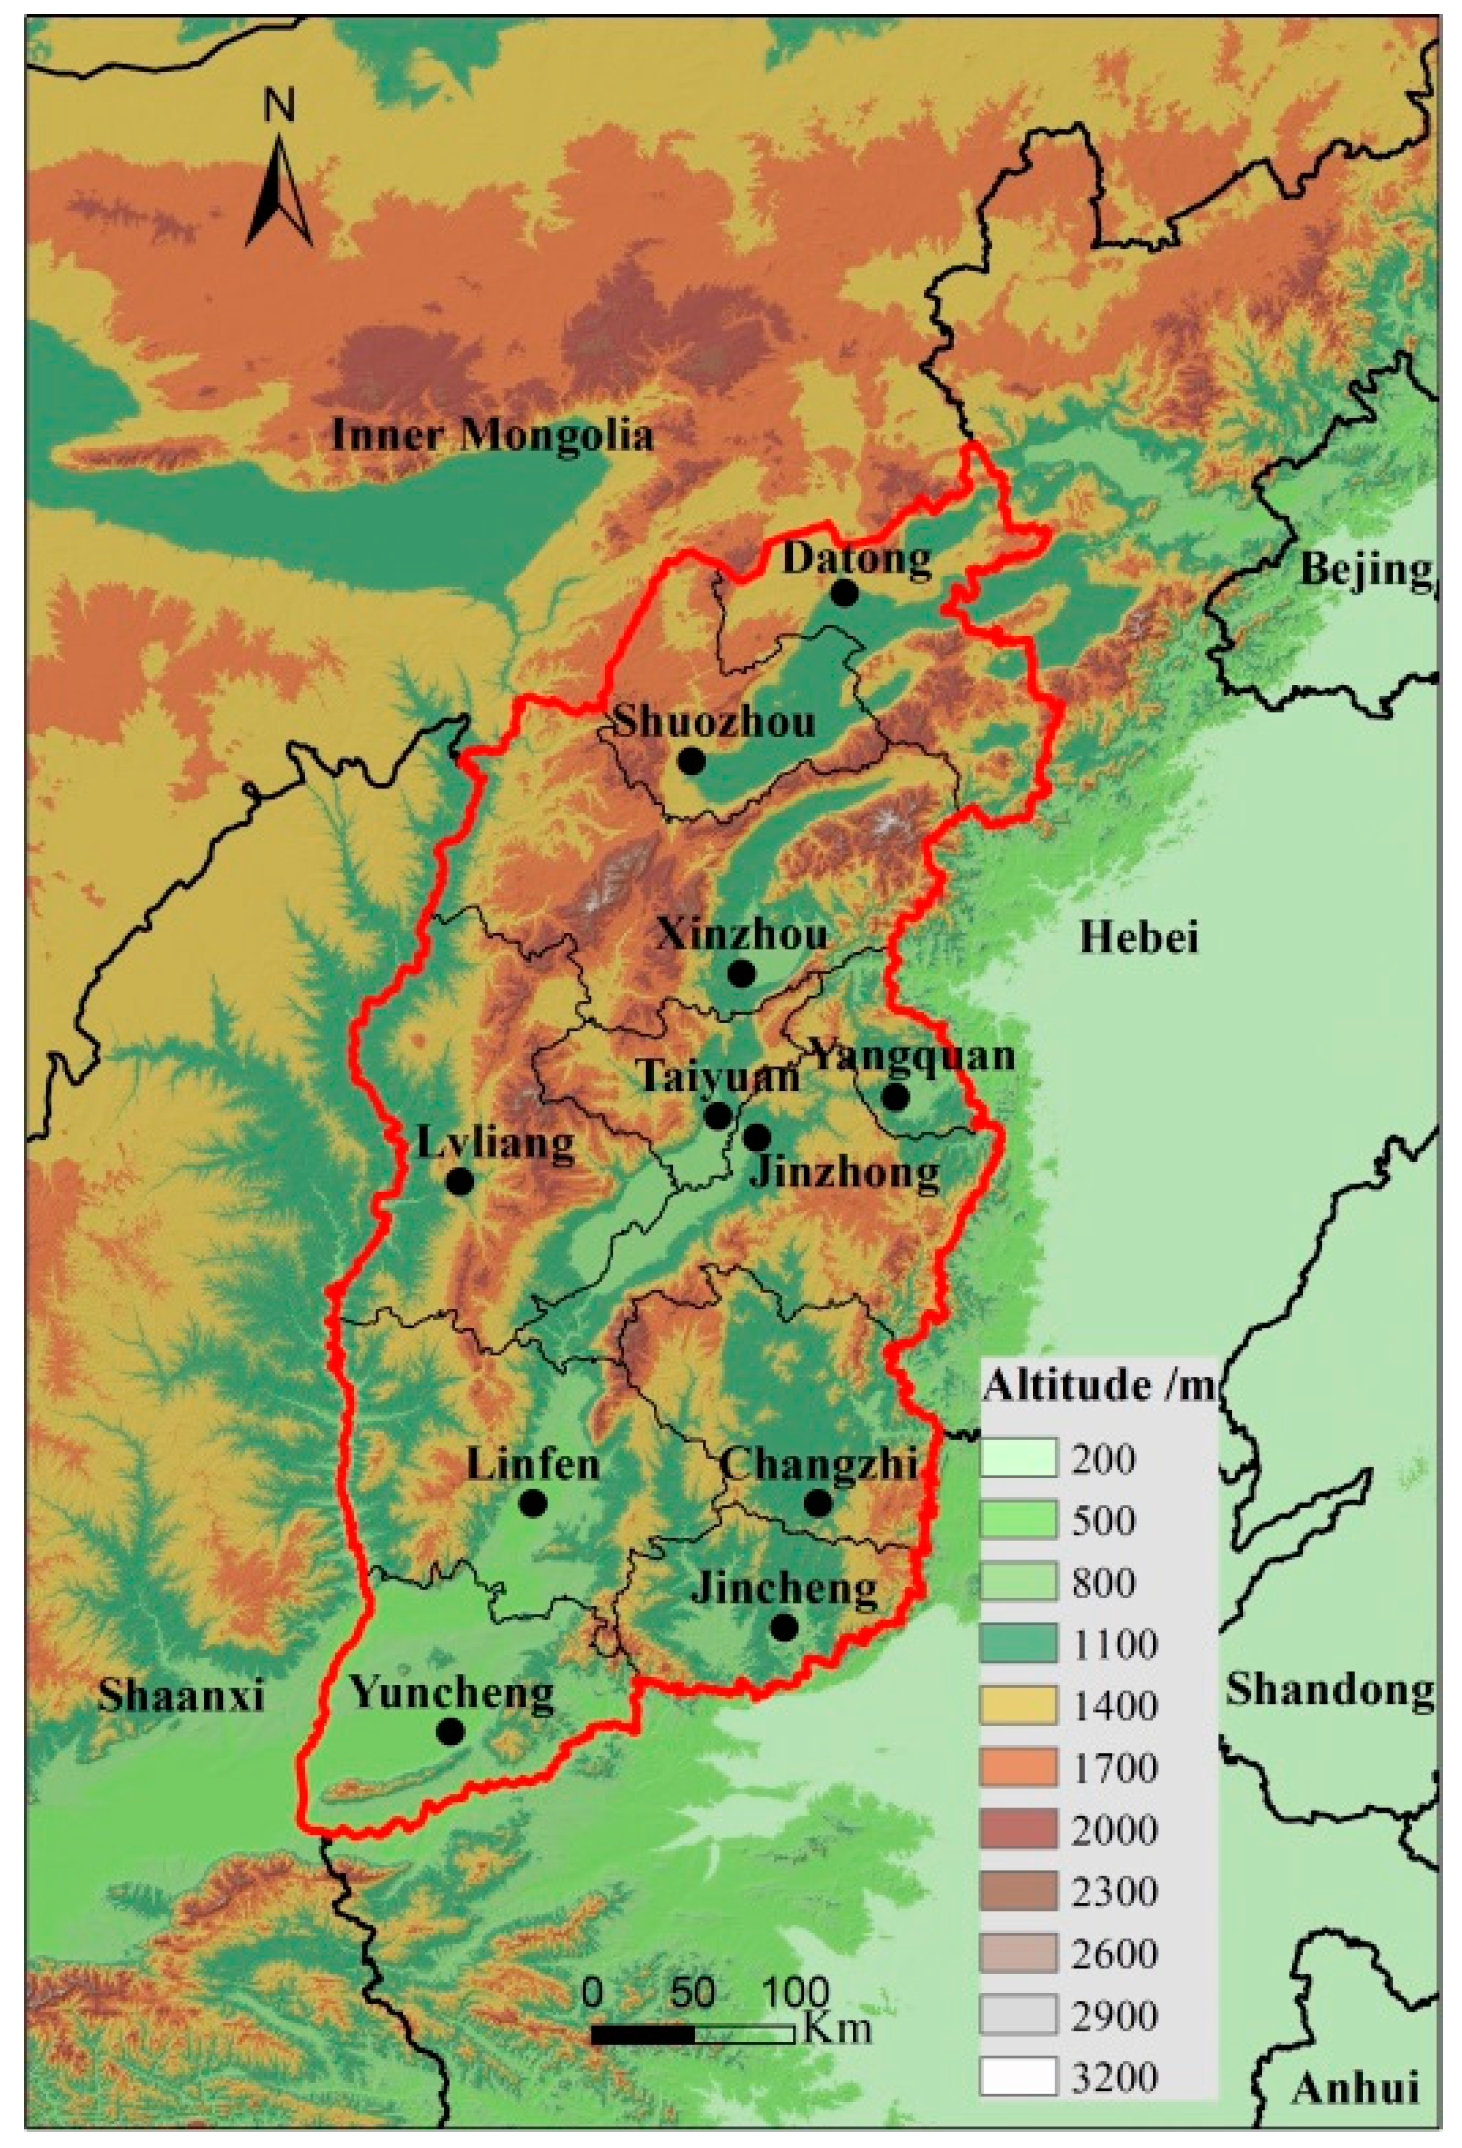
Figure 1. Topography and administrative division distribution of Shanxi Province, China.
Atmosphere 13 01729 g001
Figure 2. The variation in the proportion of nonattainment days of six primary pollutants in 11 cities in Shanxi Province from 2015 to 2020.
Atmosphere 13 01729 g002
Figure 3. The 90th percentiles of MDA8 O3 concentration in 11 cities of Shanxi Province from 2015 to 2020. The red dotted line indicates the annual MDA8 O3 concentration that exceeds the standard.
Atmosphere 13 01729 g003
Figure 4. Variations of monthly mean O3 mass concentration and cumulative nonattainment days of Shanxi Province during 2015–2020.
Atmosphere 13 01729 g004
Figure 5. Percentile variation of annual MDA8 O3 in Shanxi Province during 2015–2020.
Atmosphere 13 01729 g005
Figure 6. The spatial distribution of annual mean O3 mass concentrations (a), MDA8 O3 nonattainment days (b) in 11 cities of Shanxi Province during 2015–2020.
Atmosphere 13 01729 g006
Figure 7. The daily variation of mean hourly surface O3 mass concentration in the entire year (a) and the period from May to August (b) in 11 cities of Shanxi Province during 2015–2020.
Atmosphere 13 01729 g007
Figure 8. Average O3 mass concentration and MDA8 O3 nonattainment frequency (NF) in different temperature ranges, Tave (a) and Tmax (b).
Atmosphere 13 01729 g008
Figure 9. The scatter plot and fitted curve between daily mean O3 mass concentrations and daily average temperatures (a), and the scatter plots and fitted curves between O3 mass concentrations and daytime temperatures (b), nighttime temperatures (c) under different relative humidity (RH, %).
Atmosphere 13 01729 g009
Figure 10. Variations in the total days (a), mean O3 mass concentration (b) and MDA8 O3 nonattainment frequency (NF), (c) corresponding to different relative humidity ranges in each season and year.
Atmosphere 13 01729 g010
Figure 11. The scatter plot and fitted curve between different sunshine durations and daily mean O3 mass concentrations. Red line: linear fitting curve of daily average O3 mass concentration under different sunshine hours; Gray shaded area: standard deviation; Black points: average O3 under different sunshine hours; Color points: daily average O3 mass concentration under different sunshine hours of each season.
Atmosphere 13 01729 g011
Figure 12. Distributions of O3 mass concentration at different wind directions, wind speeds and wind frequencies in 11 cities of Shanxi Province during the time period from May to August.
Atmosphere 13 01729 g012
Figure 13. The Taylor diagrams between each meteorological factor and O3. (a): annual mean value of each meteorological factor and O3 mass concentration; (b): annual mean value of each meteorological factor and MDA8 O3; (c): mean value of each meteorological factor and O3 mass concentration from May to August; (d): mean value of each meteorological factor and MDA8 O3 from May to August. The black circles indicate negative correlation coefficients.
Atmosphere 13 01729 g013aAtmosphere 13 01729 g013b
Figure 14. Comparison of annual mean O3 vertical profiles from AIRS (blue line) and OMI (red line) over Datong, Taiyuan, Linfen and Changzhi. The solid lines represent annual mean O3 volume mixing ratio (VMR), and the error bars plot the standard deviation. The solid triangles show annual mean surface O3 VMR.
Atmosphere 13 01729 g014
Figure 15. Seasonal mean O3 volume mixing rate vertical profiles from AIRS (solid line), OMI (dotted line) and surface O3 VMR (solid triangle) in Datong, Taiyuan, Linfen and Changzhi. (a):below 100 hPa;(b): below 500 hPa.
Atmosphere 13 01729 g015
Figure 16. O3 VMR vertical profiles from AIRS at 13:00 BJT (Beijing time) on June 1, 2017. The triangle points present the surface O3 values from ground monitoring stations, and the solid lines show O3 VMR in the four typical cities.
Atmosphere 13 01729 g016
Table 1. Altitudes of the 11 main cities in Shanxi Province (which refer to the meteorological observation stations in the urban areas).
CityDa
tong
Shuo-
zhou
Xin
zhou
Lv-
liang
Tai-
yuan
Jin-
zhong
Yang-
quan
Lin-
fen
Chang-
zhi
Jin-
cheng
Yun-
cheng
Altitude/m 1052.61114.8869.9950.8776.3831.2767.2449.51046.9752.6375.0
Table 2. Comparisons of O3 concentration and primary meteorological factors observed at various sites.
Sampling SitesO3 Time
Period
Primary Meteorological Factors
Shanxi Province, China (This work)170 μg·m−3, 90th-MDA82020Temperature, relatively humidity, wind, sunshine duration
337 cities, China138 μg·m−3, 90th-MDA8 [36]2020 Temperature,
relatively humidity [22]
Beijing–Tianjin–Hebei Region, China180 μg·m−3, 90th-MDA8 [36]2020 Temperature, relatively humidity, sunshine duration [62]
Yangtze River Delta, China152 μg·m−3, 90th-MDA8 [36]2020Relatively humidity, temperature, sunshine duration, wind [24]
Fen-Wei plain,
China
161 μg·m−3, 90th-MDA8 [36]2020Temperature, relatively humidity, wind, pressure [63]
756 sites, Eastern North, America~51 ppb, MDA8 [64]2014Temperature, relatively humidity, wind [27]
1007 sites, Europe~50 ppb, MDA8 [64]2014Temperature, wind [14]
Publisher’s Note: MDPI stays neutral with regard to jurisdictional claims in published maps and institutional affiliations.

