


Atmospheric Ultrafine Particulate Matter (PM0.1)-Bound Carbon Composition in Bangkok, Thailand

 ,
,
Abstract
:
1. Introduction
2. Methodology
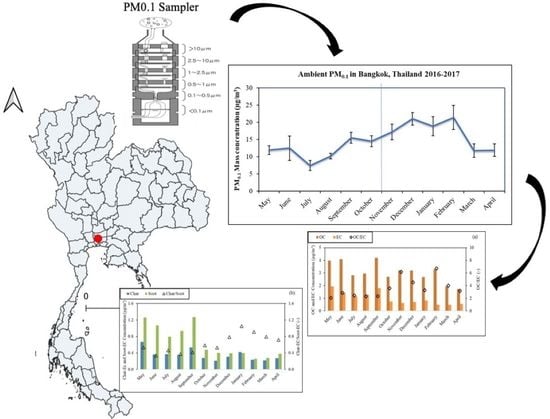
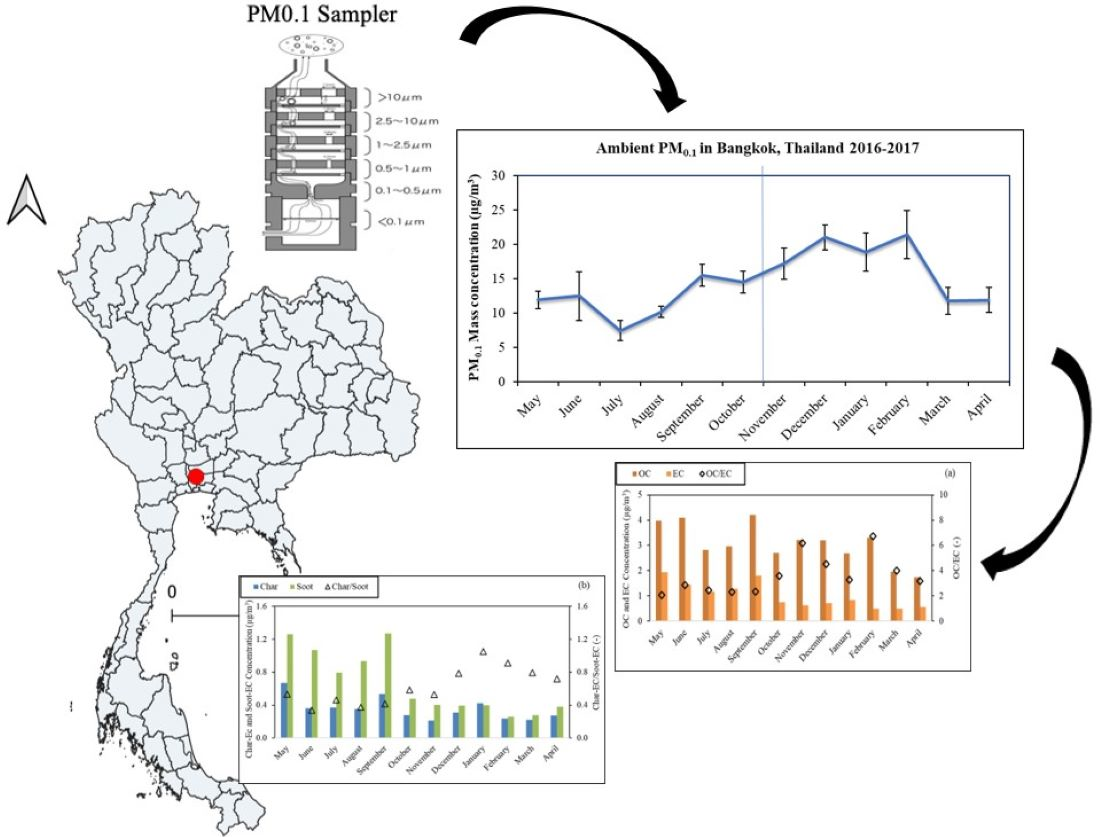
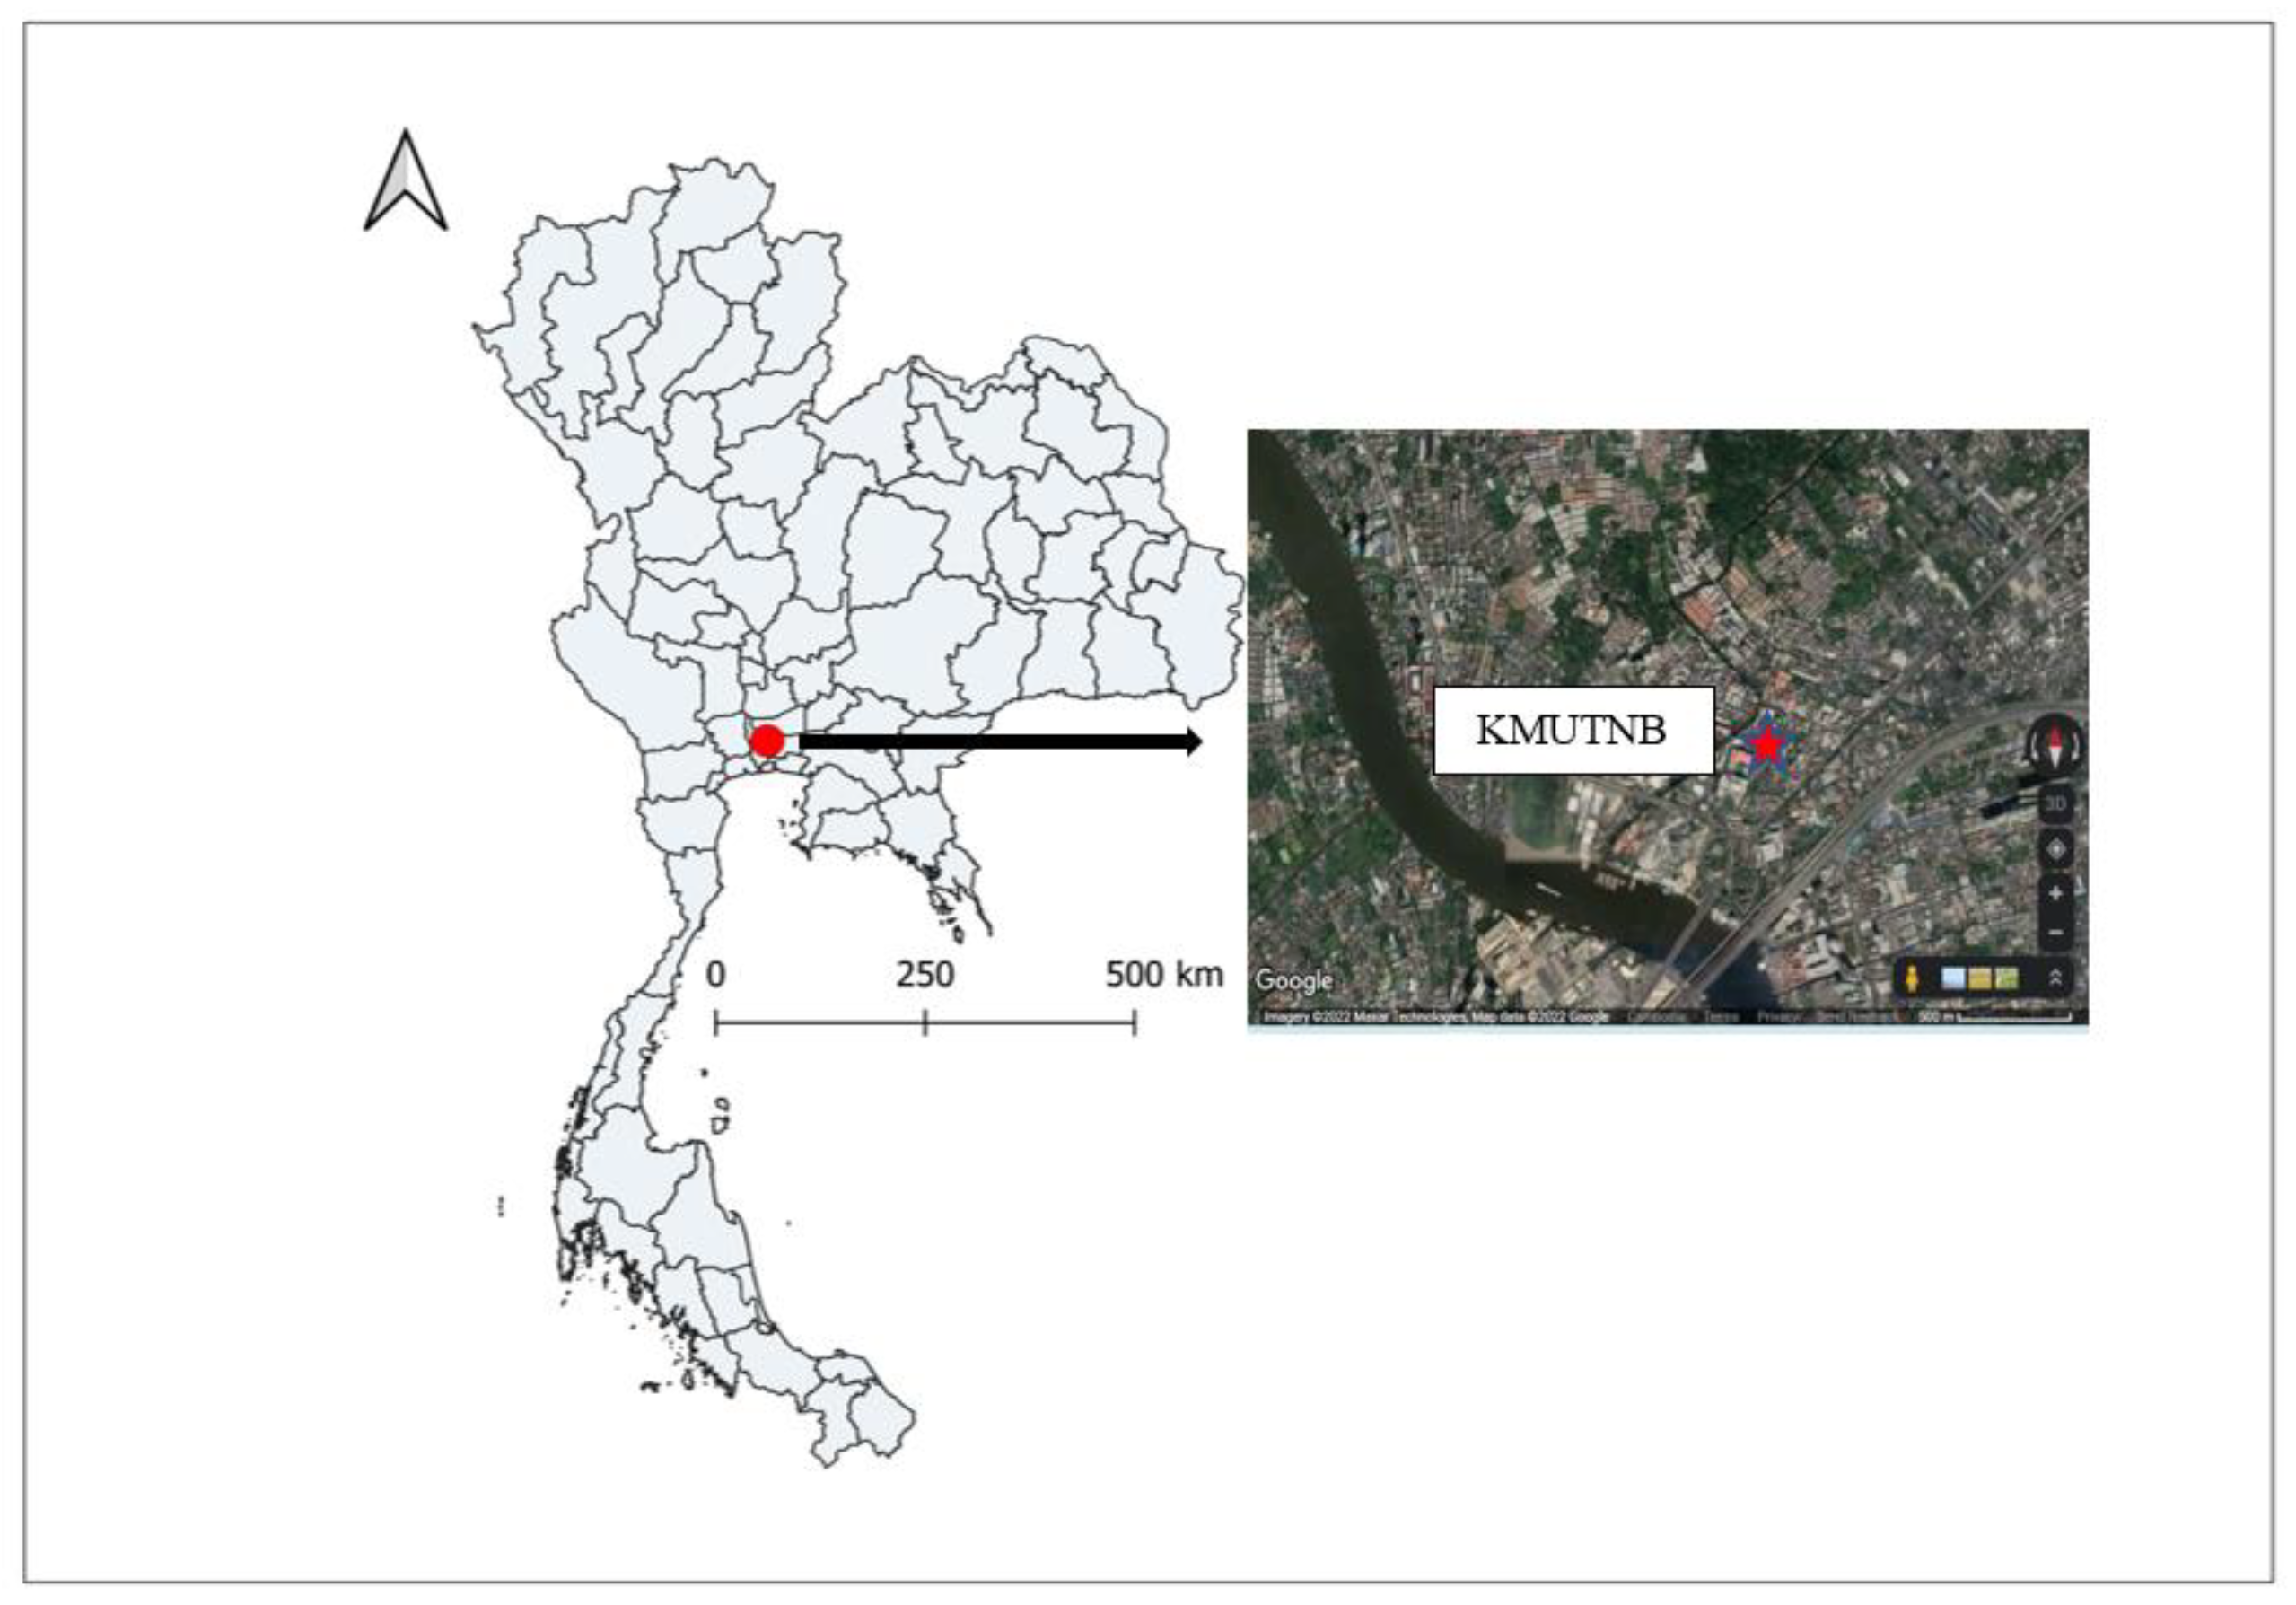
2.1. Sampling Site
2.2. Cascade Sampler for Ambient PM0.1
2.3. Thermal-Optical Carbon Analysis
2.4. Estimation of Climate Effect
2.5. Quality Assurance/Quality Control (QA/QC)
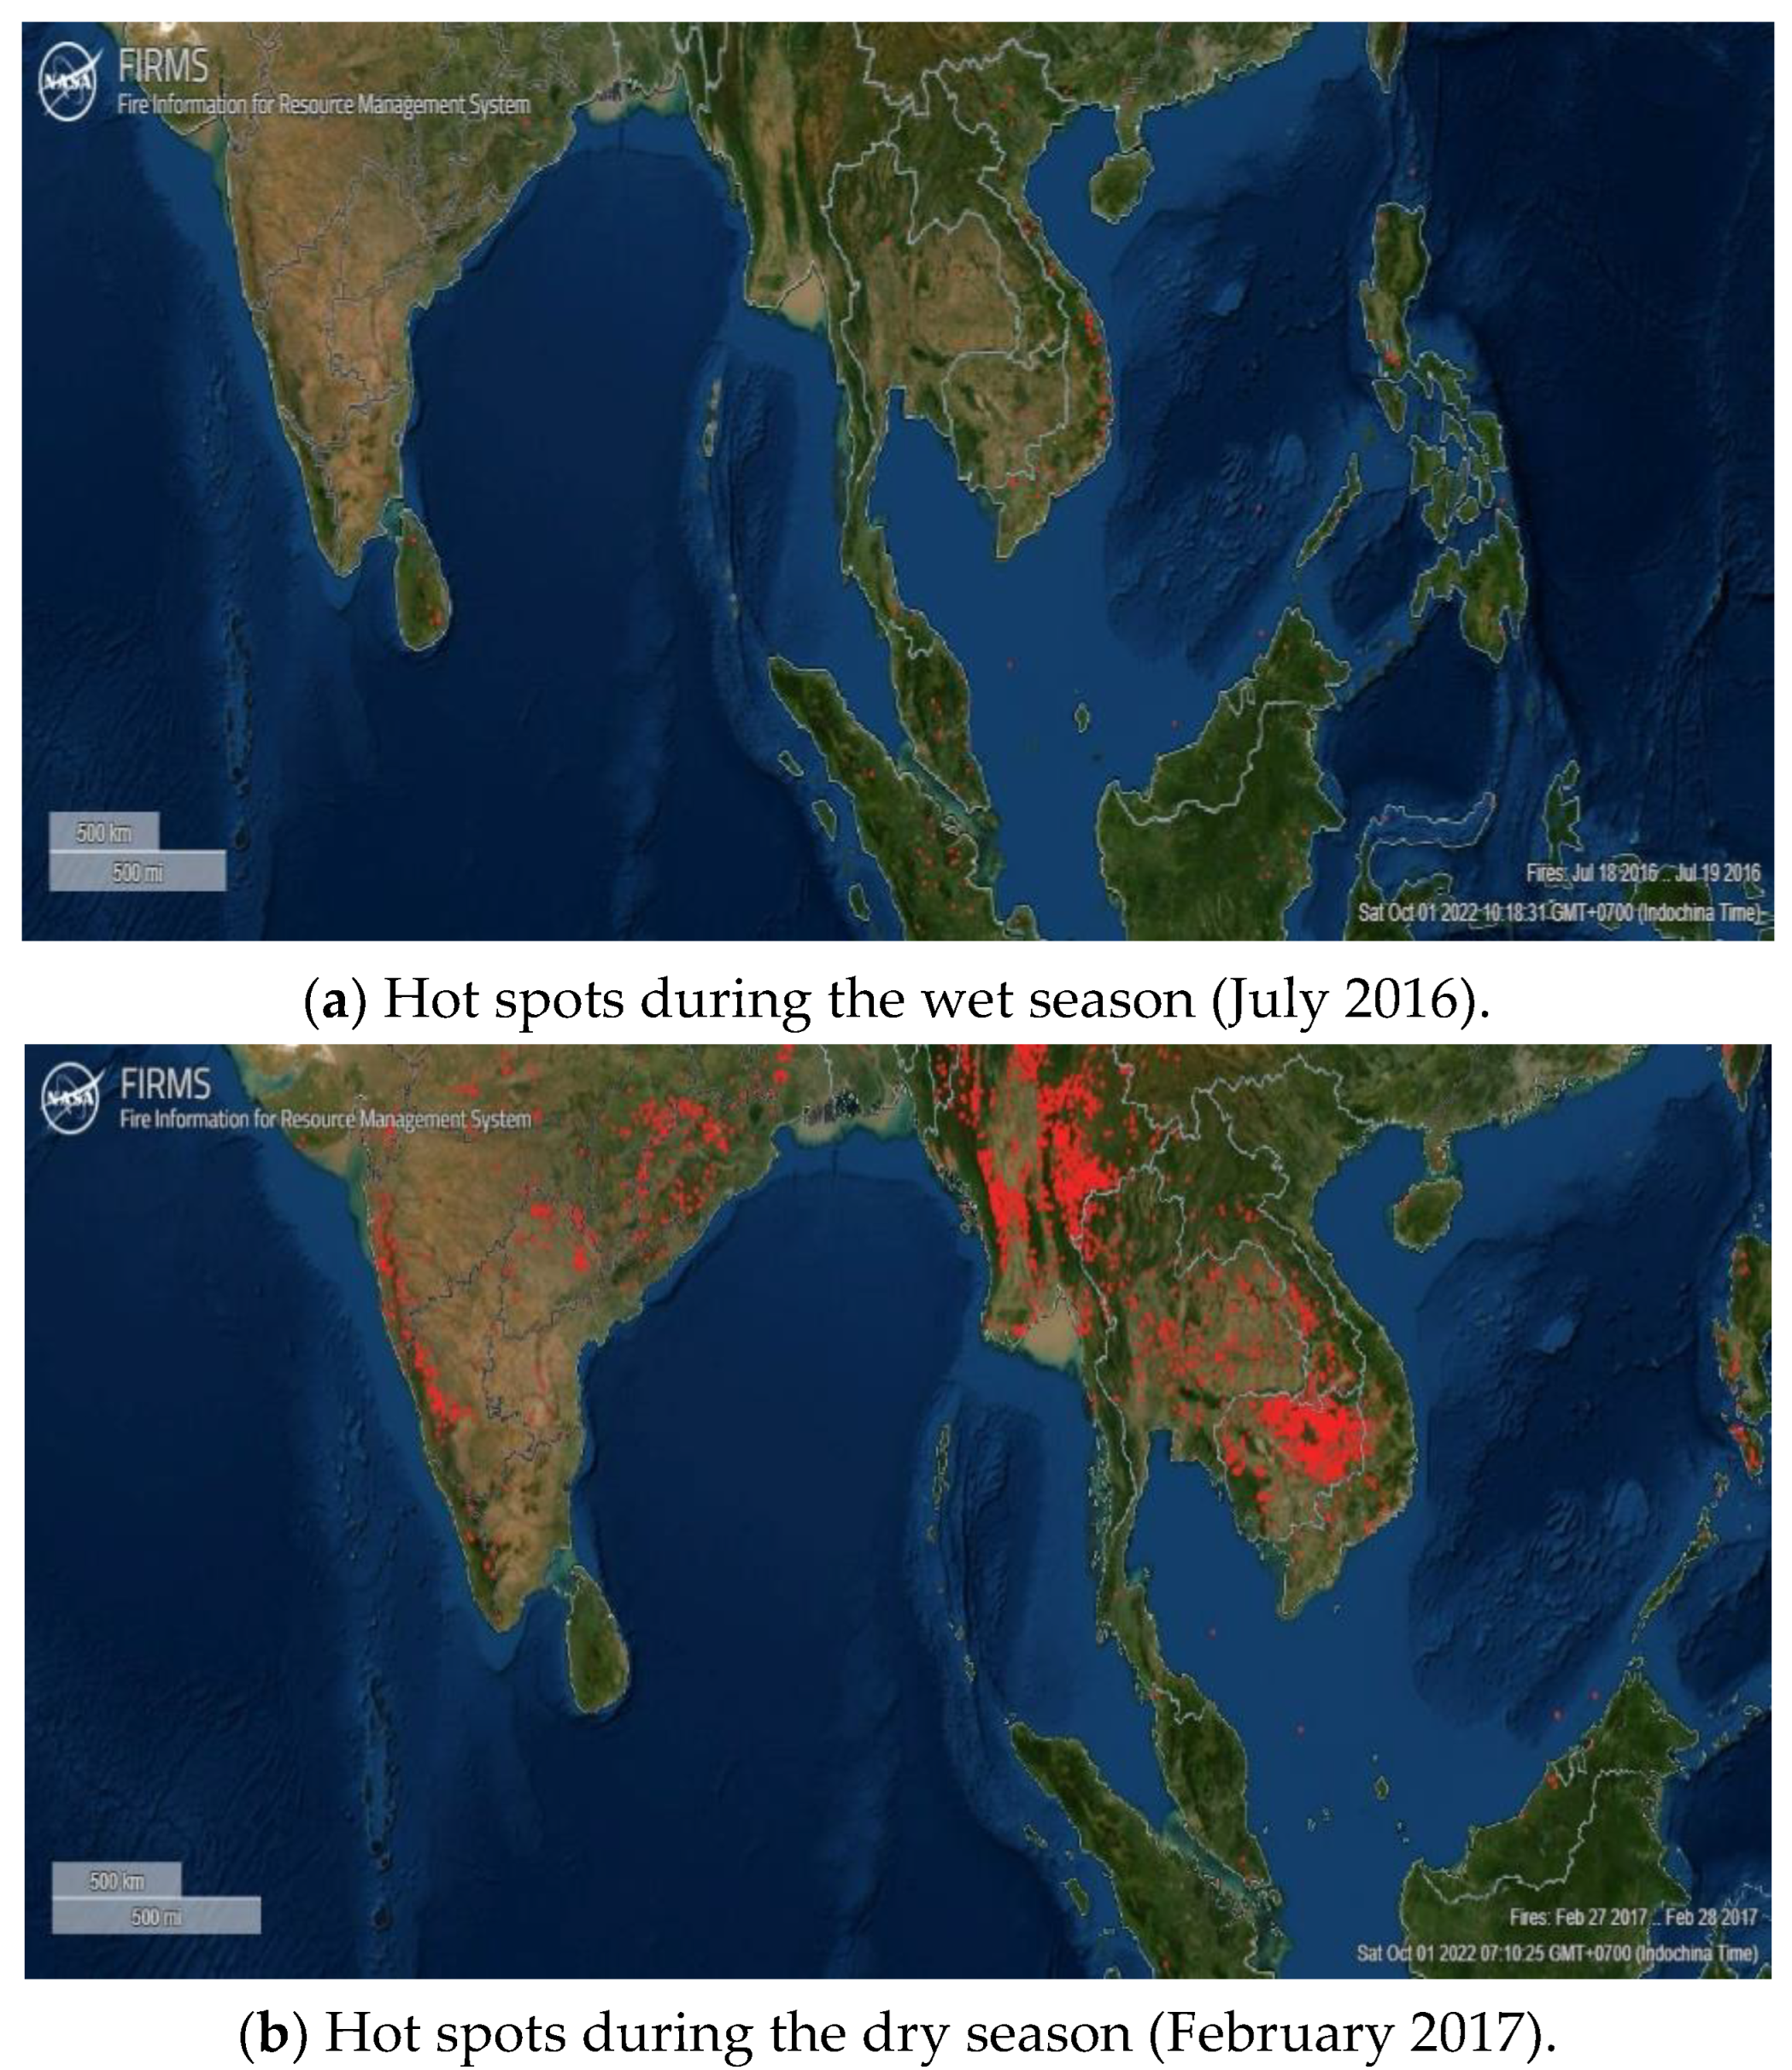
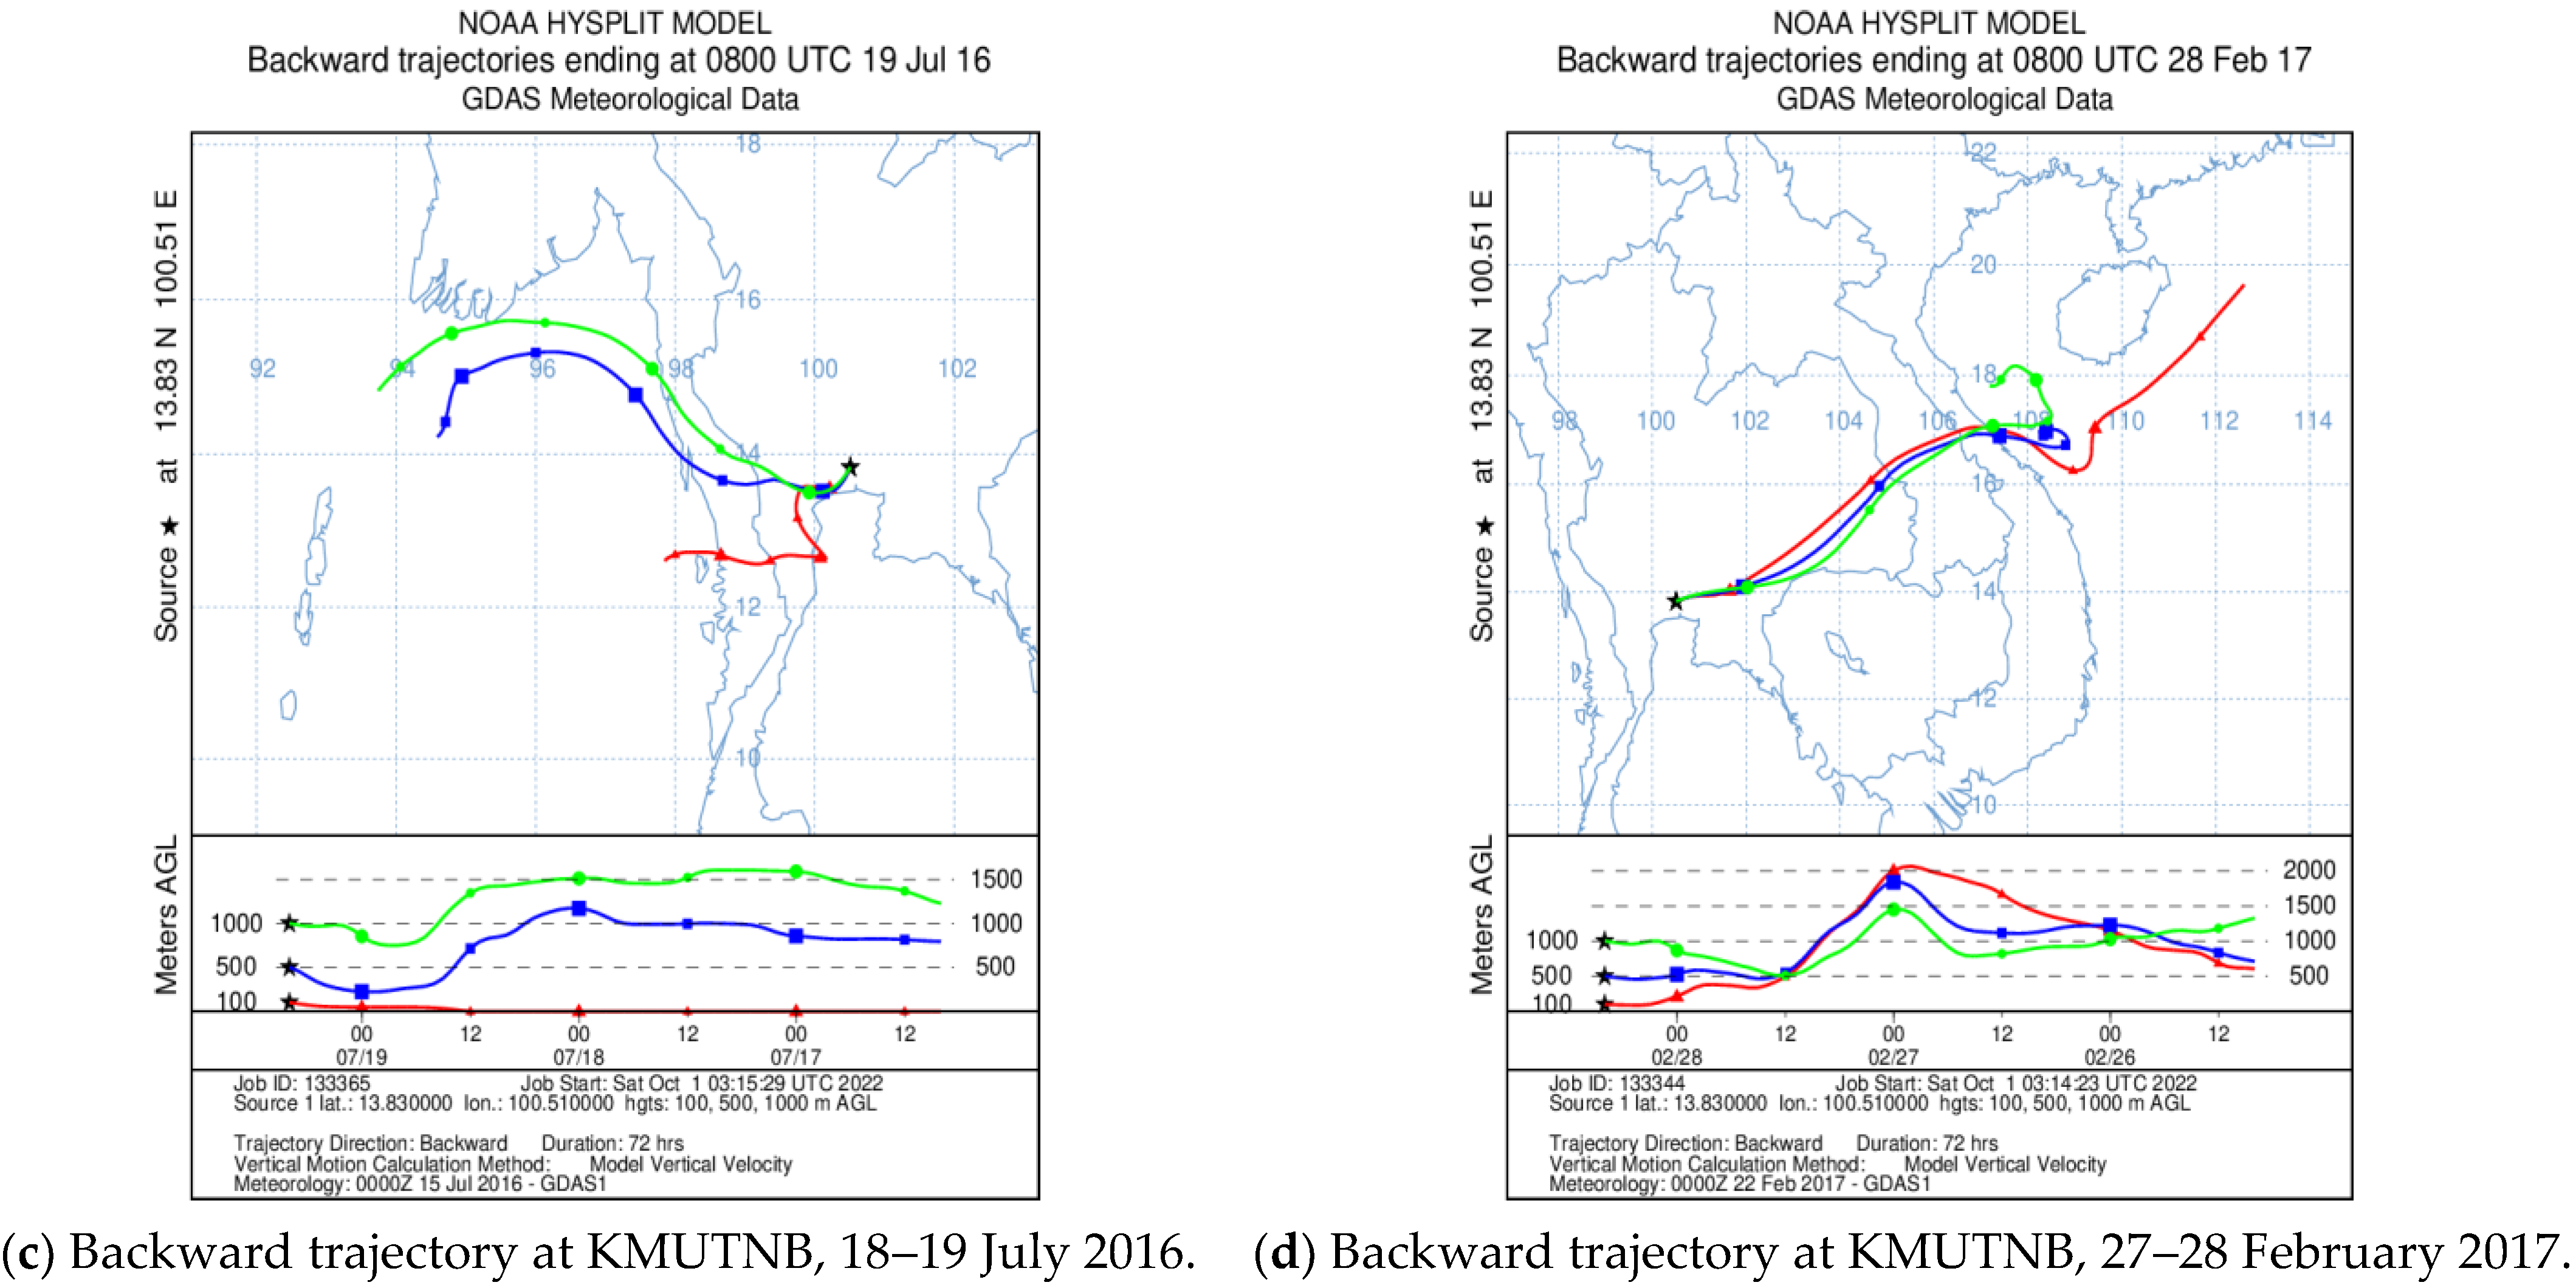
2.6. Hot Spots and Backward Trajectories
3. Results and Discussion
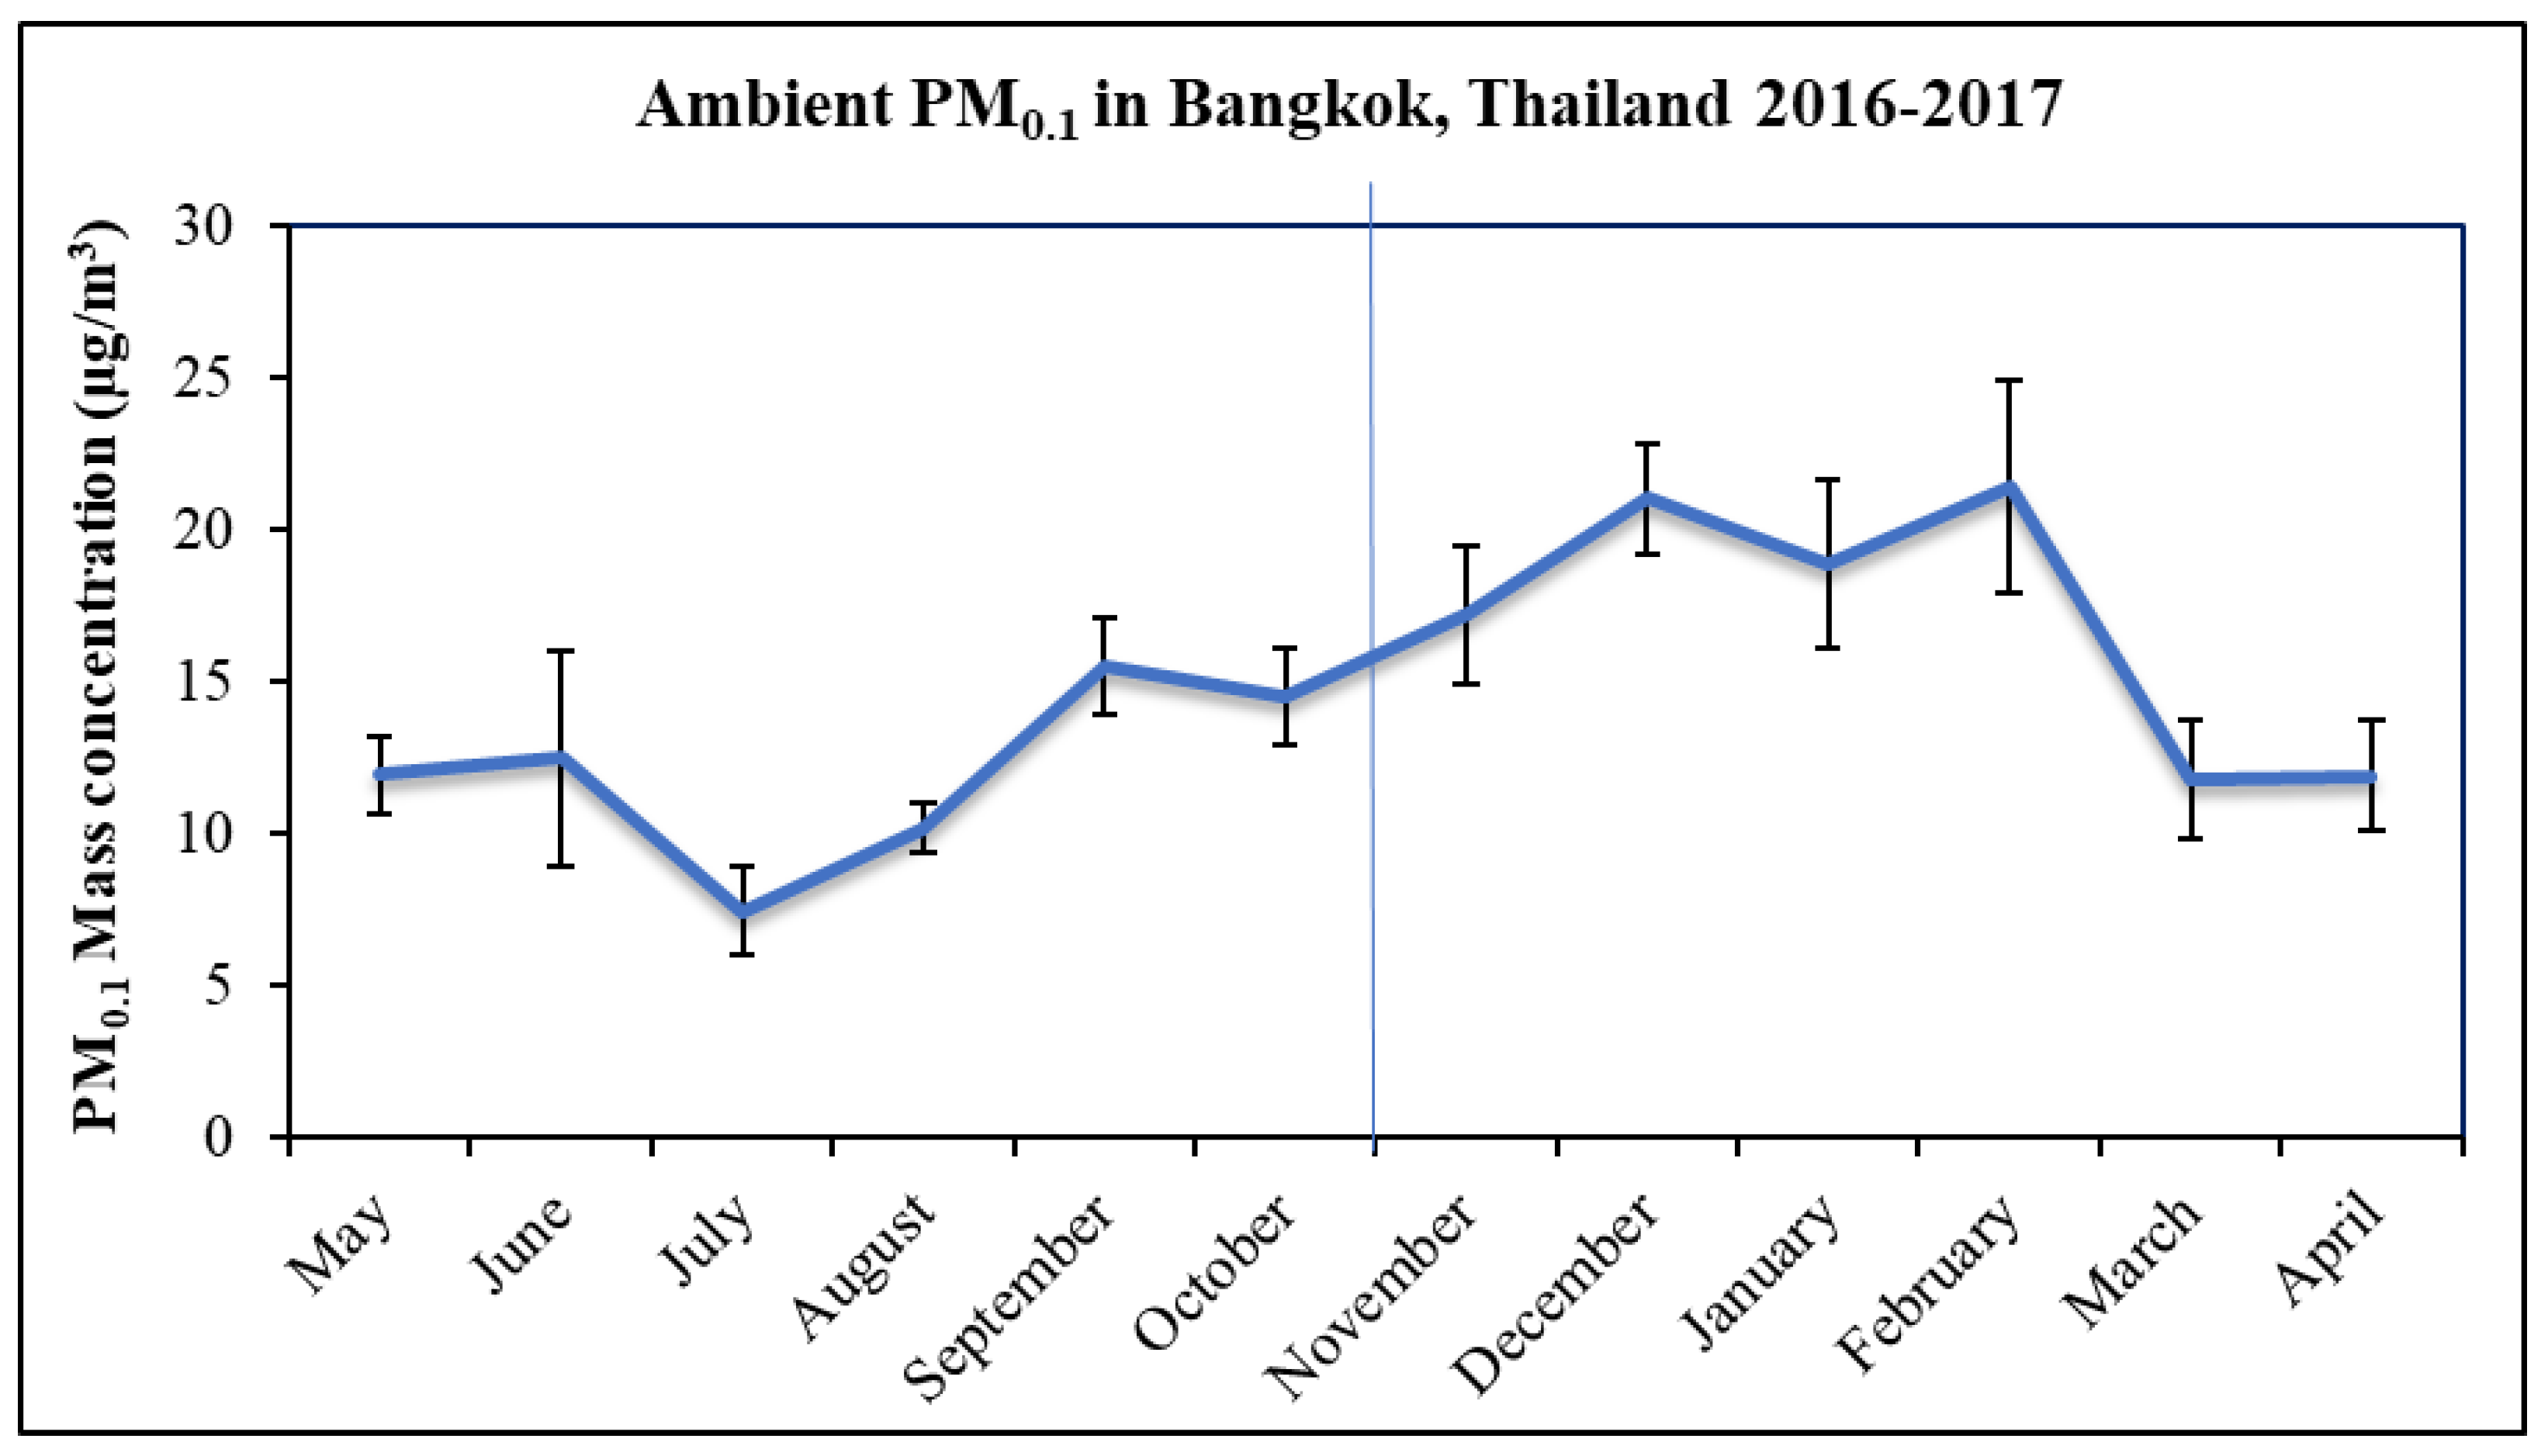
3.1. PM0.1 Mass Concentrations
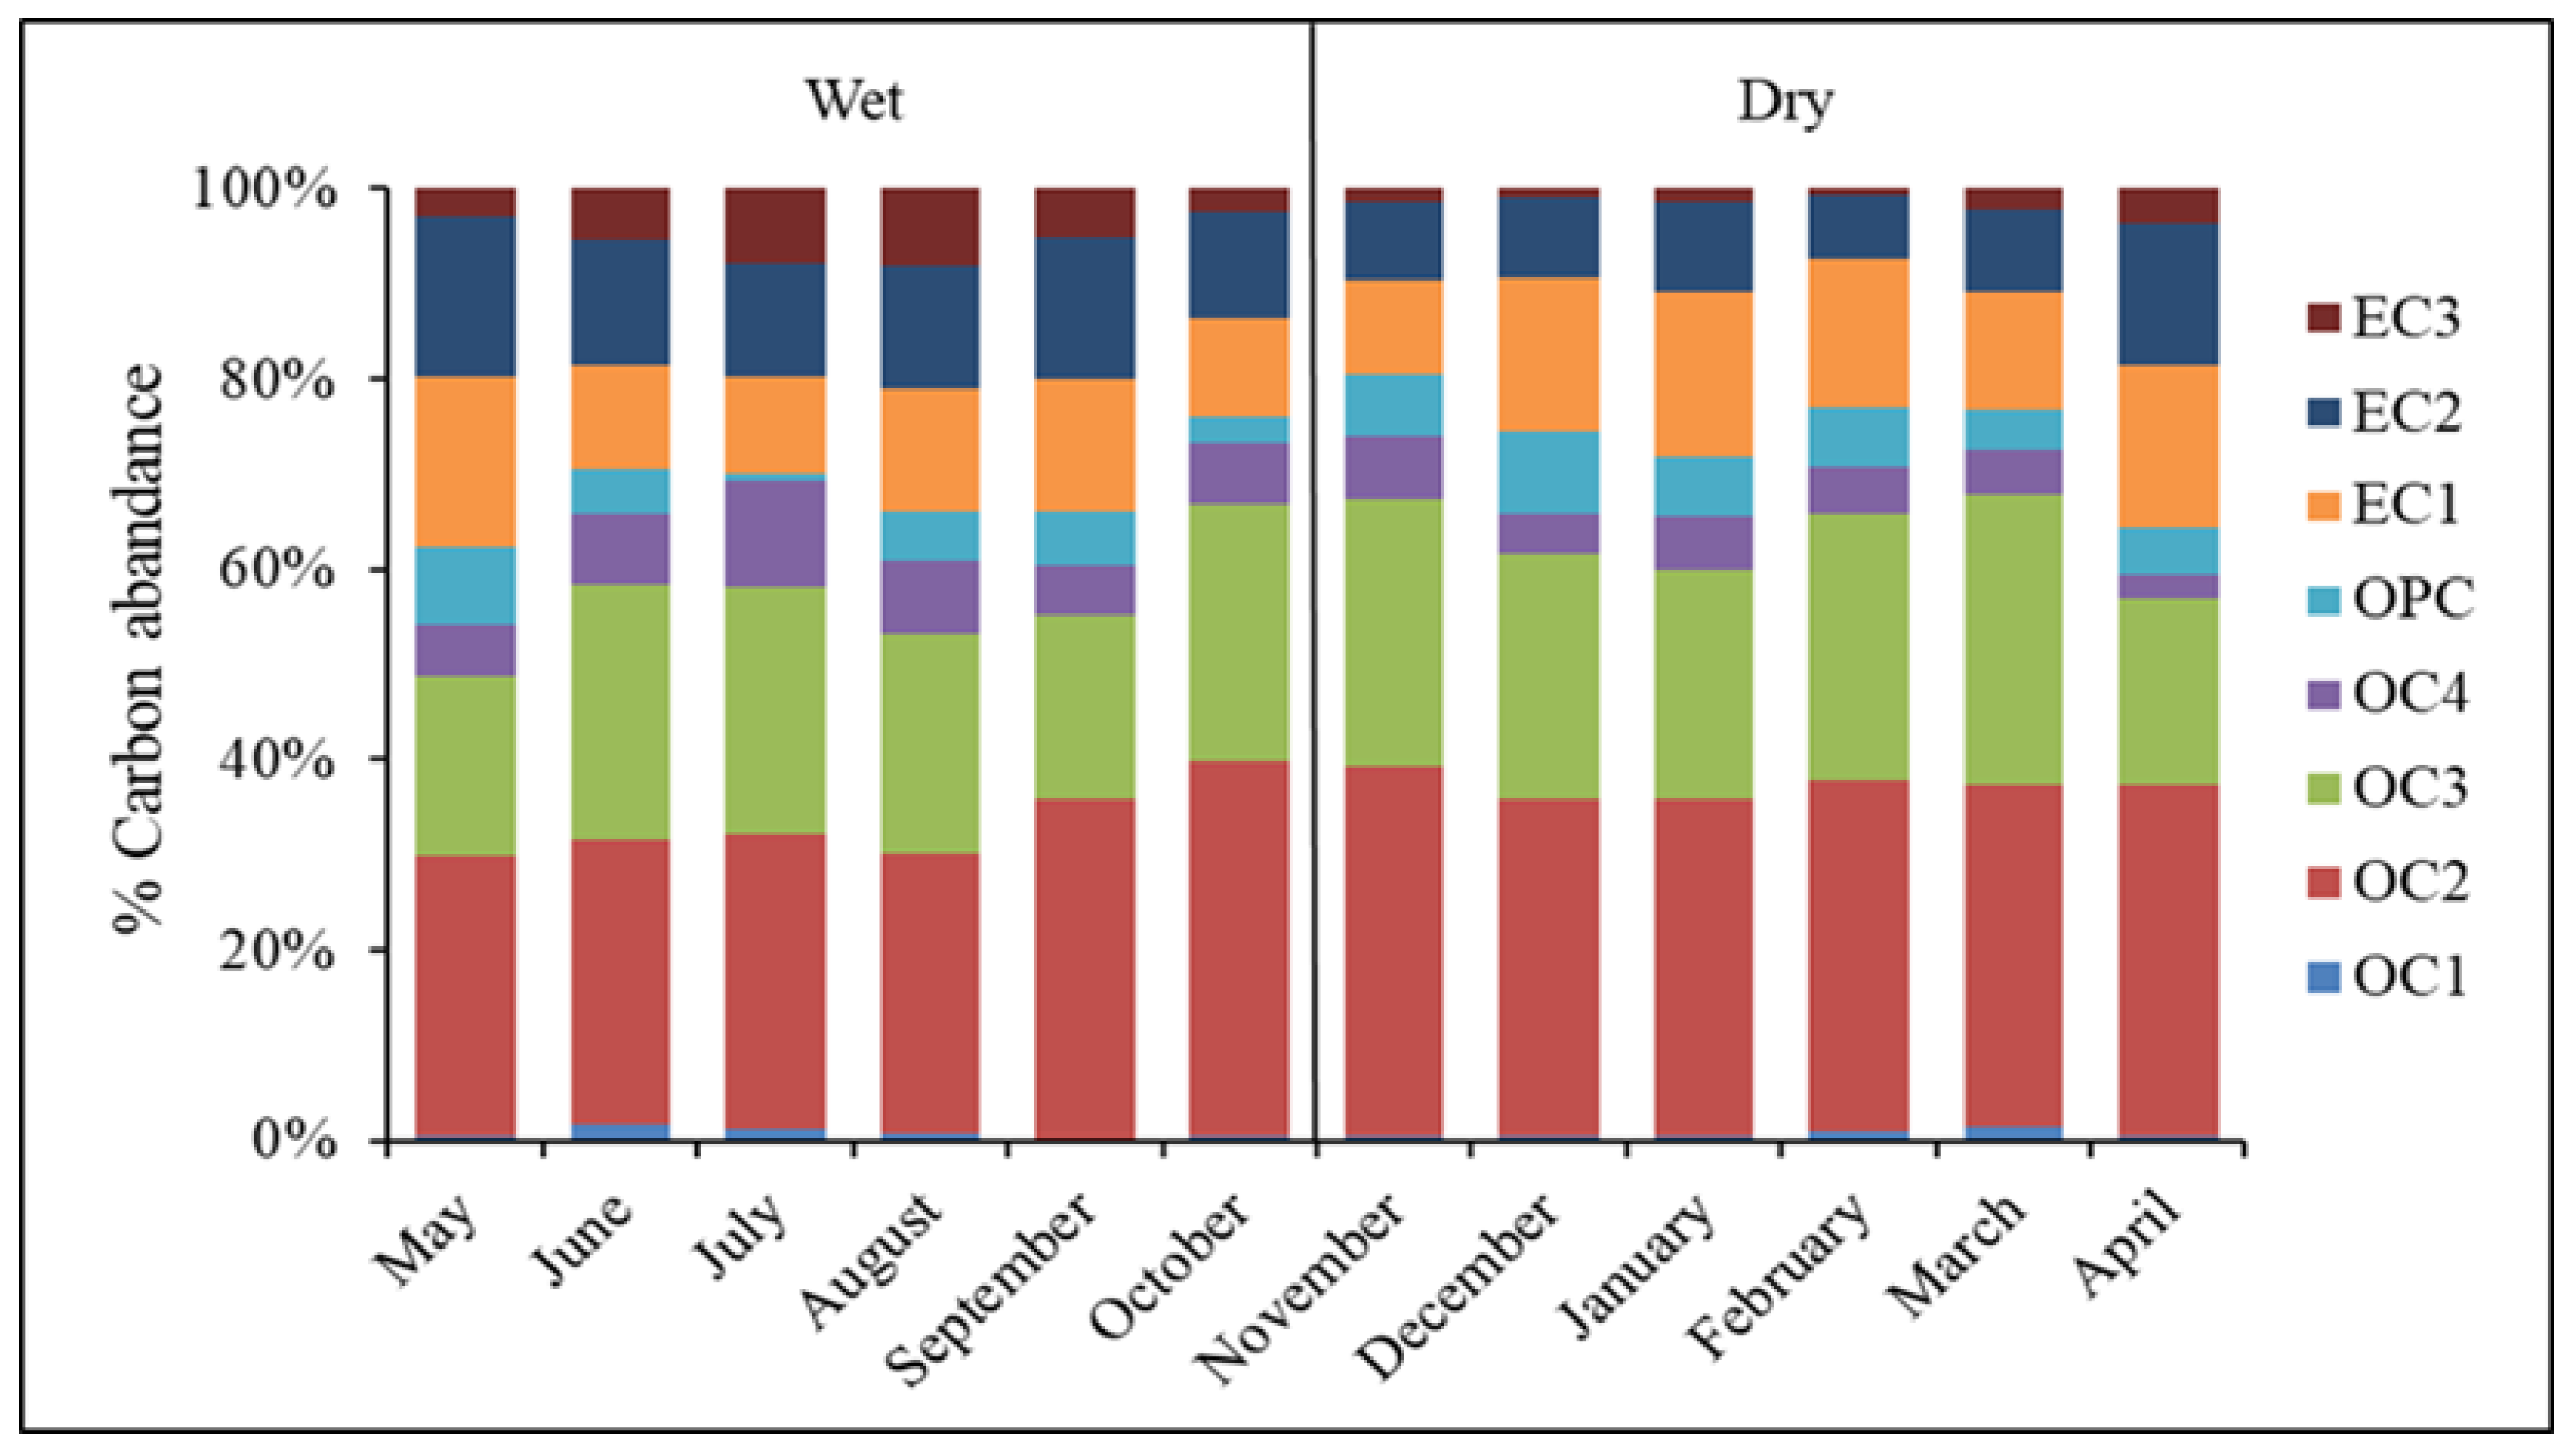
3.2. The Analysis of Eight Carbon Fractions of PM0.1
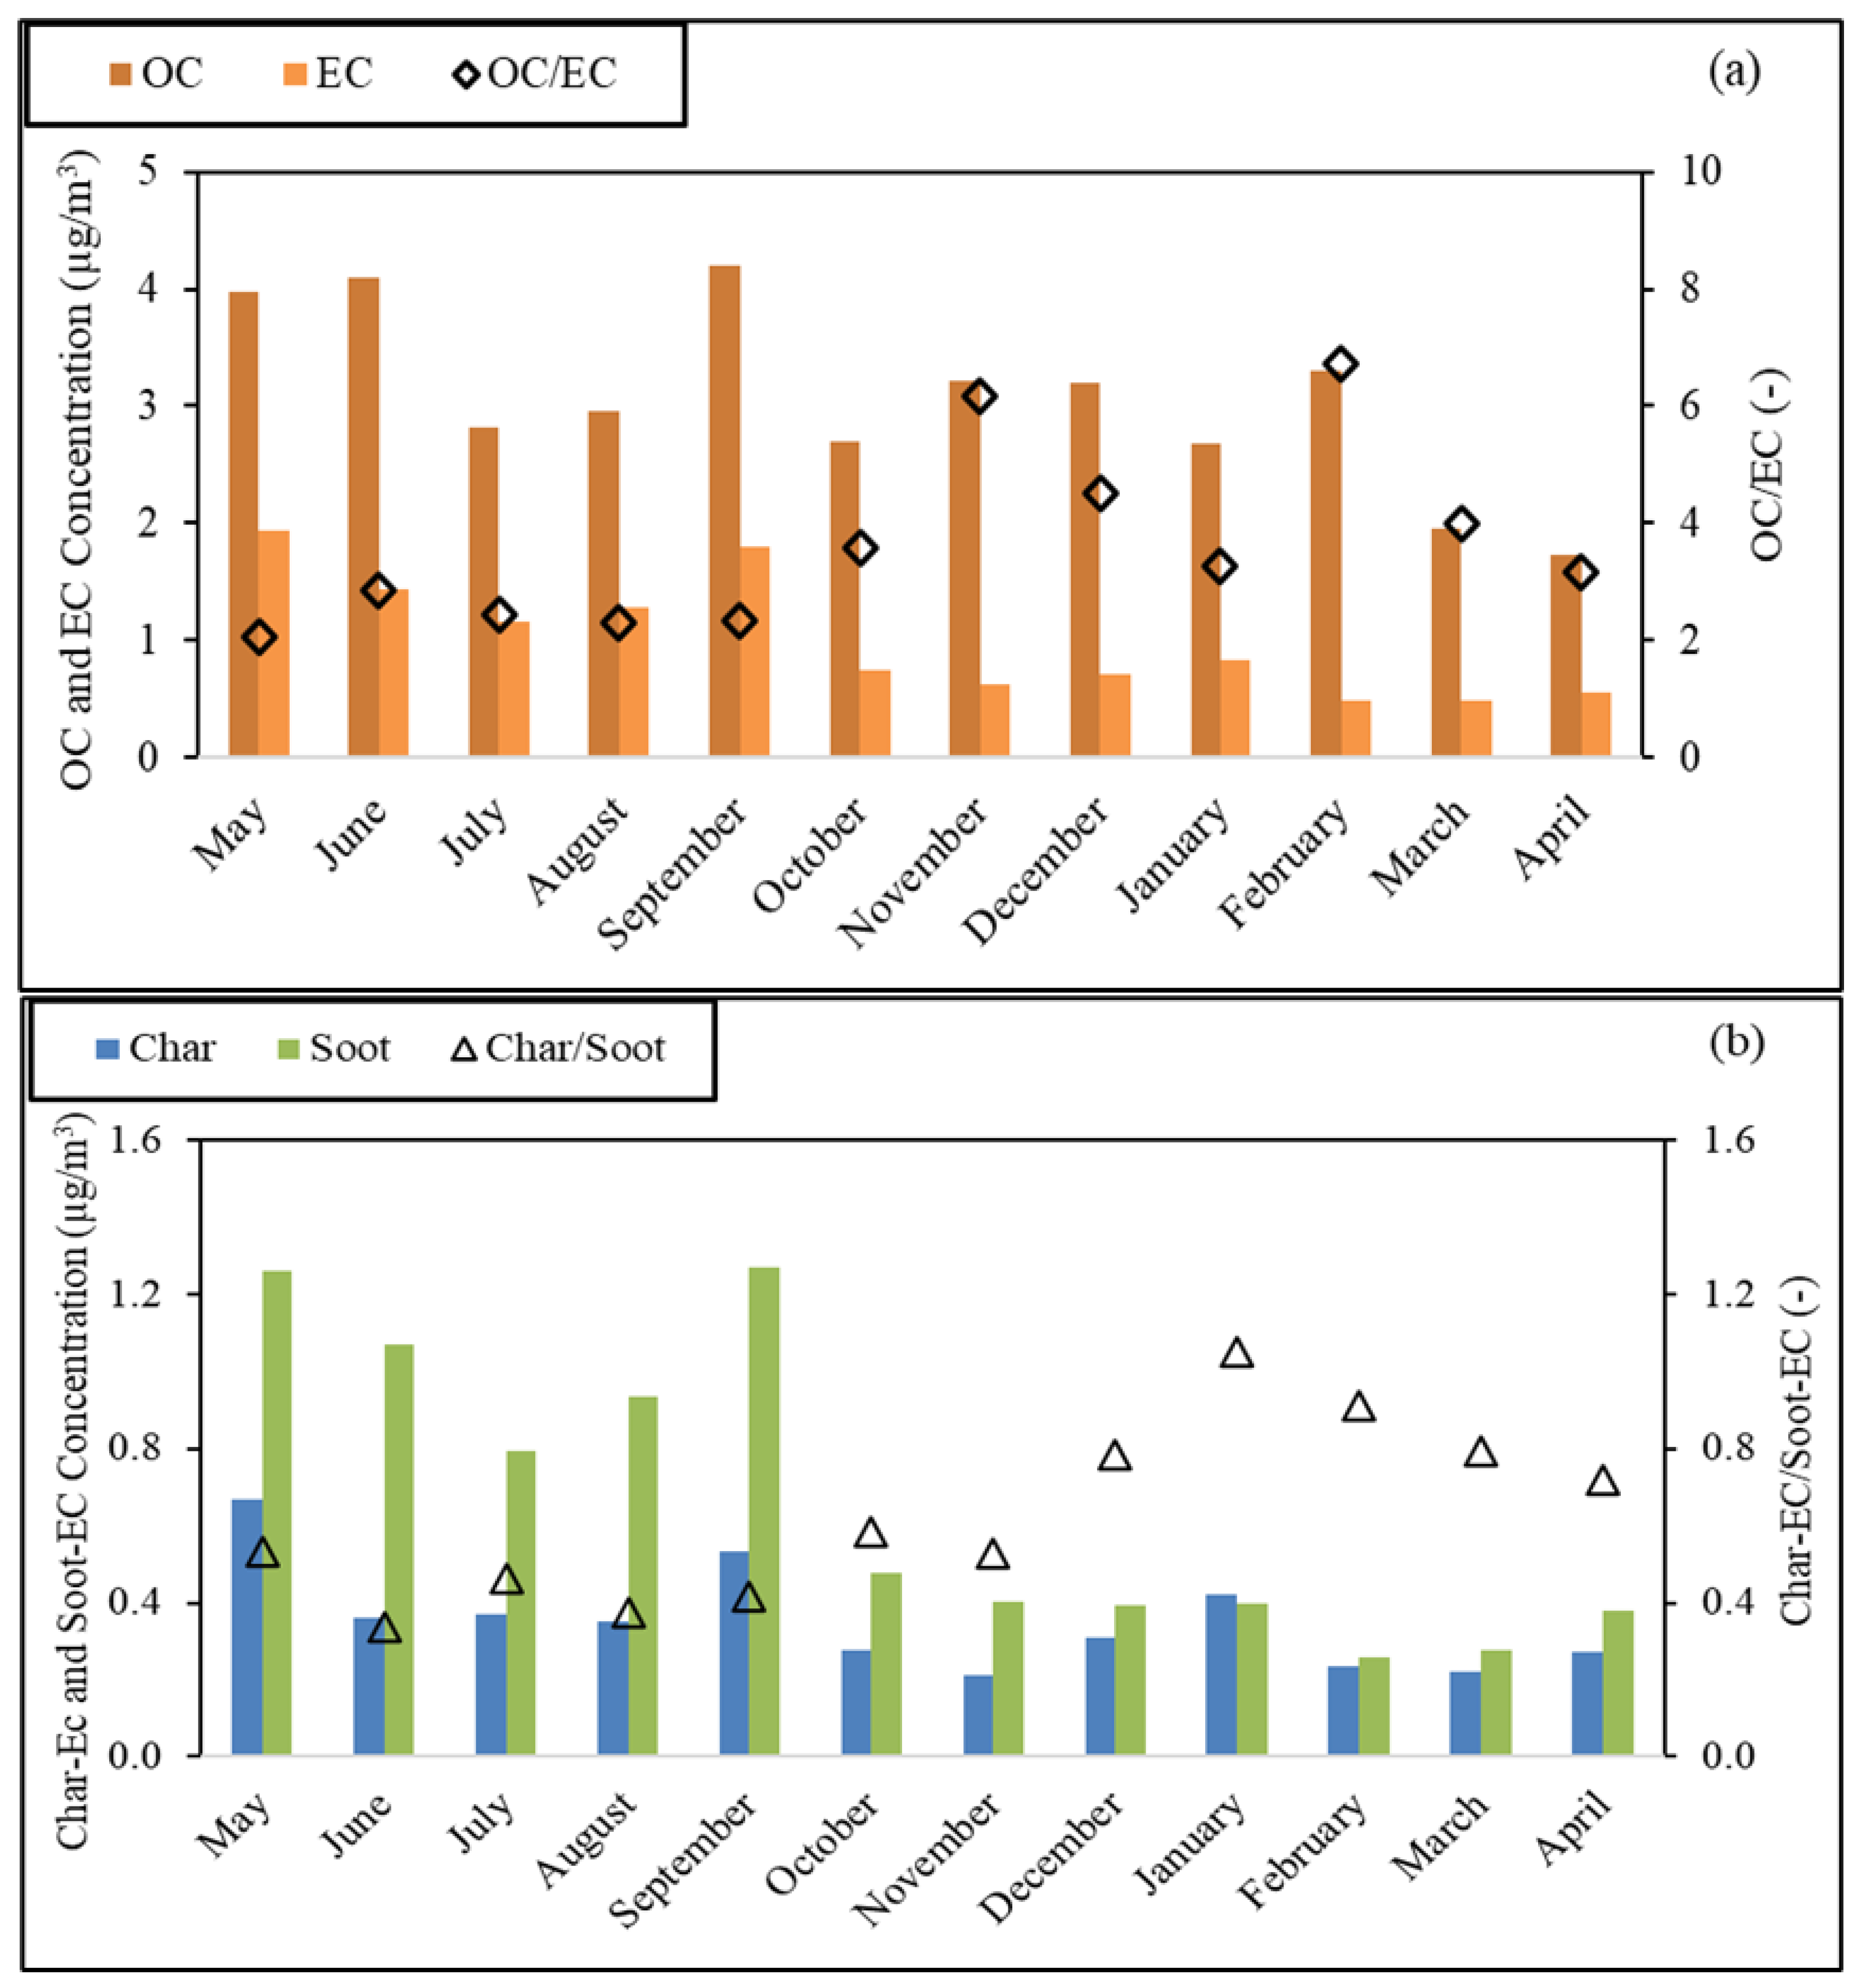
3.3. Carbon Characteristics
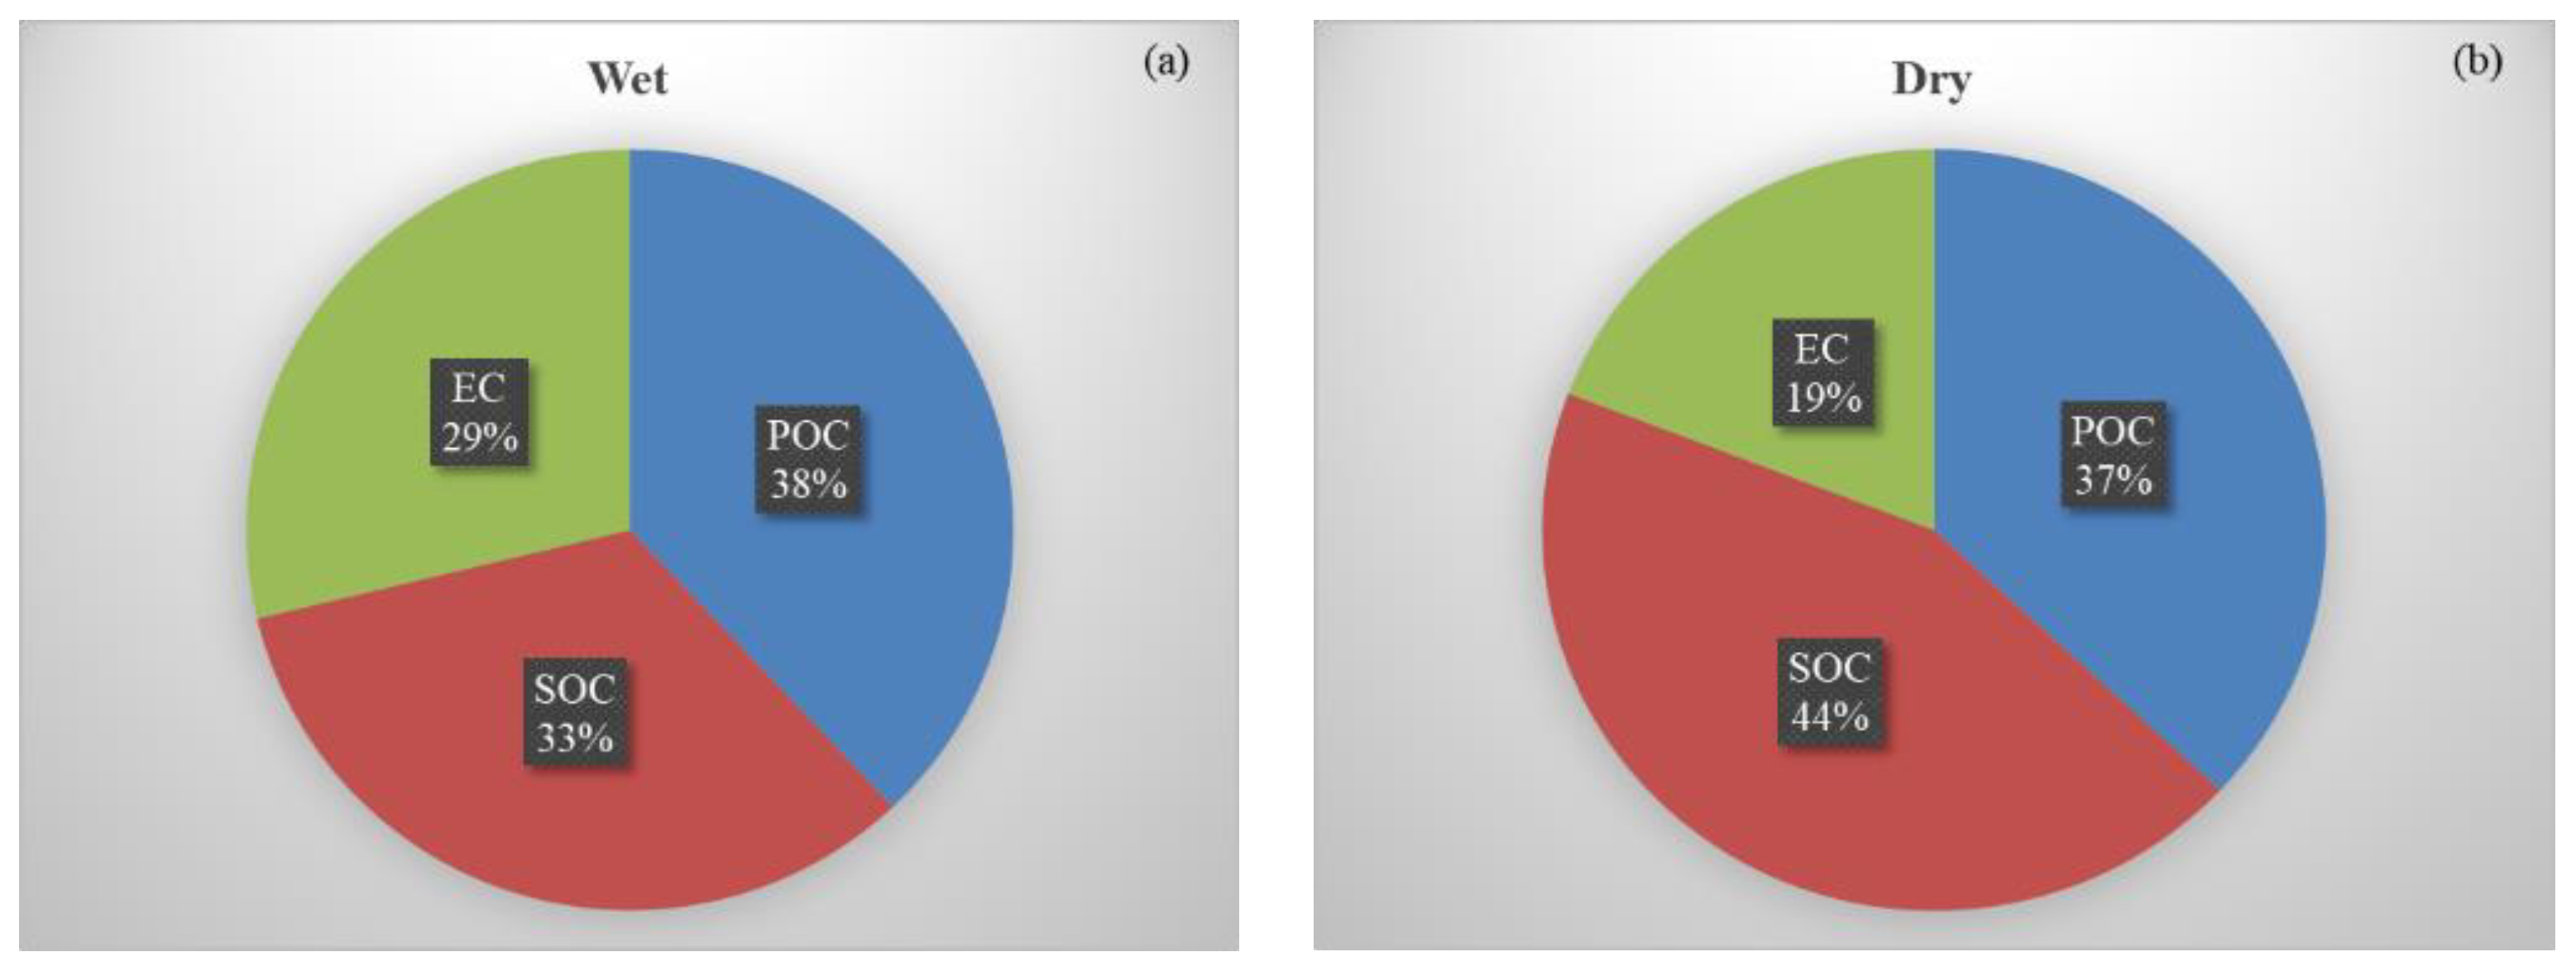
3.4. Estimation of Secondary Organic Aerosol Concentrations
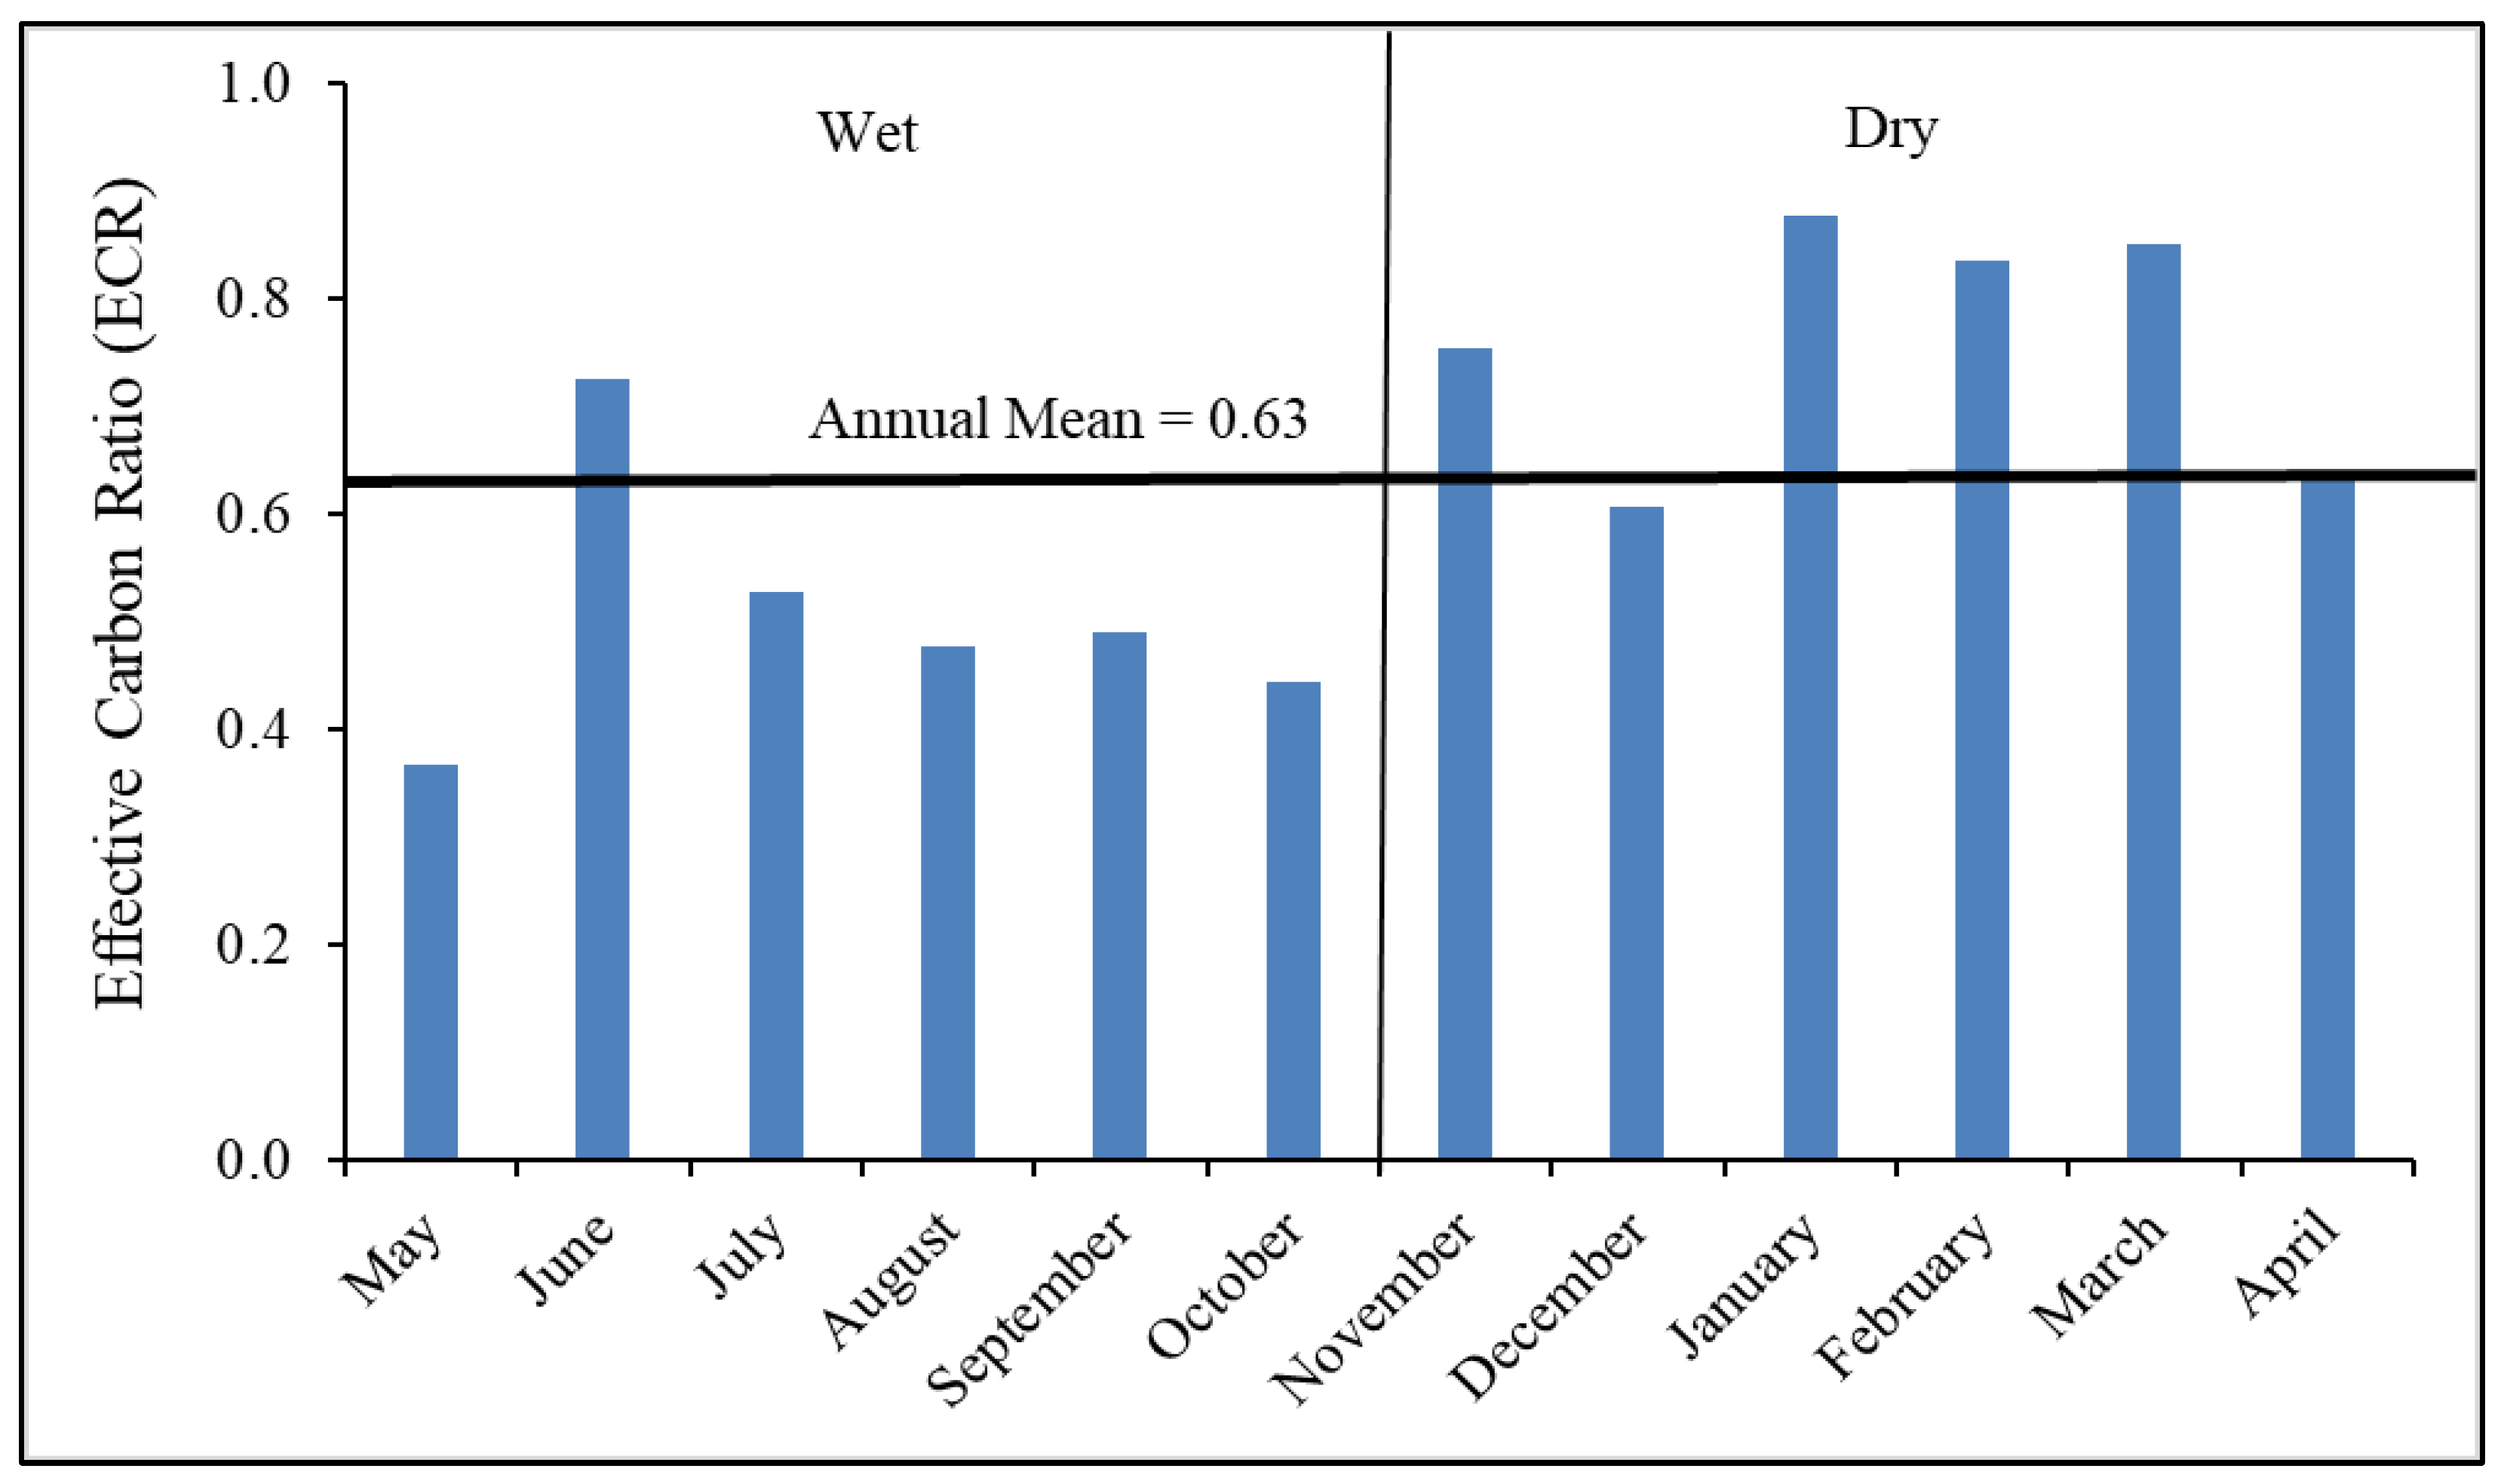
3.5. Effective Carbon Ratio (ECR)
3.6. Possible Local and Long-Range Transport of PM
4. Conclusions
Author Contributions
Funding
Institutional Review Board Statement
Informed Consent Statement
Data Availability Statement
Acknowledgments
Conflicts of Interest
References
- Kanniah, K.D.; Kaskaoutis, D.G.; San Lim, H.; Latif, M.T.; Kamarul Zaman, N.A.F.; Liew, J. Overview of atmospheric aerosol studies in Malaysia: Known and unknown. Atmos. Res. 2016, 182, 302–318. [Google Scholar] [CrossRef]
- Guo, Y. Size distribution characteristics of carbonaceous aerosol in a rural location in northwestern China. Air Qual. Atmos. Health 2016, 9, 193–200. [Google Scholar] [CrossRef]
- Phairuang, W.; Inerb, M.; Hata, M.; Furuuchi, M. Characteristics of trace elements bound to ambient nanoparticles (PM0.1) and a health risk assessment in southern Thailand. J. Haz. Mat. 2022, 425, 127986. [Google Scholar] [CrossRef] [PubMed]
- Thuy, N.T.T.; Dung, N.T.; Sekiguchi, K.; Thuy, L.B.; Hien, N.T.T.; Yamaguchi, R. Mass concentrations and carbonaceous compositions of PM0.1, PM2.5, and PM10 at urban locations in Hanoi, Vietnam. Aerosol Air Qual. Res. 2018, 18, 1591–1605. [Google Scholar] [CrossRef] [Green Version]
- Othman, M.; Latif, M.T.; Hamid, H.H.A.; Uning, R.; Khumsaeng, T.; Phairuang, W.; Daud, Z.; Idris, J.; Sofwan, N.M.; Lung, S.-C.C. Spatial-temporal variability and health impact of particulate matter during a 2019-2020 biomass burning event in Southeast Asia. Sci. Rep. 2022, 12, 7630. [Google Scholar] [CrossRef]
- Phairuang, W.; Tekasakul, P.; Hata, M.; Tekasakul, S.; Chomanee, J.; Otani, Y.; Furuuchi, M. Estimation of air pollution from ribbed smoked sheet rubber in Thailand exports to Japan as a pre-product of tires. Atmos. Pollut. Res. 2019, 10, 642–650. [Google Scholar] [CrossRef]
- Loomis, D.; Grosse, Y.; Lauby-Secretan, B.; El Ghissassi, F.; Bouvard, V.; Benbrahim-Tallaa, L.; Straif, K. The carcinogenicity of outdoor air pollution. Lancet Oncol. 2013, 14, 1262. [Google Scholar] [CrossRef]
- Jacobson, M.Z. Air Pollution and Global Warming: History, Science, and Solutions; Cambridge University Press: Cambridge, UK, 2012. [Google Scholar]
- Schraufnagel, D.E. The health effects of ultrafine particles. Exp. Mol. Med. 2020, 52, 311–317. [Google Scholar] [CrossRef] [Green Version]
- Kwon, H.S.; Ryu, M.H.; Carlsten, C. Ultrafine particles: Unique physicochemical properties relevant to health and disease. Exp. Mol. Med. 2020, 52, 318–328. [Google Scholar] [CrossRef]
- Phairuang, W.; Hata, M.; Furuuchi, M. Influence of agricultural activities, forest fires and agro-industries on air quality in Thailand. J. Environ. Sci. 2017, 52, 87–92. [Google Scholar] [CrossRef]
- Inerb, M.; Phairuang, W.; Paluang, P.; Hata, M.; Furuuchi, M.; Wangpakapattanawong, P. Carbon and Trace Element Compositions of Total Suspended Particles (TSP) and Nanoparticles (PM0.1) in Ambient Air of Southern Thailand and Characterization of Their Sources. Atmosphere 2022, 13, 626. [Google Scholar] [CrossRef]
- Putri, R.M.; Amin, M.; Suciari, T.F.; Al Fattah Faisal, M.; Auliani, R.; Ikemori, F.; Wada, M.; Hata, M.; Tekasakul, P.; Furuuchi, M. Site-specific variation in mass concentration and chemical components in ambient nanoparticles (PM0.1) in North Sumatra Province-Indonesia. Atmos. Pollut. Res. 2021, 12, 101062. [Google Scholar] [CrossRef]
- Phairuang, W.; Amin, M.; Hata, M.; Furuuchi, M. Airborne Nanoparticles (PM0.1) in Southeast Asian Cities: A Review. Sustainability 2022, 14, 10074. [Google Scholar] [CrossRef]
- Adam, M.G.; Tran, P.T.; Bolan, N.; Balasubramanian, R. Biomass burning-derived airborne particulate matter in Southeast Asia: A critical review. J. Haz. Mat. 2021, 407, 124760. [Google Scholar] [CrossRef] [PubMed]
- Boongla, Y.; Chanonmuang, P.; Hata, M.; Furuuchi, M.; Phairuang, W. The characteristics of carbonaceous particles down to the nanoparticle range in Rangsit city in the Bangkok Metropolitan Region, Thailand. Environ. Poll. 2021, 272, 115940. [Google Scholar] [CrossRef] [PubMed]
- Nuthammachot, N.; Phairuang, W.; Stratoulias, D. Estimation of carbon emission in the ex-mega rice project, Indonesia based on SAR satellite images. Appl. Ecol. Environ. Res. 2019, 17. [Google Scholar] [CrossRef]
- World Health Organization. Review of Evidence on Health Aspects of Air Pollution- REVIHAAP Project: Technical Report. World Health Organisation, Copenhagen, Denmark. Available online: http://www.euro.who.int/__data/assets/pdf_file/0004/193108/REVIHAAP-Final-technical-report-final-version.pdf (accessed on 29 September 2022).
- Jamhari, A.A.; Latif, M.T.; Wahab, M.I.A.; Hassan, H.; Othman, M.; Abd Hamid, H.H.; Tekasakul, P.; Phairuang, W.; Hata, M.; Furuchi, M.; et al. Seasonal variation and size distribution of inorganic and carbonaceous components, source identification of size-fractioned urban air particles in Kuala Lumpur, Malaysia. Chemosphere 2022, 287, 132309. [Google Scholar] [CrossRef] [PubMed]
- Han, Y.; Cao, J.; Chow, J.C.; Watson, J.G.; An, Z.; Jin, Z.; Fung, K.; Liu, S. Evaluation of the thermal/optical reflectance method for discrimination between char- and soot-EC. Chemosphere 2007, 69, 569–574. [Google Scholar] [CrossRef]
- Gustafsson, Ö.; Ramanathan, V. Convergence on climate warming by black carbon aerosols. Proc. Natl. Acad. Sci. USA 2016, 113, 4243–4245. [Google Scholar] [CrossRef] [Green Version]
- Saikawa, E.; Wu, Q.; Zhong, M.; Avramov, A.; Ram, K.; Stone, E.A.; Stockwell, C.E.; Jayarathne, T.; Panday, A.K.; Yokelson, R.J. Garbage Burning in South Asia: How Important Is It to Regional Air Quality? Environ. Sci. Technol. 2020, 54, 9928–9938. [Google Scholar] [CrossRef]
- Phairuang, W.; Inerb, M.; Furuuchi, M.; Hata, M.; Tekasakul, S.; Tekasakul, P. Size-fractionated carbonaceous aerosols down to PM0.1 in southern Thailand: Local and long-range transport effects. Environ. Poll. 2020, 260, 114031. [Google Scholar] [CrossRef] [PubMed]
- Phairuang, W.; Suwattiga, P.; Chetiyanukornkul, T.; Hongtieab, S.; Limpaseni, W.; Ikemori, F.; Hata, M.; Furuuchi, M. The influence of the open burning of agricultural biomass and forest fires in Thailand on the carbonaceous components in size-fractionated particles. Environ. Poll. 2019, 247, 238–247. [Google Scholar] [CrossRef] [PubMed]
- Thailand Meteorological Department (TMD). The Climate of Thailand. 2018. Available online: https://www.tmd.go.th/en/province.php?id1/443 (accessed on 29 September 2022).
- Furuuchi, M.; Eryu, K.; Nagura, M.; Hata, M.; Kato, T.; Tajima, N.; Sekiguchi, K.; Ehara, K.; Seto, T.; Otani, Y. Development and performance evaluation of air sampler with inertial filter for nanoparticle sampling. Aerosol. Air Qual. Res. 2010, 10, 185–192. [Google Scholar] [CrossRef]
- Amin, M.; Putri, R.M.; Handika, R.A.; Ullah, A.; Goembira, F.; Phairuang, W.; Ikemori, F.; Hata, M.; Tekasakul, P.; Furuuchi, M. Size-Segregated Particulate Matter Down to PM0.1 and Carbon Content during the Rainy and Dry Seasons in Sumatra Island, Indonesia. Atmosphere 2021, 12, 1441. [Google Scholar] [CrossRef]
- Safai, P.D.; Raju, M.P.; Rao PS, P.; Pandithurai, G. Characterization of carbonaceous aerosols over the urban tropical location and a new approach to evaluate their climatic importance. Atmos. Environ. 2014, 92, 493–500. [Google Scholar] [CrossRef]
- Chen, S.C.; Tsai, C.J.; Chou, C.C.K.; Roam, G.D.; Cheng, S.S.; Wang, Y.N. Ultrafine particles at three different sampling locations in Taiwan. Atmos. Environ. 2010, 44, 533–540. [Google Scholar] [CrossRef]
- Ding, X.; Kong, L.; Du, C.; Zhanzakova, A.; Wang, L.; Fu, H.; Chen, J.; Yang, X.; Cheng, T. Long-range and regional transported size-resolved atmospheric aerosols during summertime in urban Shanghai. Sci. Total Environ. 2017, 583, 334–343. [Google Scholar] [CrossRef]
- Gugamsetty, B.; Wei, H.; Liu, C.N.; Awasthi, A.; Hsu, S.C.; Tsai, C.J.; Roam, G.D.; Wu, Y.C.; Chen, C.F. Using positive matrix factorization, the source characterization and apportionment of PM10, PM2.5 and PM0.1. Aerosol. Air Qual. Res. 2012, 12, 476–491. [Google Scholar] [CrossRef]
- Hata, M.; Bai, Y.; Furuuchi, M.; Fukumoto, M.; Otani, Y.; Sekiguchi, K.; Tajima, N. Status and characteristics of ambient aerosol nano-particles in Kakuma, Kanazawa and comparison between sampling characteristics of air samplers for aerosol particle separation. Jpn. Sea Res. 2009, 40, 135–140. [Google Scholar]
- Air Quality Expert Group (AQEG). Particulate Matter in the United Kingdom; Defra: London, UK, 2005.
- Venecek, M.A.; Yu, X.; Kleeman, M.J. Predicted ultrafine particulate matter source contribution across the continental United States during summertime air pollution events. Atmos. Chem. Phys. 2019, 19, 9399–9412. [Google Scholar] [CrossRef] [Green Version]
- Chow, J.C.; Watson, J.G.; Kuhns, H.; Etyemezian, V.; Lowenthal, D.H.; Crow, D.; Kohl, S.D.; Engelbrecht, G.P.; Green, M.C. Source profiles for industrial, mobile, and area sources in the Big Bend Regional Aerosol Visibility and Observational study. Chemosphere 2004, 54, 185–208. [Google Scholar] [CrossRef] [PubMed]
- Andreae, M.O.; Gelencsér, A. Black carbon or brown carbon? The nature of light-absorbing carbonaceous aerosols. Atmos. Chem. Phys. 2006, 6, 3131–3148. [Google Scholar] [CrossRef] [Green Version]
- Allen, J.O.; Mayo, P.R.; Hughes, L.S.; Salmon, L.G.; Cass, G.R. Emissions of size-segregated aerosols from on-road vehicles in the Caldecott Tunnel. Environ. Sci. Technol. 2001, 35, 4189–4197. [Google Scholar] [CrossRef]
- Na, K.; Sawant, A.A.; Song, C.; Cocker, D.R., III. Primary and secondary carbonaceous species in the atmosphere of Western Riverside County, California. Atmos. Environ. 2004, 38, 1345–1355. [Google Scholar] [CrossRef]
- Thumanu, K.; Pongpiachan, S.; Ho, K.F.; Lee, S.C.; Sompongchaiyakul, P. Characterization of organic functional groups, water-soluble ionic species and carbonaceous compounds in PM10 from various emission sources in Songkhla Province, Thailand. WIT Trans. Ecol. Environ. 2009, 123, 295–306. [Google Scholar]
- Saarikoski, S.; Timonen, H.; Saarnio, K.; Aurela, M.; Järvi, L.; Keronen, P.; Kerminen, V.-M.; Hillamo, R. Sources of organic carbon in fine particulate matter in northern European urban air. Atmos. Chem. Phy. 2008, 8, 6281–6295. [Google Scholar] [CrossRef] [Green Version]
- Cao, J.J.; Wu, F.; Chow, J.C.; Lee, S.C.; Li, Y.; Chen, S.W.; An, Z.S.; Fung, K.K.; Watson, J.G.; Zhu, C.S.; et al. Characterization and source apportionment of atmospheric organic and elemental carbon during fall and winter of 2003 in Xi’an, China. Atmos. Chem. Phys. 2005, 5, 3127–3137. [Google Scholar] [CrossRef] [Green Version]
- Zhang, Q.; Sarkar, S.; Wang, X.; Zhang, J.; Mao, J.; Yang, L.; Shi, Y.; Jia, S. Evaluation of factors influencing secondary organic carbon (SOC) estimation by CO and EC tracer methods. Sci. Total Environ. 2019, 686, 915–930. [Google Scholar] [CrossRef] [PubMed]
- Hallquist, M.; Wenger, J.C.; Baltensperger, U.; Rudich, Y.; Simpson, D.; Claeys, M.; Dommen, J.; Donahue, N.M.; George, C.; Goldstein, A.H.; et al. The formation, properties and impact of secondary organic aerosol: Current and emerging issues. Atmos. Chem. Phys. 2009, 9, 5155–5236. [Google Scholar] [CrossRef] [Green Version]
- Phairuang, W.; Suwattiga, P.; Hongtieab, S.; Inerb, M.; Furuuchi, M.; Hata, M. Characteristics, sources, and health risks of ambient nanoparticles (PM0.1) bound metal in Bangkok, Thailand. Atmos. Environ. X 2021, 12, 100141. [Google Scholar] [CrossRef]
- Cape, J.N.; Coyle, M.; Dumitrean, P. The atmospheric lifetime of black carbon. Atmos. Environ. 2012, 59, 256–263. [Google Scholar] [CrossRef]


| Location | Site Description | Concentration | References |
|---|---|---|---|
| Bangkok, Thailand | Urban | 14.5 ± 4.7 | This study |
| Bangkok, Thailand | Urban | 14.8 ± 2.0 | [24] |
| Chiang Mai, Thailand | Suburban | 25.2 ± 4.7 | [24] |
| Hat Yai, Thailand | Suburban | 10.2 ± 2.2 | [23] |
| Hat Yai, Thailand | Suburban | 10.4 ± 1.2 | [12] |
| Pathumtani, Thailand | Suburban | 16.9 ± 4.2 | [23] |
| North Sumatra, Indonesia | Rural | 7.1 | [13] |
| Hanoi, Vietnam | Urban | 6.1 ± 2.7 | [4] |
| Shanghai, China | Urban | 13.4 | [30] |
| Hsinchu, Taiwan | Traffic | 2.2 ± 0.6 | [41] |
| Hsinchu, Taiwan | Tunnel | 33.2 ± 6.5 | [42] |
| New Taipei, Taiwan | Urban | 1.4 ± 0.6 | [31] |
| Kanazawa, Japan | Suburban | 4.7 | [32] |
Publisher’s Note: MDPI stays neutral with regard to jurisdictional claims in published maps and institutional affiliations. |
© 2022 by the authors. Licensee MDPI, Basel, Switzerland. This article is an open access article distributed under the terms and conditions of the Creative Commons Attribution (CC BY) license (https://creativecommons.org/licenses/by/4.0/).
Share and Cite
Phairuang, W.; Hongtieab, S.; Suwattiga, P.; Furuuchi, M.; Hata, M. Atmospheric Ultrafine Particulate Matter (PM0.1)-Bound Carbon Composition in Bangkok, Thailand. Atmosphere 2022, 13, 1676. https://doi.org/10.3390/atmos13101676
Phairuang W, Hongtieab S, Suwattiga P, Furuuchi M, Hata M. Atmospheric Ultrafine Particulate Matter (PM0.1)-Bound Carbon Composition in Bangkok, Thailand. Atmosphere. 2022; 13(10):1676. https://doi.org/10.3390/atmos13101676
Chicago/Turabian StylePhairuang, Worradorn, Surapa Hongtieab, Panwadee Suwattiga, Masami Furuuchi, and Mitsuhiko Hata. 2022. "Atmospheric Ultrafine Particulate Matter (PM0.1)-Bound Carbon Composition in Bangkok, Thailand" Atmosphere 13, no. 10: 1676. https://doi.org/10.3390/atmos13101676