Article

Validation and Comparison of Climate Reanalysis Data in the East Asian Monsoon Region

Department of Geography, Kyung Hee University, Seoul 02447, Korea
*
Author to whom correspondence should be addressed.
Atmosphere 2022, 13(10), 1589; https://doi.org/10.3390/atmos13101589
Submission received: 5 August 2022 / Revised: 9 September 2022 / Accepted: 22 September 2022 / Published: 28 September 2022
(This article belongs to the Special Issue Feature Papers in Atmosphere Science)

Abstract

:
Understanding East Asian monsoon (EAM) has been a crucial issue due to its socio-economic effects on one-fifth of the world’s population and its interactions with the global climate system. However, the reliabilities of climate reanalysis data are still uncertain at varying temporal and spatial scales. In this study, we examined the correlations and differences for climate reanalyses with weather observations and suggested the best climate reanalysis for the EAM region. The three reanalyses of ERA5, JRA55, and NCEP2 along with a gridded observation (CRU) were evaluated using the correlation coefficients (Pearson, Spearman, and Kendall), difference statistics (RMSE and bias), and Taylor diagrams, comparing their annual and seasonal temperatures and precipitations with those from the total of 537 weather stations across China, North Korea, South Korea, and Japan. We found that ERA5 showed the best performance in reproducing temporal variations in temperature with the highest correlations in annual, summer, and autumn, and the smallest RMSEs and biases for all seasons and annually. For precipitation, among the three reanalysis datasets, ERA5 had the highest correlations, annually and in four seasons, with the smallest RMSEs, annually and in spring, summer and autumn, and the smallest biases, annually and in summer and autumn. Regarding spatial variations, ERA5 was also the most suitable reanalysis data in representing the annual and seasonal climatological averages.

1. Introduction

The monsoons in East Asia have complex spatio-temporal variations throughout the subtropical and mid-latitude regions [1,2]. The monsoonal belt during summer, which stretches thousands of kilometers, rains in the countries and the adjacent oceans of China, Japan, and North and South Korea, as the regional monsoons, called Meiyu, Baiyu, Jangma and Changma, respectively. The heavy rain during the summer monsoon period and complex terrain in East Asian countries make water management more difficult in a timely manner. Particularly, floods and droughts caused by the monsoon variations can significantly affect human life and the economy for the more than 1.5 billion people in the East Asian monsoon (EAM) region. As the EAM affects one-fifth of the world’s population and interacts with the global climate systems, the EAM study has been one of the major areas in climate science.
To understand the EAM and its variability, spatially and temporally reliable climate data over a long period of time are required. Observational station data are not continuous throughout space and time [3,4,5,6] and, thus, they are not sufficient to provide consistent atmospheric states for a given location, which results in limitations to study the EAM as well as other climatic phenomena. The climate reanalysis data can replace observational data by compensating the shortcomings of weather station data, which can provide continuous atmospheric variables through data assimilation processes and numerical models. Since the first climate reanalysis data of National Centers for Environmental Prediction/National Center for Atmospheric Research (NCEP/NCAR, hereinafter NCEP1) [7] were released in the mid-1990s, reanalysis data have been widely applied to three-dimensional analysis of various weather and climate phenomena, climate variability, and model validation studies. The performance of reanalysis data has been continuously improved in terms of spatial resolution, atmospheric-land–ocean coupled model and numerical forecasts. Recently, the fifth-generation climate reanalysis of European Centre for Medium-Range Weather Forecasts (ECMWF), ERA5, was released [8].
However, due to the uncertainty of input data, errors in numerical models, and limitations in spatial resolution, there are still differences between reanalysis data and observed atmospheric variables. Therefore, recognizing the differences and errors in the reanalysis data from the observations and considering their effects on the research outputs are essential to apply the reanalysis data to climate research [9]. The studies of comparing differences of reanalyses with observations and validating errors to evaluate the performance of reanalysis have been conducted on global e.g., [10], continental e.g., [11,12], and country scale e.g., [3,13]. As for studies on a global scale, plenty of research compared station observations with global gridded observations, such as the Climate Research Unit (CRU) and the Global Precipitation Climate Center (GPCC), the merged data of satellite estimates and gauge data, such as CPC Merged Analysis of Precipitation (CMAP), and climate reanalysis data, such as NCEP, ECMWF, and Japanese Reanalysis (JRA) series. For example, Donat et al., (2014) evaluated the consistency of the reanalyses and observations in terms of extreme temperature and precipitation and revealed that the ECMWF reanalysis showed spatially higher correlations with the observations compared to the Japanese 25-year Reanalysis (JRA25) and NCEP reanalyses [10]. Sun et al., (2018) compared various gridded global precipitation data, including gauge-based, satellite-related, and reanalysis products [14]. There were deviations up to 300 mm among the products in the estimated annual precipitation over the land and the reanalysis datasets generally had the largest discrepancies compared to gauge-based and satellite-related datasets.
The comparison and validation studies of reanalysis have been conducted on a spatial scale of continents, including eastern Eurasia, southern South America, and Antarctica e.g., [11,12,15]. Several studies have verified the uncertainty of the reanalysis data in polar regions, where it is difficult to obtain observational data due to a lack of data accessibility. For example, Zhang et al., (2021) divided Greenland into sedimentary and erosion areas to compare surface temperature, relative humidity, and wind speed of observations with Japanese 55-year Reanalysis (JRA55), ERA5, Climate Forecast System Reanalysis (CFSR), and Modern-Era Retrospective Observations (MERRA2) [16]. Based on Root Mean Square Errors (RMSEs) and biases, MERRA2 showed the highest performances in surface temperature in the sedimentary area and JRA55 had the best in the erosion area. MERRA2 was the best reanalysis for relative humidity as it captured the seasonal cycles well. For wind speed, JRA55 and ERA5 were the best in the erosion and the sedimentary areas, respectively. Huai et al., (2019) evaluated surface temperatures in Antarctica obtained on the eight reanalysis datasets, including ERA-Interim, CFSR, JRA55, MERRA2, ECMWF 20th century atmospheric model ensemble (ERA-20cm), ECMWF 20th century reanalysis (ERA-20c), NOAA-CIRES-DOE Twentieth Century Reanalysis (20CR), and Coupled Reanalysis of the Twentieth Century (CERA-20C) [15]. All the reanalysis data generally represented well the seasonal cycles of temperature. In particular, MERRA2 showed the best performance with mean absolute error (MAE) of 2 °C or less for all twelve months. For annual variations in the monthly average temperature, the accuracy was in the order of ERA-Interim, CFSR, and MERRA2 and the other reanalysis data showed relatively lower performance.
In the mid-latitude regions, it can be challenging to simulate true atmospheric conditions using a climate forecast model because of the various factors associated with complex interactions of high- and low-latitude climate systems [17] and also due to the effects of human-induced land cover and land use changes on the atmosphere [18]. Therefore, research on comparison and validation of reanalysis data have been actively conducted in the mid-latitudes. Mooney et al., (2011) compared reanalysis data (ERA40, ERA-Interim, and NCEP1) with station observations for surface temperature over Ireland during 1989–2001 and found that ERA-Interim showed higher linear correlation coefficients than the other two datasets [13]. Balmaceda-Huarte et al., (2021) divided southern South America into five sub-regions and compared the reanalysis data of ERA-Interim, ERA5, NCEP1, NCEP-Department of Energy (DOE) reanalysis (hereinafter NCEP2), and JRA55 for temperature and precipitation [12]. NCEP1 and NCEP2 showed poor illustrations for overall trend, but good for interannual variations. ERA5 was better in capturing the spatio-temporal variations in temperature and precipitation, compared to ERA-Interim, because of the advanced numerical models and higher spatial resolution. de Lima and Alcântara (2019) validated the reanalysis data of ERA-Interim, CFSR, and NCEP1 with station observations based on five extreme climate indices by the Expert Team on Climate Change Detection and Indices (ETCCDI) for the eastern region of northeast Brazil [19]. ERA-Interim showed lower RMSEs, compared to CFSR, for precipitation, monthly maximum of daily minimum temperature (TXn), and monthly minimum of daily minimum temperature (TNn). RMSEs of monthly maximum of daily maximum temperature (TXx) and monthly maximum of daily minimum temperature (TNx) were relatively lower in CFSR. Pearson correlations of precipitation, TXn, and TNn were higher in the order of ERA-Interim, CFSR, and NCEP1. For TXx and TNx, the correlations of NCEP1 were higher than those of CFSR. Tang et al., (2017) evaluated the reanalyses of NCEP1, NCEP2, and CRU-NCEP with NOAA long-term weather data on monthly and annual scales in 90 metropolitan areas in the United States [20]. On the annual, CRUNCEP showed the best performance for average and minimum temperatures and NCEP1 and NCEP2 for maximum temperature and precipitation. The least bias with observational data was in NCEP1 for maximum temperature and CRUNCEP for the precipitation, average temperature, and minimum temperature.
East Asia is one of the world’s most densely populated areas in the mid-latitude, where the East Asian summer and winter monsoons have a dominant influence on the climate of the region. For an example of a comparison study in East Asia, Inoue and Matsumoto (2004) compared sea-level pressure of NCEP1 and ERA40 with observations during the summer of 1960–1999 in eastern Eurasia to evaluate their reliabilities [11]. The annual and seasonal averages of reanalysis data showed an increase in sea-level pressure in Mongolia between 1960–1979 and 1980–1999 in NCEP1. These changes in sea-level pressure observed in NCEP1 were not found in ERA40 and also observations, indicating poor performance of NCEP1 compared to the ERA40. Many studies that compare reanalysis data with observational station data in East Asia have been conducted in China, with its large area and various climates. Zhao and Fu (2006) evaluated the reliability of reanalysis data by comparing the spatio-temporal distribution of summer precipitation obtained from ERA40, NCEP2, and CRU and their differences from observational data during 1979 to 2001 in mainland China [21]. According to the results of spatial distribution, interannual variations, and empirical orthogonal function (EOF) analysis, CRU showed high consistency with observation data. Gao et al., (2008) compared surface temperatures of NCEP1 and ERA40 with station observations in mainland China from 1979 to 2001 and estimated the effect of elevation on temperature biases in the reanalyses [22]. Although the reanalysis data represented clear cold biases, ERA40 was relatively similar to the observations compared to NCEP1. Ma et al., (2008) compared the performance of reanalysis data of ERA40, NCEP1, and NCEP2 in China from 1979 to 2001 in terms of spatio-temporal aspects [23]. The results showed that ERA40 was better at reproducing surface temperature than NCEP series and NCEP2 was more consistent with the observations than NCEP1. NCEP2 had a smaller MAE, a higher standard deviation, and a slightly higher correlation coefficient than NCEP1. You et al., (2012) compared precipitation of NCEP1 and ERA40 with adjusted observations from 1961 to 2007 over the Tibetan Plateau [24]. The temporal variations in the two reanalyses were different from the observations. Further, dry biases were observed in both reanalyses and NCEP1 showed a greater dry bias compared to ERA40, which supported the better performance of ERA40 than NCEP1 in reproducing the interannual variations in precipitation in the Tibetan Plateau. He and Zhao (2017) compared NCEP2 and CFSR with observations by daily temperature indices in China from 1979 to 2010 [3]. For the observation data of the Beijing stations, both reanalysis data reproduced well the long-range, also called long-term memory or long-range persistence, correlation. However, there are some overestimations in daily temperature along the Tibetan Plateau. NCEP2 performed better than CFSR in relatively colder regions, including Inner Mongolia and the central, eastern, and northwestern regions of China, while CFSR was superior in the warmer southern China.
There are relatively fewer studies of reanalysis comparison and validation for other countries in East Asia, although South Korea and Japan have been included in the global validation study of reanalysis (e.g., [4]). For South Korea, Han and Kim (2019) compared the reanalysis data of ERA-20cm, ERA-20c, ERA40, and 20CR with the gridded observational data of CRU and GPCC [25]. Precipitations of CRU and GPCC showed higher correlations in interannual variations compared to reanalysis data and ERA40 was the highest for temperature. As a local-scale study, Xin et al., (2021) evaluated the reproducing performance of precipitation in ERA5-Land and ERA5 reanalysis in urban areas of Guangdong, Hong Kong, and Macau at different time scales of hourly, daily, and monthly [5]. The reanalysis data reproduced well the spatial distribution and monthly trends of precipitation. However, for the shorter time scales, at hourly and daily, the frequency of precipitation was overestimated. Despite the higher resolution in the ERA5-Land, ERA5 reanalysis was more accurate in representing precipitation due to the absence of an atmospheric model in generating the ERA5-Land reanalysis.
While the climate reanalysis has evolved by improving the quality of input observational data, by enhancing spatial resolution, and by reducing the systematic model biases over the generations, it is still essential to verify the reanalysis data at a regional scale. ERA5, as the most recently produced reanalysis with the highest spatial resolution, was improved from ERA-Interim in the integration of model processes, tangential approximation, and data assimilation in an Integrated Forecast System (IFS) [8]. However, several previous studies that investigated the applicability of ERA5 in China showed the performance of ERA5 was relatively degraded at high altitude. Zhang et al., (2021) compared reanalysis data of ERA5, JRA55, NCEP1, NCEP2, MERRA, 20CR, and the 40-year global reanalysis dataset released by China Meteorological Administration (CRA40) with the observations after removing urbanization bias in mainland China during 1979–2015 [16]. The results showed that the surface temperature from JRA55 was better than that from ERA5 and other reanalysis data. Jiao et al., (2021) evaluated precipitations from ERA5 with observations in mainland China by analyzing the annual and seasonal trends and spatial patterns [26]. ERA5 had good agreements with observations at elevations below 1000 m, but significant differences at elevations above 4000 m. These previous results suggest that the reliability of climate reanalyses needs to be validated in the regional domain at various time scales (e.g., annual and seasonal averages).
Most previous studies comparing the existing reanalysis data with observation data were conducted for specific countries. In particular, most of the studies in East Asia have focused on China, so, to our knowledge, there are no studies comparing and validating reanalysis data only for the entire EAM region. As mentioned earlier, the EAM is a major source of water for humans, animals, and plants living in the region and, at the same time, the extreme nature of monsoons can cause damage by heavy rain and drought as well as winter storms. As nearly one-fifth of the world’s population lives in the EAM region, the importance of understanding the EAM is paramount. Therefore, for a better understanding of the EAM variability and, thus, improving the monsoon predictability, the use of climate reanalysis evaluated in the EAM region is needed. This study compared and validated representative reanalysis data across the world, which are ERA5 from Europe, NCEP2 from America, and JRA55 from Asia, with station observation data provided by each country, China, North Korea, South Korea, and Japan in the EAM region. By evaluating the performance of the reanalysis data in terms of temporal and spatial associations and differences using the statistical metrics of the parametric and non-parametric correlation coefficients, RMSE, and bias, we suggested the most appropriate reanalysis data for the EAM region. In addition, the potential geographical factors for the systematic biases found in the reanalysis data were discussed, which could be considered in utilizing the reanalysis data for East Asian studies.

2. Materials and Methods

2.1. Study Area

The EAM region was identified as longitude of 110–146° E and latitude of 20–55° N, including Eastern China, North Korea, South Korea, Japan, and some parts of Russia and Mongolia [27,28,29,30]. A total of 537 meteorological stations was used in the study and their locations along with altitudes are demonstrated in Figure 1. Most stations are located below 1000 m, while the altitudes of stations notably increase along the mountainous region of inner Mongolia.
Figure 2 shows the annually and seasonally averaged temperature and precipitation from the meteorological stations in the EAM region over the forty years of 1981–2020 for North Korea, South Korea, and Japan, and the thirty years of 1981–2010 for China. The spatial patterns of temperature and precipitation associated with the EAM are dominant and their seasonal variations are clearly observed. Temperature gradient between winter and summer is clearly shown in the northern part of the EAM region (Figure 2a). Abundant precipitation occurs during summer monsoon season but scarce precipitation in winter and autumn seasons (Figure 2b). The distinct seasonality in temperature and precipitation is attributed to the monsoonal flow nature of warm and humid in summer but cold and dry in winter. The spatio-temporal dynamics of temperature and precipitation distributions along with complex atmospheric interactions such as monsoons can cause uncertainties in numerical modelling and thereby climate reanalysis data in the EAM region [17,31].

2.2. Data

2.2.1. Observational Station Data

Observational station data are obtained from meteorological stations, maintained by national meteorological organizations. The observational data were provided by China Meteorological Administration (CMA) [32], Japan Meteorological Agency (JMA), and Korean Meteorological Administration (KMA). Due to the inaccessibility of observations directly from North Korea, Global Telecommunication System (GTS) data from World Meteorological Organization (WMO) were obtained through open meteorological data portal run by KMA.
As the study period covers 1981 to 2020, stations built before 1981 that continued to 2020 were selected. For China, due to the limitation in obtaining publicly available recent observational records, the thirty years of 1981 to 2010 were used in the comparison analysis. The stations within the study area of the EAM region were considered and the stations located in the coastal regions, where the CRU data were not available, were excluded in the analysis. As a result, 537 stations among 991 total stations in the East Asian countries, which include the 312 out of 606 stations in China, the 27 out of 27 stations in North Korea, the 61 out of 102 stations in South Korea, and the 137 out of 256 stations in Japan, were used in this study.
Observational data for South Korea and Japan were available monthly. However, the data in China and North Korea were daily and, thus, those were converted into monthly scale. Further, the daily average temperature in China was calculated by averaging daily maximum and minimum temperatures due to the unreliability of calculated daily average temperature from the CMA data. Since deciding missing and zero precipitation is vague, they were taken as zero precipitation if temperature observations existed at that time; otherwise, they were taken as a missing value [33,34].

2.2.2. Reanalysis Data

Reanalysis data were compared with observational data at annual and seasonal scales and, thus, monthly means of 2 m temperature and precipitation were used. Reanalysis data, used in the analysis, include NCEP2 by NCEP-DOE [35], JRA55 by JMA [36], and ERA5 by ECMWF [8] and, as gridded observational data, CRU TS v4.04 by Climate Research Unit (CRU) [37] were used.
As the latest-generation reanalysis of ECMWF, ERA5 provides high spatial resolution data at 0.25°. ERA5 achieved some improvements in temperature, wind and humidity of the troposphere, global balance of precipitation and evaporation, and consistency in global sea surface temperature and sea ice area from ERA-Interim. ERA5 is produced at 1 h frequency and utilizes improved four-dimensional variational (4D-Var) data assimilation schemes. JRA55 is the second Japanese global atmospheric reanalysis, conducted by the JMA and announced in 2013, which is succeeding reanalysis of JRA25. The 4D-Var data assimilation scheme with various bias corrections on the satellite radiation data was also applied to JRA55. It has horizontal resolution of TL319L60 (approximately 60 km or 0.56°), which is higher than JRA25 (~1.125°). It also has other improvements from JRA25, regarding large temperature biases in the lower stratosphere and dry land surface anomalies in the Amazon basin. NCEP2 is the second version of the NCEP reanalysis series that was released in 2000, covering the T62 Gaussian grids with a spatial resolution of ~1.875°. NCEP2 is an improved version of the first version (NCEP1) with better land surface parameters and land–ocean fluxes. CRU is the global gridded observational data, which were based on in situ observations and collected through station networks only over the land, covering the entire continental area except Antarctica. CRU was used as intermediate data between the station observation and reanalysis data. As the units from reanalysis datasets were inconsistent, they were converted into °C for temperature and mm/day for precipitation.

2.3. Methods

In order to compare point data of stations with gridded data of reanalysis, it is available by either interpolating station data into gridded data or extracting values from grids at the coordinates of stations. Numerous studies have applied various statistical methods to compare point data with gridded data. As an example, Mooney et al., (2011) compared the four different approaches of extracting values from grids, including the four methods with reanalysis value for the grid at the coordinates of stations, with inverse distance-weighted average of the reanalysis of the four grids whose edges are closest to the station, with the inverse distance-weighted average of the reanalysis in area of 30 km × 30 km centered on the station and with reanalysis values from the land grid points only in the four nearest grids [13]. Evaluating by RMSE and Pearson correlation coefficients, the differences among the four methods were insignificant in general, though they depend on stations. Therefore, we extracted values from the grids at the coordinates of stations, which is a commonly used method to handle multiple climate datasets with different spatial resolutions.
We analyzed the correlation coefficients of ERA5, JRA55, NCEP2, and CRU with station observations using the forty-year (or thirty-year) time series at each station for temporal correlation and those using the forty-year (or thirty-year) averages of all the stations for spatial correlation in the EAM region during the annual (ANN) and seasonal (December to February: DJF, March to May: MAM, June to August: JJA, and September to November: SON) periods. Pearson correlation coefficients (Equation (1)) were calculated to evaluate the temporal and spatial linearity in variables as a parametric method [38]. Spearman (Equation (2)) and Kendall (Equation (3)) correlation coefficients were also adopted as a non-parametric method [39,40] to evaluate monotonic relationships of variables. As the statistical metrics to evaluate the difference between reanalysis and observational data, biases were calculated at each station to determine the average direction of errors (Equation (4)) and RMSEs to determine the average magnitude of errors (Equation (5)). The temporal analyses were performed at each station using equations, where Xi and Yi refer to annual or seasonal means of reanalysis and observational values, respectively, at ith year, and n refers to the number of years (i.e., 40 or 30). For the spatial analyses, Xi and Yi refer to annual or seasonal climatology of reanalysis and observational values, respectively, at ith station, and n refers to number of data points (i.e., 537). These statistics were applied to evaluate and validate performances of reanalysis datasets (e.g., [20,23,26]). The results of correlations, biases, and RMSEs were demonstrated on maps or scatter plots. To suggest the best reanalysis in the EAM region, the integrated methods using Pearson correlation, bias, and RMSE and also Taylor diagrams [41] using Pearson correlation, standard deviation, and RMSEs were utilized. Overall processes of validation and comparison analyses are shown as in a schematic diagram (Figure 3).
R = i n X i X ¯ Y i Y ¯ i n X i X ¯ 2 i n Y i Y ¯ 2
ρ = 1 6 i n X i Y i n n 2 1
τ = n u m b e r   o f   p a i r s   o f   c o n c o r d a n t n u m b e r   o f   p a i r s   o f   d i s c o r d a n t 1 2 n n 1
Bias = 1 n   i = 1 n X i Y i
RMSE = 1 n   i = 1 n X i Y i 2
Preprocessing data and calculating statistics were performed using R and Python. Correlation analyses were performed by using cor.test(), basic function of R. Bias and RMSE were calculated using bias() and rmse() functions, provided by package “Metrics”. Taylor diagrams were illustrated using taylor.diagram() function provided by package “plotrix”.

3. Results

3.1. Temporal Validation and Comparisons of Reanalysis Data

3.1.1. Correlations

Figure 4a shows Pearson correlation coefficients of temperature from the three reanalyses (ERA5, JRA55, and NCEP2) and CRU with observational data. Stations with p-values greater than 0.01 (i.e., insignificant at the 1% level) are indicated by gray edges. The number of stations belonging to each range of correlation coefficients is indicated as in histograms in each map. Both on the annual and seasonal means, most of the stations (ratio of stations with 95.5%, 94.4%, and 94.2% on the annual for ERA5, JRA55, and CRU, respectively) represent high correlation coefficients with observational data (R > 0.8, p < 0.01). In this regard, ERA5, JRA55, and CRU well reproduced the temporal variability in temperature. However, NCEP2 appears to have relatively weaker correlations in all the annual and seasonal means of temperature. For example, only 68.7% of the stations shows an R-value greater than 0.8 for the annual temperature from NCEP2. The lower correlation coefficients of NCEP2 appear over Japan in spring. In summer, the differences in NCEP2 from the other datasets were shown as the lower correlations in the central and southern regions of China. ERA5 and JRA55 show similar spatial patterns of correlation coefficients, although JRA55 shows slightly lower values on the southern coast of the Korean peninsula in the summer and, thus, annually. As in ERA5 and JRA55, CRU represents strong correlations across the overall EAM region, while the stations with lower coefficients were identified along the southern coast of China in summer and autumn.
The annual and seasonal correlation coefficients of precipitation are demonstrated in Figure 4b. The majority of the stations showed correlation coefficients of 0.6 < R < 0.8 (p < 0.01), which are relatively lower than those of temperature. On the annual scale, CRU represents the strongest correlations with coefficients (ratio of stations) of R > 0.8 (48.6%) and 0.6 < R < 0.8 (43.8%), followed by ERA5 of R > 0.8 (24.8%) and 0.6 < R < 0.8 (64.2%), JRA55 of R > 0.8 (18.2%) and 0.6 < R < 0.8 (58.1%), and NCEP2 of R > 0.8 (0.6%) and 0.6 < R < 0.8 (23.3%). Although the strength of correlations depends on seasons, CRU consistently has the largest number of stations that represent high correlation coefficients of R > 0.8, except for winter (see the histograms in the maps of Figure 4b). All the datasets show lower correlation coefficients in the western coastal areas of Japan during winter. Among the reanalysis data, ERA5 has more stations with high correlation coefficients of R > 0.8 than JRA55 for all the annual and seasonal means, indicating ERA5 performs better than JRA55 in reproducing temporal variability in precipitation. In spring, all the reanalysis data commonly show weaker correlations in southern China with the order of performance by ERA5, JRA55, and NCEP2. The regions of weaker correlations in NCEP2 during spring tend to extend to central China, Japan, and the Korean peninsula during summer, implying the potential effect of monsoon rainfall on the reanalysis process. To support robustness of the results from Pearson correlation, the non-parametric correlation coefficients of Spearman and Kendall were also investigated. For both temperature and precipitation, the spatial patterns of Spearman and Kendall correlation coefficients were consistent with those of Pearson correlation (Figures S1 and S2 in the Supplementary Materials).

3.1.2. Differences: RMSE and Bias

Although the significant parametric and non-parametric correlation coefficients indicate strong linear and non-linear associations between reanalysis and observational data, it could be insufficient to prove the agreement between two datasets if the datasets have inherent systematic errors. It has been reported that unnatural temperature changes due to urbanization and global warming resulted in over- and under-estimations in physical processes of reanalysis, which can cause systematic errors at the global or local scale [6,19]. Therefore, reanalysis data should be validated using statistical indices that can show systematic errors, such as RMSE and bias.
Figure 5a represents RMSEs of temperature for the three reanalyses and CRU data from observations. The highest RMSEs clearly appear along the mountainous regions in central-western China, where the elevation is relatively higher with complex terrains. Further, some stations located in the coastal regions of Japan also have high RMSEs. The differences among the datasets are noticeable in southern China and Japan. In southern China, RMSEs of JRA55 and NCEP2 are higher than those of ERA5 and CRU. In Japan, ERA5 and JRA55 are found to have a relatively smaller number of stations with an RMSE above 4. Biases were calculated in order to figure out whether the RMSEs are from random uncertainties or immanent systematic errors of the reanalysis data. Global warming and urbanization may influence the reanalysis data to underestimate the degree of rising temperature, which induced the cold bias in the temperature of reanalysis data [6,19]. To control those systematic errors, various bias-correction schemes were applied in reanalysis data [8,35], which could affect the different spatial patterns of biases among the reanalysis data. In Figure 6a, cold biases of the three reanalyses and CRU data compared to observations consistently exist in the mountainous regions of central-western China. The cold biases are similar in ERA5 and CRU, but the ERA5 shows warm biases in the southern Korean peninsula and southern Japan where cold biases are dominant in CRU. The spatial patterns of annual and seasonal biases among the reanalysis data are generally similar, but the magnitude of biases is clearly noticeable by the largest biases in NCEP2 and the least in ERA5.
RMSEs of precipitation tend to follow the seasonality of precipitation. They are largely influenced by the seasonal changes in EAM and, thus, are the highest in summer, followed by spring and autumn, and the lowest in winter. As shown in Figure 5b, the stations, located in the regional monsoon areas of Meiyu in China, Baiyu in Japan, and Changma in South Korea, have relatively high RMSEs. CRU has the lowest RMSEs among all the datasets for all seasons and annually, implying that there are some disparities in performances between reanalysis and observational data. There are the highest RMSEs in NCEP2, followed by ERA5 and then JRA55, but the differences between ERA5 and JRA55 are not visually noticeable. However, there is an opposite pattern of biases between ERA5 and JRA55 in southern China (Figure 6b). JRA55 represents dry biases along the 20°–30°N, where ERA5 shows wet biases. Consistent with the results in Figure 5b, CRU has the lowest biases and the three reanalyses have much higher biases. In summer, NCEP2 shows very high wet biases in southern China and relatively high in northeastern China and very high dry biases in South Korea and relatively high in Japan. Further, all the datasets show relatively high RMSEs and biases along the western coastal regions of Japan in winter. The significantly high errors of winter precipitation in the western-central coastal region of Japan, called Hokuriku region, might be associated with heavy snowfalls driven by the combining effects of the East Asian winter monsoon, ocean, and elevation on precipitation. The magnitude of precipitation biases between ERA5 and JRA55 is generally similar, but with the different biases in southern China by wet biases in ERA5 and dry biases in JRA55 for MAM, JJA, SON, and, thus, annually.

3.2. Spatial Validation and Comparisons of Reanalysis Data

The spatial associations of the three reanalysis and CRU data (X-axis) with observational data (Y-axis) are illustrated in scatter plots using the climatological averages at each station (Figure 7). The results indicate that reanalysis data tend to underestimate temperature to observations and the correlations are significant with R-values larger than 0.9, except for NCEP2 in summer (R = 0.839) (Figure 7a). Spearman’s correlations are generally similar to Pearson’s, but Kendall’s are lower than the other two correlations. All the p-values of the parametric and non-parametric correlations are less than 0.001, annually and seasonally. Although the highest correlation coefficients appear in winter, the highest RMSEs also appear at the same season, which might be due to the largest range of winter temperature among the EAM region with about −25 °C to 20 °C (see Figure 7a). In terms of the correlation coefficients, both ERA5 and JRA55 reproduce well the climatological averages of temperature, showing high correlation coefficients of R > 0.9. The lowest RMSEs and biases of temperature are in ERA5 among the four datasets. Therefore, ERA5 is better than JRA55 and NCEP2 as well as CRU in representing the observed averages of temperature in the EAM region.
The spatial correlations of precipitation are lower than those of temperature. The strength of correlations is in the order of CRU, ERA5, JRA55, and NCEP2, annually and seasonally, except for winter (Figure 7b). In winter, Pearson correlation coefficients appear in the order of JRA55, ERA5, CRU, and NCEP2, which might be associated with the larger variations in winter precipitation in Japan than other East Asian countries, as shown in the dispersed pattern of stations (see rectangle symbols in Figure 7b). As shown in the scatter plots of winter, the uppermost point of ERA5 is highly biased compared to the uppermost point of JRA55 and it could make the correlation coefficients of ERA5 lower than those of JRA55 in winter, unlike seasonally and annually. Further, it is shown that the reanalyses are more dispersed than CRU. The performance in terms of RMSEs for the annual, summer, and autumn, and Pearson correlation coefficients for the annual, spring, summer, and autumn are in the order of CRU, ERA5, JRA55, and NCEP2. Based on the results, CRU and ERA5 reproduce the climatological averages of precipitation better than the other datasets.

3.3. The Best Reanalysis Data in the EAM Region

3.3.1. By Stations

Based on the results of temporal analyses in Section 3.1, the best reanalysis data are indicated by each station, considering the three statistics of Pearson correlation coefficients, RMSEs, and biases (Figure 8). For temperature, ERA5 was selected as the best by the largest number of stations with the highest value of Pearson correlation annually, in summer and autumn, and as the second in winter and spring after JRA55, which are shown as green dots on the maps (see the first column of Figure 8a). JRA55 is selected in winter and spring as the best and the second best annually and for the other seasons. The JRA55 best stations are more distributed inland across the EAM region, compared to ERA5. This indicates that the best reanalysis in terms of Pearson correlation coefficients by stations depends on temporal (seasonal) as well as spatial (coastal and inland) variations. Nonetheless, the RMSEs and biases show consistent results in all the annual and seasonal means as the numbers of ERA5 best stations are two-times larger than those of JRA55 (see the histograms of RMSE and bias in Figure 8a). The percentages of ERA5 best stations by RMSEs and biases are larger in winter and autumn (>59%), when the RMSE differences of the three reanalyses with observations are relatively larger than in spring and summer (see Figure 5a). This implies that the seasonal bias correction of temperature in ERA5 [8] outperforms those of JRA55 and NCEP2. While JRA55 has better stations than ERA5 in the results of correlations during winter and spring, ERA5 outperformed for the annual and other seasonal means. In the results of RMSEs and biases, for all the annual and other seasonal means, it appears that ERA5 performs better than JRA55 and NCEP2. The results are consistent with those of correlations (Section 3.1.1) and differences (Section 3.1.2).
In contrast to the results of temperature, ERA5 precipitation is selected as the best annually and in all seasons based on Pearson correlations and in summer and autumn as the best based on RMSEs and biases (Figure 8b). In the spatial patterns of the best stations by Pearson correlation coefficients, the ERA5 best stations mainly appear in both of the coastal and inland regions, while those of JRA55 are generally distributed inland. In the results of biases, the numbers of NCEP2 best stations are notably larger than those of Pearson correlations. Particularly, in winter (49.2%) and spring (41%), NCEP2 is selected as the best reanalysis, mostly in northern China. The percentages of best stations of NCEP2 for RMSEs are larger in winter (39.3%) and similar in spring (30.9%) compared to ERA5 and JRA55, but significantly lower in summer (7.1%) and autumn (13.6%). These results imply that the higher RMSEs of precipitation from NCEP2 during the summer monsoon season might come from not capturing well the seasonal variabilities in precipitation. Although the ERA5 best stations were not dominant during winter and spring in the results of RMSEs and biases, the ERA5 performs as the best in all the annual and seasonal means in the results of Pearson correlations. Additionally, during the summer monsoon season, ERA5 represents the highest percentages of best stations in all the three statistics of Pearson correlation (62.4%), RMSE (53.3%), and bias (41.3%). Thus, the results suggest ERA5 is the best reanalysis for representing temporal aspects of EAM rainfall. In addition, ERA5 was dominantly selected as the best dataset for temperature among all the four datasets, including CRU and, for precipitation, the second best after CRU (Figure S3 in the Supplementary Materials).

3.3.2. By Climatological Averages

A Taylor diagram of climatologically averaged temperature (Figure 9a) shows that correlations reached values at 0.9 for all the datasets and also all the annual and seasonal means, except for NCEP2 in summer. Although the differences between the datasets are not prominent, the points of ERA5 are closer to the reference point, indicated by a circle on the X-axis, than those of the other reanalysis data as well as CRU. It represented the lower RMSE values in ERA5 compared to other datasets. Meanwhile, Figure 9b reveals that differences in precipitation correlations between the datasets are much more notable. Among all the datasets, the points of CRU are closest to the reference point, followed by ERA5, JRA55, and NCEP2. It is shown that ERA5 has better representation of climatological averages for summer precipitation than JRA55, though the annual and the other seasonal means are not as significant as in summer. Hence, ERA5 is suggested as the best reanalysis data for reproducing climatological averages of temperatures and precipitations in the EAM region.

4. Discussion

Among ERA5, NCEP2, and JRA55, ERA5 was selected as the most consistent reanalysis data with observational station data of temperature and precipitation in the EAM region for the forty years of 1981 to 2020 (the thirty years of 1981 to 2010 in China). It may be expected that the most recent reanalysis data would be the best due to their high spatio-temporal resolutions, improved assimilations, and an advanced numerical model. However, prior studies comparing and validating reanalyses with observations suggested that ERA5 may have some discrepancies with observations, especially in the high altitudes. For instance, Zhang et al., (2021) compared the various reanalysis data, including ERA5, JRA55, NCEP1, NCEP2, MERRA, 20CR, and CRA40, with urbanization bias-corrected observations in mainland China for the period of 1979–2015 [6]. The results revealed that Pearson correlation coefficients and standard deviation ratio values of temperature from ERA5 at high altitudes above 1500 m were lower than those from JRA55 and CRA40. The uncertainties in ERA5 were also found in a study comparing ERA5 precipitation data with gridded station observations in mainland China for the period of 1979–2018 [
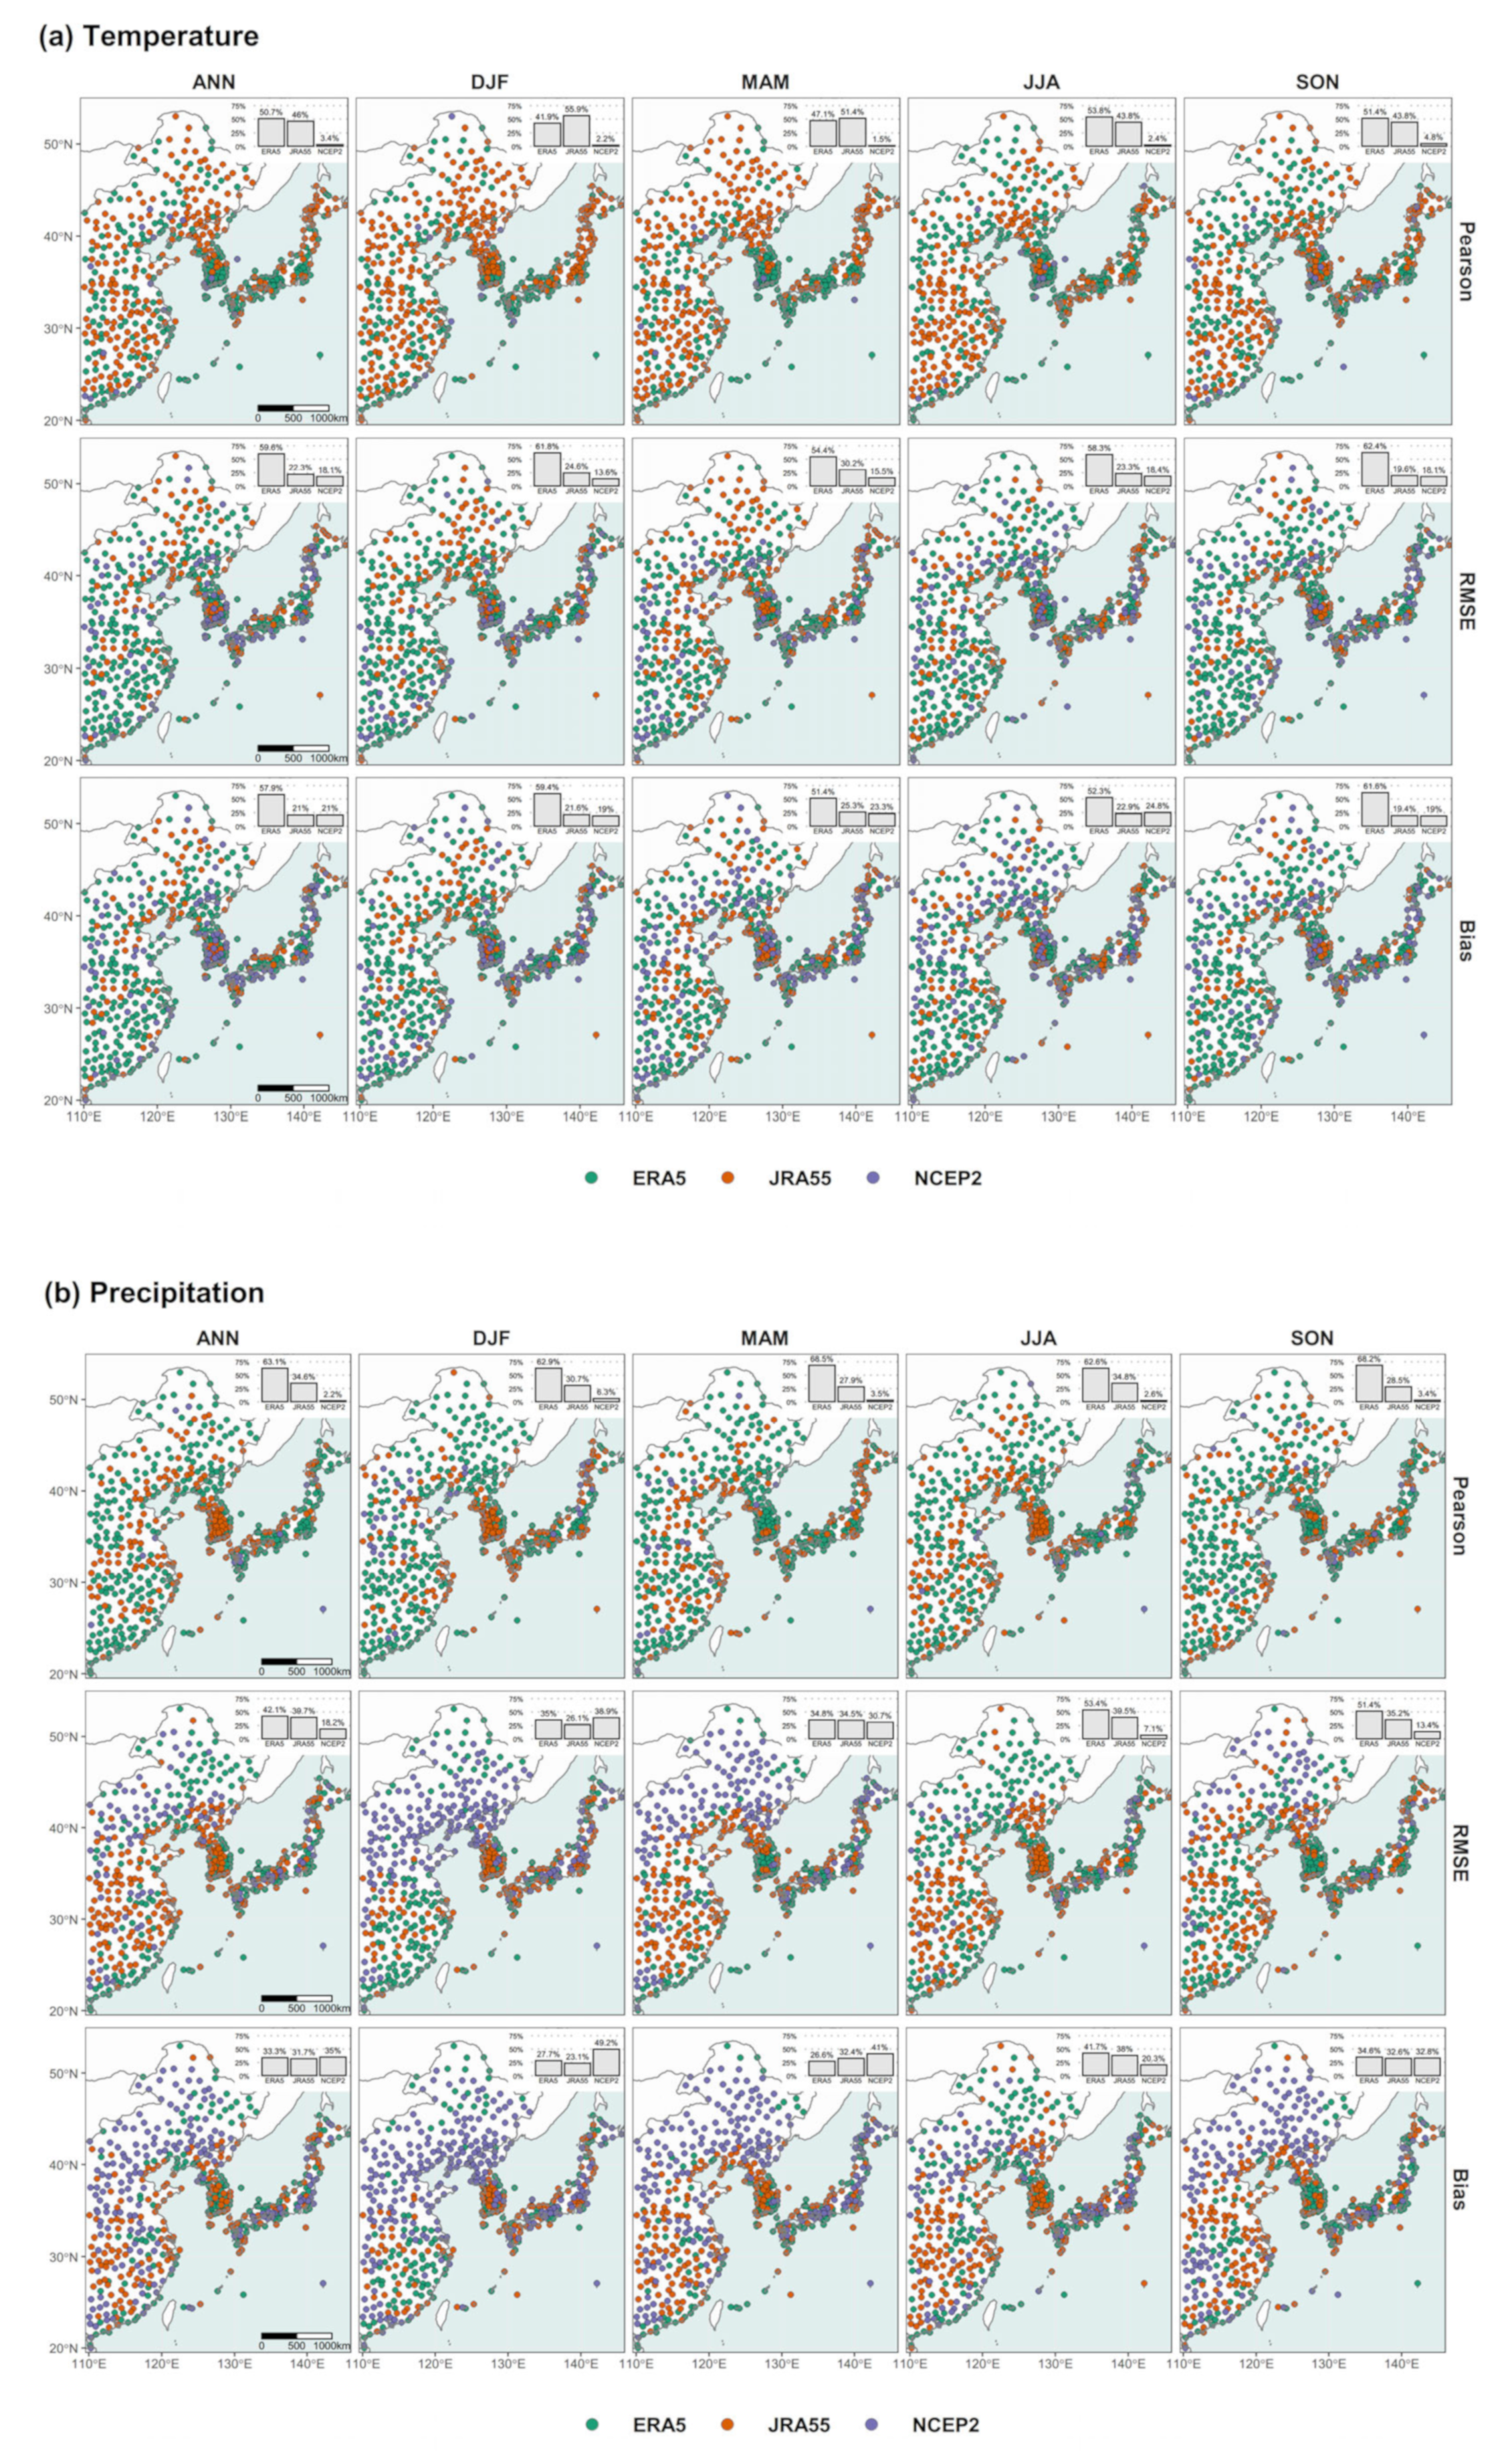
26]. The results showed good agreement between ERA5 and observations in the elevations below 1000 m, but significant differences in the regions of elevations above 4000 m. These results could be confirmed in our study as well. In Figure 8a,b, ERA5 best stations dominated in the coastal regions of China, supported by [8], and the relatively lower elevations in other countries. As our study region does not include the high elevated regions of western China, ERA5 could outperform JRA55 and NCEP2 in the EAM region, in contrast to the previous studies on the entirety of China.
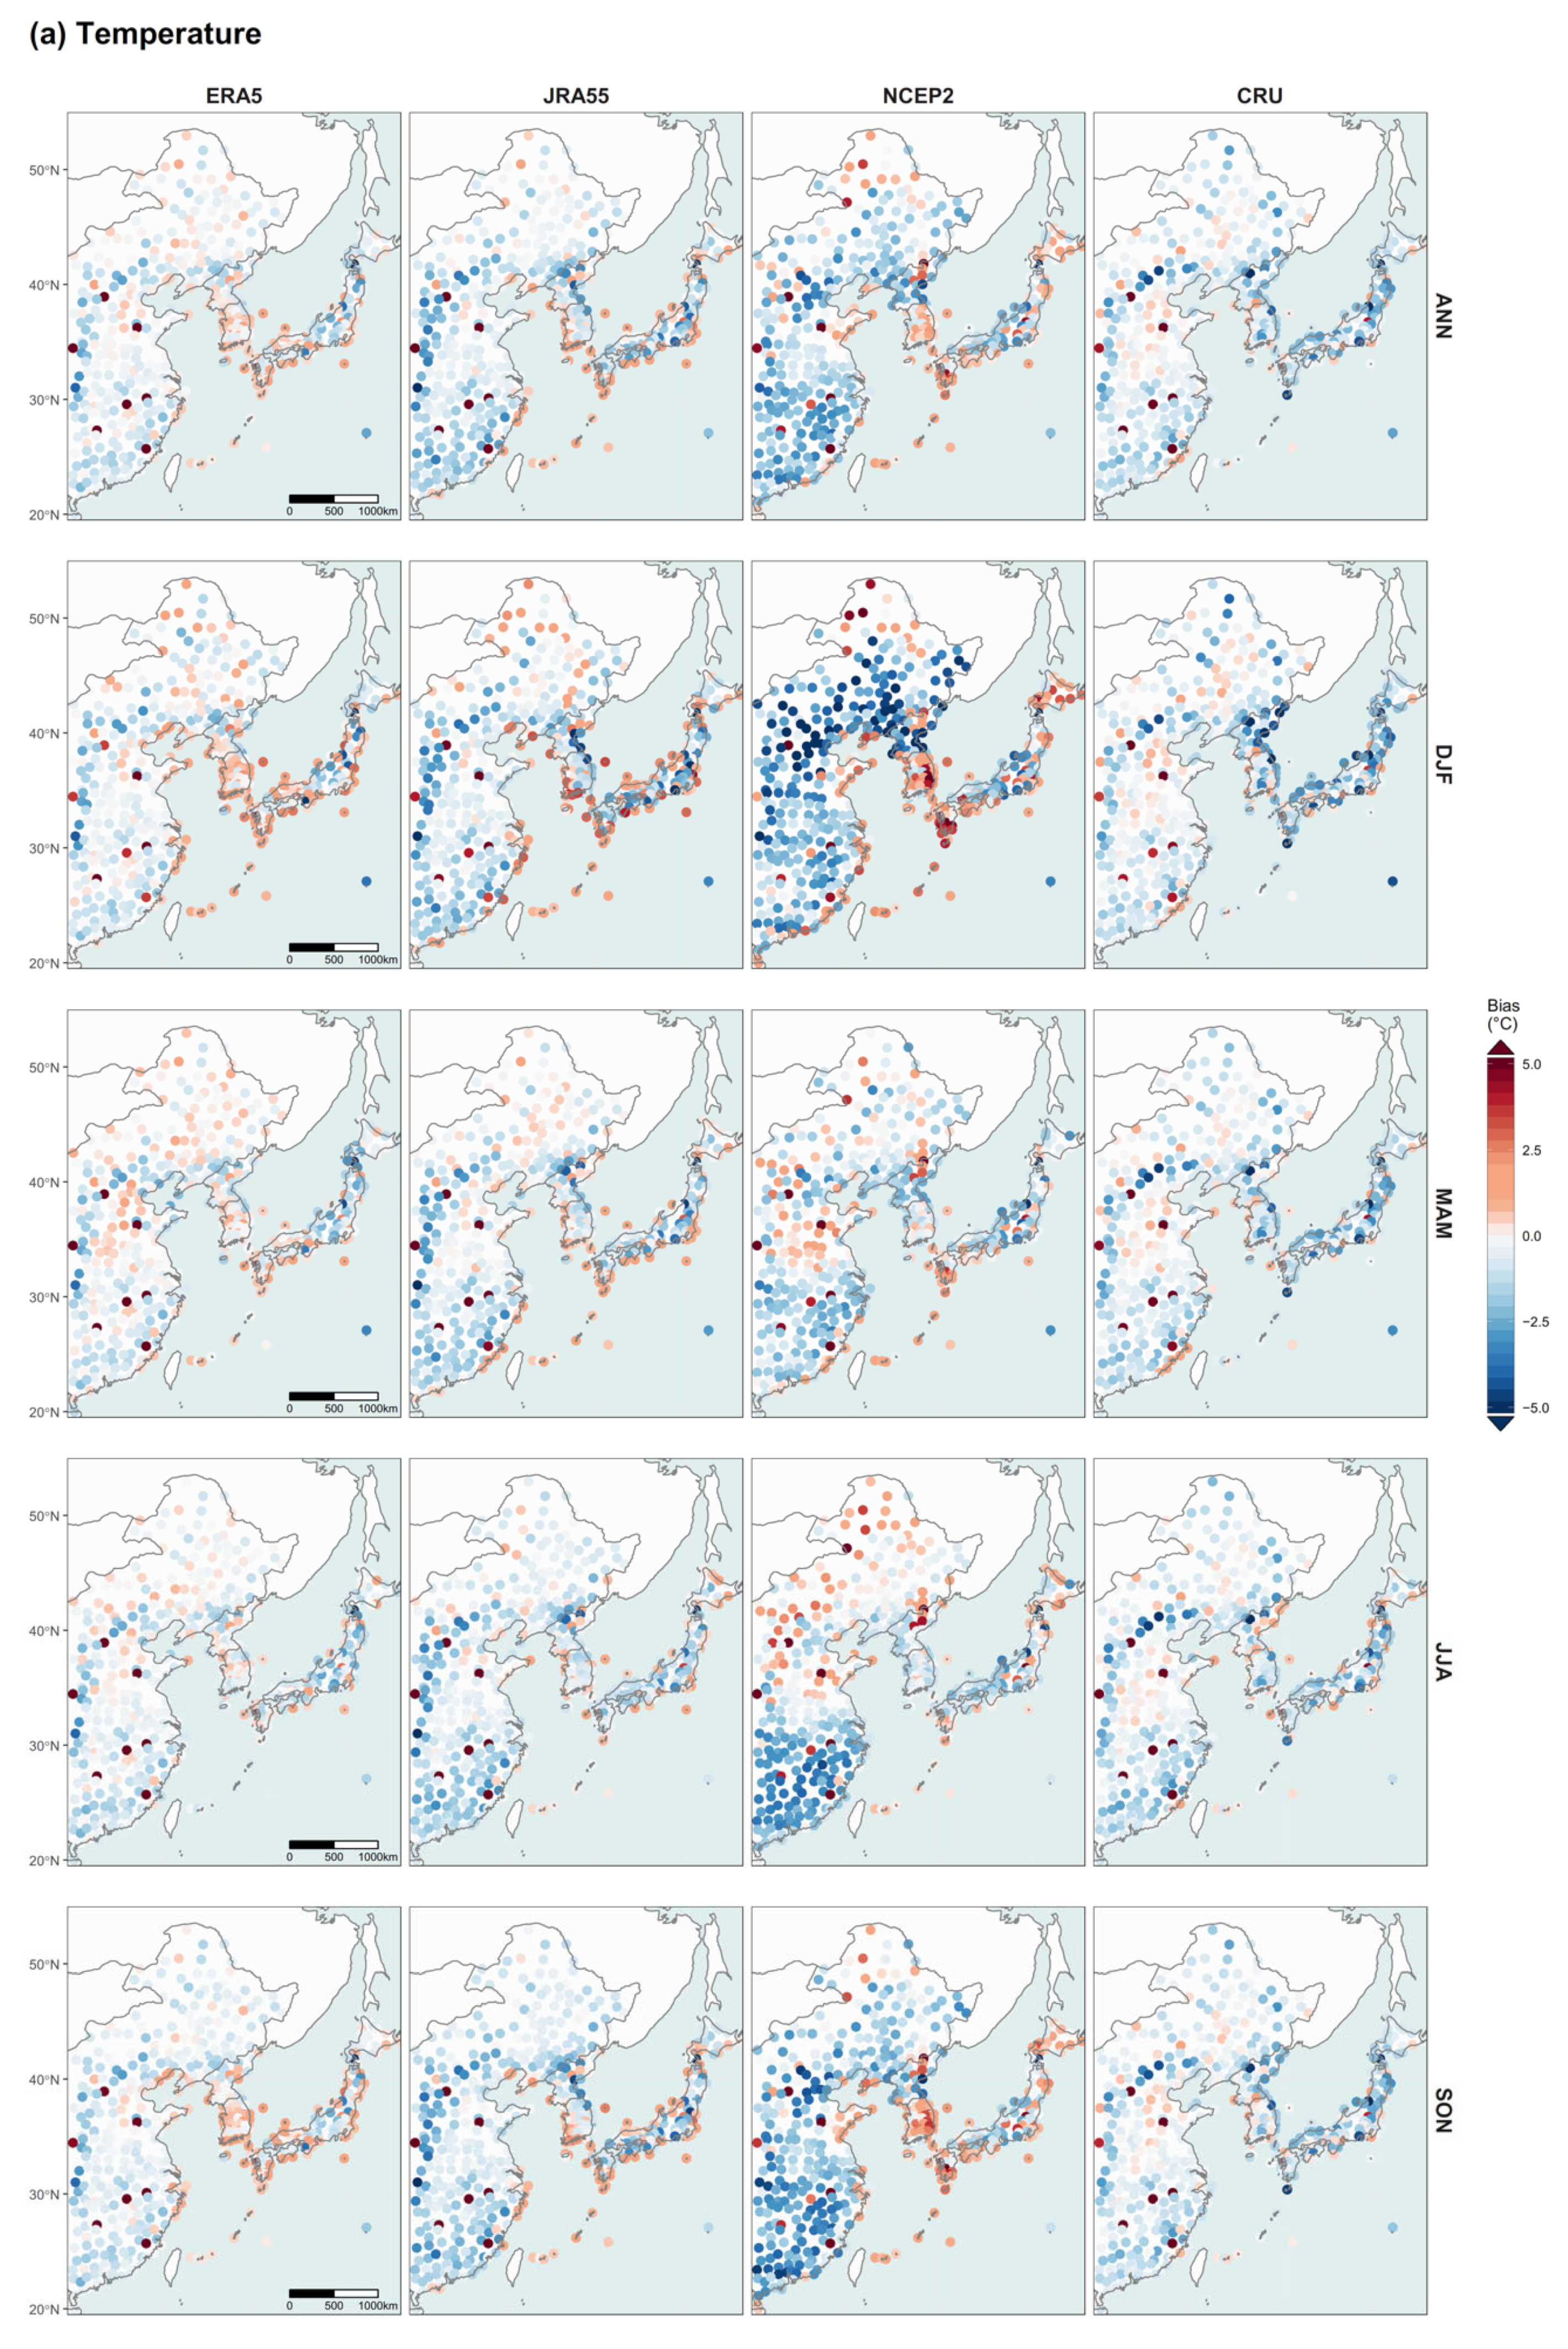
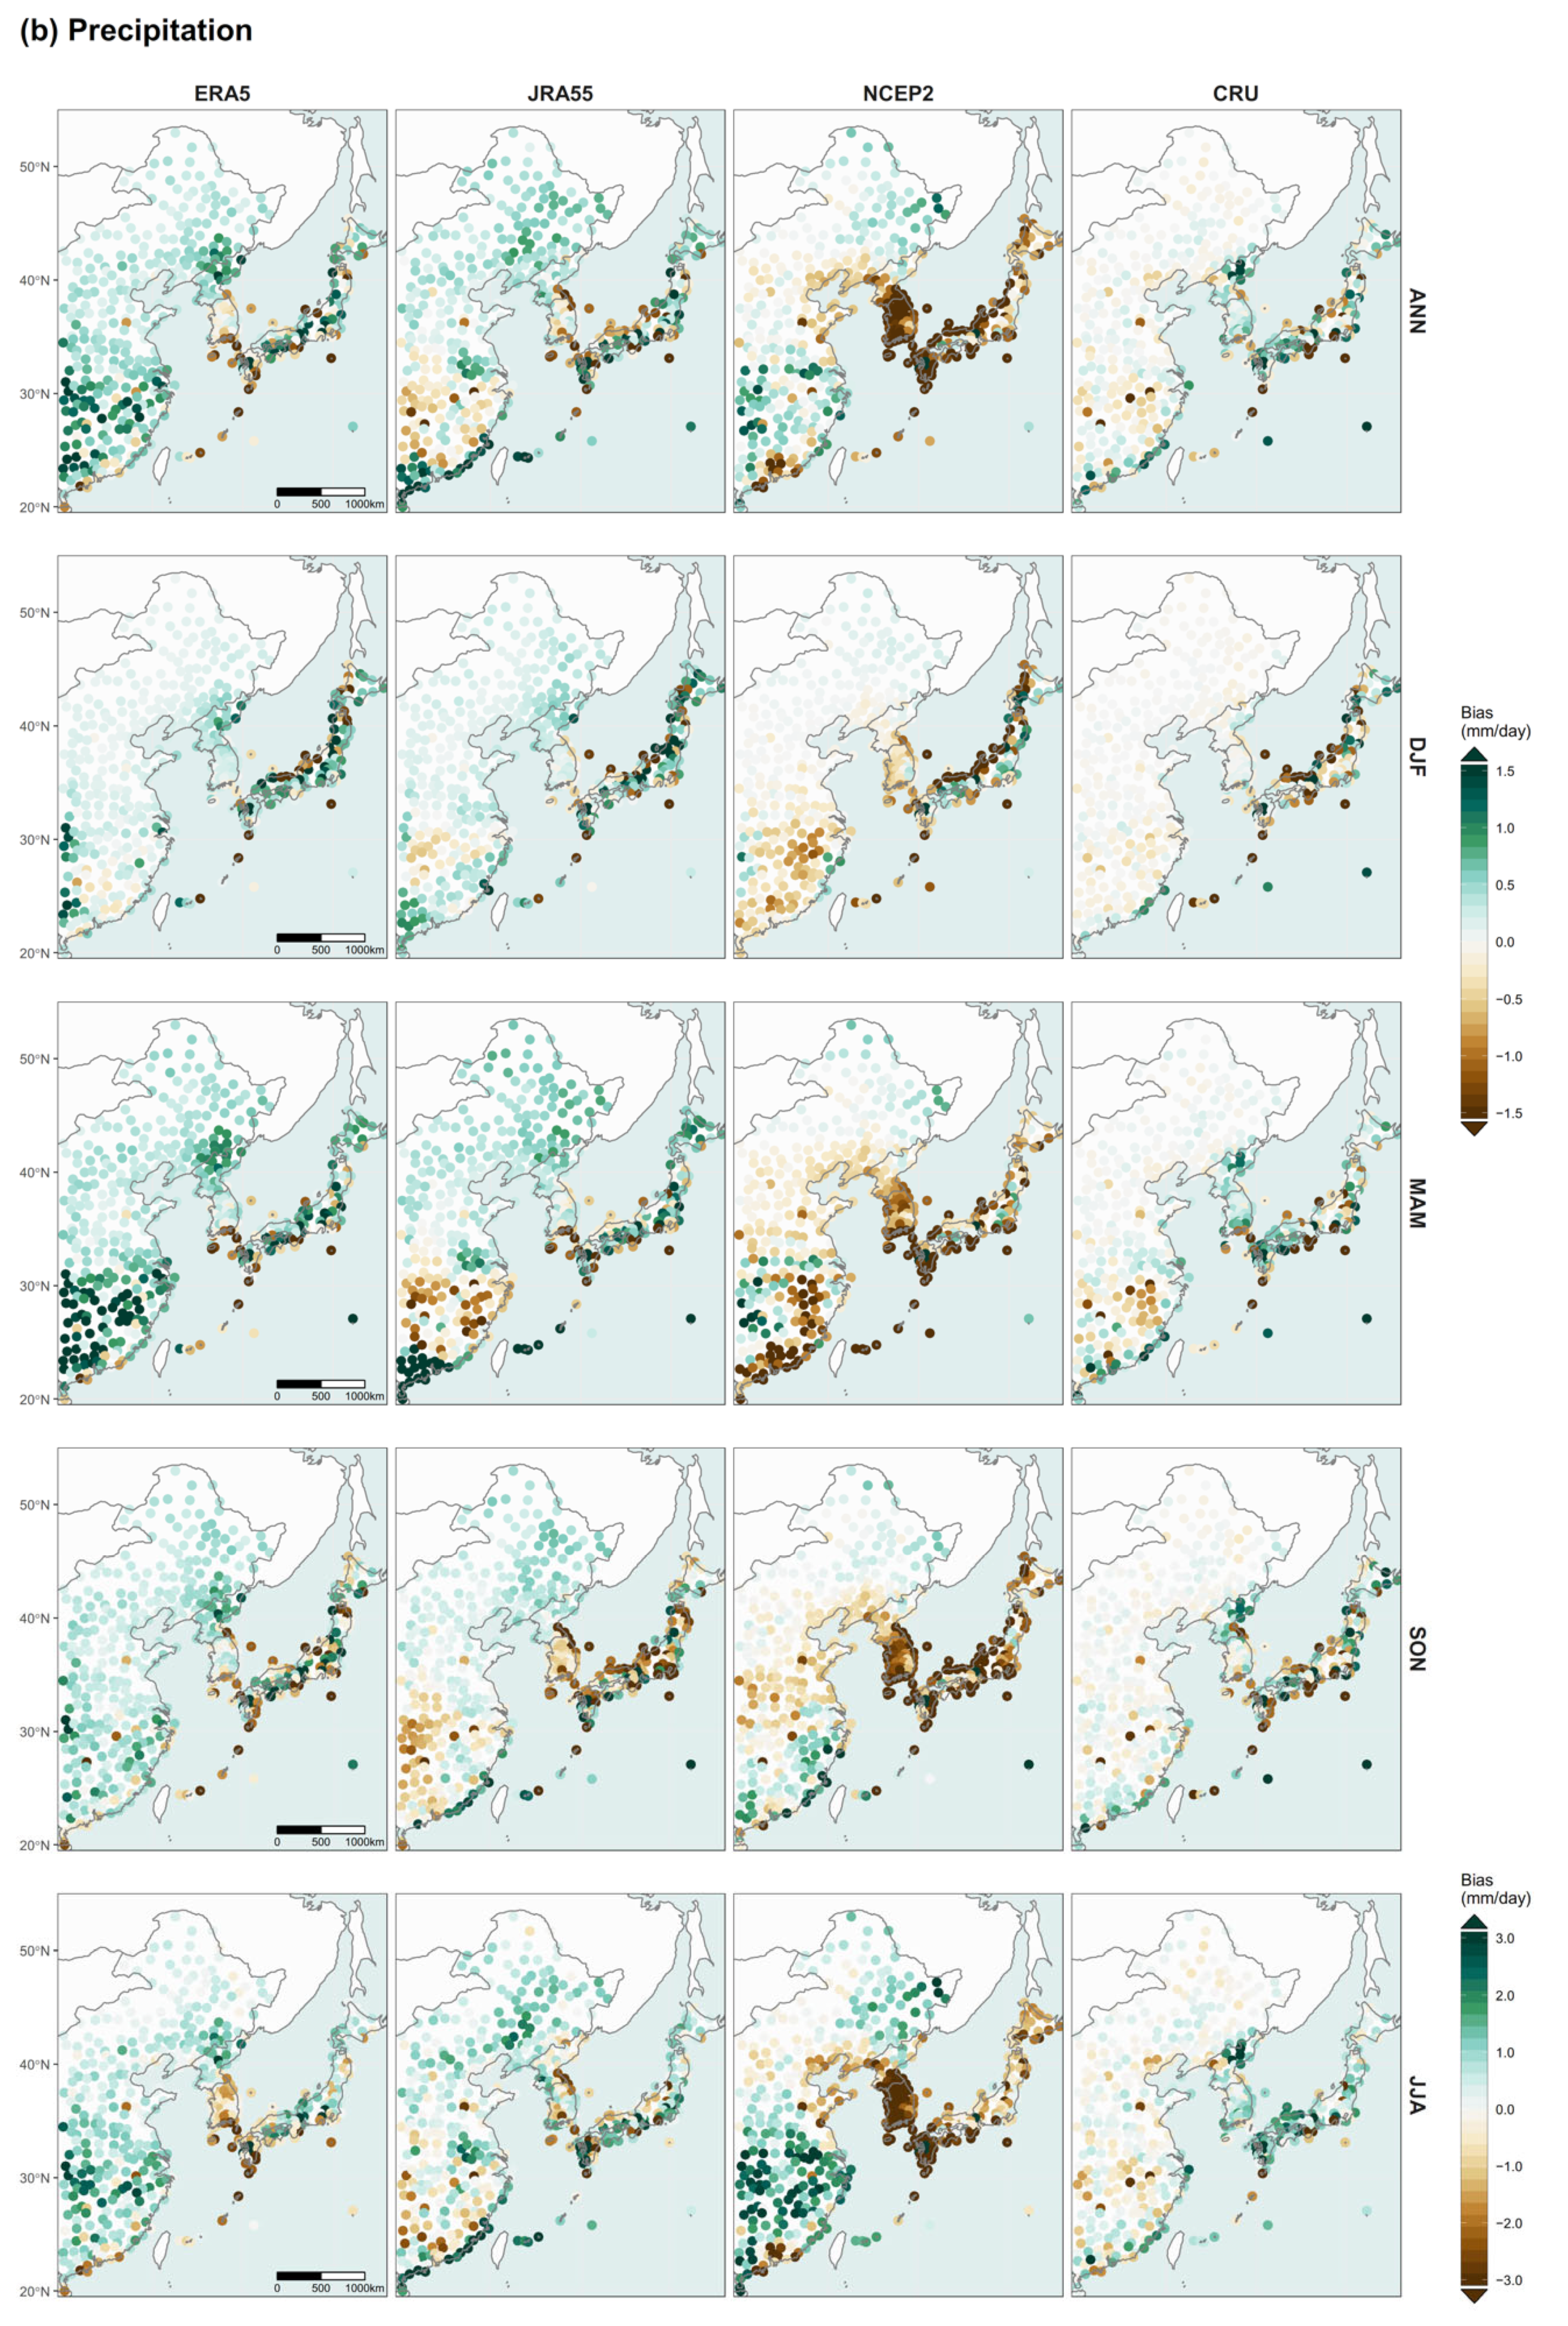
In this study, we also aimed to figure out inherent systematic biases of reanalyses and their potential causes to enhance the performances. The spatial distributions of positive (negative) biases vary by seasons and locations as shown in Figure 6a,b. There are several reasons for the local, regional, and global uncertainties and biases in the reanalysis datasets. Previous studies found that the bias of temperature in between reanalyses and observations in mainland China was associated with elevations [6,21,23]. Surface warming mainly caused by global warming is amplified in high-altitude regions due to their sensitivity to the warming effect and, thus, its underestimation in the numerical model would be possible [6,20,42]. In our study, cold biases were clearly identified in the mountainous regions of Inner Mongolia, for which the reanalyses need to be improved to estimate the elevation effect on temperature under a warming climate. In the mountainous regions of Inner Mongolia and of the borders between China and North Korea, the cold biases in ERA5 are much less than those in NCEP2 and JRA55. One possible reason could be the better representations of terrain models and higher spatial resolutions used in ERA5, which can be better in estimating the elevation effect on temperature. In addition to the elevation effect, the warming effect of vegetation in the high-altitude regions [43] might enhance the cold biases in the climate reanalysis. In the mountainous regions of Inner Mongolia, the forests have significantly increased over 1982–2015 since the large-scale afforestation policy was implemented by the Chinese Government [44]. According to Wang and Zeng (2013), the land surface scheme adopted by the reanalysis and atmospheric boundary layer turbulence can strongly affect the qualities of reanalysis temperature data [45]. Considering ERA5 with the improved land surface schemes, including soil texture map, seasonally varying monthly vegetation maps specified from a MODIS-based dataset and more satellite imageries, these applications in the model may be attributed to diminish cold biases in the mountainous regions of Inner Mongolia [8]. As the human-induced land cover and land use (LCLU) changes have been significantly extended and intensified in the EAM region, the LCLU changes can affect not only air temperature (e.g., [43]) but also the summer monsoon precipitation (e.g., [18]). Therefore, the advancements in assimilation processes with the higher spatio-temporal resolutions of LCLU maps and numerical modeling for the LCLU effects on climates are important in accurately estimating the climate variables of reanalyses.
As for the systematic biases of precipitation, in ERA5, the significant wet biases appeared in the humid regions of southern China during spring and summer, which were different from JRA55 and CRU with dry biases and wet–dry random biases (see Figure 6b). The contrasting result is consistent with those of previous studies as Amjad et al., (2020) identified that ERA-Interim overestimated the frequency of precipitation by over-compensating dry biases in humid areas [46]. Some studies suggested that ERA5 could detect rainfall events and reproduce their spatio-temporal distributions, but generally overestimated hourly and daily precipitation in terms of the frequency (e.g., [5,47]). In previous studies, it was also described that ERA5 as well as other reanalyses were useful in representing frontal precipitation in dry seasons, compared to local convective precipitation in the wet season [5]. The biases of precipitation could be associated with several reasons, such as complex topography, unreliable input data, and the flaws of numerical models in simulating precipitations of various formation types [48,49,50]. Particularly, the monsoons as the regional climate phenomena can induce the precipitation biases in reanalysis data [31].
The reanalysis biases could also have originated from the uncertainties in observational station data. The spatial inconsistency of stations, the difference in station environments with surrounding areas, mismanaging measurement, and the changes in the number of the observational stations could affect the reliability of observational data [3,4,5,6]. For instance, the high temperatures due to the urban-island effect can increase uncertainties and biases in the observational data as well as input data for data assimilation and, thus, reanalyses [6,20]. In addition, the errors involved in gauge measurement, such as the effect of wind, splashing, evaporations, and condensations, are counted as the global factors in underestimations of precipitation observations [5]. It is obvious that these observation-related errors need to be considered in evaluating the reanalysis data.

5. Conclusions

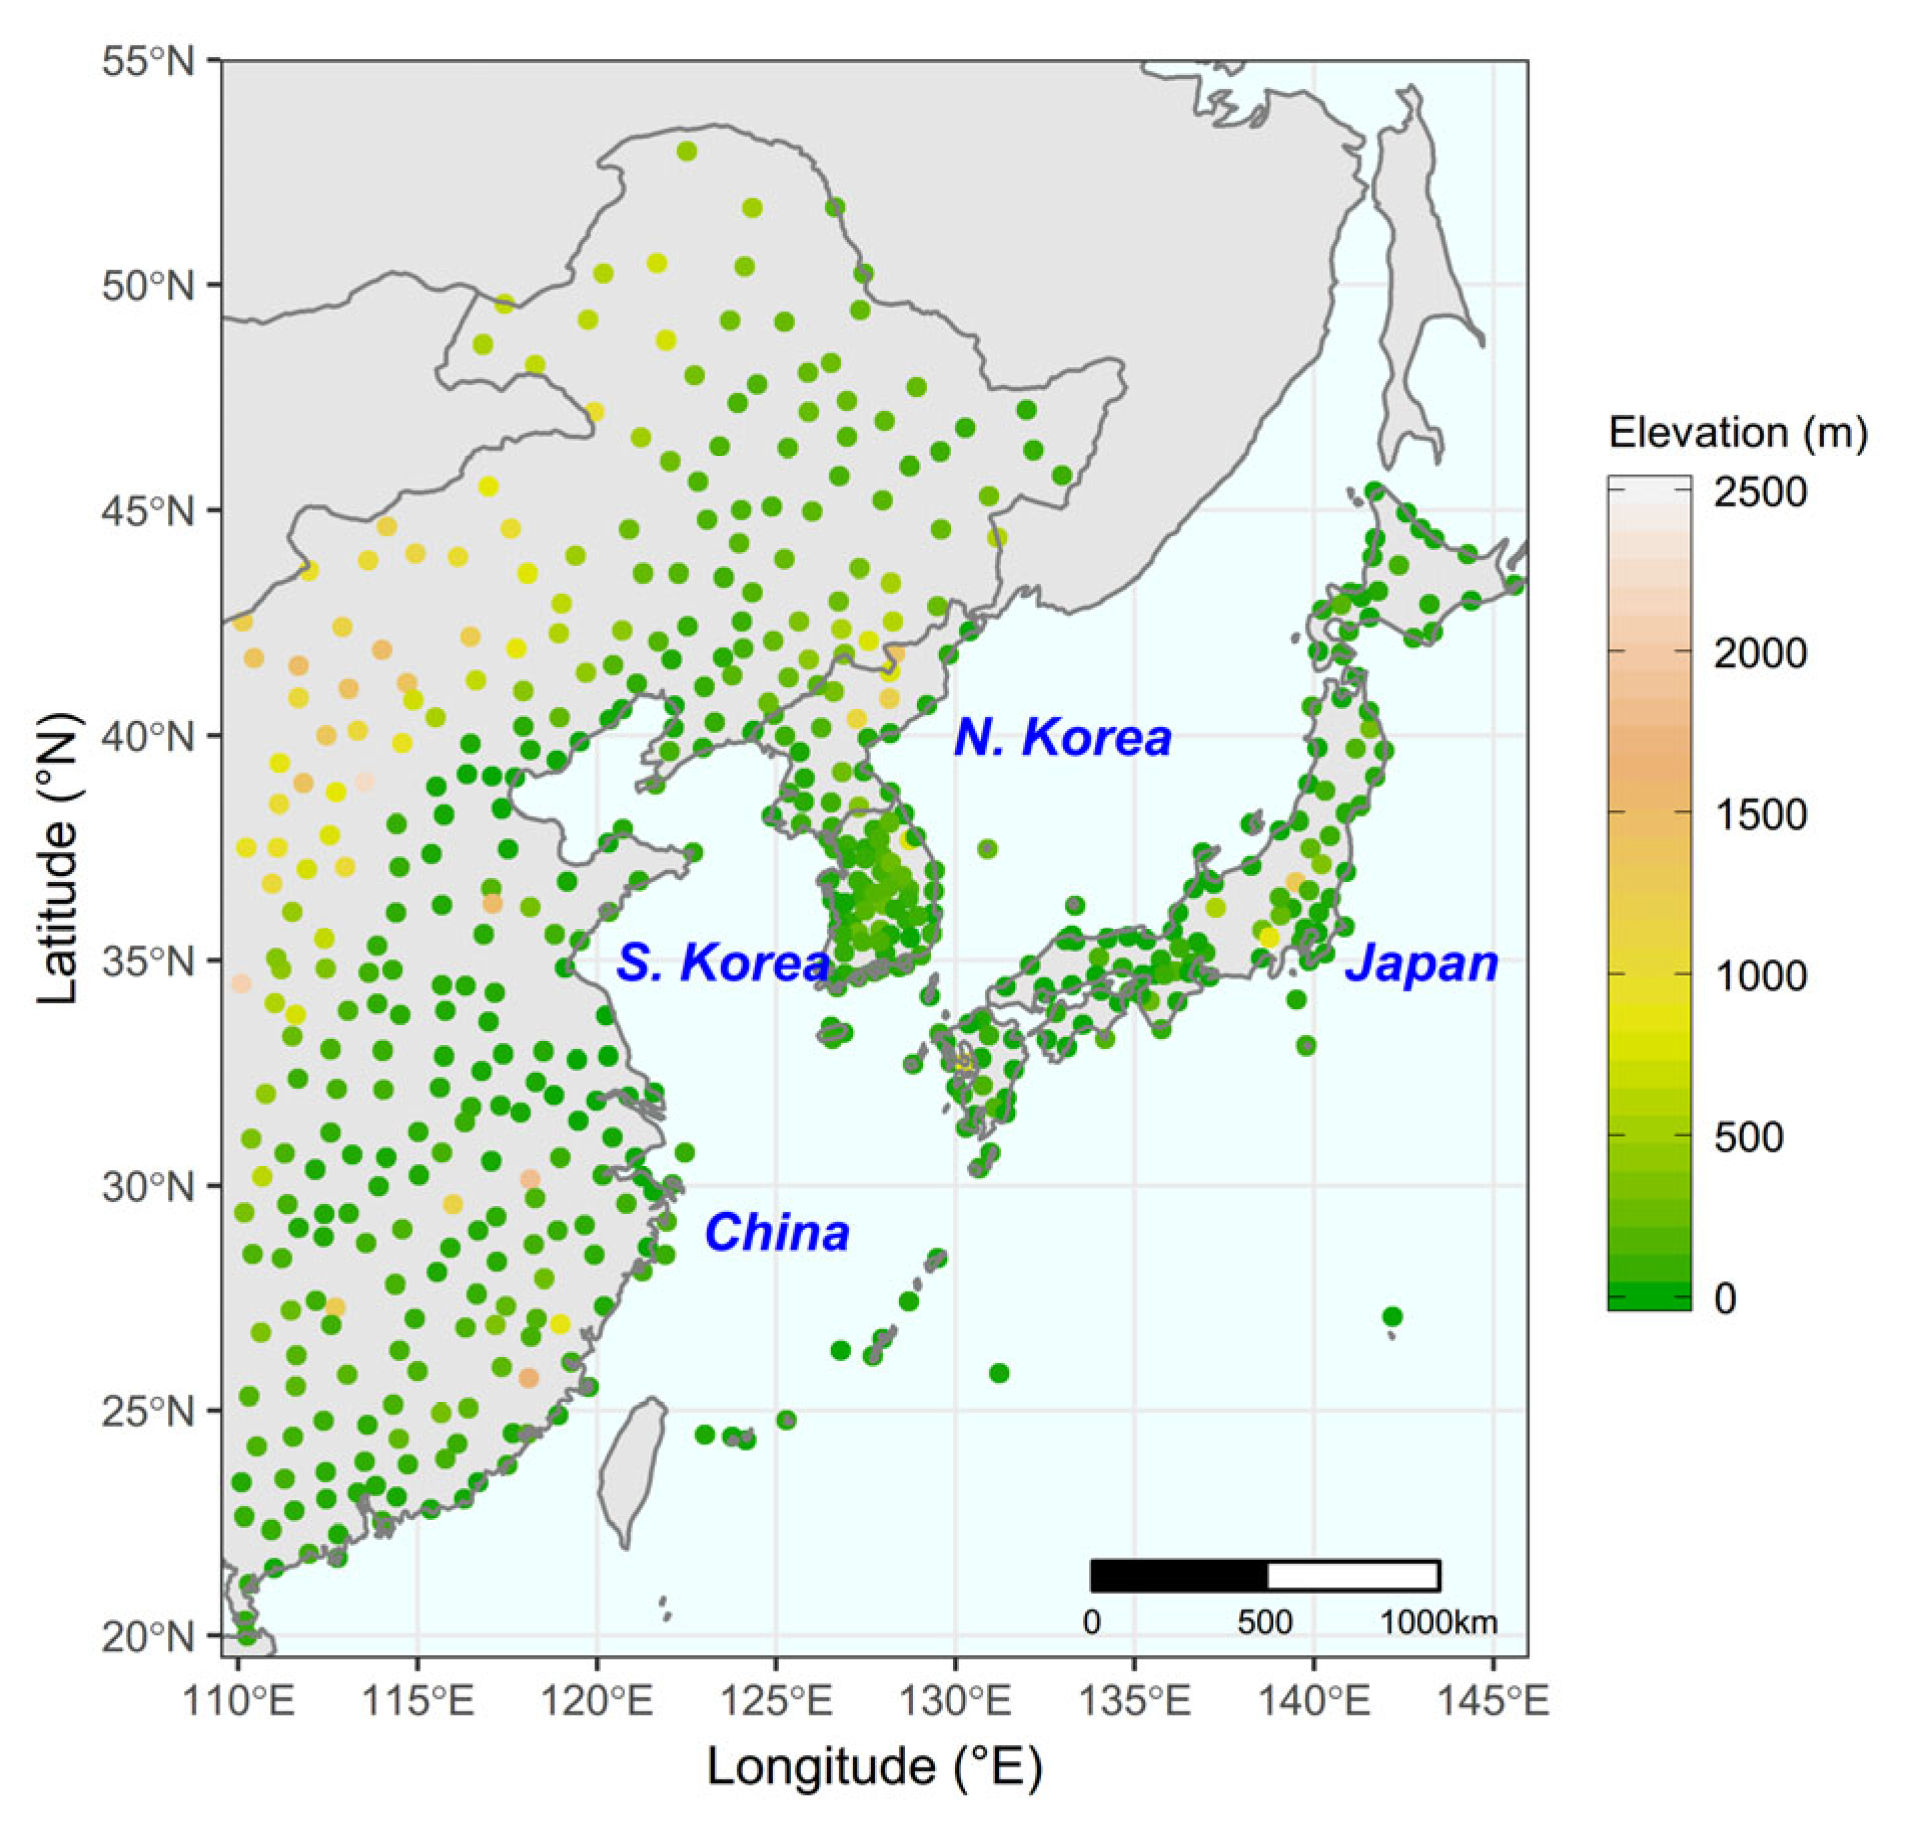
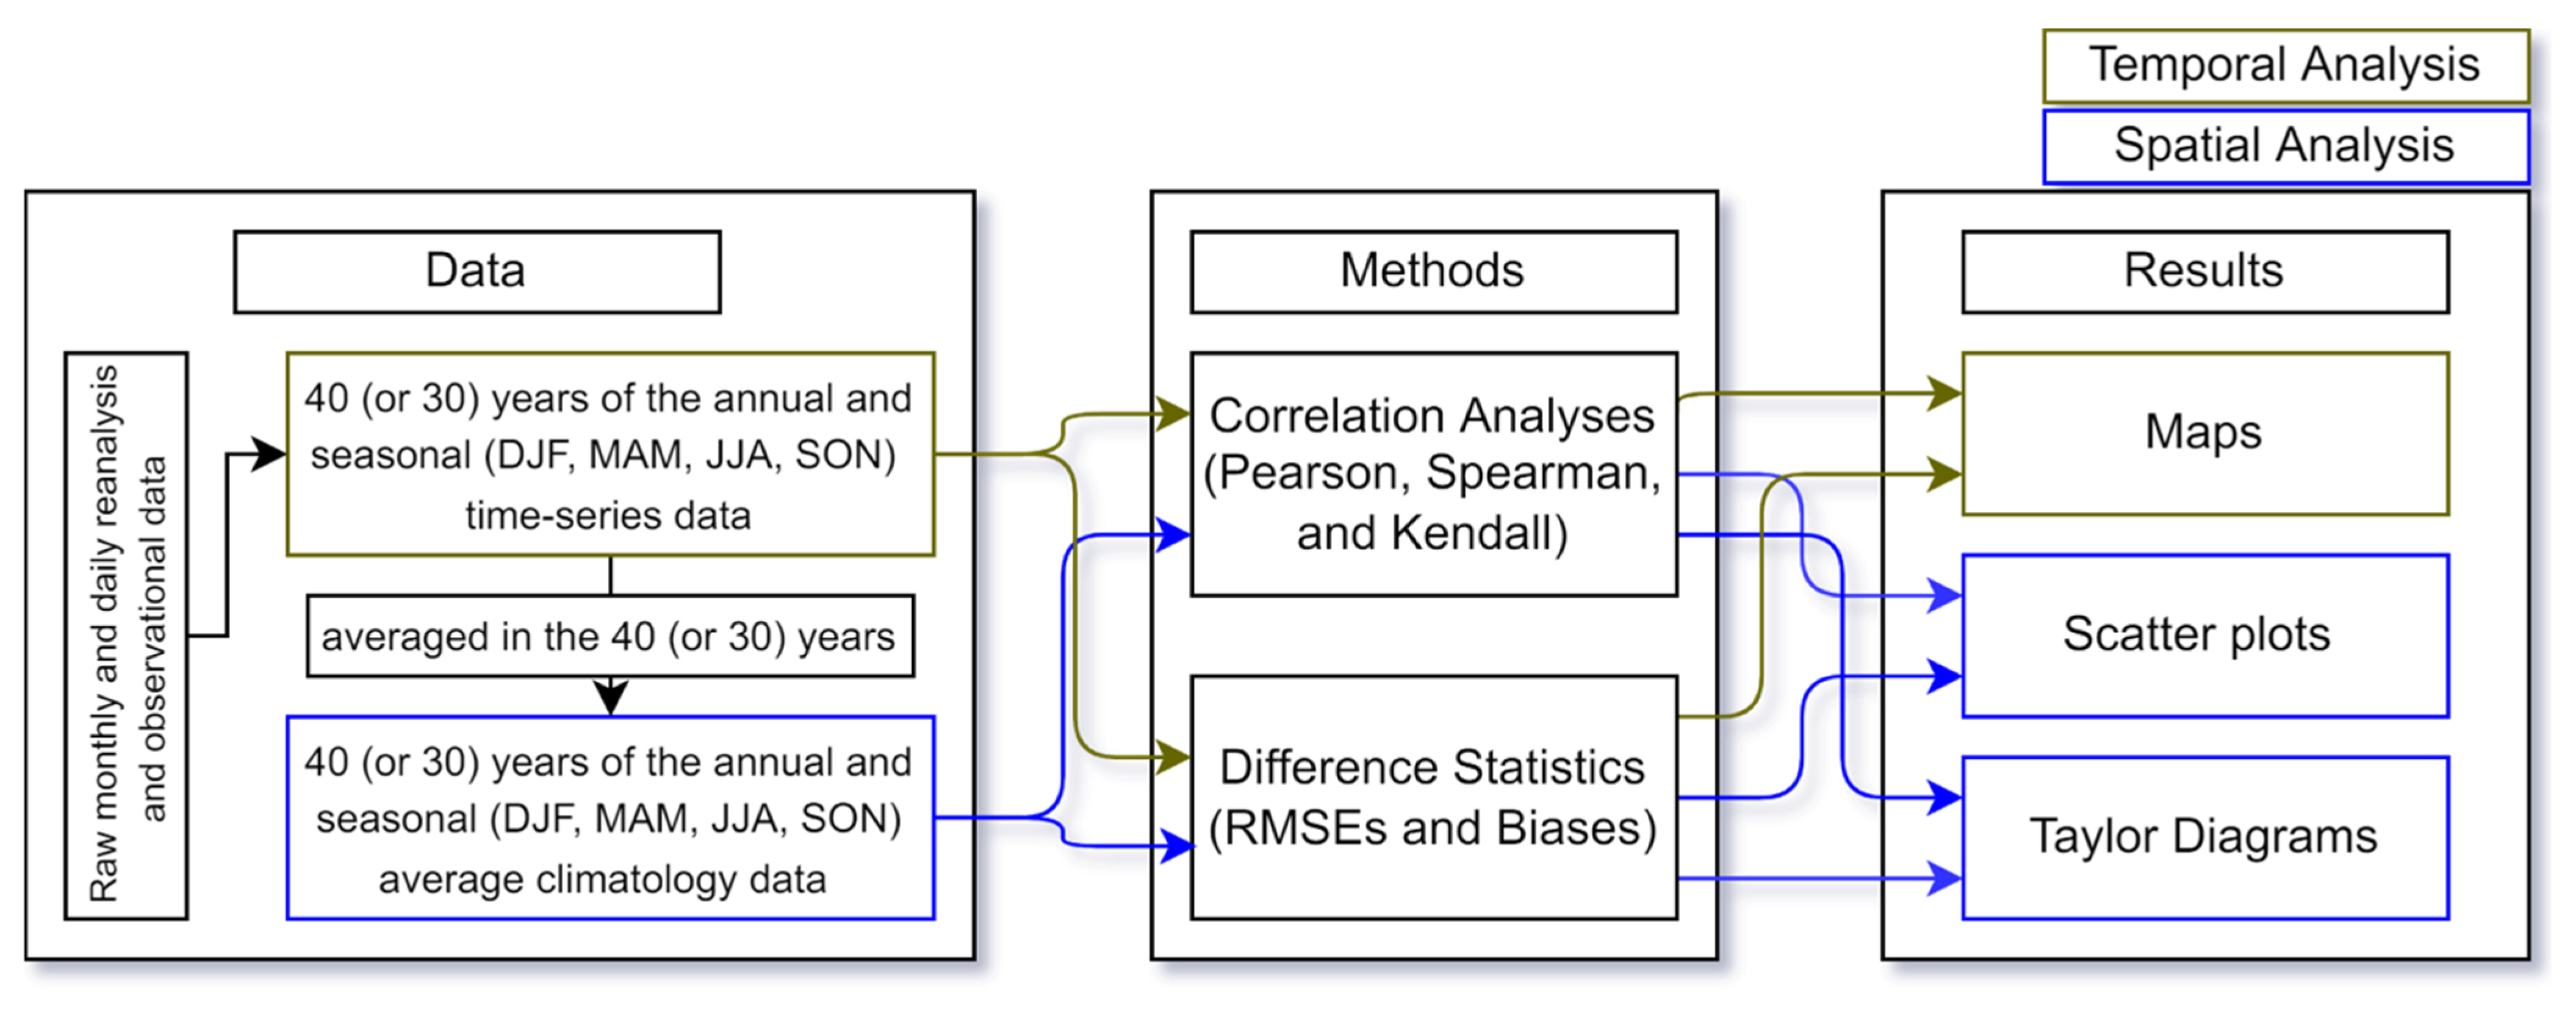
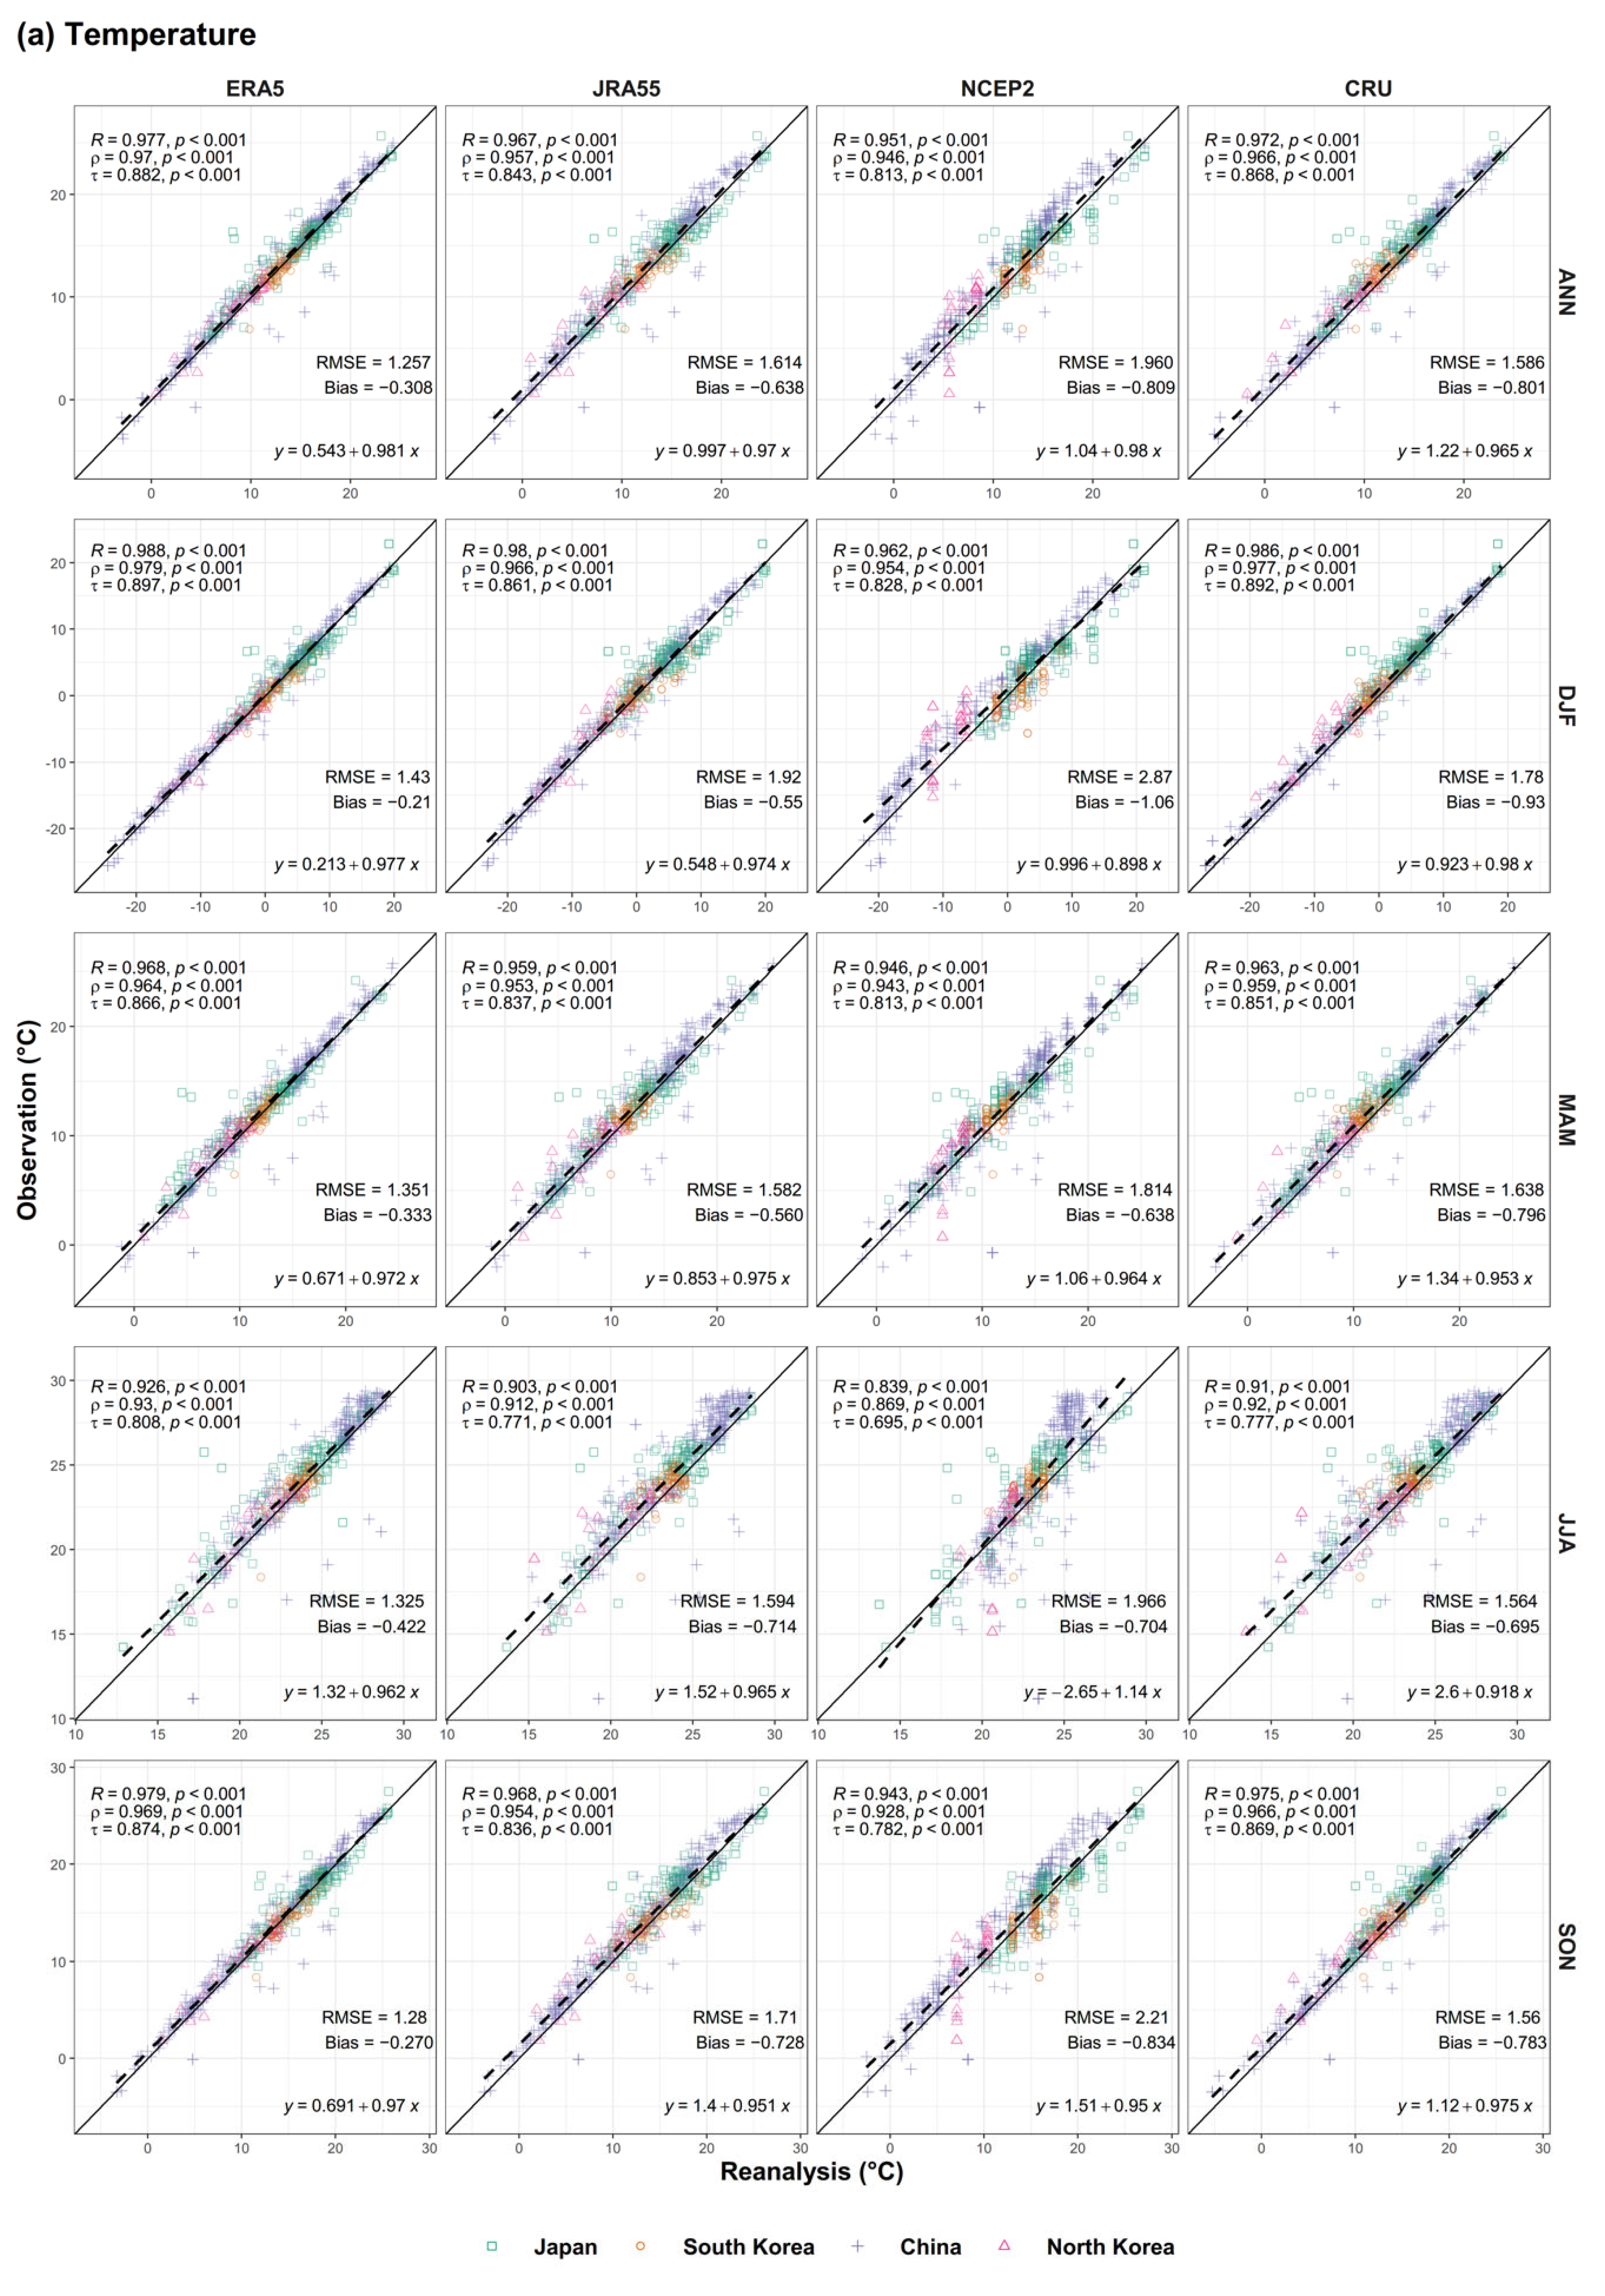
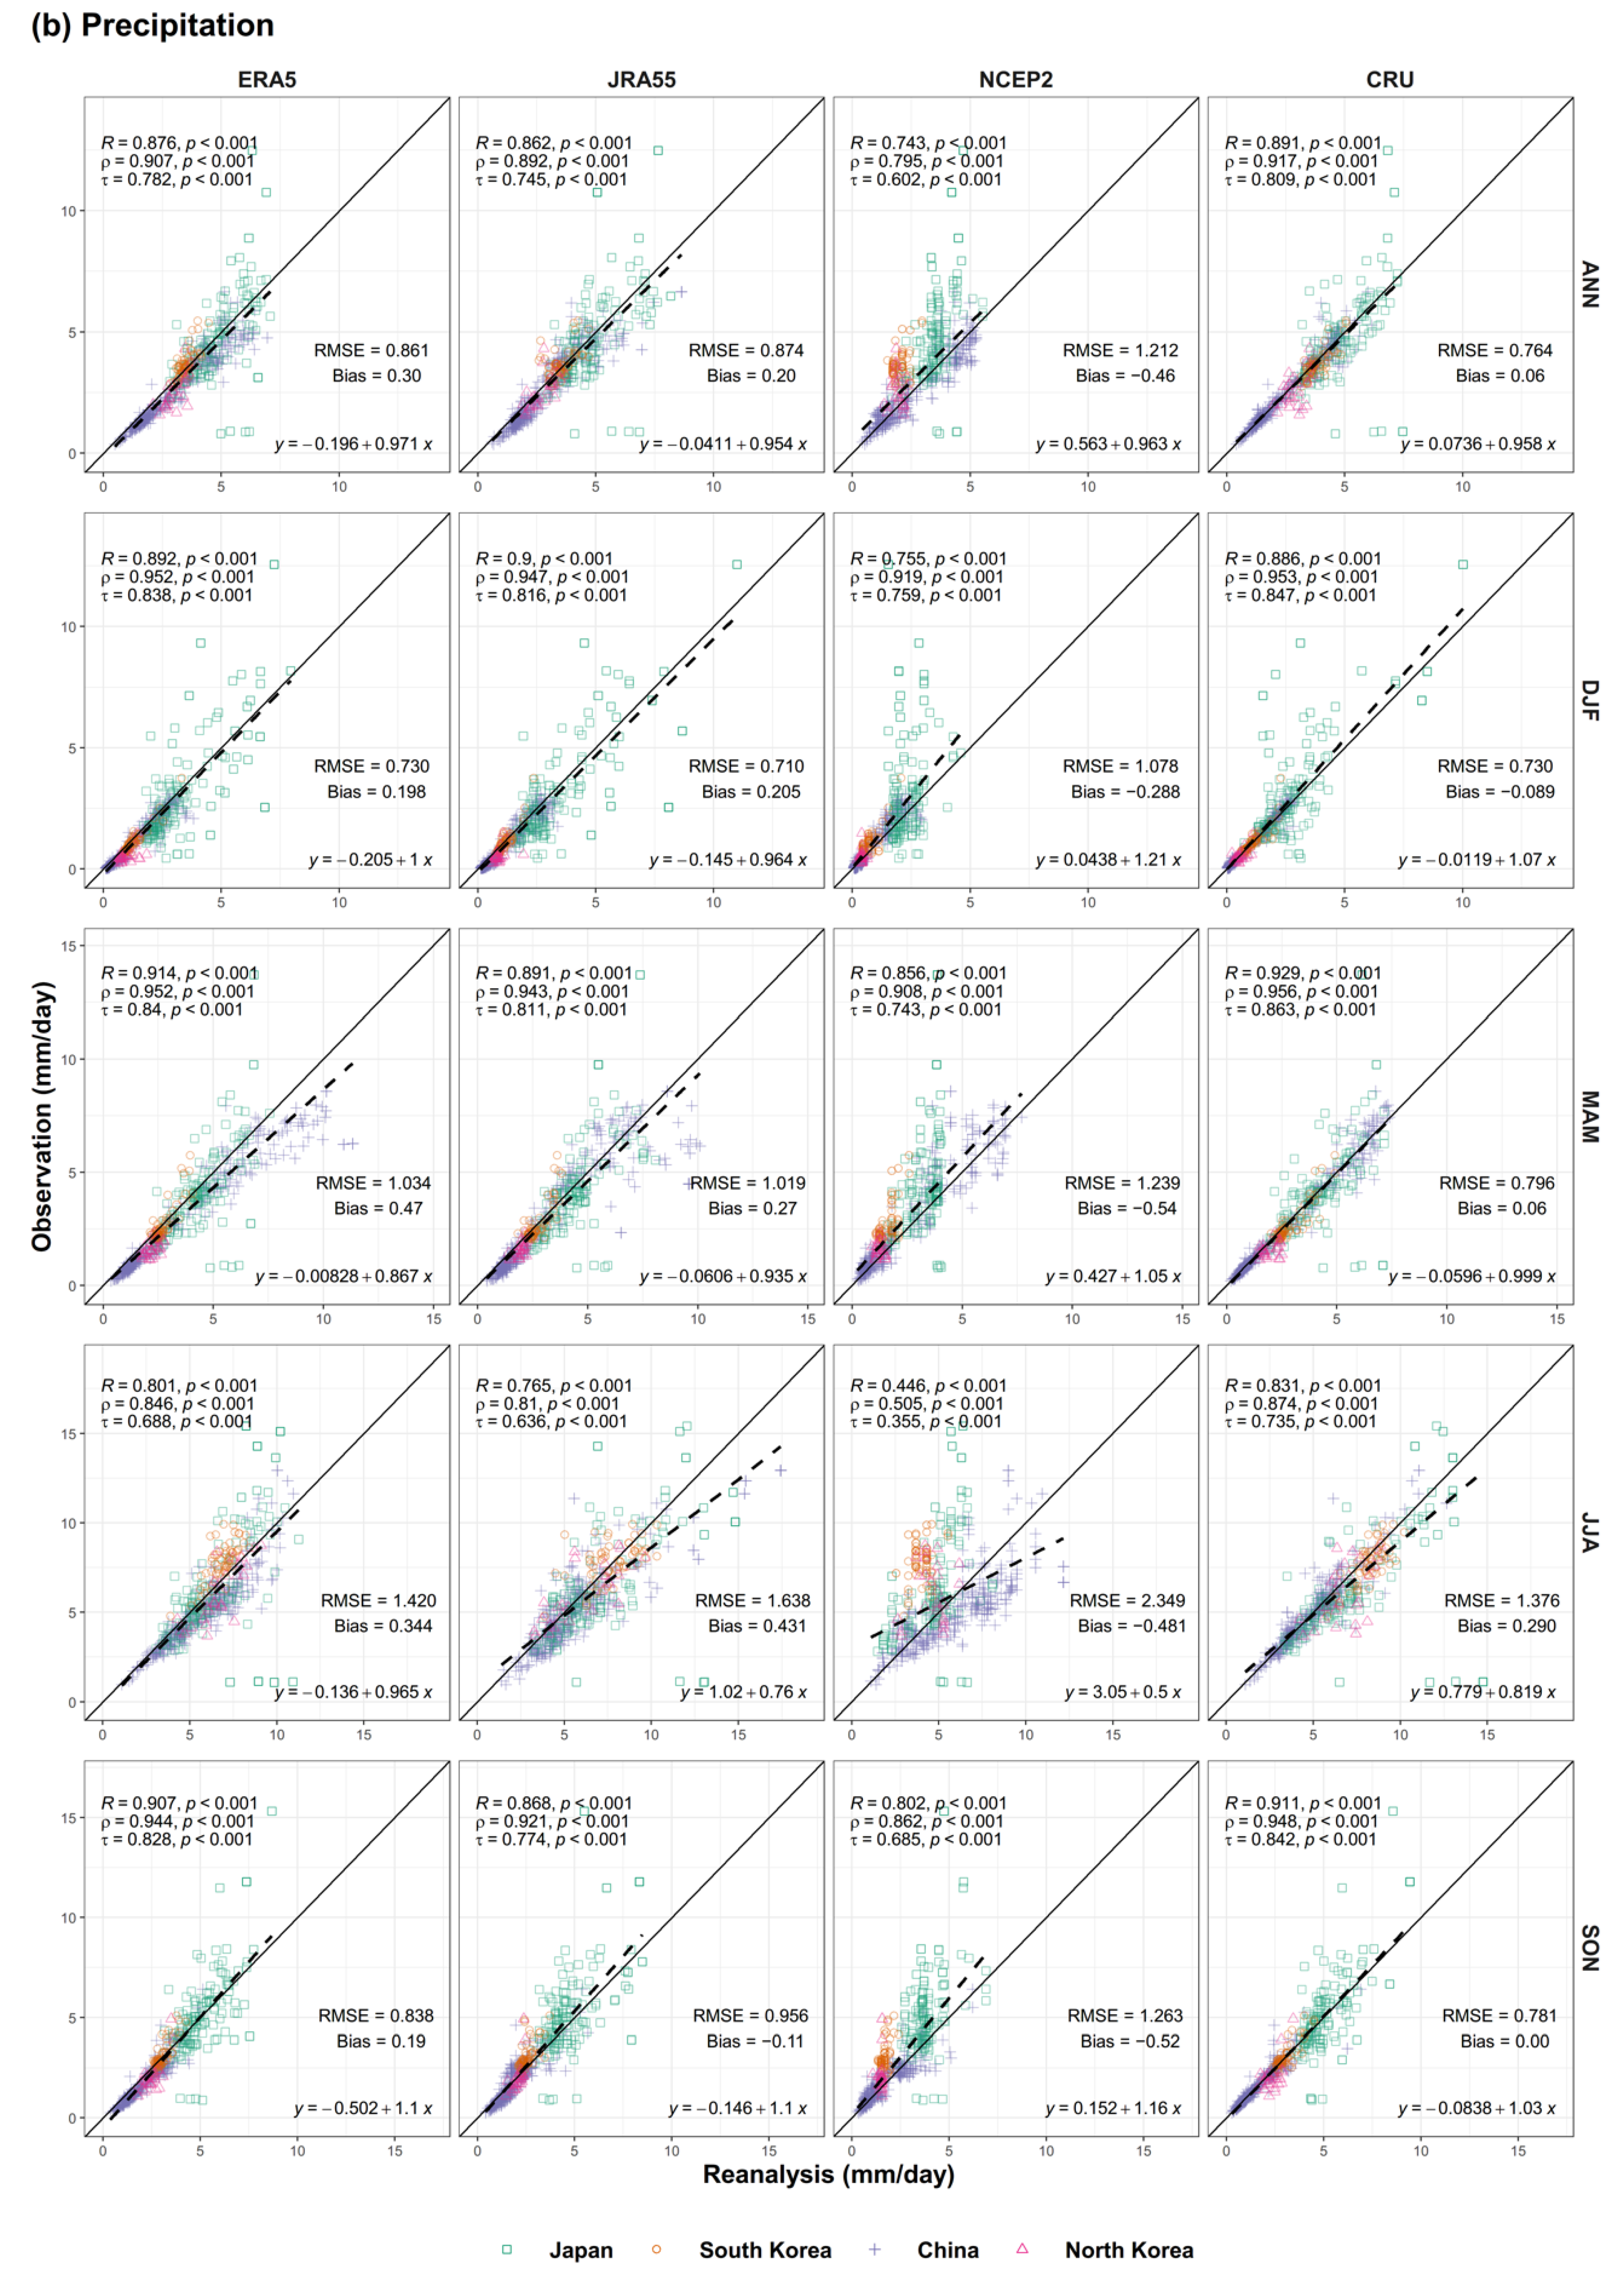
This study evaluated the performance of temperature and precipitation from climate reanalysis data, both in spatial and temporal domains. The sets of the reanalysis data (ERA5, JRA55, and NCEP2) and CRU were evaluated in terms of correlation coefficients (Pearson, Spearman, and Kendall) and difference statistics (RMSE and bias), comparing the annual and seasonal temperature and precipitation from the three reanalyses and CRU with those from the total of 537 weather stations in the EAM region over the forty years of 1981–2020 in North Korea, South Korea, and Japan and the thirty years of 1981–2010 in China. Based on the spatio-temporal patterns of correlation coefficients, RMSEs, and biases and also Taylor diagrams, the potential uncertainties in the reanalysis data were identified.
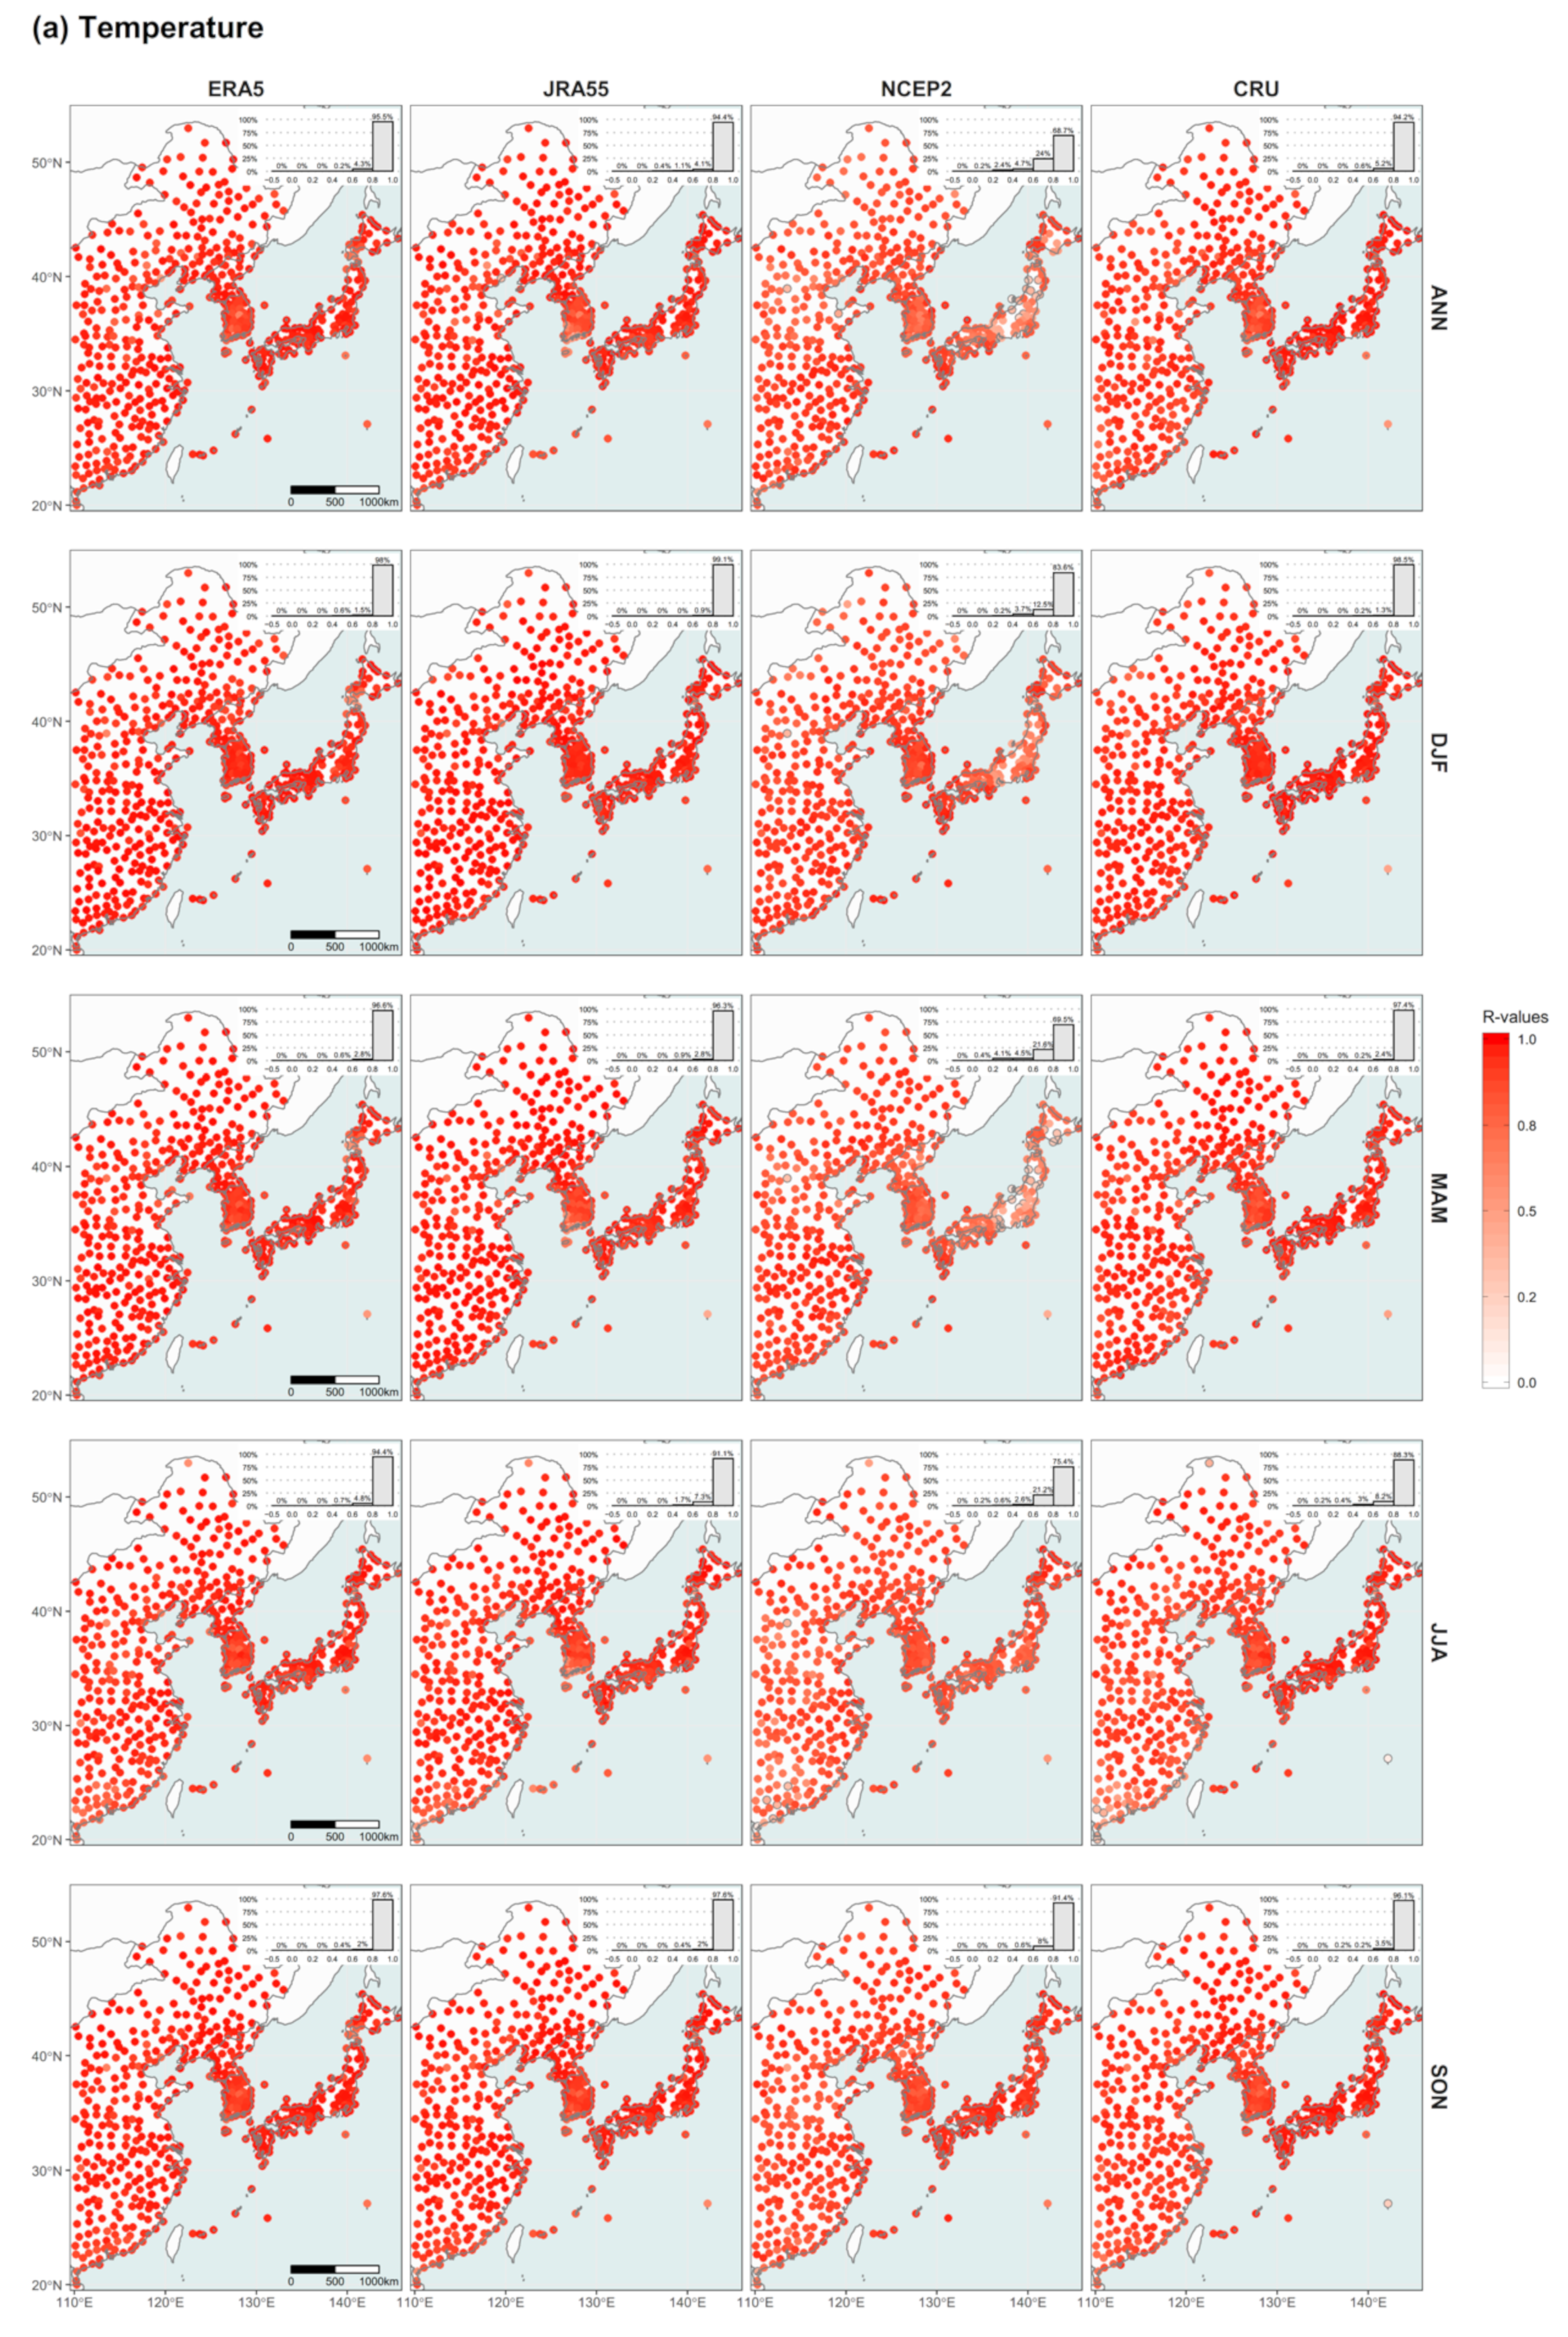
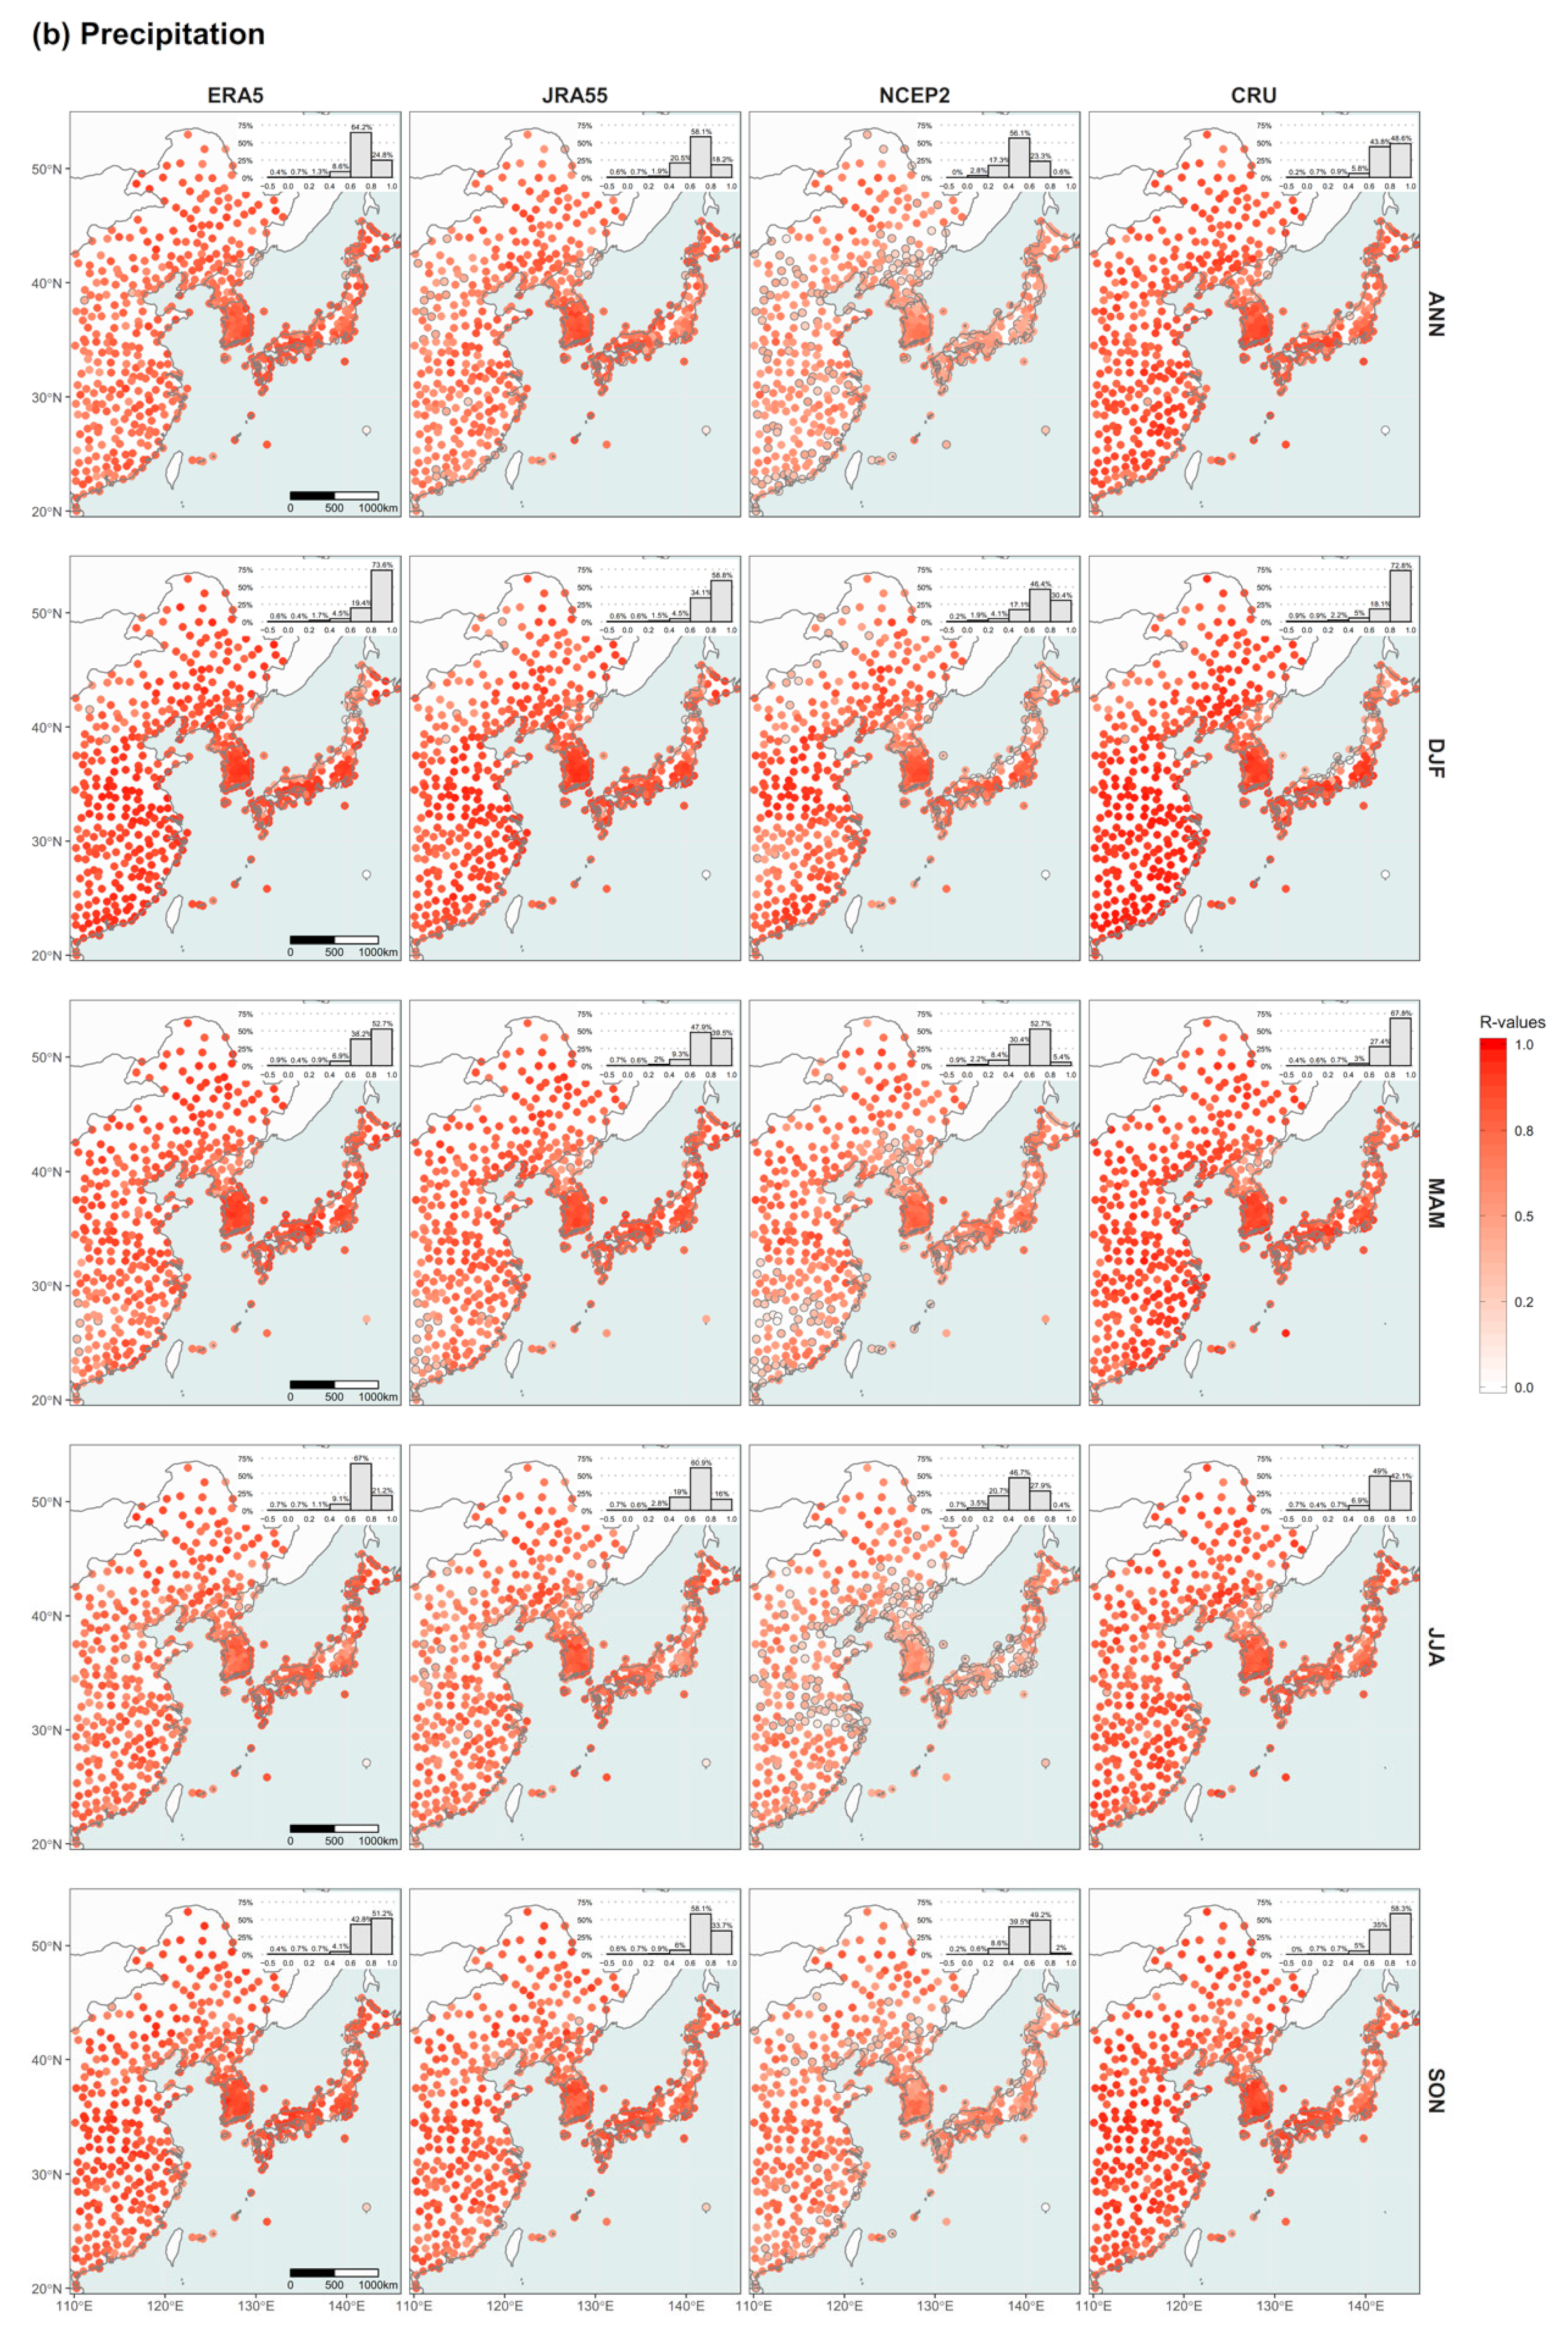
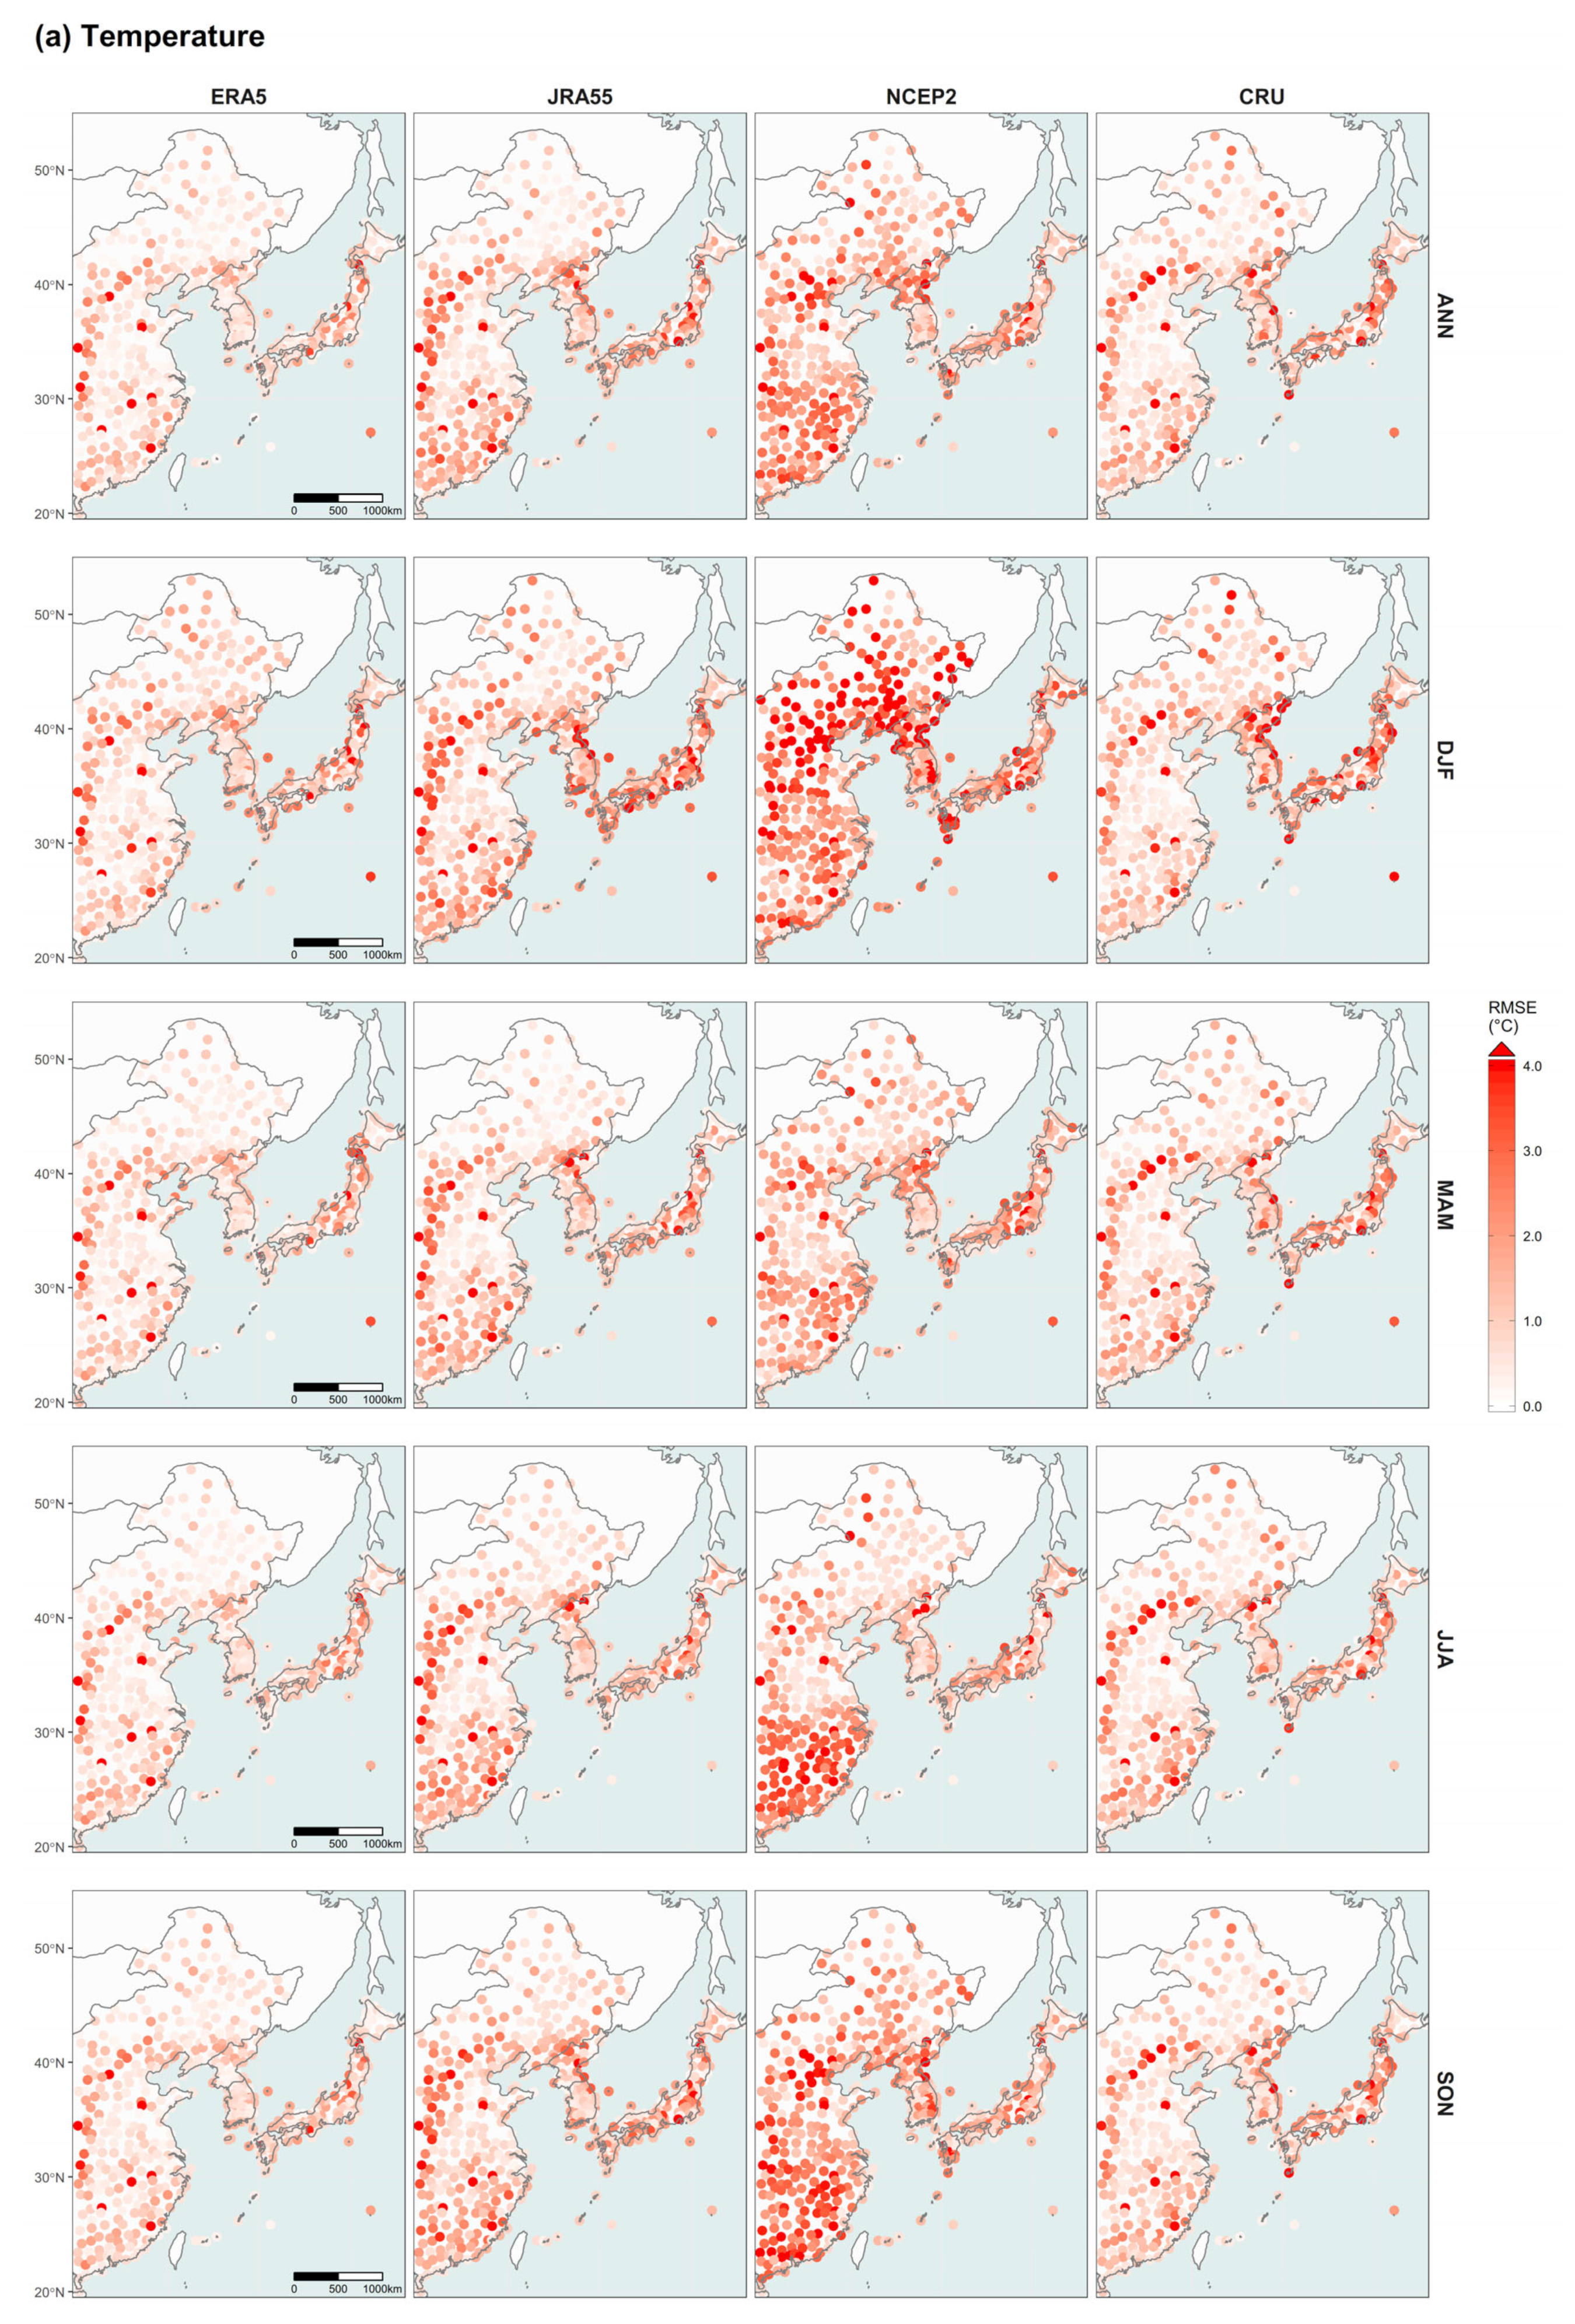
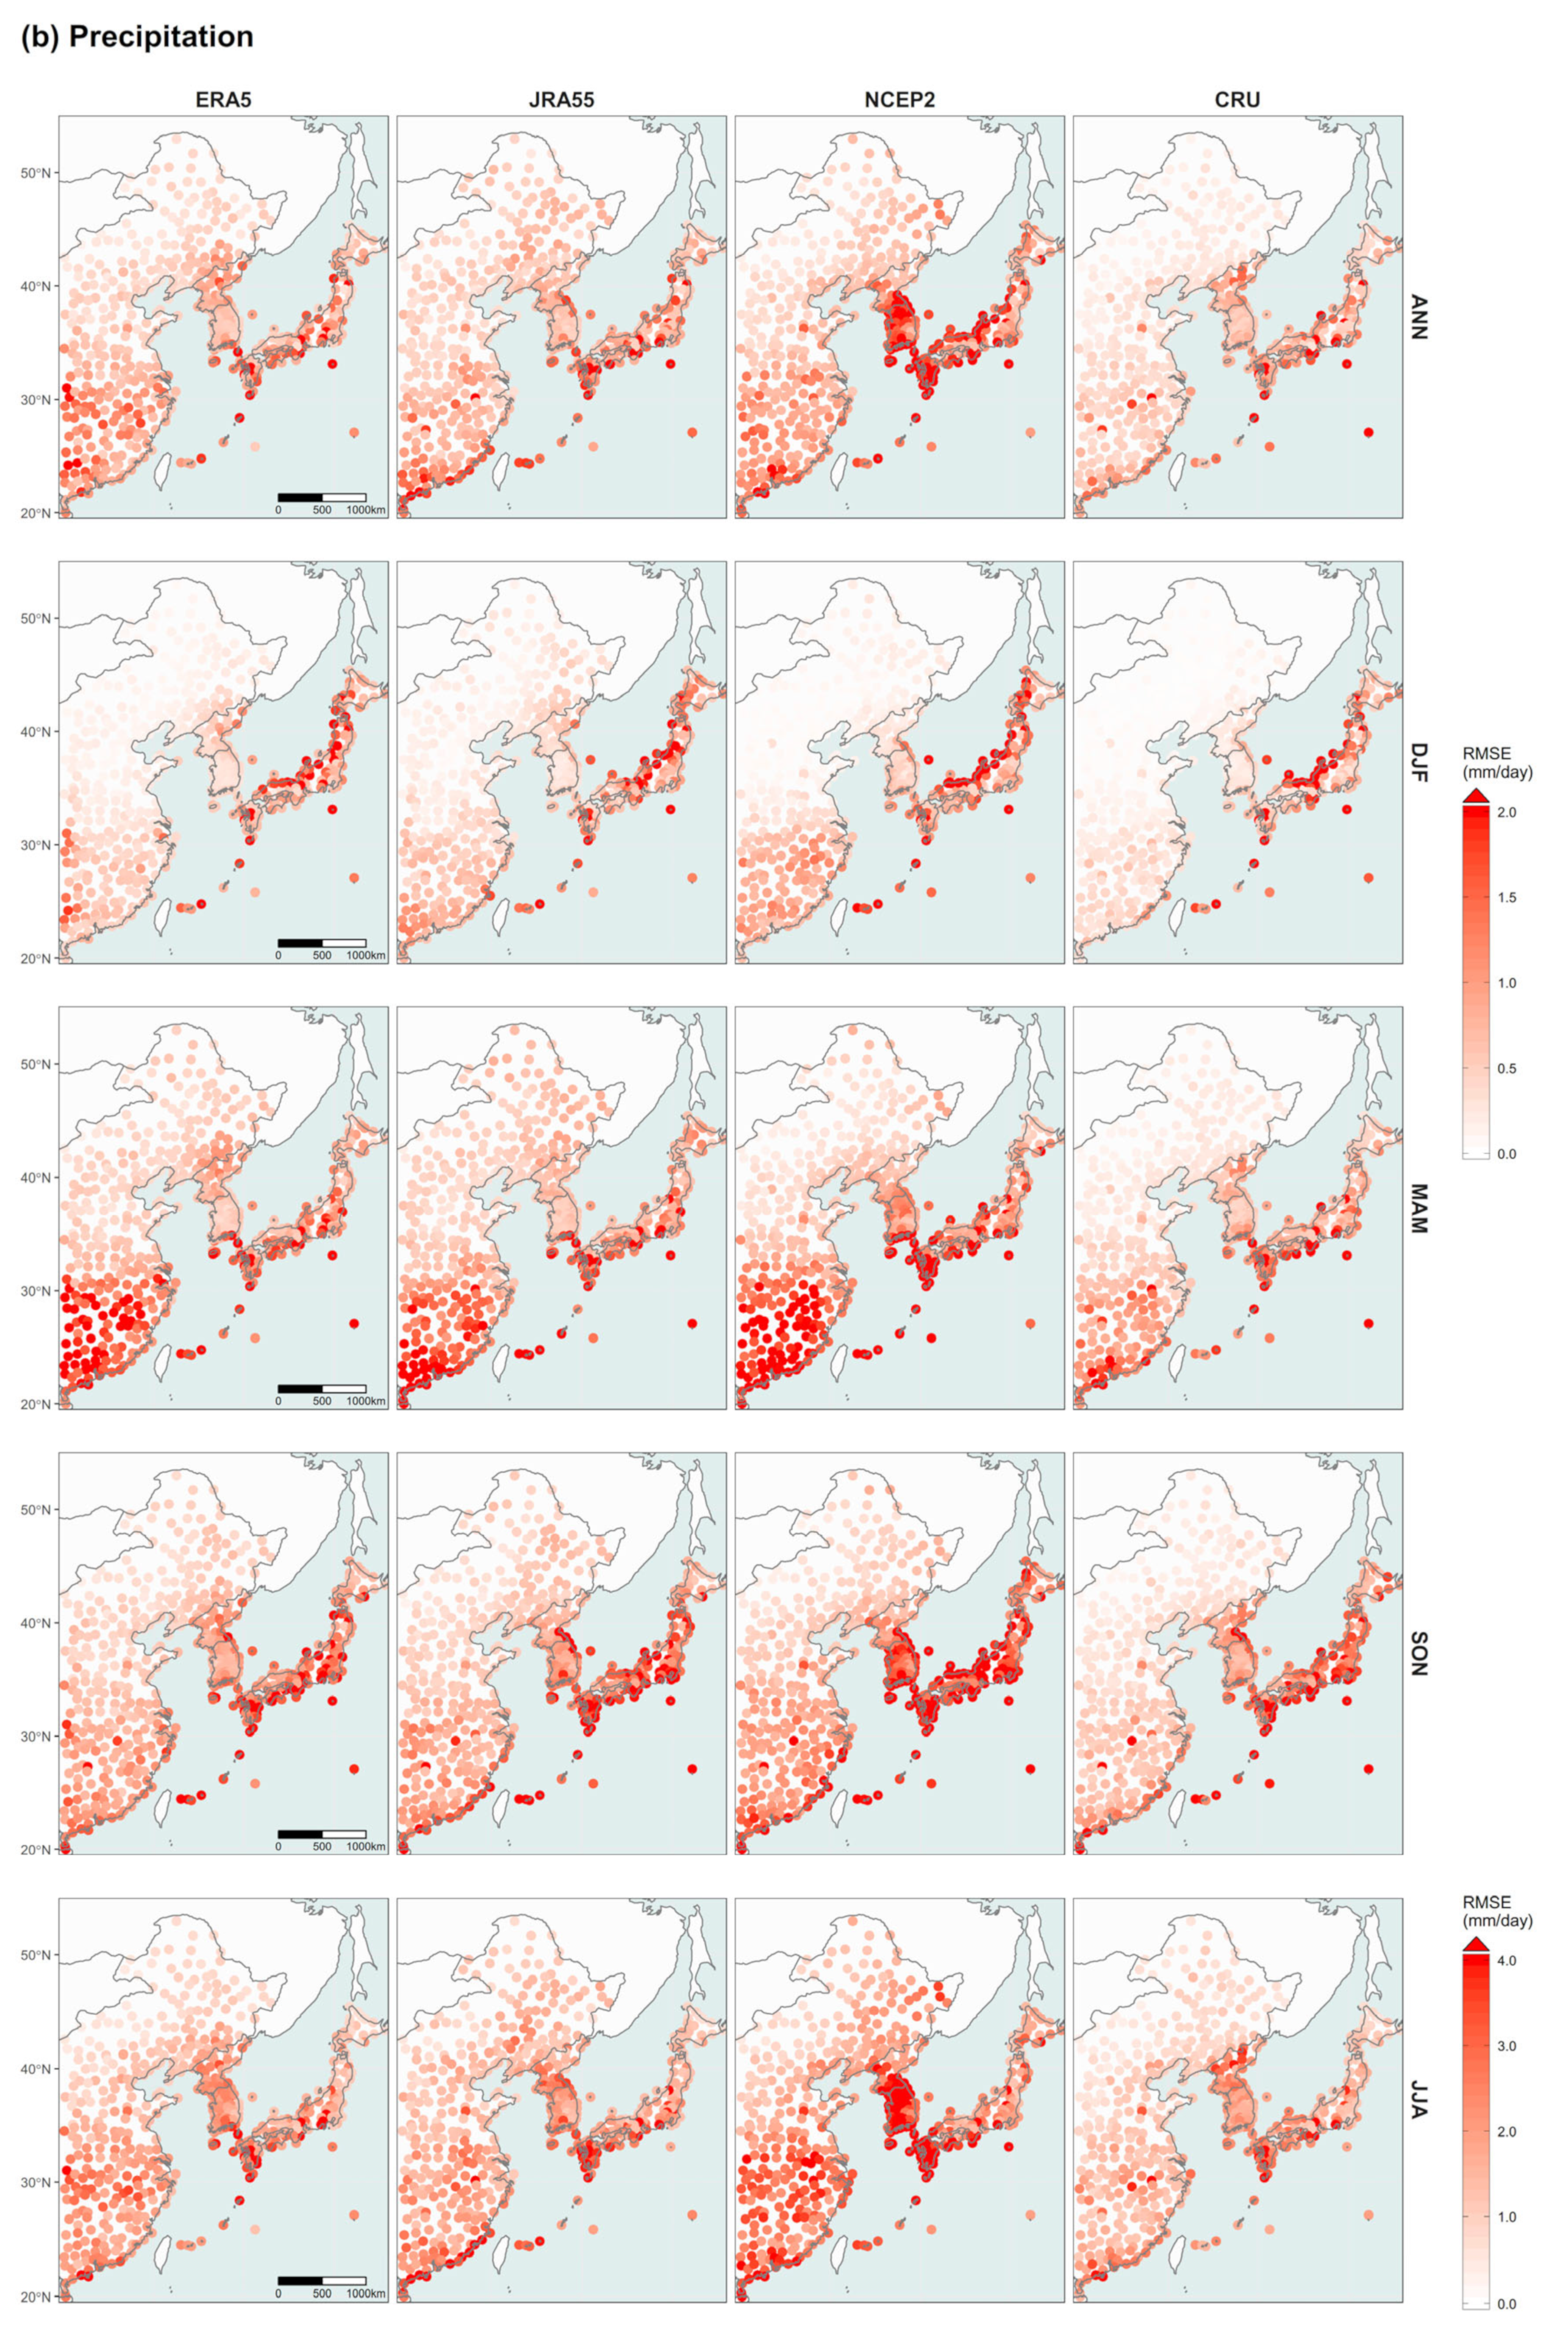
The result of temporal comparisons using Pearson correlation coefficients showed that all the datasets, except for NCEP2, fairly reproduced the temporal variations in temperature from the observations at most of the stations (ratio of stations with 95.5%, 94.4%, and 94.2% on the annual for ERA5, JRA55, and CRU, respectively) with high correlation coefficients (R > 0.8, p < 0.01). However, the higher RMSEs, related with cold biases, in the three reanalyses and CRU appeared along the mountainous regions in central-western China. The spatial patterns of annual and seasonal biases among the reanalysis data were generally similar, but the magnitude of biases was clearly noticeable by the largest biases in NCEP2 and the least in ERA5. For temporal variations in precipitation, CRU had the largest number of stations that represented high correlation coefficients of R > 0.8 for the annual and seasonal means, except for winter. Among the reanalyses, ERA5 was better than the other reanalyses, showing more stations with high correlation coefficients of R > 0.8 for all the annual and seasonal means. The highest RMSEs of precipitation were in NCEP2, followed by ERA5 and then JRA55. While the difference between ERA5 and JRA55 was not identifiable, there was an opposite pattern of biases between ERA5 and JRA55 in southern China, shown as dry biases in JRA55 and wet biases in ERA5. The spatial associations of the reanalysis and observational data at each station also supported that CRU and ERA5 were better in representing the climatologically observed temperature and precipitation. Based on the Pearson correlation coefficients and RMSEs of temperature at each station, annually and in all four seasons, the performance was in the order of ERA5, CRU, JRA55, and NCEP2. The precipitation datasets were better in the order of CRU, ERA5, JRA55, and NCEP2 and CRU was better as it showed the highest Pearson correlations, annually and in all seasons, and the lowest RMSEs, annually and in MAM, JJA, and SON.
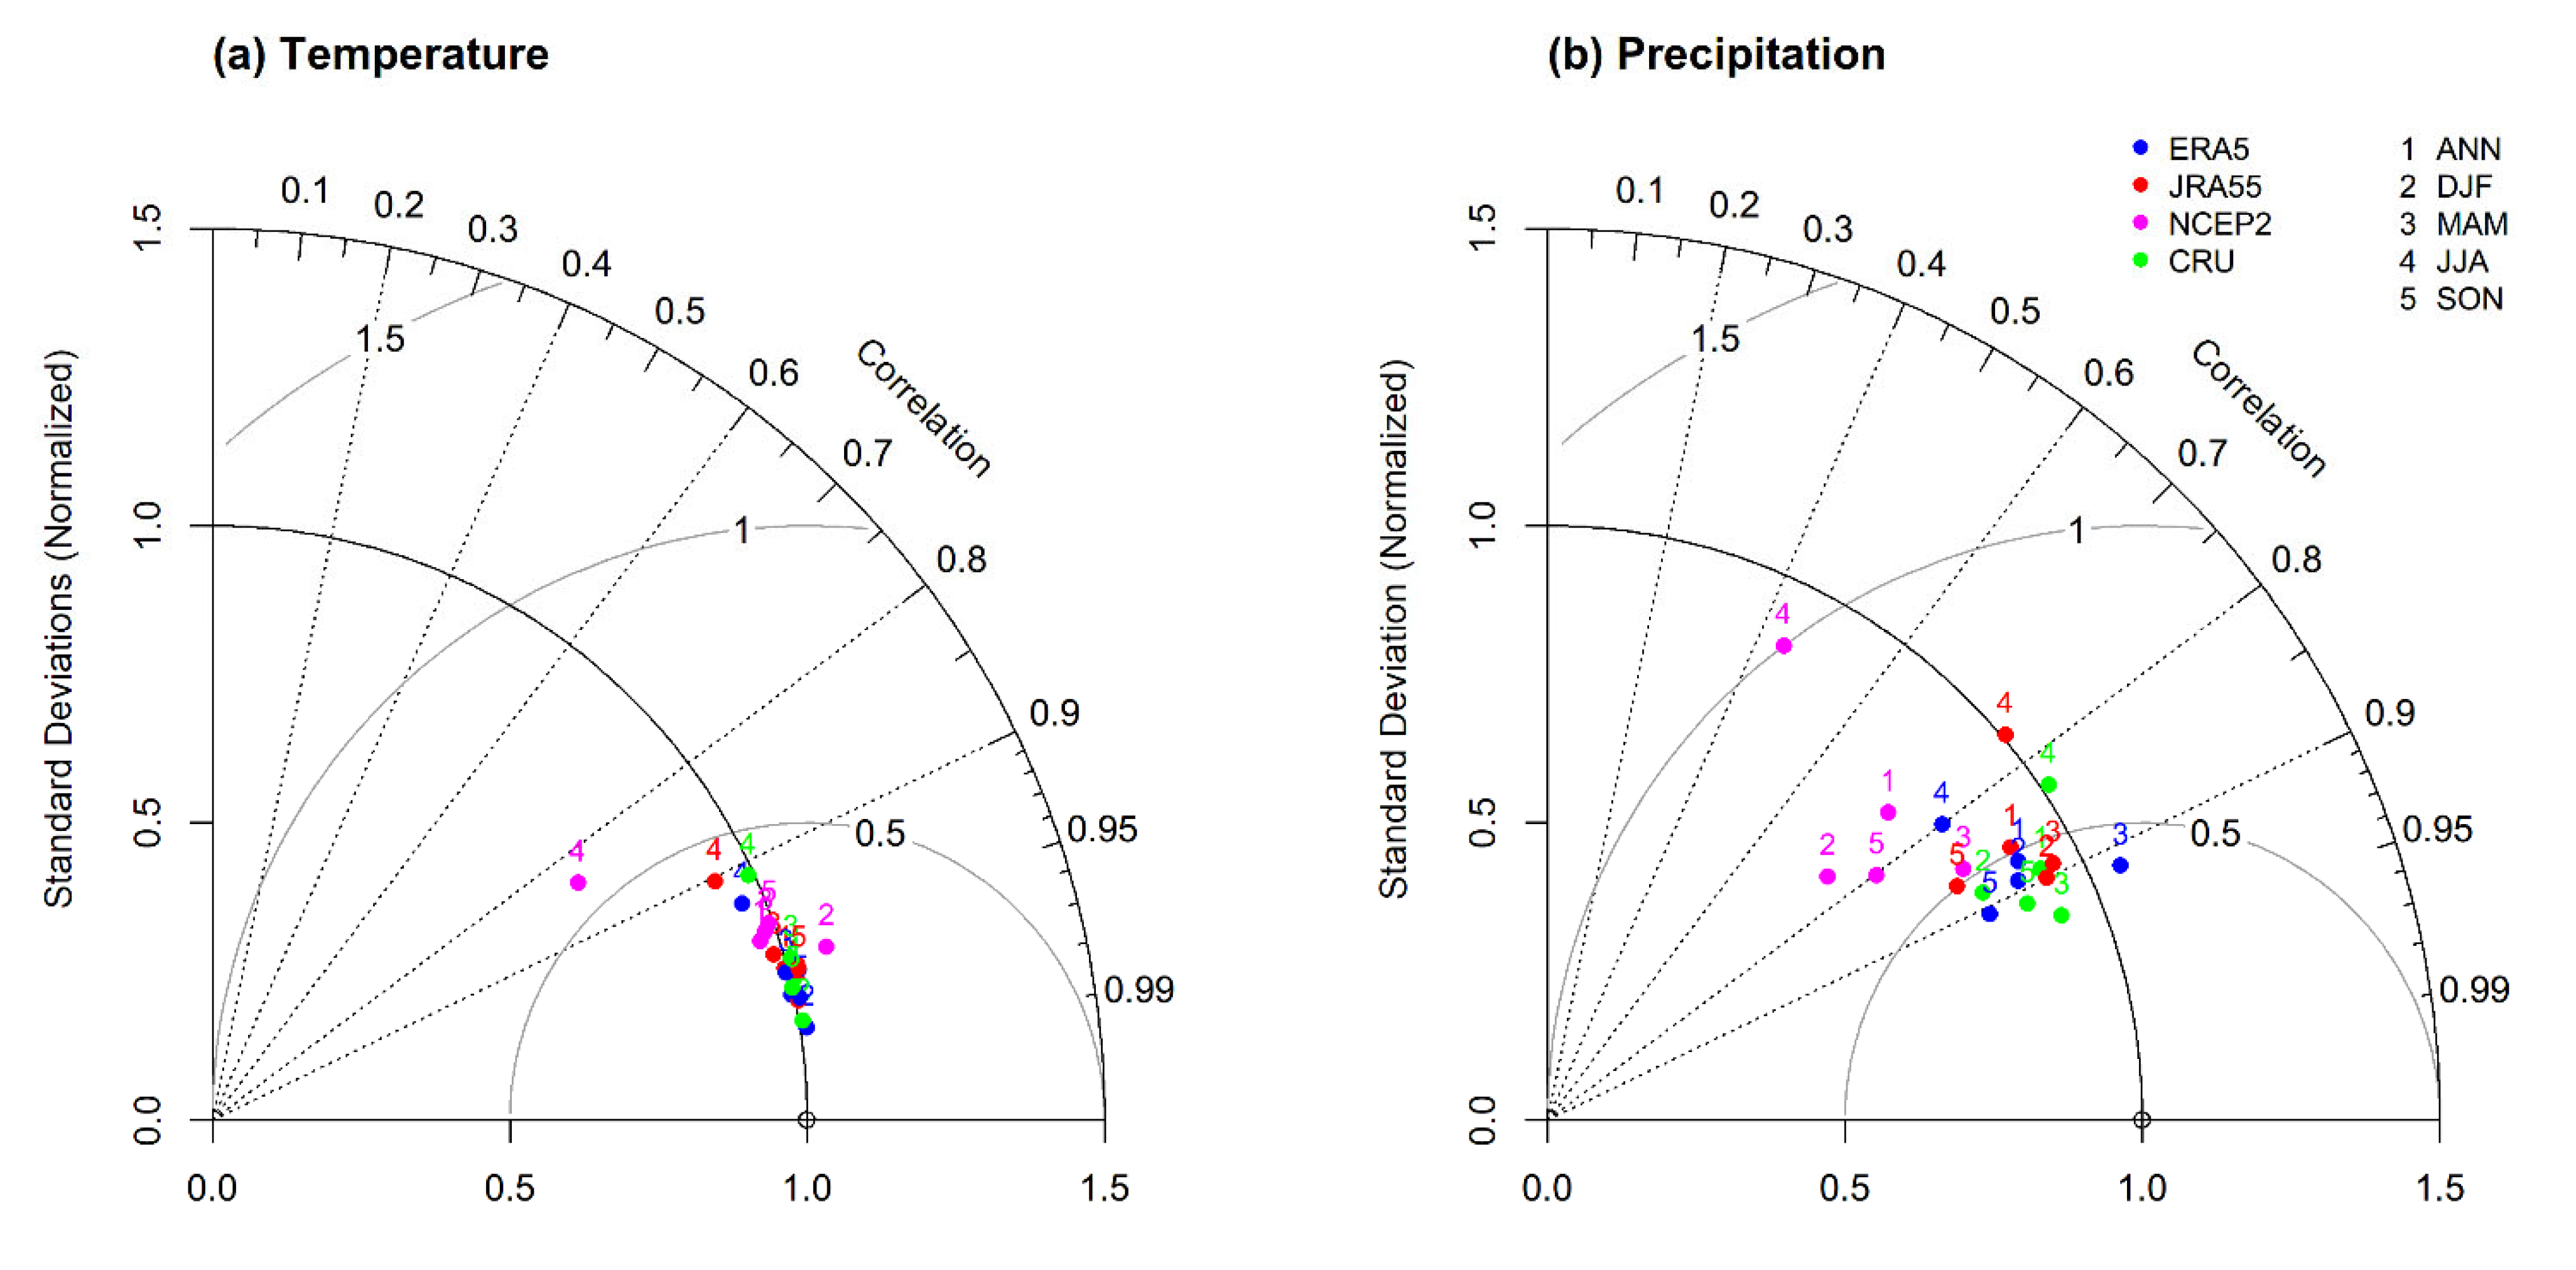
We suggested the best reanalysis data among ERA5, JRA55, and NCEP2 in the EAM region, according to the Pearson correlations, biases, and RMSEs by stations and the Taylor diagrams by climatological averages. ERA5 represented the best temporal variations in temperature, having the most stations with the highest Pearson correlations, annually and in JJA and SON, and the smallest RMSEs as well as the smallest biases for all seasons and annually. For precipitation, ERA5 was also the best reanalysis data as they showed the highest Pearson correlations at the most stations in the annual and all seasonal means, the smallest RMSEs, annually and in, MAM, JJA, and SON, and the smallest biases, annually and in, JJA, and SON. Additionally, Taylor diagrams revealed good spatial associations of ERA5 as ERA5 was the closest to the reference point of observed temperature among ERA5, JRA55, NCEP2, and CRU and, for precipitation, it was the second best, after CRU.
The three reanalysis datasets considered in this study generally well reproduced the temperature data by presenting significant correlations and low differences. However, it was detected that the regions with abrupt changes in elevations could have high uncertainties in the temperature from climate reanalysis due to the elevation effect as well as warming effect of vegetation on temperature, as the large biases and RMSEs appeared along the mountainous regions in central-western China. According to the correlation and difference statistics, ERA5 was suggested to be the most consistent reanalysis data with temperature observations. The statistical results for precipitation suggested that CRU has the strongest correlations with observations. Among the reanalyses, ERA5 better reproduced precipitation than the other two for all the annual and seasonal means. Nevertheless, the spatial patterns of the correlations and differences were heterogenous as their seasons and datasets vary, implying that additional validations with more temporally and spatially detailed scales are necessary before selecting the best precipitation reanalysis data in the EAM region.
As mentioned above, it is important to evaluate the performance of reanalysis data before adapting the data for the study. However, the previous studies in East Asia to evaluate reanalysis data focused on the country or the sub-country scales, mostly in China. In this paper, we focused on the entire EAM region to provide the varying performance of the reanalysis data across the monsoon region. Additionally, we offered insight into the regional-specific biases in reanalysis datasets, associated with the geographical factors of elevation and vegetation, which could be considered in improving the reanalysis data. Thus, the results of this study could be useful for EAM studies in selecting reliable reanalysis data for the entire, as well as regional, monsoon systems in East Asia.

Supplementary Materials

The following supporting information can be downloaded at: https://www.mdpi.com/article/10.3390/atmos13101589/s1, Figure S1: Spearman (ρ) correlation coefficients of (a) temperature and (b) precipitation from ERA5, JRA55, NCEP2, and CRU with observations in the EAM region for annual and seasonal means during the forty years of 1981–2020 for North Korea, South Korea, and Japan and the thirty years of 1981–2010 for China. Gray edges around points represent insignificant (p-value > 0.01). Histograms at the upper-right corner of map show the numbers of stations belonging to each range of correlation coefficients; Figure S2: Same as in Figure S1, but with Kendall (τ) correlation coefficients; Figure S3: The selected best reanalysis data among ERA5, JRA55, NCEP2, and CRU by stations of (a) temperature and (b) precipitation based on Pearson correlation coefficients, bias, and RMSE in the EAM region for annual and seasonal means during the forty years of 1981–2020 for North Korea, South Korea, and Japan and the thirty years of 1981–2010 for China. Histograms at the upper-right corner of map indicated the number of stations selected as the best reanalysis.

Author Contributions

Conceptualization, E.L.; methodology, E.L. and M.K.; software, M.K.; validation, M.K. and E.L.; formal analysis, M.K.; investigation, M.K.; resources, E.L.; data curation, M.K.; writing—original draft preparation, M.K.; writing—review and editing, E.L. and M.K.; visualization, M.K.; supervision, E.L.; project administration, E.L.; funding acquisition, E.L. All authors have read and agreed to the published version of the manuscript.

Funding

This study was supported by grants from the National Research Foundation of Korea (NRF) funded by the Korean government (MSIT) (NRF-2020R1F1A1048886) and the Korea Meteorological Administration Research and Development Program (KMI2022-01112).

Institutional Review Board Statement

Not applicable.

Informed Consent Statement

Not applicable.

Data Availability Statement

The climate reanalysis data are available for ERA5 at https://cds.climate.copernicus.eu, accessed on 7 April 2021, JRA55 at https://rda.ucar.edu/datasets/ds628.1/, accessed on 19 March 2021, and NCEP2 at http://www.esrl.noaa.gov/psd/data/gridded/data.ncep.reanalysis2.html, accessed on 9 March 2021. The observational station data were obtained from China Meteorological Administration (CMA) through [32], Japan Meteorological Agency (JMA) via www.data.jma.go.jp/gmd/risk/obsdl/index.php, accessed on 14 February 2021, and Korea Meteorological Administration (KMA) via https://data.kma.go.kr/data/grnd/selectAsosRltmList.do?pgmNo=36, accessed on 14 February 2021.

Acknowledgments

We thank the reviewers for their constructive comments to improve the manuscript.

Conflicts of Interest

The authors declare no conflict of interest.

References

  1. Chang, C.P. East Asian Monsoon; World Scientific: Singapore, 2004. [Google Scholar]
  2. Chang, C.; Ding, Y.; Johnson, R.H.; Lau, G.N.; Wang, B.; Yasunari, T. Global Monsoon System, The: Research And Forecast, 2nd ed.; World Scientific Publishing Company: Singapore, 2011. [Google Scholar]
  3. He, W.-P.; Zhao, S.-S. Assessment of the quality of NCEP-2 and CFSR reanalysis daily temperature in China based on long-range correlation. Clim. Dyn. 2017, 50, 493–505. [Google Scholar] [CrossRef]
  4. Li, C.; Zhao, T.; Shi, C.; Liu, Z. Assessment of precipitation from the CRA40 dataset and new generation reanalysis datasets in the global domain. Int. J. Climatol. 2021, 41, 5243–5263. [Google Scholar] [CrossRef]
  5. Xin, Y.; Lu, N.; Jiang, H.; Liu, Y.; Yao, L. Performance of ERA5 reanalysis precipitation products in the Guangdong-Hong Kong-Macao greater Bay Area, China. J. Hydrol. 2021, 602, 126791. [Google Scholar] [CrossRef]
  6. Zhang, S.-Q.; Ren, G.-Y.; Ren, Y.-Y.; Zhang, Y.-X.; Xue, X.-Y. Comprehensive evaluation of surface air temperature reanalysis over China against urbanization-bias-adjusted observations. Adv. Clim. Change Res. 2021, 12, 783–794. [Google Scholar] [CrossRef]
  7. Kalnay, E.; Kanamitsu, M.; Kistler, R.; Collins, W.; Deaven, D.; Gandin, L.; Iredell, M.; Saha, S.; White, G.; Woollen, J. The NCEP/NCAR 40-year reanalysis project. Bull. Am. Meteorol. Soc. 1996, 77, 437–472. [Google Scholar] [CrossRef]
  8. Hersbach, H.; Bell, B.; Berrisford, P.; Hirahara, S.; Horányi, A.; Muñoz-Sabater, J.; Nicolas, J.; Peubey, C.; Radu, R.; Schepers, D.; et al. The ERA5 global reanalysis. Q. J. R. Meteorol. Soc. 2020, 146, 1999–2049. [Google Scholar] [CrossRef]
  9. Smith, S.R.; Legler, D.M.; Verzone, K.V. Quantifying uncertainties in NCEP reanalyses using high-quality research vessel observations. J. Clim. 2001, 14, 4062–4072. [Google Scholar] [CrossRef]
  10. Donat, M.G.; Sillmann, J.; Wild, S.; Alexander, L.V.; Lippmann, T.; Zwiers, F.W. Consistency of Temperature and Precipitation Extremes across Various Global Gridded In Situ and Reanalysis Datasets. J. Clim. 2014, 27, 5019–5035. [Google Scholar] [CrossRef]
  11. Inoue, T.; Matsumoto, J. A comparison of summer sea level pressure over East Eurasia between NCEP-NCAR reanalysis and ERA-40 for the period 1960-99. J. Meteorol. Soc. Japan. Ser. II 2004, 82, 951–958. [Google Scholar] [CrossRef]
  12. Balmaceda-Huarte, R.; Olmo, M.E.; Bettolli, M.L.; Poggi, M.M. Evaluation of multiple reanalyses in reproducing the spatio-temporal variability of temperature and precipitation indices over southern South America. Int. J. Climatol. 2021, 41, 5572–5595. [Google Scholar] [CrossRef]
  13. Mooney, P.A.; Mulligan, F.J.; Fealy, R. Comparison of ERA-40, ERA-Interim and NCEP/NCAR reanalysis data with observed surface air temperatures over Ireland. Int. J. Climatol. 2011, 31, 545–557. [Google Scholar] [CrossRef]
  14. Sun, Q.; Miao, C.; Duan, Q.; Ashouri, H.; Sorooshian, S.; Hsu, K.L. A Review of Global Precipitation Data Sets: Data Sources, Estimation, and Intercomparisons. Rev. Geophys. 2018, 56, 79–107. [Google Scholar] [CrossRef]
  15. Huai, B.; Wang, Y.; Ding, M.; Zhang, J.; Dong, X. An assessment of recent global atmospheric reanalyses for Antarctic near surface air temperature. Atmos. Res. 2019, 226, 181–191. [Google Scholar] [CrossRef]
  16. Zhang, W.; Wang, Y.; Smeets, P.C.J.P.; Reijmer, C.H.; Huai, B.; Wang, J.; Sun, W. Estimating near-surface climatology of multi-reanalyses over the Greenland Ice Sheet. Atmos. Res. 2021, 259, 105676. [Google Scholar] [CrossRef]
  17. Gao, L.; Bernhardt, M.; Schulz, K.; Chen, X.; Chen, Y.; Liu, M. A First Evaluation of ERA-20CM over China. Mon. Weather Rev. 2016, 144, 45–57. [Google Scholar] [CrossRef]
  18. Fu, C. Potential impacts of human-induced land cover change on East Asia monsoon. Glob. Planet. Change 2003, 37, 219–229. [Google Scholar] [CrossRef]
  19. De Lima, J.A.G.; Alcântara, C.R. Comparison between ERA Interim/ECMWF, CFSR, NCEP/NCAR reanalysis, and observational datasets over the eastern part of the Brazilian Northeast Region. Theor. Appl. Climatol. 2019, 138, 2021–2041. [Google Scholar] [CrossRef]
  20. Tang, D.; Ma, C.; Wang, Y.; Xu, X. Multiscale evaluation of NCEP and CRUNCEP data sets at 90 large U.S. cities. J. Geophys. Res. Atmos. 2017, 122, 7433–7444. [Google Scholar] [CrossRef]
  21. Zhao, T.; Fu, C. Comparison of products from ERA-40, NCEP-2, and CRU with station data for summer precipitation over China. Adv. Atmos. Sci. 2006, 23, 593–604. [Google Scholar] [CrossRef]
  22. Gao, W.; Gao, Q.; Wang, H.; Guan, Z.; Du, N.; Hu, T. Comparison of in situ station data and reanalysis data in winter and summer temperature in China. In Proceedings of the Remote Sensing and Modeling of Ecosystems for Sustainability V, San Diego, CA, USA, 10 September 2008. [Google Scholar]
  23. Ma, L.; Zhang, T.; Li, Q.; Frauenfeld, O.W.; Qin, D. Evaluation of ERA-40, NCEP-1, and NCEP-2 reanalysis air temperatures with ground-based measurements in China. J. Geophys. Res. 2008, 113, D15115. [Google Scholar] [CrossRef]
  24. You, Q.; Fraedrich, K.; Ren, G.; Ye, B.; Meng, X.; Kang, S. Inconsistencies of precipitation in the eastern and central Tibetan Plateau between surface adjusted data and reanalysis. Theor. Appl. Climatol. 2012, 109, 485–496. [Google Scholar] [CrossRef]
  25. Kim, D.-I.; Han, D. Comparative study on long term climate data sources over South Korea. J. Water Clim. Change 2019, 10, 504–523. [Google Scholar] [CrossRef]
  26. Jiao, D.; Xu, N.; Yang, F.; Xu, K. Evaluation of spatial-temporal variation performance of ERA5 precipitation data in China. Sci. Rep. 2021, 11, 17956. [Google Scholar] [CrossRef] [PubMed]
  27. Wang, B. Rainy season of the Asian–Pacific summer monsoon. J. Clim. 2002, 15, 386–398. [Google Scholar] [CrossRef]
  28. Lee, E.-J.; Jhun, J.-G.; Park, C.-K. Remote connection of the northeast Asian summer rainfall variation revealed by a newly defined monsoon index. J. Clim. 2005, 18, 4381–4393. [Google Scholar] [CrossRef]
  29. Lee, E.; Chase, T.N.; Rajagopalan, B. Seasonal forecasting of East Asian summer monsoon based on oceanic heat sources. Int. J. Climatol. 2008, 28, 667–678. [Google Scholar] [CrossRef]
  30. Lee, E.; Chase, T.N.; Rajagopalan, B. Highly improved predictive skill in the forecasting of the East Asian summer monsoon. Water Resour. Res. 2008, 44. [Google Scholar] [CrossRef]
  31. Mishra, V.; Shah, R. Evaluation of the Reanalysis Products for the Monsoon Season Droughts in India. J. Hydrometeorol. 2014, 15, 1575–1591. [Google Scholar] [CrossRef]
  32. Meng, L.; Shen, Y. On the relationship of soil moisture and extreme temperatures in East China. Earth Interact. 2014, 18, 1–20. [Google Scholar] [CrossRef]
  33. KMA. Climatological Statistics Guide; KMA: Seoul, Korea, 2019. [Google Scholar]
  34. WMO. Guide to Climatological Practices; WMO: Geneva, Switzerland, 2018. [Google Scholar]
  35. Kanamitsu, M.; Ebisuzaki, W.; Woollen, J.; Yang, S.-K.; Hnilo, J.; Fiorino, M.; Potter, G. Ncep–doe amip-ii reanalysis (r-2). Bull. Am. Meteorol. Soc. 2002, 83, 1631–1644. [Google Scholar] [CrossRef] [Green Version]
  36. Kobayashi, S.; Ota, Y.; Harada, Y.; Ebita, A.; Moriya, M.; Onoda, H.; Onogi, K.; Kamahori, H.; Kobayashi, C.; Endo, H.; et al. The JRA-55 Reanalysis: General Specifications and Basic Characteristics. J. Meteorol. Soc. Japan. Ser. II 2015, 93, 5–48. [Google Scholar] [CrossRef]
  37. Harris, I.; Osborn, T.J.; Jones, P.; Lister, D. Version 4 of the CRU TS monthly high-resolution gridded multivariate climate dataset. Sci. Data 2020, 7, 109. [Google Scholar] [CrossRef] [PubMed]
  38. Pearson, K. VII. Note on regression and inheritance in the case of two parents. Proc. R. Soc. Lond. 1895, 58, 240–242. [Google Scholar] [CrossRef]
  39. Spearman, C. Demonstration of formulae for true measurement of correlation. Am. J. Psychol. 1907, 18, 161–169. [Google Scholar] [CrossRef]
  40. Kendall, M.G. A new measure of rank correlation. Biometrika 1938, 30, 81–93. [Google Scholar] [CrossRef]
  41. Taylor, K.E. Summarizing multiple aspects of model performance in a single diagram. J. Geophys. Res. Atmos. 2001, 106, 7183–7192. [Google Scholar] [CrossRef]
  42. Liu, Z.; Wang, Z.; Chi, W.; Baig, M.H.A.; Wang, L.; Yang, X.; Wang, S.; Liu, Y. Evaluation of Spatial and Temporal Performances of ERA-Interim Precipitation and Temperature in Mainland China. J. Clim. 2018, 31, 4347–4365. [Google Scholar] [CrossRef]
  43. Yadav, S.K.; Lee, E.; He, Y. Positive Associations of Vegetation with Temperature over the Alpine Grasslands in the Western Tibetan Plateau during May. Earth Interact. 2022, 26, 94–111. [Google Scholar] [CrossRef]
  44. He, Y.; Oh, J.; Lee, E.; Kim, Y. Land Cover and Land Use Mapping of the East Asian Summer Monsoon Region from 1982 to 2015. Land 2022, 11, 391. [Google Scholar] [CrossRef]
  45. Wang, A.; Zeng, X. Development of Global Hourly 0.5° Land Surface Air Temperature Datasets. J. Clim. 2013, 26, 7676–7691. [Google Scholar] [CrossRef]
  46. Amjad, M.; Yilmaz, M.T.; Yucel, I.; Yilmaz, K.K. Performance evaluation of satellite-and model-based precipitation products over varying climate and complex topography. J. Hydrol. 2020, 584, 124707. [Google Scholar] [CrossRef]
  47. Beck, H.E.; Vergopolan, N.; Pan, M.; Levizzani, V.; Van Dijk, A.I.; Weedon, G.P.; Brocca, L.; Pappenberger, F.; Huffman, G.J.; Wood, E.F. Global-scale evaluation of 22 precipitation datasets using gauge observations and hydrological modeling. Hydrol. Earth Syst. Sci. 2017, 21, 6201–6217. [Google Scholar] [CrossRef]
  48. Gottschalck, J.; Meng, J.; Rodell, M.; Houser, P. Analysis of multiple precipitation products and preliminary assessment of their impact on global land data assimilation system land surface states. J. Hydrometeorol. 2005, 6, 573–598. [Google Scholar] [CrossRef]
  49. Ebert, E.E.; Janowiak, J.E.; Kidd, C. Comparison of near-real-time precipitation estimates from satellite observations and numerical models. Bull. Am. Meteorol. Soc. 2007, 88, 47–64. [Google Scholar] [CrossRef]
  50. Ruane, A.C.; Roads, J.O. 6-hour to 1-year variance of five global precipitation sets. Earth Interact. 2007, 11, 1–29. [Google Scholar] [CrossRef]
Figure 1. Location and elevation (in unit of meter) of weather stations used in the study over the East Asian monsoon (EAM) region.
Atmosphere 13 01589 g001
Figure 2. Climatology of (a) temperature and (b) precipitation from observation data at each station in the EAM region using the annual and seasonal (DJF, MAM, JJA, and SON) averages over the forty years of 1981–2020 for North Korea, South Korea, and Japan and the thirty years of 1981–2010 for China. The scale bar of temperature is in a range of −25 to 30 °C and the midpoint of scale is at 2.5 °C.
Atmosphere 13 01589 g002
Figure 3. A schematic diagram of validation and comparison processes.
Atmosphere 13 01589 g003
Figure 4. Pearson (R) correlation coefficients of (a) temperature and (b) precipitation from ERA5, JRA55, NCEP2, and CRU with observations in the EAM region for annual and seasonal means during the forty years of 1981–2020 for North Korea, South Korea, and Japan and the thirty years of 1981–2010 for China. Gray edges around points represent insignificant correlation (p-value > 0.01). Histograms at the upper-right corner of map show that the numbers of stations belonging to each range of correlation coefficients.
Atmosphere 13 01589 g004aAtmosphere 13 01589 g004b
Figure 5. Same as in Figure 4, but with root-mean-square error (RMSE) of (a) temperature and (b) precipitation. The scale of precipitation in JJA (b) is different from that of other seasons.
Atmosphere 13 01589 g005aAtmosphere 13 01589 g005b
Figure 6. Same as in Figure 5, but with bias of (a) temperature and (b) precipitation. The scale of precipitation in JJA (b) is different from that of other seasons.
Atmosphere 13 01589 g006aAtmosphere 13 01589 g006b
Figure 7. Scatter plots based on the values of (a) temperature and (b) precipitation from ERA5, JRA55, NCEP2, and CRU with observations for each station in the EAM region for annual and seasonal means during the forty years of 1981–2020 for North Korea, South Korea, and Japan and the thirty years of 1981–2010 for China. Correlation coefficients of Pearson (R), Spearman (ρ), and Kendall (τ) in the upper left and RMSE, bias, and the regression equation in the lower-right corners are shown.
Atmosphere 13 01589 g007aAtmosphere 13 01589 g007b
Figure 8. The selected best reanalysis data among ERA5, JRA55, and NCEP2 by stations of (a) temperature and (b) precipitation based on Pearson correlation coefficients, bias, and RMSE in the EAM region for annual and seasonal means during the forty years of 1981–2020 for North Korea, South Korea, and Japan and the thirty years of 1981–2010 for China. Histograms at the upper-right corner of map indicate the number of stations selected as the best reanalysis.
Atmosphere 13 01589 g008
Figure 9. Taylor diagrams of (a) temperature and (b) precipitation from ERA5, JRA55, NCEP2, and CRU data, compared to observations, in the EAM region using the annual and seasonal averages over the forty years of 1981–2020 for North Korea, South Korea, and Japan and the thirty years of 1981–2010 for China.
Atmosphere 13 01589 g009
Publisher’s Note: MDPI stays neutral with regard to jurisdictional claims in published maps and institutional affiliations.

