Article

Present and Future Changes in Winter Cyclonic Activity in the Mediterranean–Black Sea Region in the 21st Century Based on an Ensemble of CMIP6 Models

by
Elena N. Voskresenskaya
*,
Veronika N. Maslova
,
Andrey S. Lubkov
and
Viktor Y. Zhuravskiy
Institute of Natural and Technical Systems, 299011 Sevastopol, Russia
*
Author to whom correspondence should be addressed.
Atmosphere 2022, 13(10), 1573; https://doi.org/10.3390/atmos13101573
Submission received: 26 July 2022 / Revised: 2 September 2022 / Accepted: 19 September 2022 / Published: 26 September 2022
(This article belongs to the Special Issue Feature Papers in Atmosphere Science)

Abstract

:
A better understanding of expected future cyclonic activity, especially in winter in the Mediterranean basin, is essential in developing scientifically based adaptation and mitigation methods to study extreme precipitation and wind anomalies. The aim of this study was to analyze the changes in winter cyclonic activity in the Mediterranean–Black Sea region, as part of the North Atlantic–European sector, at three 15 year periods: the beginning, middle, and end of the 21st century. Our projections were based on an ensemble of seven Coupled Model Intercomparison Project (CMIP), phase 6, models, which showed the best agreement with NCEP/NCAR and ERA5 reanalyses under the intermediate SSP2-4.5 and highest-emission SSP5-8.5 scenarios. The results showed a consistent increase in the frequency of cyclones over Central Europe and the British Isles, which was associated with shifts in cyclone tracks: northward from the western Mediterranean region and southward from the Icelandic Low region. The latter shift led to a decrease in the frequency in the northern Atlantic–European region. At the same time, there was a reduction in the frequency of cyclones over the eastern region of the Mediterranean Sea, consistent with the decrease in cyclogenesis events. Area-averaged cyclone numbers in the western and eastern Mediterranean and Black Sea subregions reduced at the end of the century under the highest-emission scenario, but not constantly. There was a rise in the middle of the 21st century under both scenarios, which may be linked to long-term multidecadal variability or regional features. In general, our study showed that the future winter cyclonic activity in the Mediterranean–Black Sea region will respond unevenly to global climate changes, due to regional and monthly features and long-term quasiperiodic variability.

1. Introduction

During historical and future periods, cyclonic activity—a form of general atmospheric circulation in the middle latitudes [1]—is one of the main links in the mechanisms of climate variability, including extremes, especially for regional winter precipitation and wind anomalies that are associated with atmospheric circulation processes of synoptic scale (cyclones and anticyclones) in the Mediterranean–Black Sea region [2]. In a warmer atmosphere, cyclones may differ in their dynamic features (for example, the location of their trajectories) and their thermodynamic processes (for example, changes in their intensity) [3,4]. According to [3], cyclones are expected to become more diabatically driven. In a warmer climate, they tend to move more slowly, and their deepening rate increases [4]. All of the above factors can increase the frequency and intensity of adverse cyclone-related hydrometeorological and hydrological events, such as torrential precipitation, wind surges, severe river floods, and landslides [5]. In light of these risks, the Mediterranean basin is particularly vulnerable to climate change [6,7].
The physical processes responsible for changes in cyclonic activity in a warmer climate have opposite effects, favoring both increases and decreases in cyclonic activity. On the one hand, an increase in sea surface temperatures and latent heat fluxes increase convection; therefore, thermodynamical processes become more important [5]. On the other hand, higher temperature rises in the upper troposphere than in the lower troposphere increase atmospheric stability [6]. In addition, a warmer atmosphere can hold more moisture, according to the Clausius–Clapeyron equation [5], which leads to increased water vapor transport [8] and cyclone-related precipitation [9,10], as occurs over the western Atlantic and Mediterranean regions [11]. The aqua-planet simulations in [3], with uniform increases in sea surface temperatures of 4 K, showed a 3.3% decrease in the number of extratropical cyclones, no change in the intensity median, more frequent stronger and weaker storms, and an increase of up to 50% in precipitation associated with the strongest cyclones. Future increases in the frequency of cyclones associated with extreme precipitation over Europe were shown in [12].
The climate of the Mediterranean basin cannot be considered independently of the macrocirculatory processes over the North Atlantic region and the North Atlantic–European sector. The most important of the three remote drivers of regional circulation over Europe are tropical amplification and the strengthening of the stratospheric vortex [13]. Tropical amplification is associated with the broadening of the tropical/subtropical dry zone, as the result of the expansion of the Hadley cell toward the poles [14], which forces the poleward migration of jet streams [15] and storm tracks [16]. This threatens the expansion of drylands and desertification in the Mediterranean region [17]. A strengthened stratospheric vortex is associated with a zonal wind anomaly that closely resembles the positive phase of the North Atlantic Oscillation (NAO) [13]. The expected prevalence of the positive North Atlantic Oscillation phase in the future [14] is accompanied by a northward shift of storm tracks over the northern hemisphere in general [18] and over the North Atlantic in particular, followed by a weakening of the Mediterranean storm track [19]. Polar amplification, which is the third driver of midlatitude atmospheric circulation change, results from Arctic Sea ice loss, and may also affect meridional temperature gradients and the migration of midlatitude cyclone tracks [20].
The influence of the modes of natural variability, such as the North Atlantic Oscillation, the East Atlantic/West Russia (EAWR) pattern, and others, on extratropical cyclones in the Mediterranean basin is recognized in the scientific community (see, e.g., [21,22,23,24]), not only in winter, but also in summer [25]. Before the industrial era, natural variability prevailed in the depth of winter cyclones over the northern hemisphere [5]. In the future, the influence of the simulated positive shift in the NAO index was shown to explain between 10% and 50% of the negative cyclone trends over the western Mediterranean region [26].
Winter climatic anomalies in the Mediterranean–Black Sea region are mostly caused by the regional cyclonic activity that is associated with large-scale global patterns, e.g., as it was shown in [2]. In the terms of large-scale structures of atmospheric circulation, future storm tracks over the North Atlantic are important in understanding the climate in the studied region. Below, we provide an overview of the future projections of cyclonic activity in the 21st century, moving from a global scale to the studied region.
Researchers generally agree about the decrease in the frequency of cyclones at the end of the century over the northern hemisphere [27] and over the North Atlantic active storm track regions [28]. The intensity of cyclones and/or the number of extreme cyclones are projected to increase in winter [29,30] [27]. In addition, cyclone-related heavy precipitation and strong winds are expected to intensify in winter [27,31].
With respect to the spatial pattern of cyclonic activity in the North Atlantic, previous studies [31,32] showed a future strengthening of the storm track around 50° N and a weakening of cyclone track density to the north, over Scandinavia, and to the south of the North Atlantic, reaching the Mediterranean region. The pattern of winter cyclones over Europe is projected to become tripolar, with an increased number of cyclones in Central Europe and a decreased number in the Norwegian and Mediterranean Seas [9].
Despite different identification and tracking methods for cyclones, as well as uncertainties regarding the available models and the large differences among them, most projections for the Mediterranean region show a decrease in the number of winter cyclones at the end of the 21st century [11,14,26,31,33,34]. This reduction will continue the negative trend in the frequency of winter–spring cyclones of the late 20th century [24,35,36,37,38]. In contrast, the number of cyclones in summer is projected to increase in the Mediterranean region, by a factor of nearly 2 [4].
The changes in cyclonic activity and cyclone tracks lead to wetter or drier conditions in the Mediterranean region, as was shown for the eastern part of the region in [39]. While the intensity of each rainy event in a warmer atmosphere is important locally, the reduction in precipitation observed in winter will be driven mainly by a decrease in the number of Mediterranean cyclones [34,40]. This overall reduction will tend to be regionally compensated for or amplified by the average precipitation generated by individual cyclones in winter, which is projected to increase in the northern Mediterranean (primarily due to an increase in the atmospheric moisture content) and to decrease in the eastern Mediterranean area (largely due to a dynamical weakening of cyclones) [34].
Regional climate simulations show wetter winter conditions at the northern boundary [41] and the central part [40] of the Mediterranean region, and drier conditions in the southeast part of the basin, associated with the corresponding changes in winter cyclone activity [40,41]. The strongest increase in aridity in the 21st century is expected for the southeastern part of the Mediterranean region [40,42], associated locally with the weakening of the specific synoptic circulation pattern called the Cyprus Low [14,43]. Precipitation is also projected to reduce over the Iberian Peninsula, due to the poleward shift of moisture corridors and associated atmospheric rivers [8] and to the reduction in cyclone occurrences [11].
Accordingly, the changes in thermodynamic processes and atmospheric circulation under global warming conditions, taking into account internal natural variability, are expected to lead to a reduction in cyclonic activity, changes in current precipitation patterns, and the desertification of the Mediterranean region. Nevertheless, the expected decrease in cyclonic activity in the Mediterranean region will not be uniform in the different parts of region in different months, and it is likely to be associated with the shift in storm tracks. Insufficient attention is paid to the expected changes in cyclonic activity in the region at the middle of the century. The anomalies in the 21st century are mainly estimated in comparison with historical periods of the 20th century, without taking into account new changes in climatic norms. Therefore, we decided to focus on the climate of the 21st century.
The aim of this study is to analyze the changes in winter cyclonic activity (the frequency of cyclones, the number of cyclogenesis events, the number of cyclones, and the average cyclone tracks) in the Mediterranean–Black Sea region, as a part of the North Atlantic–European sector, in three 15 year periods: the beginning, the middle, and the end of the 21st century, using an ensemble of the recent generation, phase 6, of Coupled Model Intercomparison Project (CMIP) models under intermediate (SSP2-4.5) and maximum (SSP5-8.5) emissions scenarios. To a certain degree, we addressed our understanding of the periodicity (i.e., a multidecadal scale) in the response of cyclonic activity to climate change at the middle and end of the 21st century, relative to the reference period, which was secured with an available reanalysis with assimilated observational data.
First, we composed the ensemble of the models that have the best agreement on cyclones with ERA5 and NCEP/NCAR reanalyses (Section 3.1). Then, we analyzed ensemble fields of recent (i.e., at the beginning of the century) and future (i.e., at middle and end of the 21st century) winter cyclone frequency and the number of cyclogenesis events over the North Atlantic–European sector, as well as their differences in absolute anomalies and anomalies in percent (Section 3.2). For the western Mediterranean, eastern Mediterranean, and Black Sea subregions, we compared recent and future area-averaged winter cyclone numbers: the frequency of cyclones, the number of cyclones, and the number of cyclogenesis events (Section 3.3). Finally, to explain the changes in local cyclone numbers over the Mediterranean-Black Sea subregions, we showed the average position of winter cyclone tracks originating from the main cyclogenesis areas over the North Atlantic–European sector (Section 3.4).

2. Data and Methods

The results of cyclonic activity projections are biased by many factors: accuracy and assumptions of the methods for the determination of cyclonic activity, spatial resolution and errors in initial data, uncertainties of the models, and the feasibility of emission scenarios.
The density of tracks can be identified using the Eulerian or Lagrangian approaches. The Eulerian method (or a Laplacian-based method) uses, for example, the root mean square (RMS) filtered baric field (sea level pressure or geopotential height) to evaluate storm tracks (see, e.g., [32]), and the local Laplacian of pressure to measure cyclone intensity [44]. The Lagrangian method, which can provide more details (the dynamic properties of cyclones and cyclogenesis areas) is based on cyclone identification and tracking algorithms that are applied mainly to sea level pressure (SLP), geopotential height, or vorticity fields [29,33,44,45,46,47,48,49,50,51,52,53]. In this study, we used the authors’ cyclone identification and tracking method [54], based on finding a minimum in the SLP field, which was tested in [37] and is briefly described further in Section 2.1 of this article.
To simulate cyclones in a warmer climate in the 21st century, global circulation models (GCMs) are mainly used, either directly or as initial and lateral boundary conditions for downscaling in regional climate models (RCM), which are applied to obtain a robust regional result, according to [14]. Higher-resolution models produce larger numbers of cyclones and storms [55], but this information is not always useful for research purposes; for example, higher-resolution models are not helpful if the subject of a study refers to the manifestations of large-scale atmospheric circulation in storm track changes. In contrast to the consensus on the future reduction of cyclonic activity in the Mediterranean region, it was shown using a 0.5° regional model (REMO) in [56] that the total number of cyclones in the Mediterranean region will increase, but at the expense of shallow, possibly thermal, cyclones. Stronger winter cyclones were projected to decrease without significant changes in track properties and precipitation estimates along the tracks, which could indicate a northward shift in cyclone tracks [56].
Recently, some of the most popular global models are the families of models of the Coupled Model Intercomparison Project, phases 3, 5, 6 (CMIP3, CMIP5, and CMIP6) [57,58,59]. The families of CMIP3, CMIP5, and CMIP6 models reproduce consistent spatial structures of winter storm tracks in the North Atlantic–European region. At the same time, the most recent generation of CMIP6 models [59] is characterized by the lower multimodel mean biases in winter and are more sensitive in terms of larger amplitudes of the climate change and storm track change response [27,32,60]. Despite biases in the estimation of quantitative features, the CMIP6 models show the improved atmospheric circulation over Europe relatively to the CMIP5 models [61], which is likely a result of increased horizontal resolution and improved model physics, according to [60].
There is a substantial spread among models in simulating future climate change. It emerges, on the one side, from the pre-existing mean state errors linked to the ocean state and its influence on large scale atmospheric baroclinicity [27,60]. On the other side, it arises from the differences in the projected atmospheric circulation change [62]. For example, different CMIP5 GCMs are associated with high or low tropical amplification and weak or strong polar stratospheric vortex [62]. The GCM-driven downscaling further amplifies the uncertainties in regional models, which depend also on internal variability, model physics and the domain [40]. According to [63], the GCM boundary forcing is more important than RCM physics (internal RCM model processes), particularly in winter. Still, the spatial pattern of winter North Atlantic cyclones in CMIP5 projections seems to be only weakly affected by the biases of the models [9]. Some of the higher-atmospheric-resolution CMIP5 models (HadGEM2-ES, HadGEM2-CC,1 EC-EARTH, and MRI-CGCM3) have a better representation of both the number (storm-track position and tilt) and the intensity of North Atlantic cyclones than the majority of CMIP5 models, which have a storm track that is too zonal and shifted to the south [62]. The RCM-based projections for the Mediterranean region [40] showed that there are still important uncertainties (in the sign and magnitude) in changes of cyclone characteristics: the area of origin, seasonality, deepening rate of cyclones, associated precipitation and wind speed. Nevertheless, the uncertainties among models can be reduced by using model ensembles or multiple runs in the case of the same model.
We selected for the analysis all available CMIP6 models with a 6 h time resolution, and with the availability of the recent historical period and two scenarios: SSP2-4.5 and SSP5-8.5. Thus, eight CMIP6 models listed in Table 1 were used in the further analysis. Cyclones simulated in the each CMIP6 model were then compared to cyclones identified using NCEP/NCAR and ERA5 reanalyses for a 15 year recent period of the beginning of the century (2000 to 2014).
Simulations for the 21st century are conducted under different scenarios of economic growth. They assume various greenhouse gas concentrations or emission trajectories, which lead to a range of additional incoming radiation per-unit surface areas (radiative forcing) and a range of global temperature increases. The greenhouse gas emissions trajectories were described in the Special Report on Emissions Scenarios (SRES) [71] and used in the Intergovernmental Panel on Climate Change’s (IPCC’s) Third Assessment Report [72] and Fourth Assessment Report [73]. The families of the SRES scenarios (A1, A2, B1, and B2) were replaced by the representative concentration pathways (RCPs) in the IPCC’s Fifth Assessment Report [74] and by the shared socioeconomic pathways (SSPs) in the IPCC’s Sixth Assessment Report [75].
The new generation CMIP6 models use the SSPs as scenarios of projected socio-economic global changes up to 2100 [75]. The most optimistic scenario among them is a SSP1-1.9 scenario with very low greenhouse gases (GHG) emissions (with CO2 emissions cut to net zero around 2050), which is expected to lead to radiative forcing of 1.9 Wm-2 and global warming of 1 °C to 1.8 °C during the period from 2081 to 2100. The most pessimistic SSP5-8.5 scenario, with very high GHG emissions (with CO2 emissions tripling by 2075) is expected to lead to additional 8.5 Wm-2 and 4.4 °C during the period from 2081 to 2100. A moderate SSP2-4.5 scenario assumes intermediate GHG emissions (with CO2 emissions around current levels until 2050, then falling but not reaching net zero by 2100). This scenario is expected to lead to additional 4.5 Wm-2 and 2.7 °C in the period from 2081 to 2100. According to [76], the probability of the SSP2-4.5 scenario is characterized as likely, while more pessimistic and optimistic scenarios are characterized as unlikely. The more optimistic scenarios assume the implementation of international agreements on emission reductions. They are unattainable because of the lack of effective legal regulation of control over anthropogenic emissions (greenhouse gases and aerosols) at the national levels of the main country-emitters [77,78].
In this study, we used two SSPs. One of them was the SSP2-4.5 scenario, which is the “middle-of-the-road” experiment in CMIP6. The other is the SSP5-8.5 scenario, as the highest-emission and the worst (no-policy) case.

2.1. Cyclone Identification and Tracking Method

Cyclones were identified using the 6 hourly sea level pressure fields (SLP) of the eight CMIP6 models, NCEP/NCAR [79], and ERA5 [80] reanalyses over the North Atlantic–European sector (20° W to 5° E, 30° N to 80° N).
The search for the low pressure center in a regular grid was as follows: if the SLP increased in four directions upon sequential consideration of each grid point, then the starting point was identified as a minimum of the pressure field. To estimate the size of a baric formation, the SLP was estimated at each next grid point in four directions. If the SLP began to decrease in one of the directions, then the value of the previous point was considered to be the last closed isobar of a cyclone. The selected models and the reanalyses had different spatial resolution, and therefore it was reasonable to introduce the minimum cyclone size, taking into account the coarsest spatial grid. In this work, cyclones with sizes less than 560 km were not taken into account.
After identifying the centers of low atmospheric pressure, the tracking of cyclones was carried out. The average maximum speed of an extratropical cyclone in the middle latitudes was 80 km/h to 90 km/h [1]. Thus, a cyclone can move more than 2000 km per day. In many studies, daily data were used to identify and track cyclones; however, such a time scale can lead to the error of combining an occluded cyclone with a young cyclone located within a radius of 2000 km.
The use of 6 h data made it possible to reduce the estimated radius of the location of a cyclone at the next time step by a factor of 4 and, therefore, to avoid the problem of an incorrect combination of cyclones. In this study, the two centers were linked if the other low-pressure center was found within a radius of 600 km at the next or a previous 6 h time step. If several such centers were found within the search radius, the nearest low-pressure center was selected.
There was a probability of an occurrence of spurious baric lows associated, for instance, with the influence of the relief on the SLP field. To avoid this problem, we applied kinematic thresholds: minimum cyclone lifetime of 48 h (eight time steps) and minimum propagation of 1000 km, by analogy with [27,62].
The frequency of cyclones was defined as the number of 6 h intervals over a 15 year period, when a cyclone center was observed in the spatial domain. Frequency refers to all cases of localization of cyclone centers in the selected spatial domain, which means that the same cyclone was added to the frequency until it left the spatial domain. Here, the number of cyclones meant that if a cyclone center fell into the selected spatial domain, then this cyclone was counted once and would no more be included in this domain in the following analysis. The number of cyclogenesis events referred to the number of cyclone centers that originated in the selected spatial domain. To calculate average cyclone tracks, all winter cyclones were analyzed if they emerged in the selected cyclogenesis areas during each 15 year period. At each 6 h time step of a cyclone’s lifetime, the latitudes and longitudes were totaled and averaged.
As a result, the datasets of cyclones over the North Atlantic–European sector were obtained for the recent historical period at the beginning of the century (2000 to 2014) using eight CMIP6 models, NCEP/NCAR, and ERA5 reanalyses, as well as for two future 15 year periods at the middle (2043 to 2057) and end (2086 to 2100) of the 21st century, using the selected CMIP6 models under SSP2-4.5 and SSP5-8.5 scenarios.

2.2. Model Scaling and Comparison

All the calculated datasets had different spatial resolution, as no preliminary scaling of the SLP fields was carried out. Due to the use of size and kinematic thresholds, the number of cyclones in models with different spatial resolutions had the same order, and the use of any interpolation procedure on different spatial grids was undesirable. As a result, the number of cyclones (related to isolines) for high-resolution models with smaller spatial cells tended to be less than the number for coarser resolution models with larger spatial cells. To solve this problem, all fields were scaled to the 2.5° × 2.5° grid as follows: the North Atlantic–European sector was divided into 2.5° × 2.5° areal segments. All centers of cyclones were totaled (X) in each segment (i, j). To account for the contribution of a different number of points, each segment was weighted (X′) according to Equation (1):
X i , j = X i , j M m · N ,
where M is a number of initial resolution points in the region, N is a number of segments of normalized resolution (in our case it was 475 segments in 2.5° × 2.5° resolution), and m is the number of model or reanalysis points within the segment.
The quality of reproduction of cyclones in the CMIP6 models was assessed by comparison with cyclones obtained using NCEP/NCAR and ERA5 reanalyses over the 15 year recent historical period from 2000 to 2014. The analysis was carried out on the basis of the frequency fields of cyclones normalized to a single spatial resolution. The comparison criteria were as follows:
  • The Pearson’s linear correlation coefficient, according to Equation (2):
r = c o v ( x i   y i   ) σ x σ y ,
where samples x and y are the spatial fields of the CMIP6 model and reanalysis converted into a vector and σx and σy are the standard deviations of samples x and y;
  • The root mean square error of the model relative to reanalysis (RMSE), according to Equation (3):
R M S E =   ( x i y i ) 2 n ,
where n is a number of grid points. The significant correlation was 0.16 at the probability level p = 0.001 (for 567 points of a regular grid).

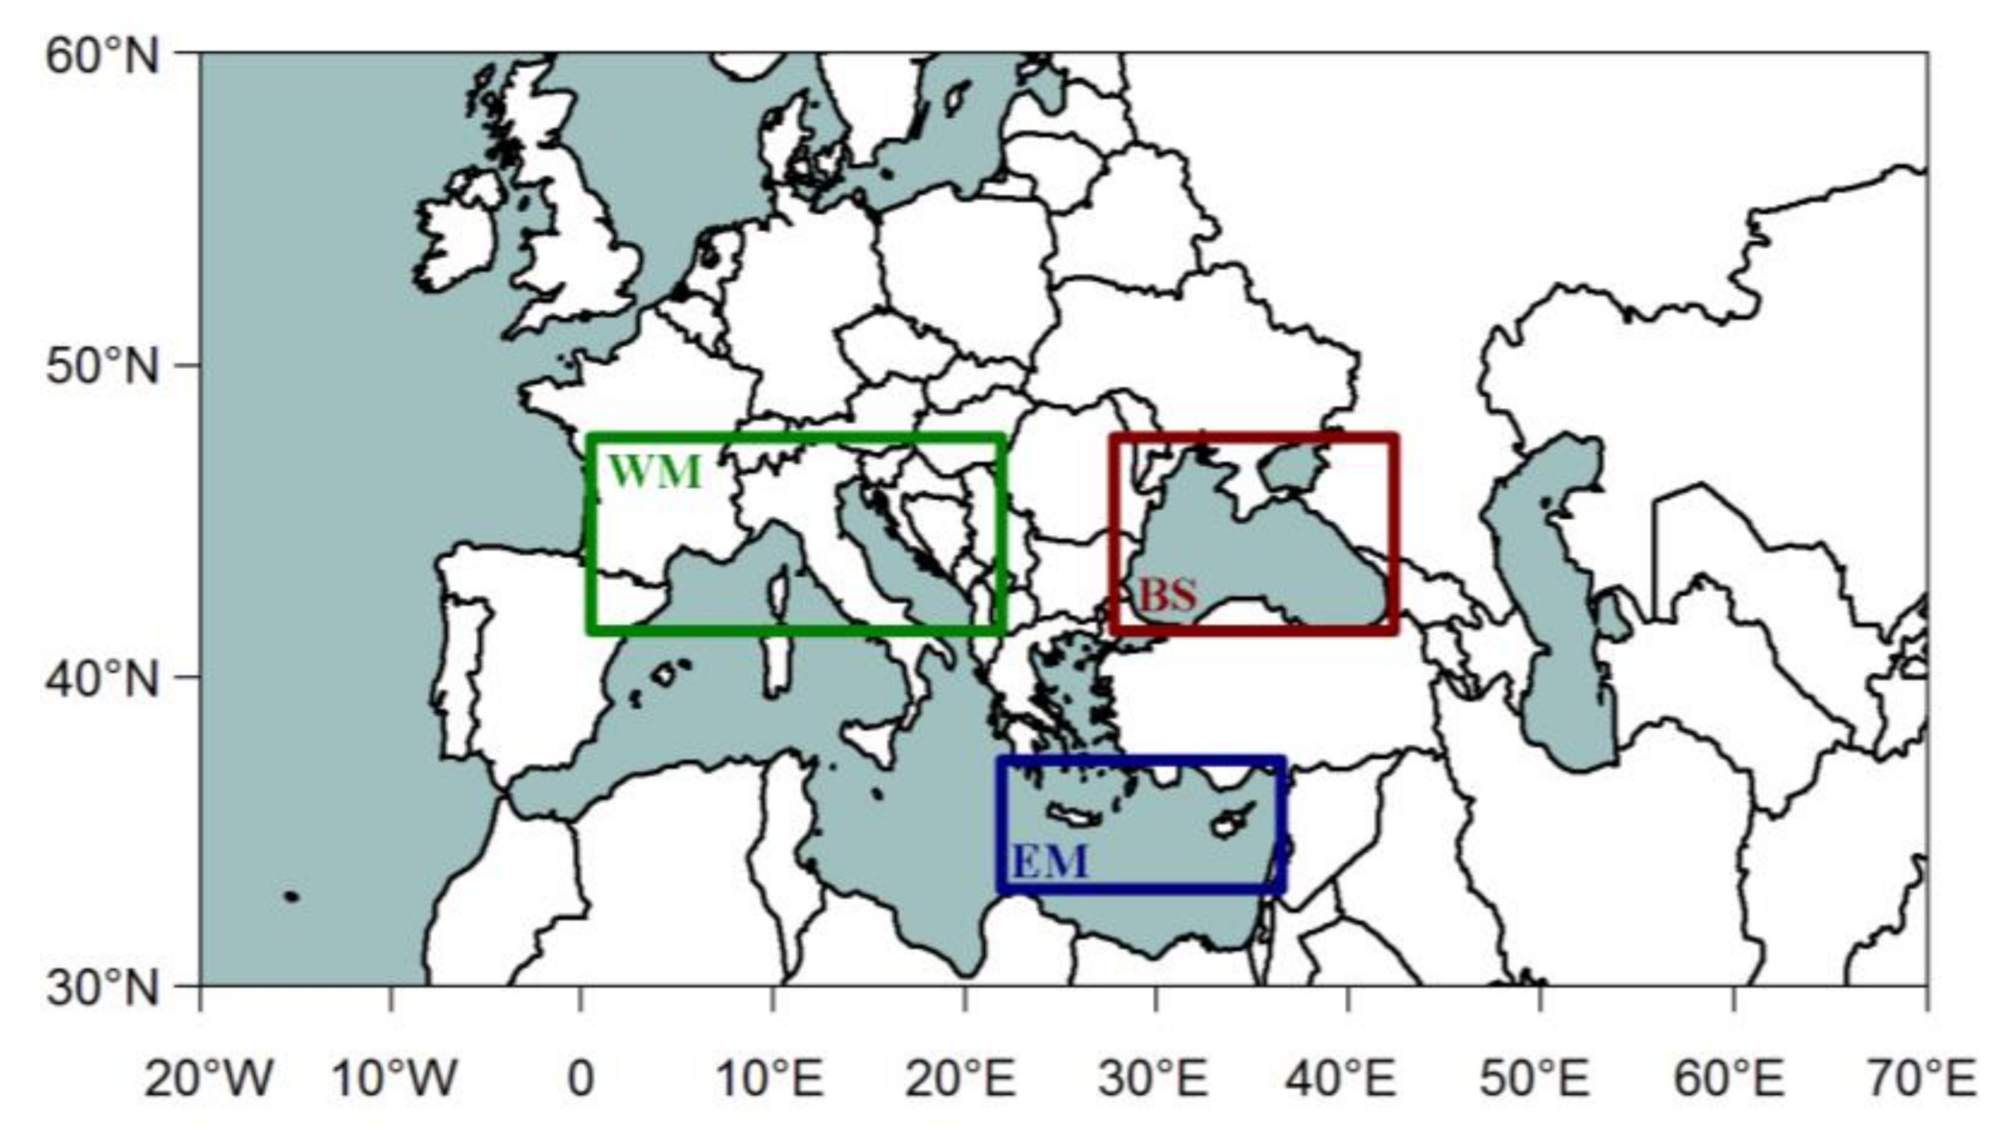
2.3. Subregions for Boxplots

Area-averaged winter cyclone numbers were calculated and represented as boxplots (in Section 3.3) at the beginning, middle, and end of the 21st century for the three subregions of the Mediterranean basin, as shown in Figure 1. Subregions were bounded in accordance with the main cyclogenesis areas in the Mediterranean basin based on an ensemble of CMIP6 models (see Section 3.1). For each subregion, three cyclone numbers were considered: the frequency of cyclones, the number of cyclones, and the cyclogenesis events (see the definitions in Section 2.1).

3. Results

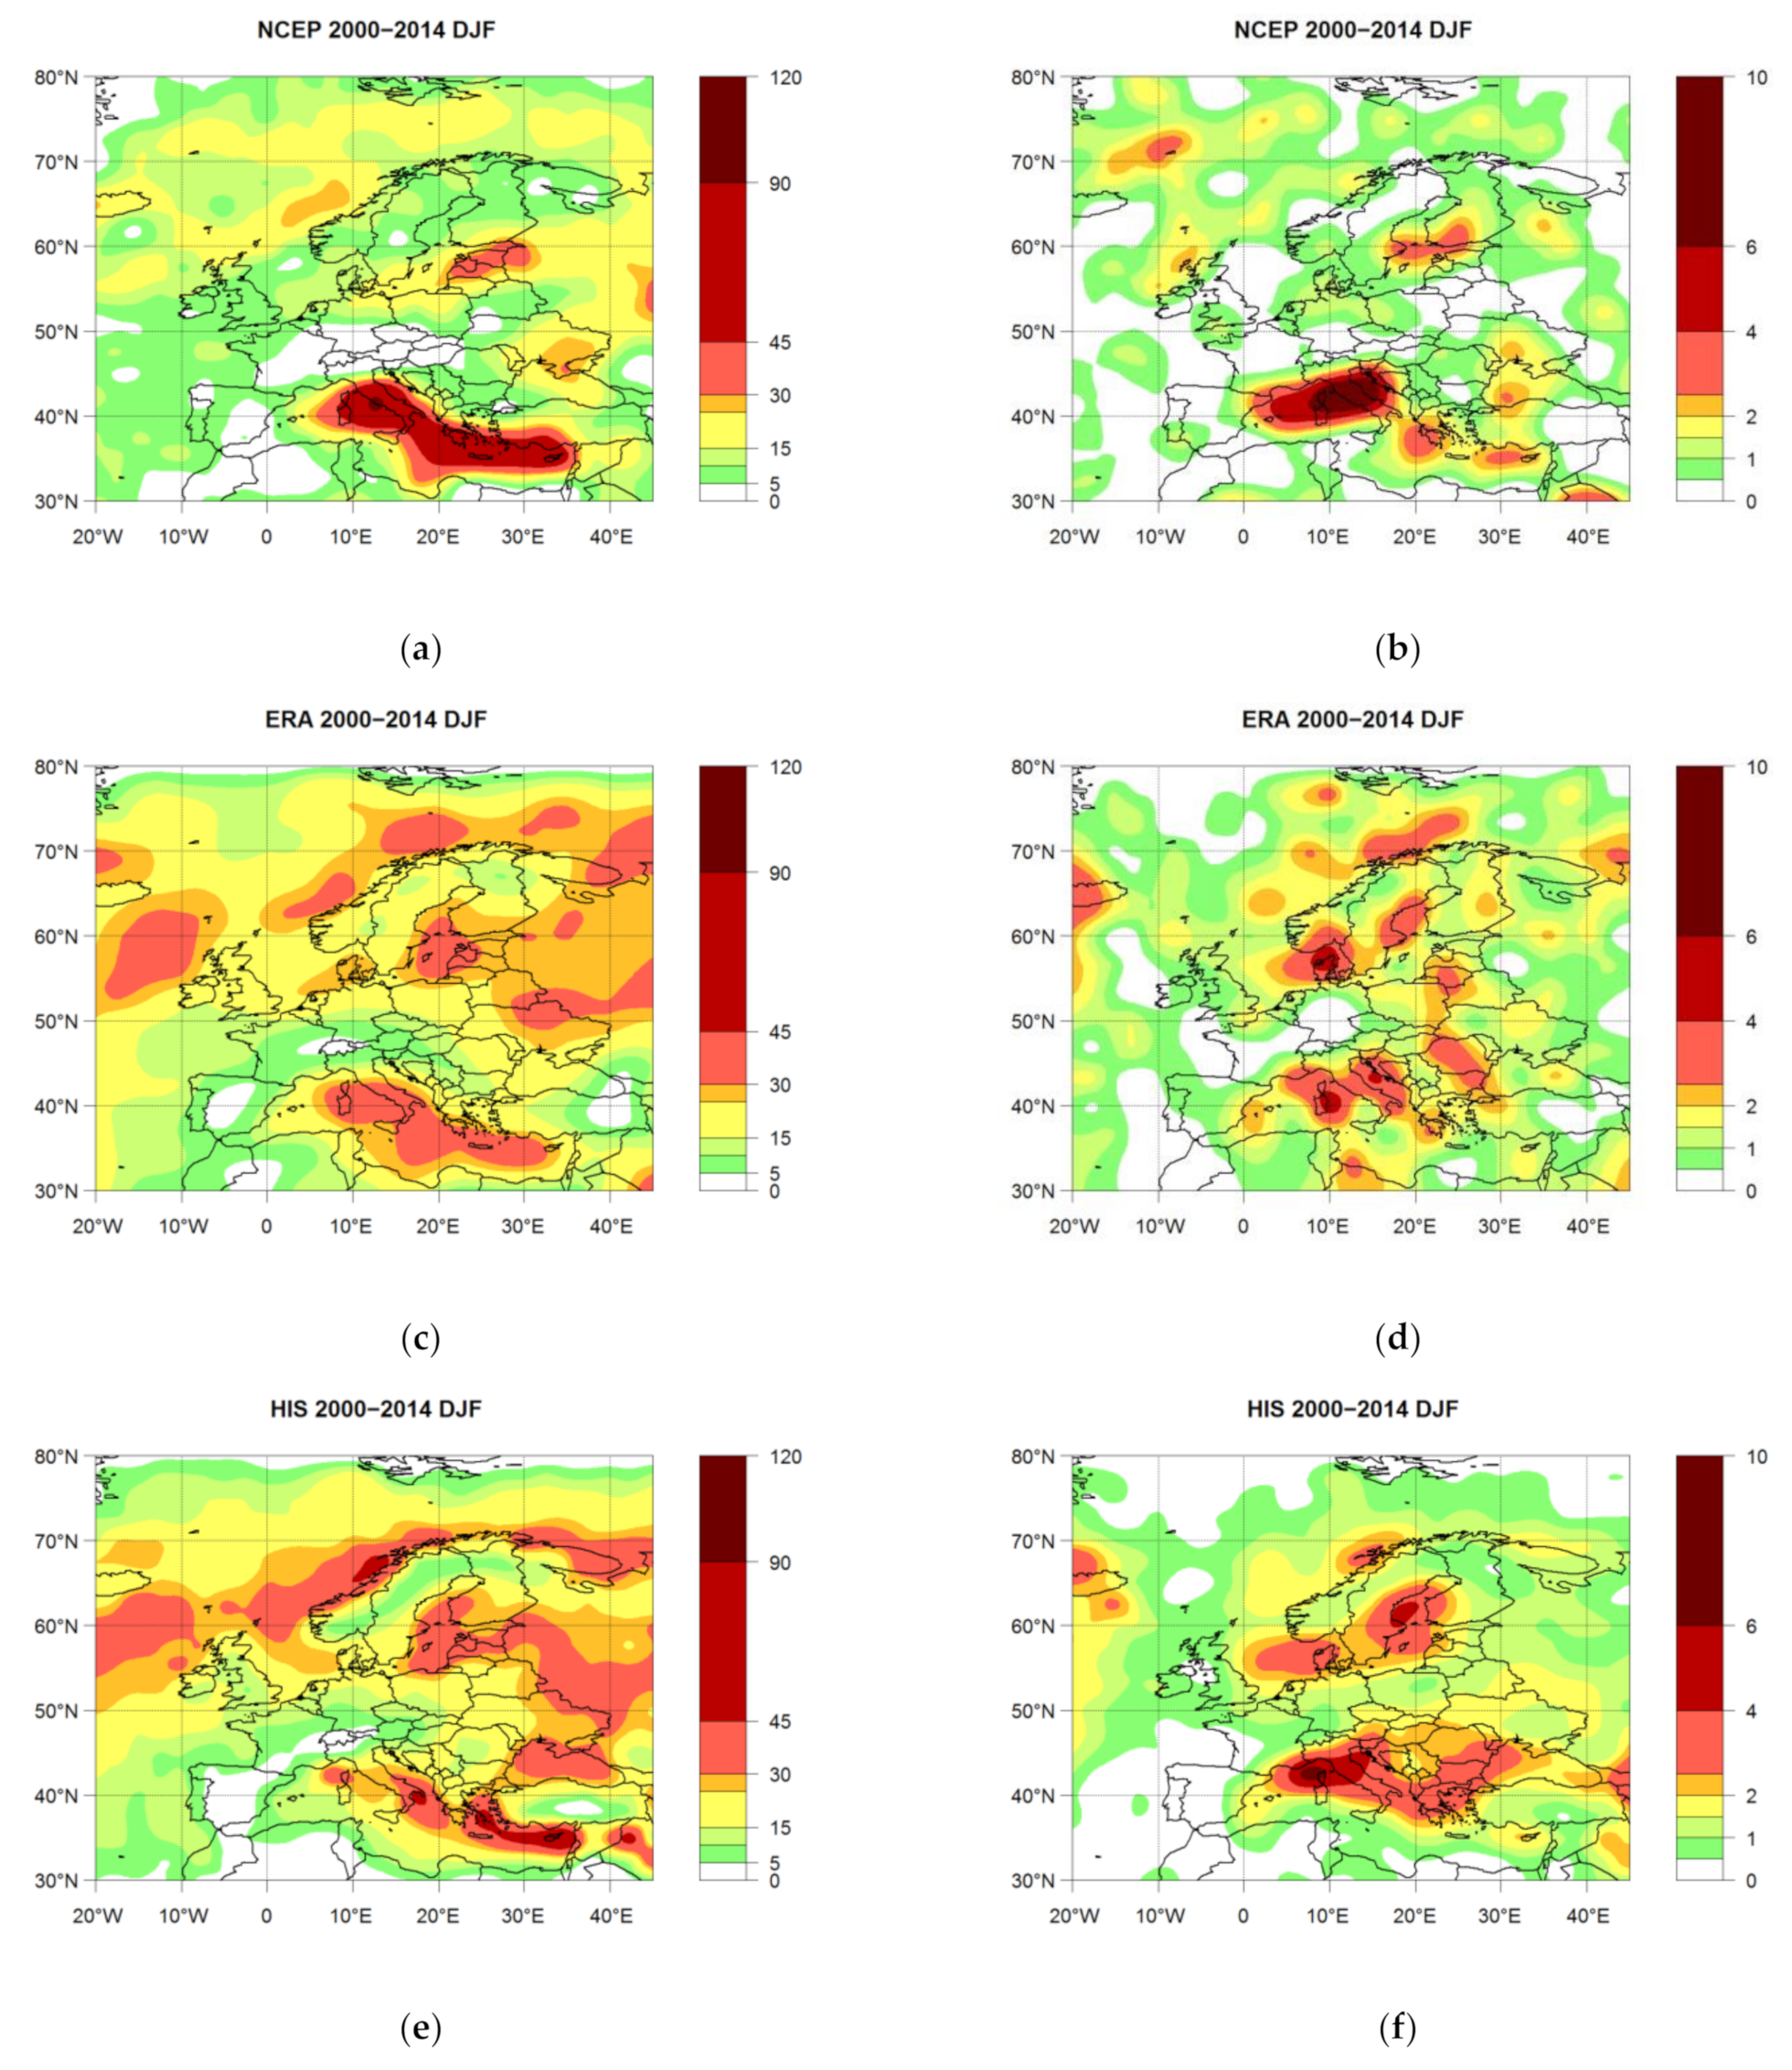
3.1. Comparison with Reanalyses

Cyclones were calculated over the North Atlantic–European sector for the recent historical period from 2000 to 2014 in the CMIP6 models (see Table 1) and compared with those obtained using NCEP/NCAR and ERA5 reanalyses. The monthly comparison results are shown in Table 2 and Table 3 for the cold period from October to March. For the other months, the comparison results were considerably worse than those shown in these tables. The best agreement was found for the months from November to February. In general, all models showed approximately the same level of correlation and root mean square error (RMSE) for these months, except for the MPI-ESM1-2-HR model. The correlation with ERA5 (NCEP/NCAR) reanalysis was in the range of 0.26 to 0.52 (0.18 to 0.4), and RMSE was in the range of 4.9 to 6.7 (4.6 to 7.8), respectively. Correlation coefficients that were significant at the probability level p = 0.001 started from 0.16. Model MPI-ESM1-2-HR had similar values of the correlation coefficients, but the RMSE values were almost twice as high as those of the rest of the models. The model MPI-ESM1-2-HR was excluded from the ensemble, mainly because of the high RMSEs, especially with NCEP/NCAR reanalysis, and the lower agreement with ERA5 reanalysis. The ensemble included seven remaining models, which were characterized by the best correlation and the lowest root mean square error.
The ensemble values were calculated as the average cyclone numbers in each point of the normalized 2.5° × 2.5° grid and totaled for each 15 year period. The results of the comparison (Table 2 and Table 3) led us to the decision to focus our analysis on the conventional winter season and the winter months from December to February.

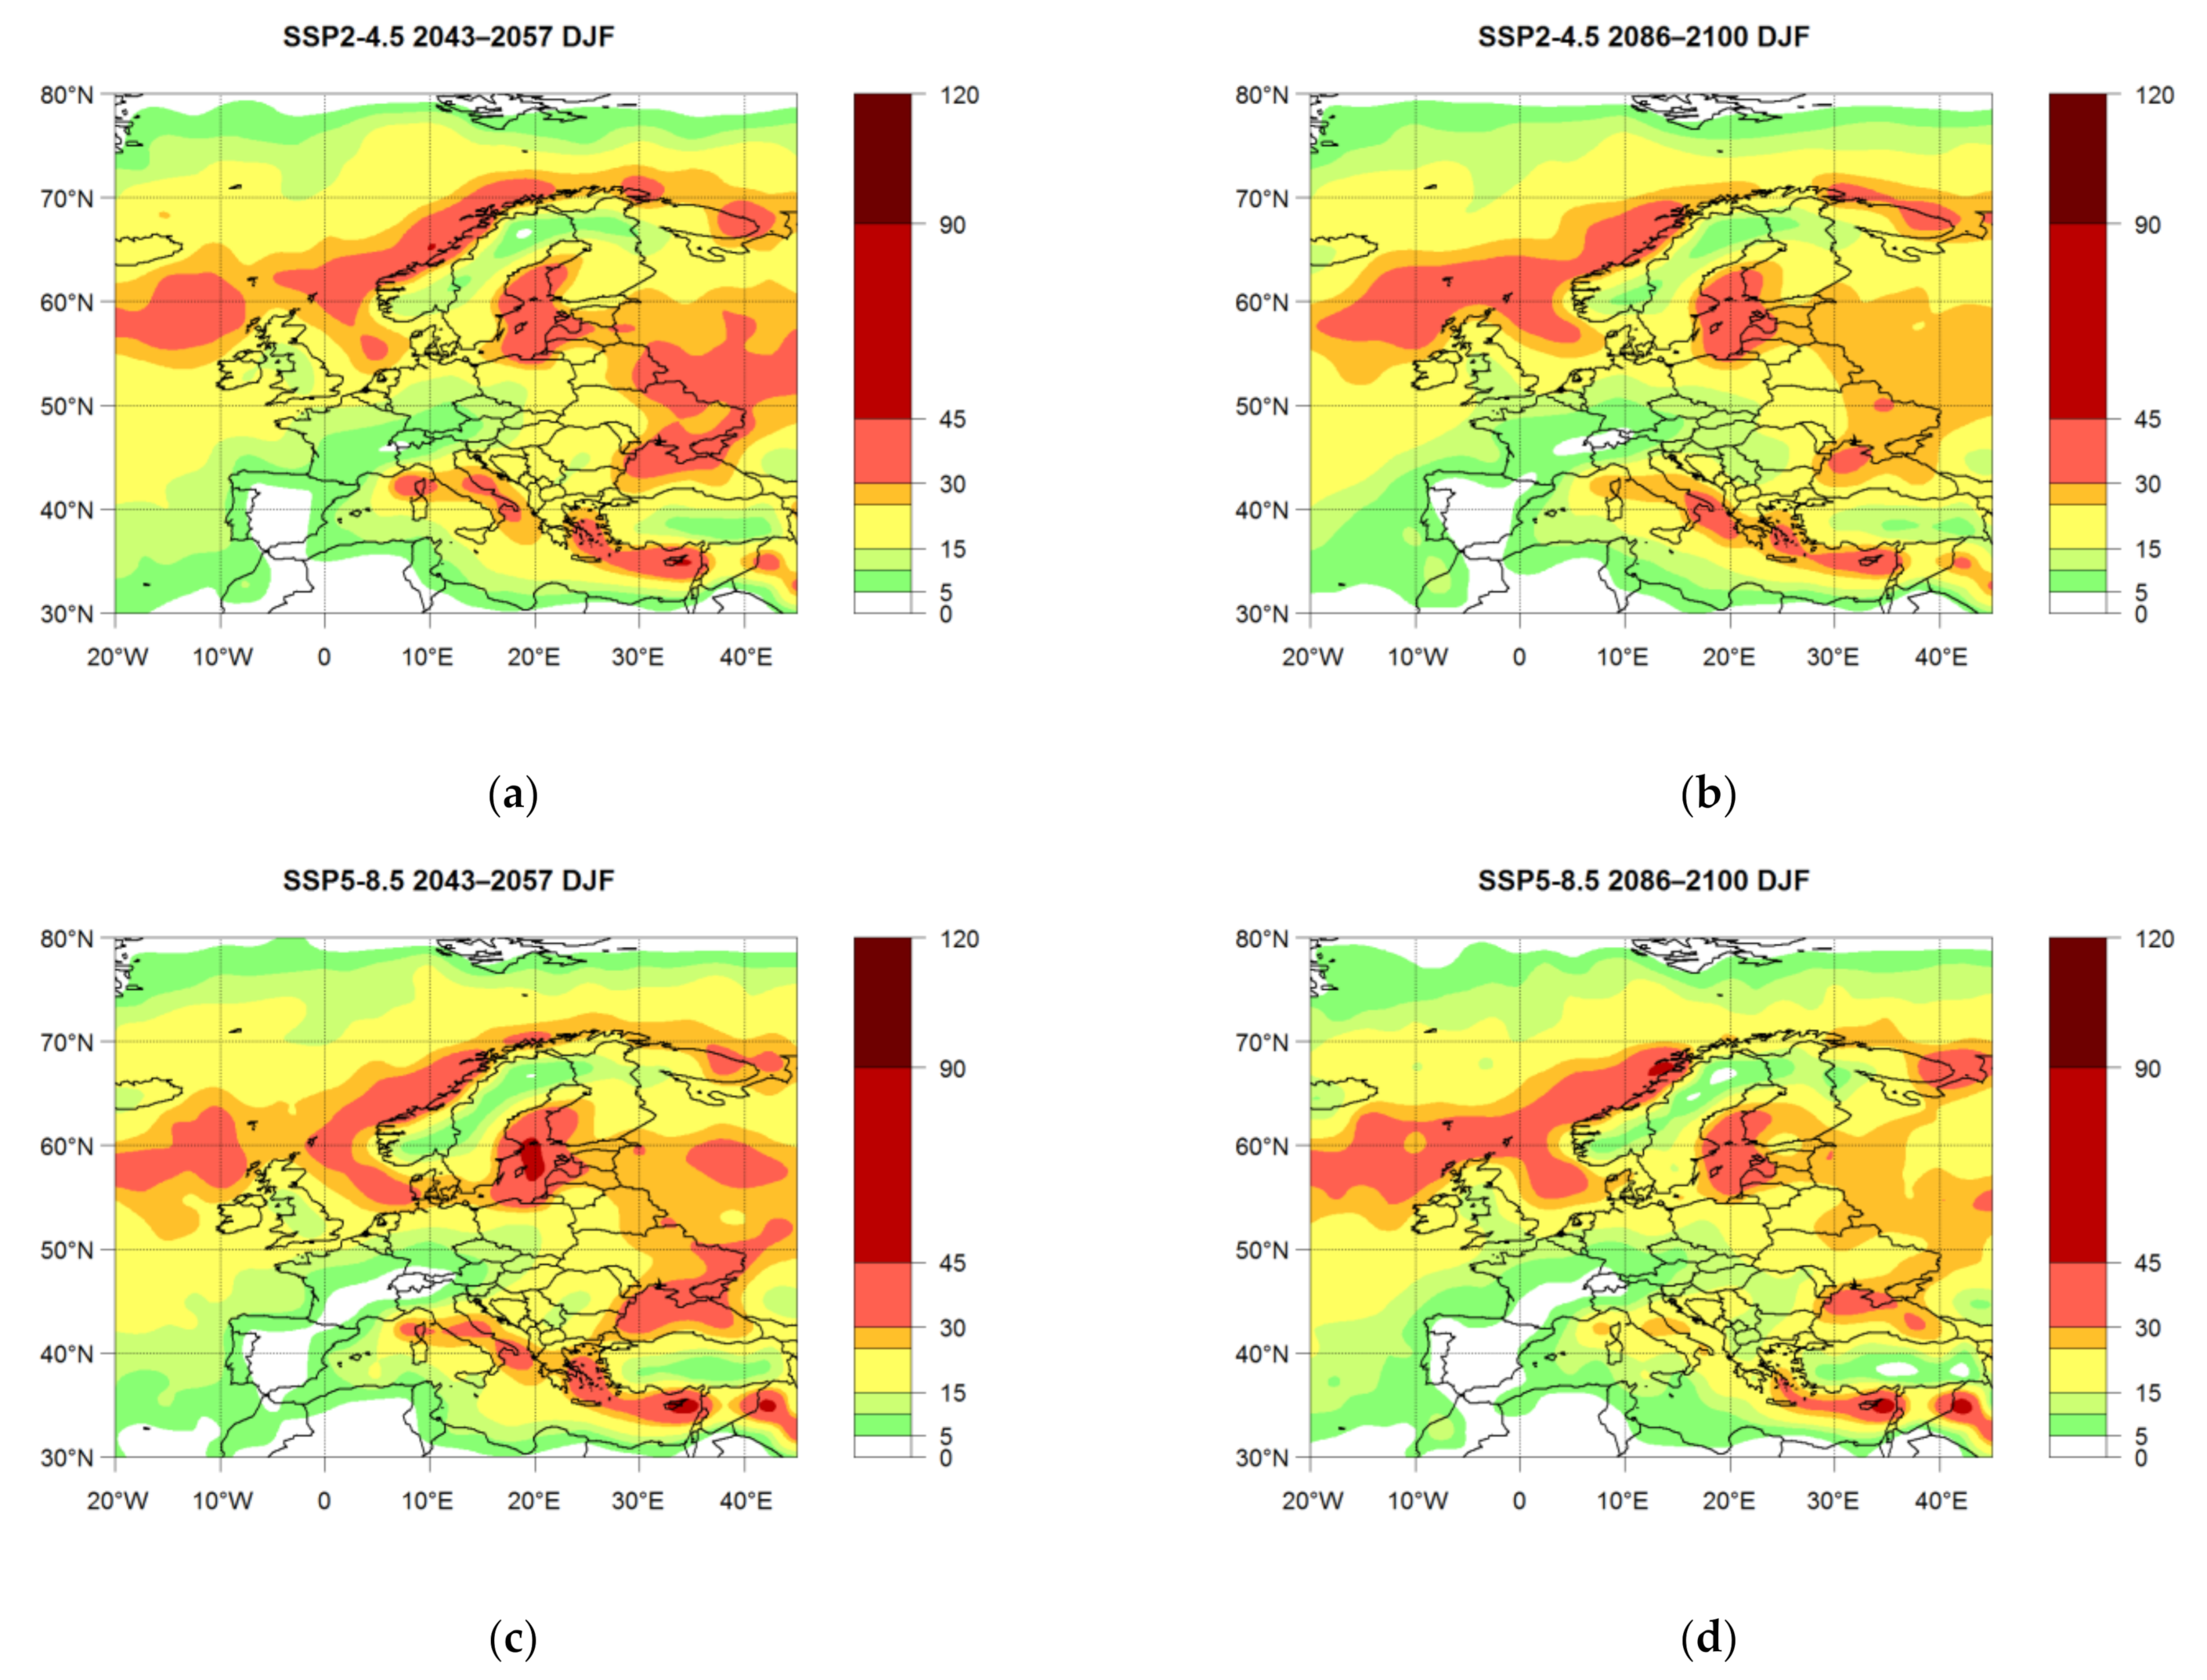
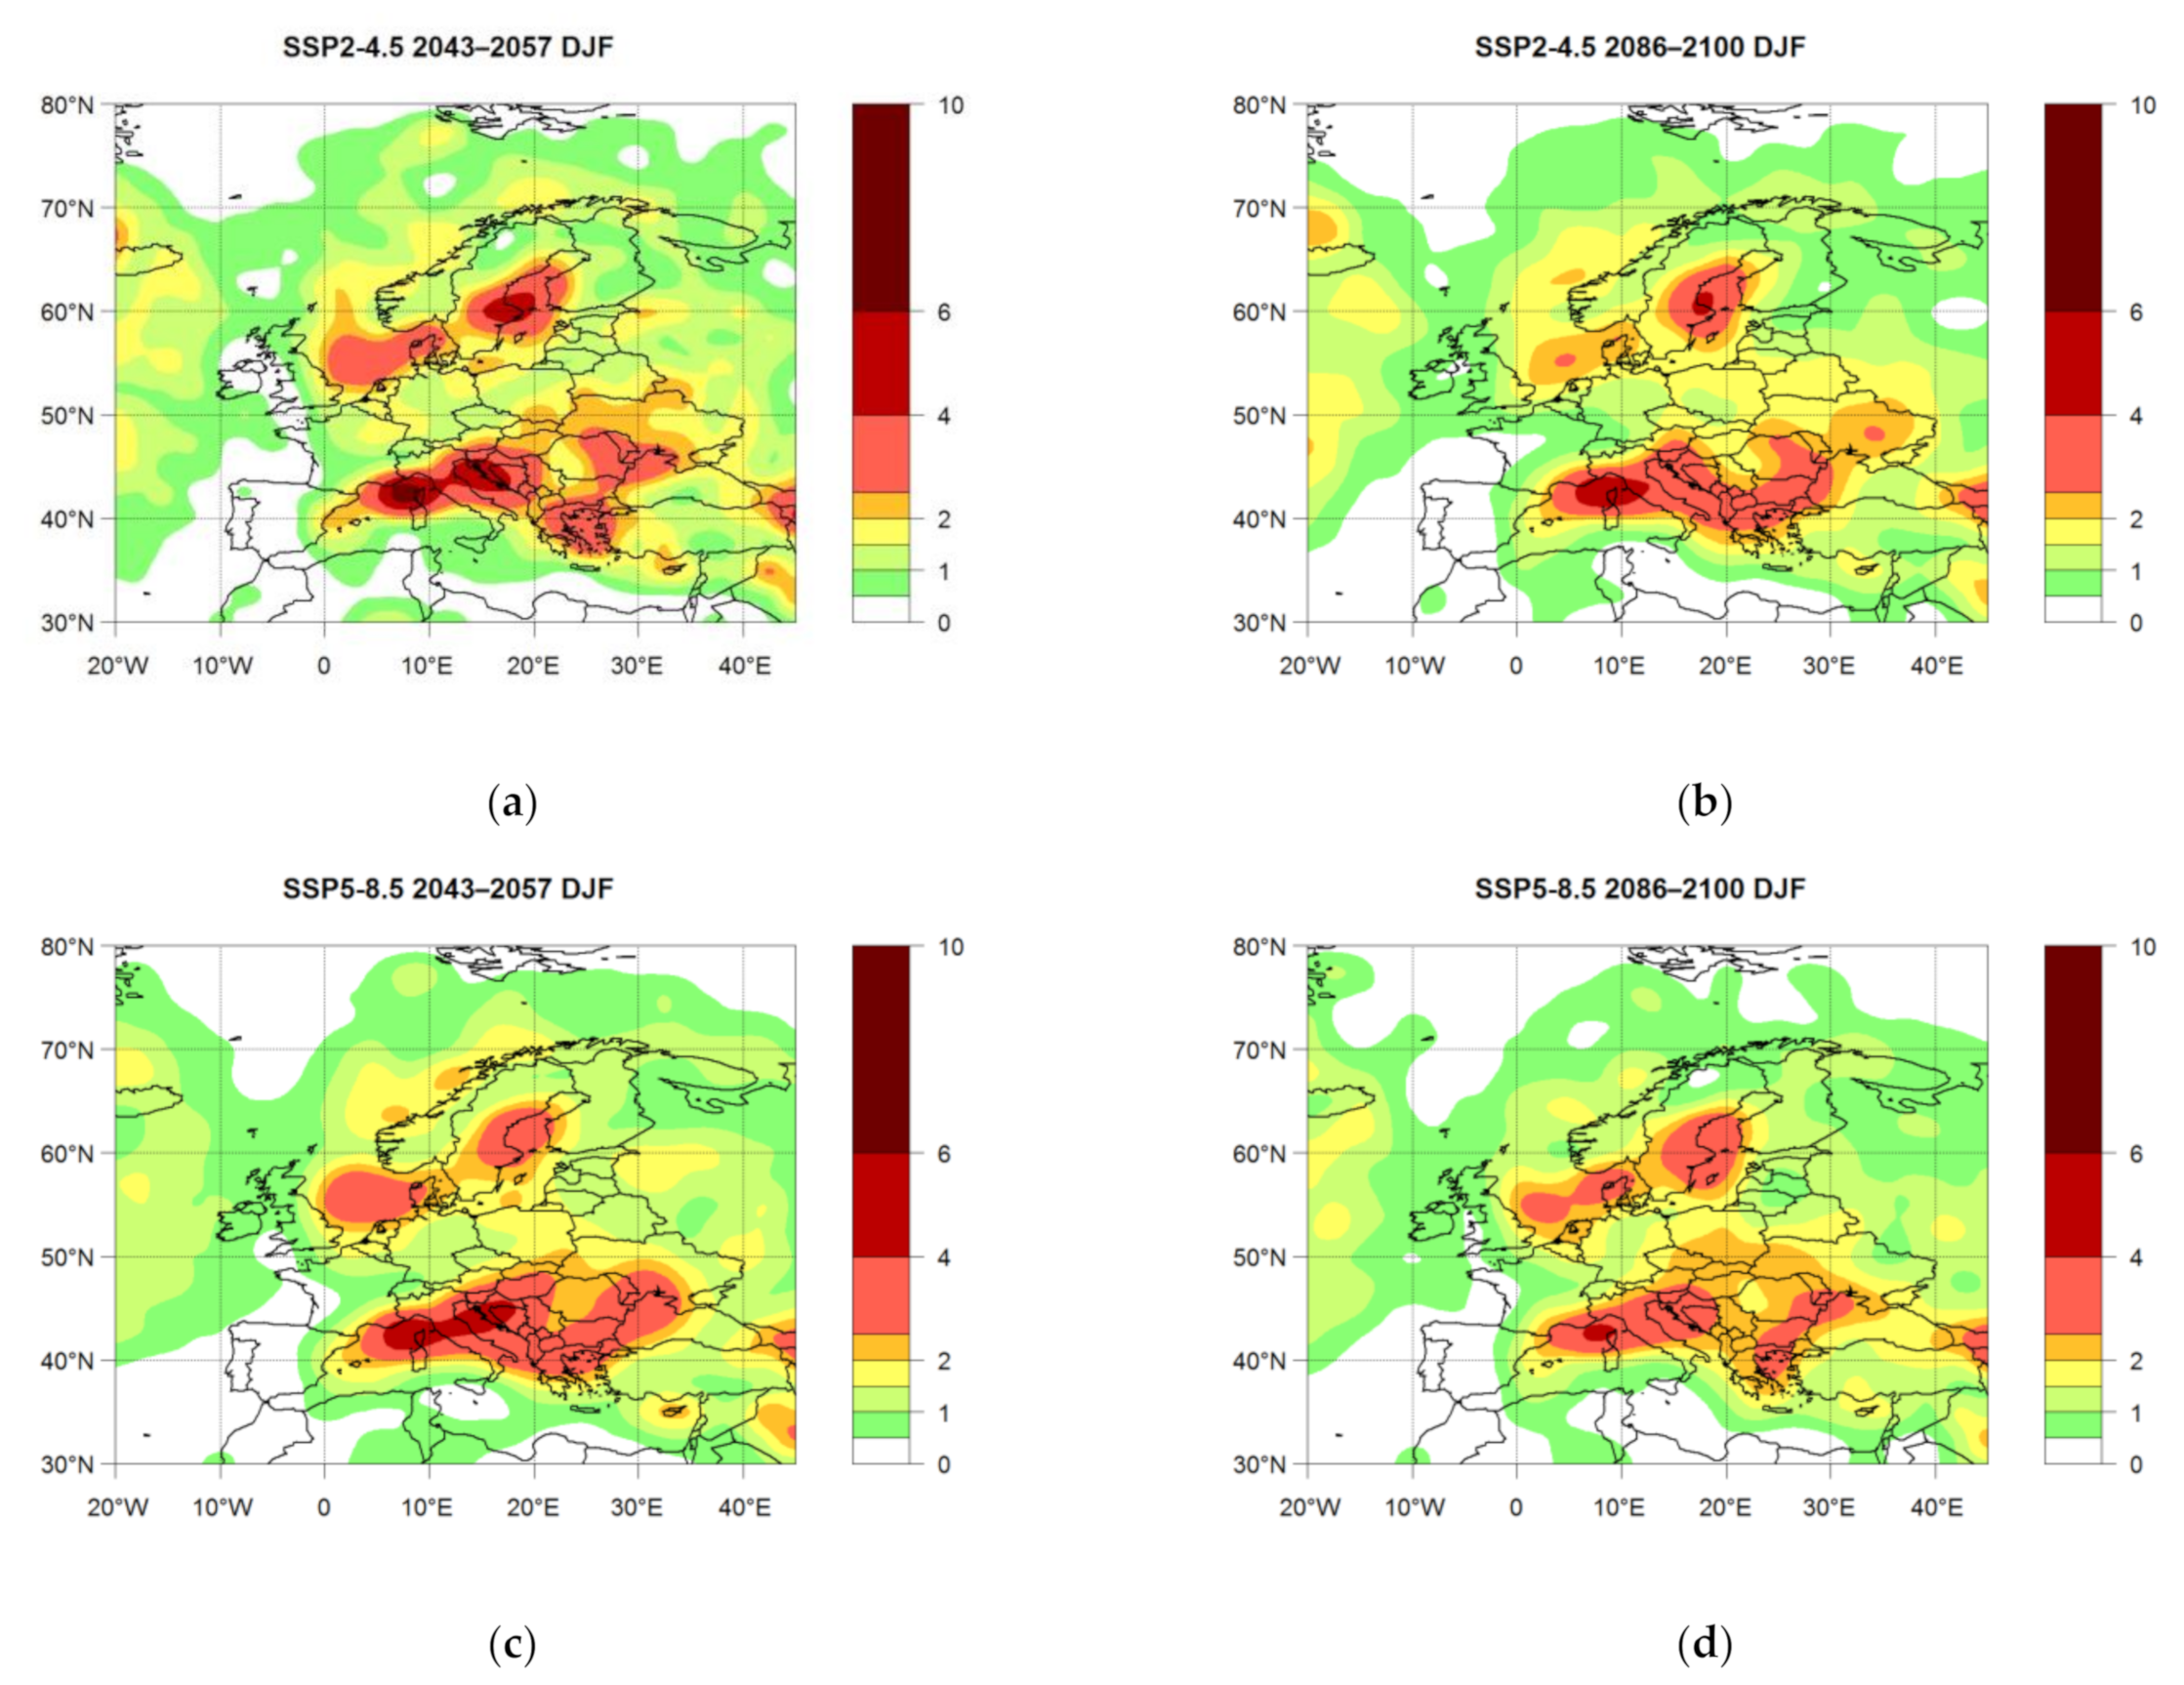
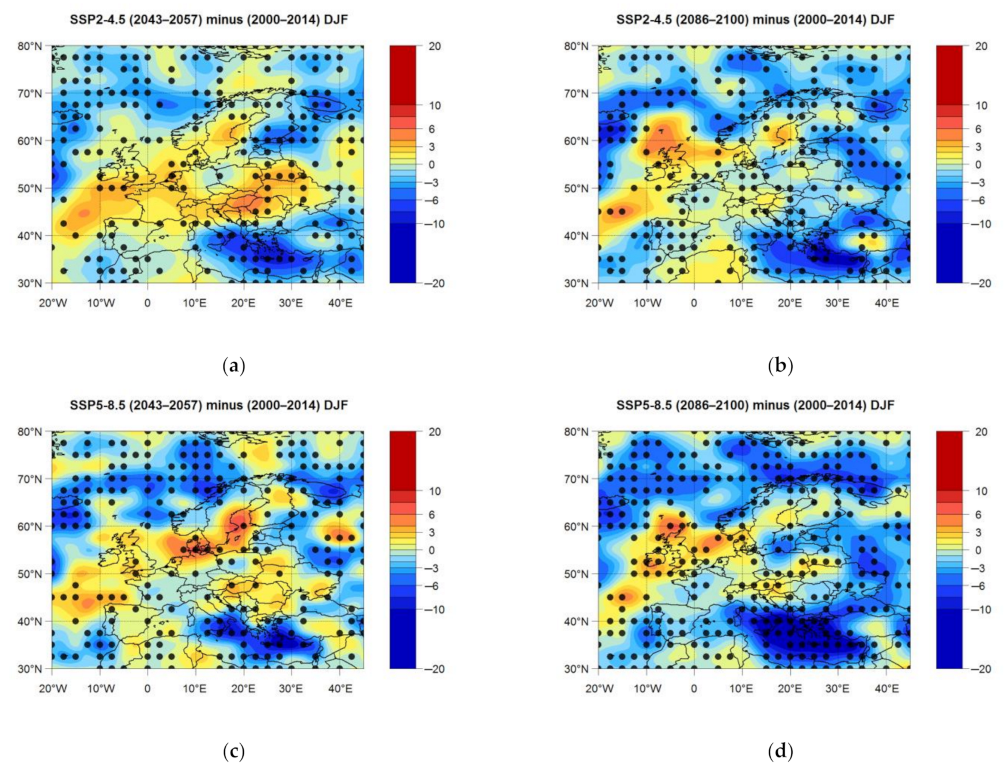
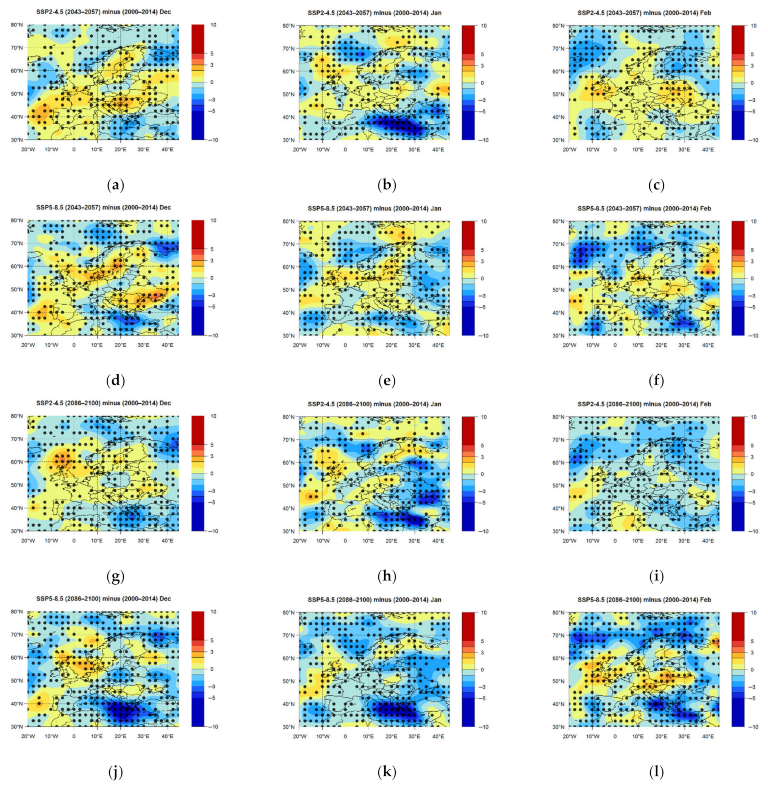
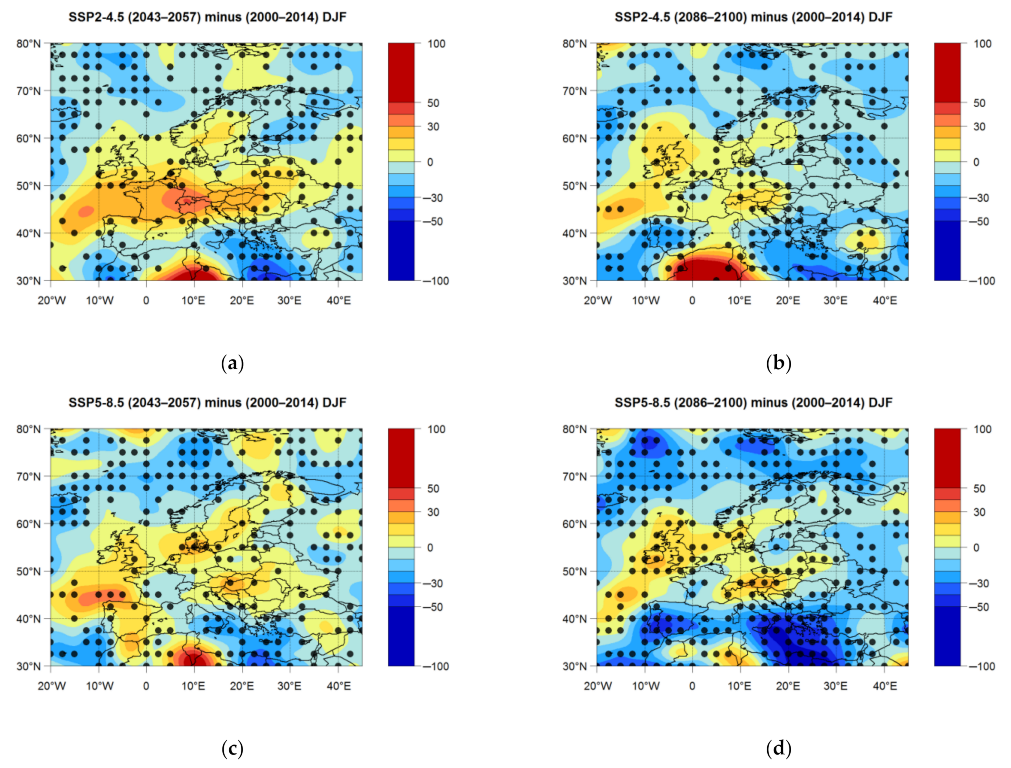
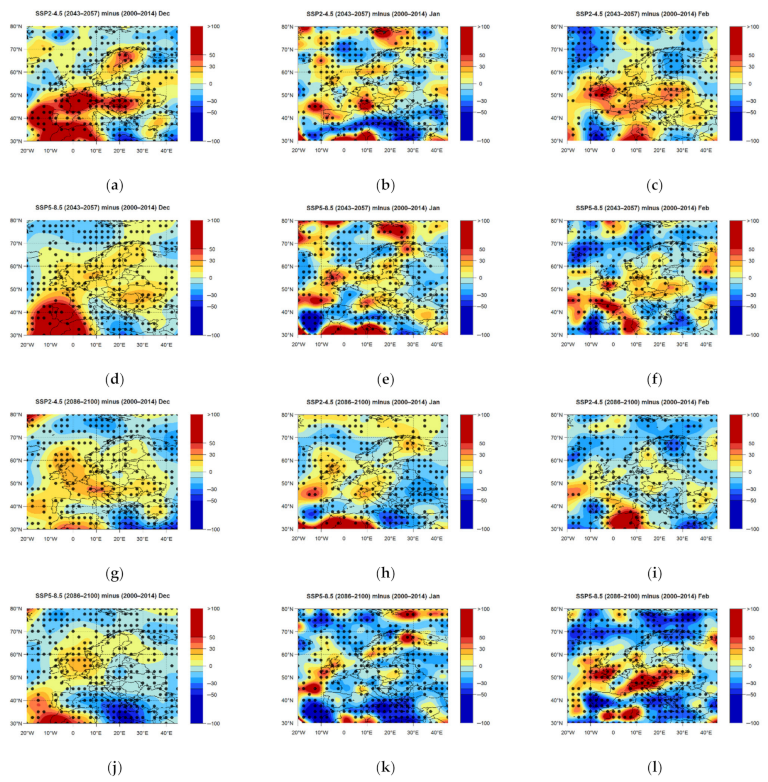
3.2. Ensemble Fields

Figure 2 shows the frequency of the winter (DJF) cyclones and the number of cyclogenesis events over the recent historical period from 2000 to 2014 in the North Atlantic–European sector, identified using NCEP/NCAR and ERA5 reanalyses and the CMIP6 ensemble. The spatial patterns of the frequency of cyclones detected using different sources (Figure 2a,c,e) were similar. Their differences in the representation of details and cyclone numbers were attributed to the resolution of the models. As for the number of cyclogenesis events (Figure 2b,d,f), there was slightly less similarity in the spatial patterns, but the location of the main centers was roughly consistent. In general, the fields of the frequency of cyclones and the number of cyclogenesis events for the CMIP6 ensemble were in better agreement with ERA5 reanalysis than with NCEP/NCAR reanalysis, which was also indicated by the quantitative estimates in Table 3, compared with Table 2.
For the CMIP6 ensemble, the maximum winter frequency of cyclones in the Mediterranean basin in the recent historical period (Figure 2e) was over half of the water area along the northeastern coast of the Mediterranean Sea, approximately from Corsica to Cyprus, with an increase to the east. Other maxima were over the northeastern part of the North Atlantic (to the south of Iceland, over the North Sea, off the coast of the Norwegian Sea), and over the continent and inland seas (the Baltic Sea, over the Black Sea, and north of it to the White Sea). The month of the highest winter frequency of cyclones was January, and the lowest frequency was in February (not shown). The main cyclogenesis areas, according to the CMIP6 ensemble (Figure 2f), were located along the northern Mediterranean coast from the Gulf of Lion to the west of the Black Sea, over the Baltic Sea and the North Sea, over Iceland, and partly over the Norwegian Sea. These cyclogenesis areas were consistent with previous studies, e.g., [81].
Figure 3 and Figure 4 show the frequency of the winter cyclones and the number of cyclogenesis events in the North Atlantic–European sector projected for the middle (2043 to 2057) and end (2086 to 2100) of the 21st century in the CMIP6 ensemble under the SSP2-4.5 and SSP5-8.5 scenarios. Almost all areas with maximum cyclone numbers are predicted to shrink and become noticeably weaker at the end of the century, except for the numbers over the northeastern part of the North Atlantic. For the Mediterranean Sea, the largest decrease was in January (not shown). The SSP5-8.5 scenario was characterized by lower values of cyclone numbers than the SSP2-4.5 scenario, which is consistent with future climate change responses in the regions based on global [19] and local [43] scales.
To characterize these differences, Figure 5 shows absolute anomalies (while Figure A1 shows relative anomalies in %) of the frequency of winter cyclones in the middle (from 2043 to 2057) and end (from 2086 to 2100) of the 21st century, relative to the recent historical period of the beginning of the century (from 2000 to 2014). The patterns of anomalies looked very much alike for different scenarios for the same period, but with larger differences for the SSP5-8.5 scenario than for the SSP2-4.5 scenario in the areas of the greatest anomalies. For example, such estimates, but for the zonally averaged storm track over the northern hemisphere at the end of the 21st under the RCP8.5 scenario, were almost twice as large as those projected for the mid-21st century [19].
In the spatial structure of absolute anomalies, there was a consistent increase among the models over Central Europe and the British Isles and a decrease over the eastern part of the Mediterranean Sea and in the north of the region (Iceland, the North Sea, and the White Sea). The relative anomalies in Figure A1 were characterized by the same spatial pattern, but different allocations of maxima and minima. The brightest anomalies (the largest and smallest percentages) were located on the African coast of the Mediterranean Sea: positive anomalies to the west of the Gulf of Sidra, and negative anomalies to the east. In the whole region, moving from the middle of the century under the SSP2-4.5 scenario to the end of the century under the SSP5-8.5 scenario, there was a general decrease in pronounced positive anomalies over Western Europe and Central Europe, as well as an expansion of negative anomalies, especially in the eastern part of the Mediterranean Sea and over the Iberian Peninsula (Figure A1).
This spatial structure was consistent with the results of simulations of cyclonic activity for the 21st century in [9,27,41]. The regional climate model (RegCM) under the IPCC’s A2 and B2 emission scenarios [41] showed higher cyclone frequency at the end of the century under the A2 and B2 scenarios over the North Sea, Central Europe, and to the west of the British Isles, and lower frequency over Cyprus (under the B2 scenario) and eastern Mediterranean (under the A2 scenario). The CMIP5 models under the RCP4.5 emission scenario [9] showed that the winter (DJF) response was characterized by a tripolar pattern over Europe, with an increase in the number of cyclones in Central Europe and a decreased number of cyclones in the Norwegian Sea and the Mediterranean Sea, as a result of the eastward extension of the Atlantic storm track into Europe. The CMIP6 models featured by the SSP2-4.5 and SSP5-8.5 scenarios, [27] also showed an extension of the North Atlantic storm track into Europe, an increase in the track density over northwestern Europe and particularly the British Isles, and a decrease in activity over the Mediterranean region, southwestern Europe, and the Norwegian Sea. This tripolar pattern was consistent with the dipole pattern found in [8], which showed a significant increase in the frequency of dry weather types over the Iberian Peninsula and an opposite signal over the British Isles, associated with a stronger north-to-south dipole in terms of pressure and precipitation distributions, enhancing the water vapor transport toward central Europe rather than to the Iberian Peninsula [8]. An increase, in most models, of the future number of intense cyclones in winter over the British Isles and the northeastern Atlantic was mentioned in a previous review [29], while the total number of extratropical cyclones will be reduced under anthropogenic climate change conditions [29]. A previous review [30] concluded that future scenarios at the end of the 21st century mostly indicated an increase in winter storm intensity over Western Europe.
Figure 6 shows absolute monthly winter anomalies (while Figure A2 shows relative anomalies in %) that are characterized by regional features. The greatest negative absolute anomalies were observed in January for both scenarios, especially in the eastern Mediterranean region, and the greatest positive anomalies were in December at about 50° N to 60° N, including the western shores of Europe, while in February the anomalies were less pronounced. The maps of monthly relative anomalies in percentages (Figure A2) show greater contrasts. For example, in January, at the middle of the century under both scenarios, the greatest positive anomalies (>100%) were in the western Mediterranean region near Gibraltar (Figure A2a,d), in contrast to the negative anomalies in this area in February (Figure A2c,f). At the end of the century, the brightest regional contrasts (negative areas in the eastern and western Mediterranean region versus positive spots over Europe) were in January and February under the SSP5-8.5 scenario (Figure A2k,l).
In addition to the winter season anomalies (Figure 5 and Figure A1), the anomalies for the winter months (Figure 6 and Figure A2) were characterized by a similarity of the spatial patterns under different scenarios in the same period, which were especially noticeable for December and January. At the same time, the SSP5-8.5 scenario was characterized by the prevalence of negative anomalies of the frequency of cyclones over the North Atlantic–European sector in general, but with regional and monthly features. Therefore, under the SSP5-8.5 scenario, compared with the SSP2-4.5 scenario, along with negative anomalies there were brighter positive anomalies in different parts of Europe in December in the middle of the century (Figure 6a,d and Figure A2a,d) and in February at the end of the century (Figure 6i,l and Figure A2i,l). In January, in the middle of the century, negative anomalies in the eastern Mediterranean Sea were less pronounced under the SSP5-8.5 scenario than under the SSP2-4.5 scenario (Figure 6b,e and Figure A2b,e).

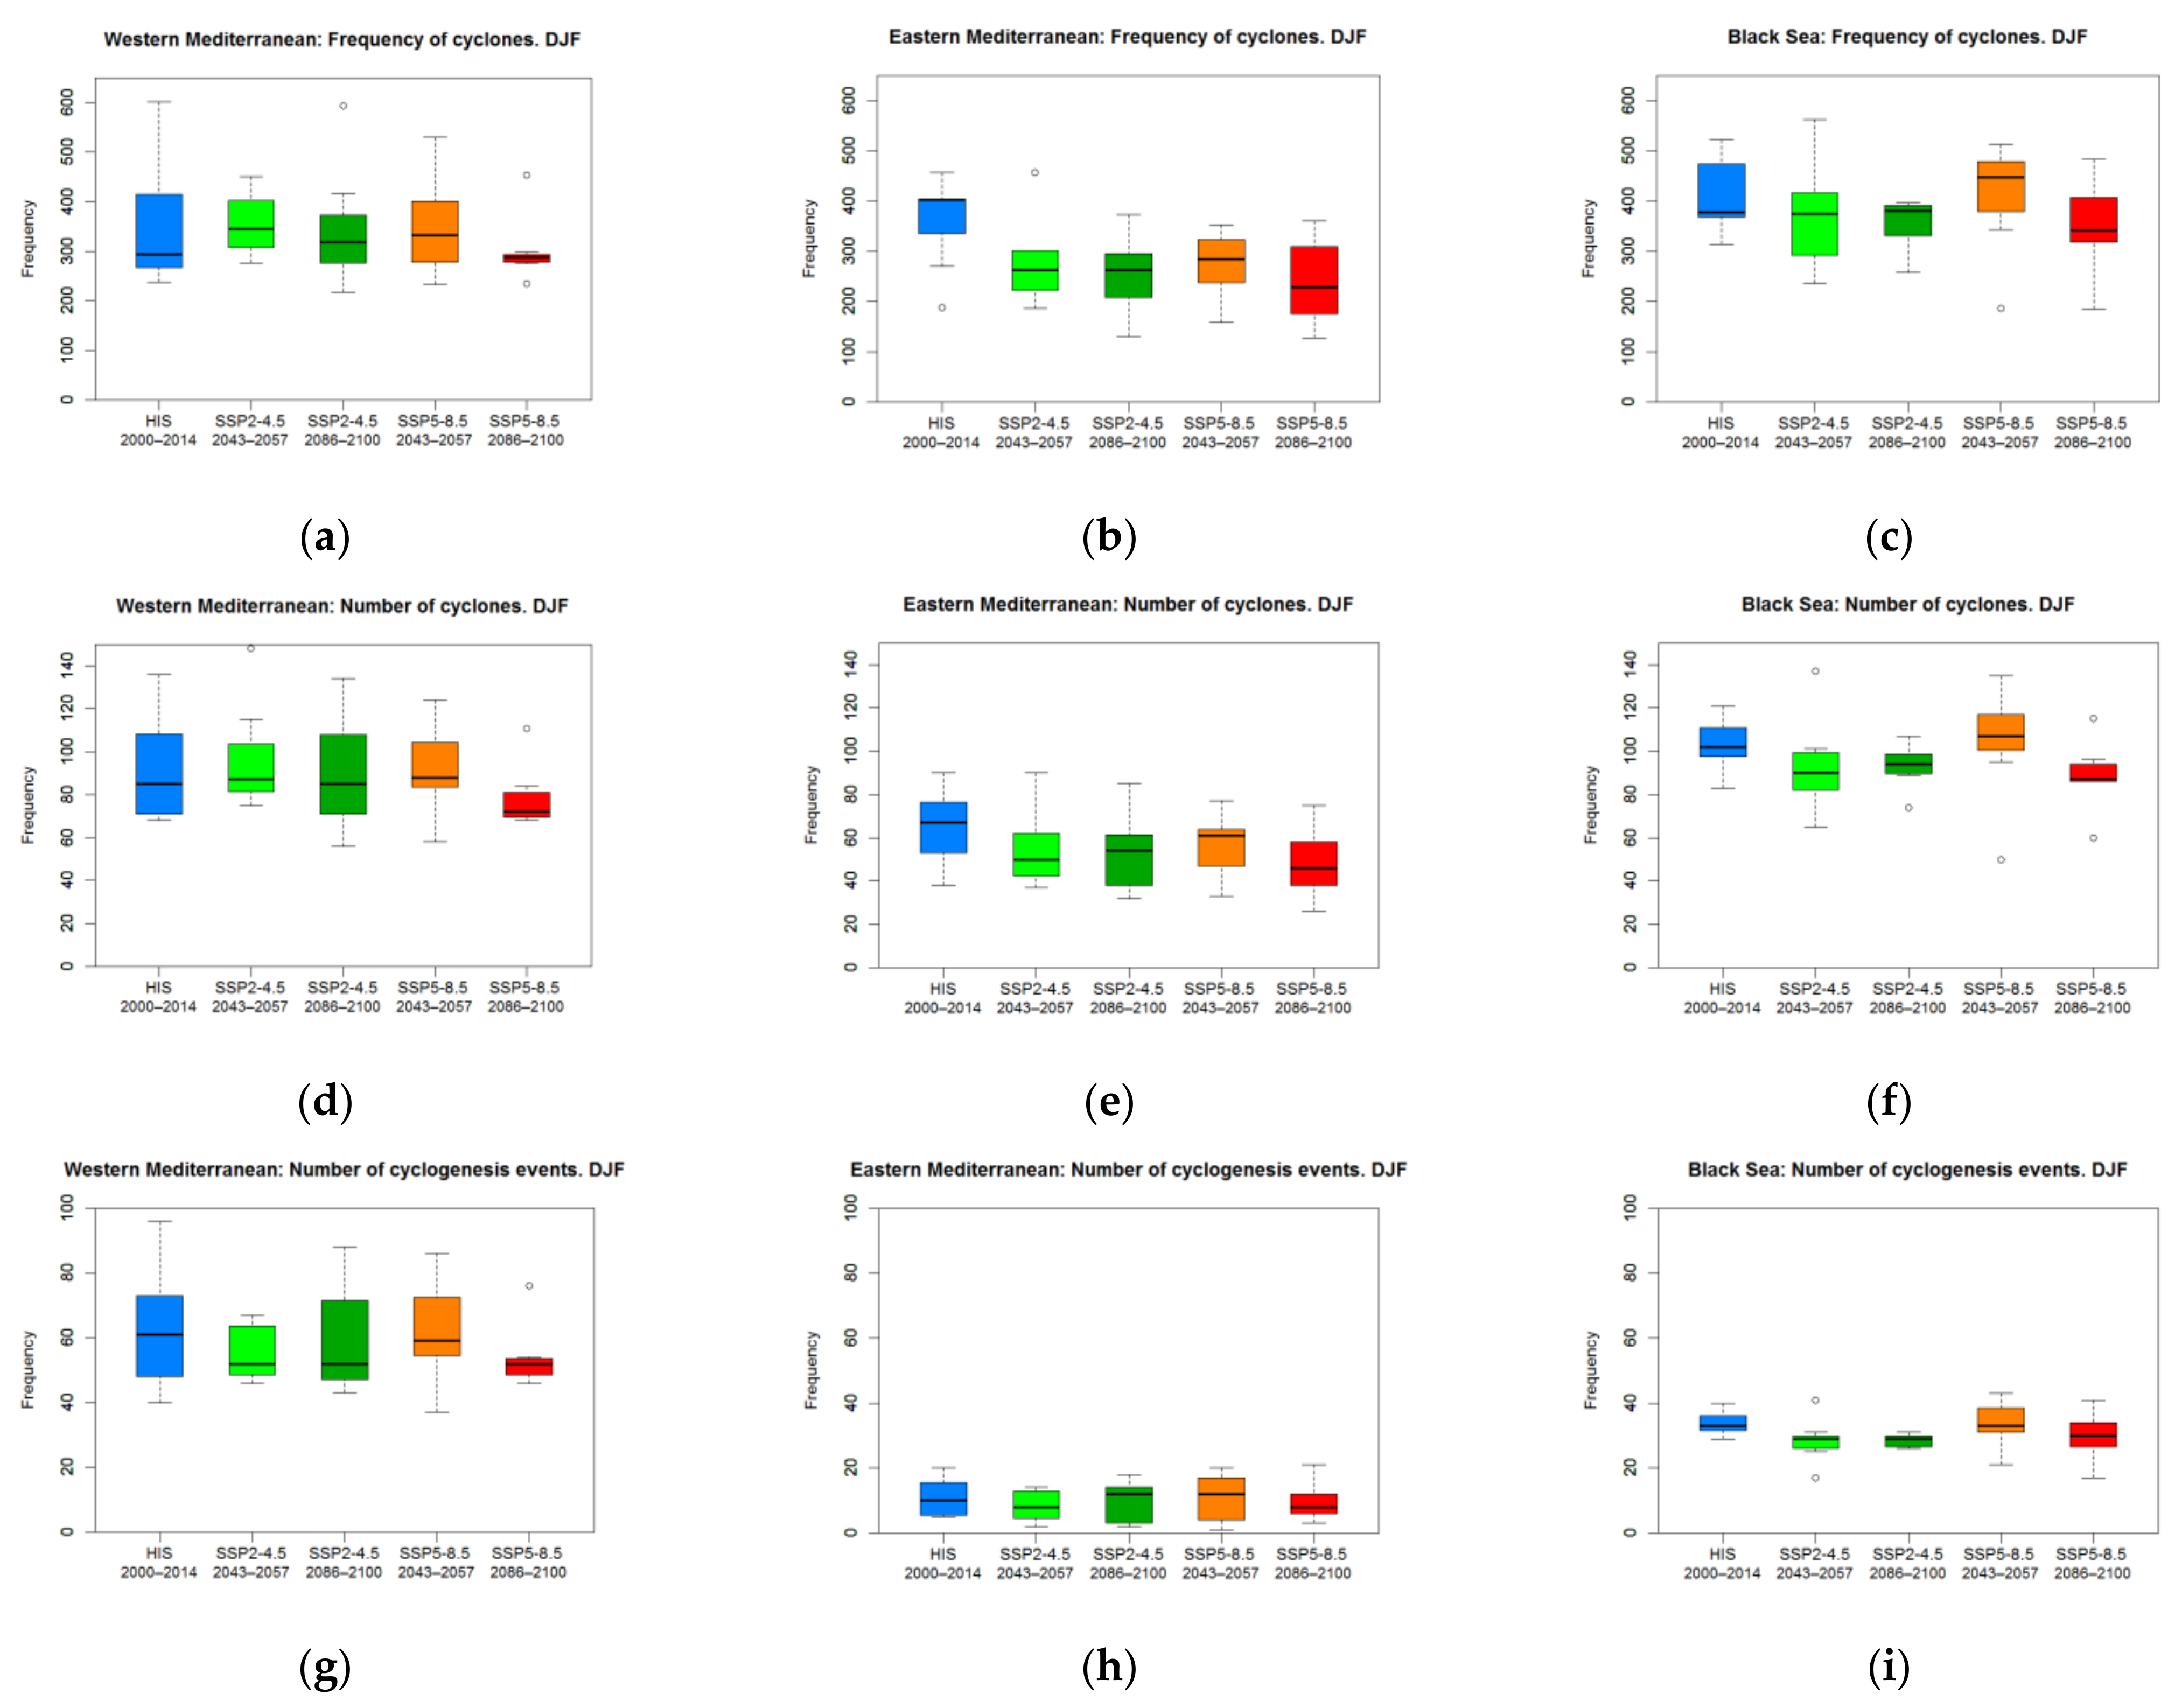
3.3. Area-Averaged Cyclone Numbers

Figure 7 shows area-average winter cyclone numbers (the frequency of cyclones, the number of cyclones, and the number of cyclogenesis events) at the beginning, middle, and end of the 21st century for three subregions: the western Mediterranean, the eastern Mediterranean, and the Black Sea. For all subregions under the considered scenarios, there was no continuous reduction in cyclone numbers in the 21st century, as was the case, for example, for the total number of northern hemisphere winter extratropical cyclones in the CMIP6 models in [27] and for the zonally averaged midlatitude storm tracks in the CMIP5 models in [19]. The highest and lowest values of cyclone numbers (measured by the median of the boxplots in Figure 7) were projected under the SSP5-8.5 scenario, at the middle and end of the 21st century, respectively.
Under the SSP2-4.5 scenario, in the western Mediterranean subregion, cyclone numbers (frequency and cyclogenesis events) were projected to increase in the middle of the century and to fall by the end of the century to the level of recent cyclone numbers at the beginning of the century, but not at the expense of cyclogenesis events within this subregion, which were expected to decrease in the middle of the century and not to change (in the boxplot median of the ensemble of CMIP6 models) by the end of the century. An expected increase in cyclone numbers in the western Mediterranean subregion in the middle of the century may be associated with an increase in cyclogenesis events over the Balearic Sea (Figure 4a,b). This result was consistent with the result for strong cyclone systems (<995 hPa) in winter over the northwestern Mediterranean subregion in [56], which showed that cyclone numbers in a regional model (REMO) under the (IPCC SRES) B2 scenario were higher in the mid-century (from 2030 to 2064) and lower in the end of the century (from 2065 to 2099) than in the beginning (from 1995 to 2029) of the period.
In the eastern Mediterranean and the Black Sea subregions, cyclone numbers under the SSP2-4.5 scenario were expected to decrease in the middle of the century (with the largest drop in the frequency of cyclones for the eastern Mediterranean subregion, as shown in Figure 7e), and then stay at the same level till the end of the century. We obtained milder area-averaged responses for the whole eastern Mediterranean subregion than were found using the CMIP5 models in [43] for the local Cyprus low-circulation type, which showed consecutive reduction in its frequencies for the historic period (from 1986 to 2005), the mid-century period (from 2046 to 2065), and the end of the century period (from 2081 to 2100) periods, under the RCP4.5 and RCP8.5 scenarios. In general, at the end of the century under the SSP5-8.5 scenario, our results with the largest reduction in cyclone numbers were consistent with the highest global greenhouse gas radiative forcing among all SSP scenarios [82]. Under the SSP2-4.5 scenario, our results, with similar values of cyclone numbers in the middle and end of the 21st century, did not follow the increase in global greenhouse gas radiative forcing, but were consistent with additional global greenhouse gas (carbon dioxide and methane) emissions, which will slow their growth after 2050 and stabilize by 2100 [82]. Such a proportion of future changes was shown using a CMIP5 multimodel ensemble projection of the zonally averaged midlatitude winter storm tracks over the northern hemisphere [19]. Numbers of storm tracks were shown to be close for the middle and end of 21st century under the RCP4.5 scenario, as well as for the mid-21st century under the RCP8.5 scenario [19]. At the end of the century under the RCP8.5 scenario, the projected changes in storm tracks were almost twice as large as the changes projected for the mid-21st century [19].
Such varying cyclone change responses in the Mediterranean–Black Sea subregions in the middle and end of the 21st century did not correspond with the monotonous global temperature changes projected for the 21st century and associated with greenhouse gas forcing. These fluctuating changes may be linked, on the one hand, to long-term (decadal–multidecadal) variability or, on the other hand, to regional features associated with the averaging procedure; i.e., to what anomalies fall within the selected boundaries of the subregions. Considerable quasiperiodic long-term (interannual and decadal) variability was observed in the projected time series for the 21st century of different climate variables, e.g., in the storm track frequency over the North Atlantic [16,28], Western Europe [83] and the Mediterranean region [26], in water vapor transport from the North Atlantic [8], and in regression coefficients between cyclone-related temperatures and extreme precipitation [5,11]. Our previous studies also showed decadal-multidecal variability in the frequency of winter cyclones in the Mediterranean–Black Sea region in the second part of the 20th century, associated with Atlantic Multidecadal Oscillation and Pacific Decadal Oscillation [22,24,37]. These oscillations can amplify or compensate for regional anomalies of global warming in the 21st century [84,85,86].
However, researchers generally agree that these quasiperiodic anomalies are overwhelmed by the large changes projected for the 21st century [8], and anthropogenic forcing becomes dominant. Rare events, such as the most intense cyclones, do not show a consistent trend and may be attributed to long-term (e.g., decadal) variability rather than to greenhouse gas forcing [26].

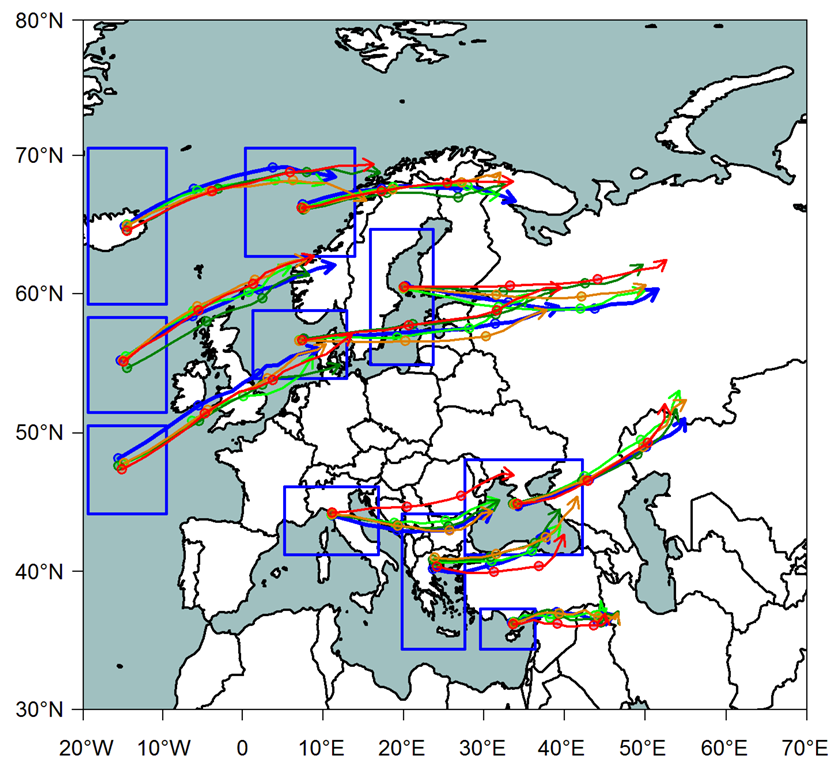
3.4. Average Cyclone Tracks

The changes in the local frequencies of cyclones over the North Atlantic–European sector may be associated, in addition to the changes in the number of cyclogenesis events, with the shift of the main North Atlantic storm track from one latitude to another. Figure 8 shows the average position of cyclone tracks originating from the cyclogenesis areas (blue rectangles in Figure 8), according to CMIP6 model simulations (see Figure 2f and Figure 4). To obtain average cyclone tracks during three previously selected 15 year periods, the average values of latitudes and longitudes of the emerging cyclones were calculated at each 6 h time step after their genesis. The average position of the cyclones is indicated in Figure 8 by circles at 0 h, 24 h, and 48 h after their genesis; the arrows mark the last considered position of cyclones at 72 h. Thus, the track length corresponded to 3 days.
As shown in Figure 8, the average cyclone tracks from the Icelandic cyclogenesis area and the most southern area among three North Atlantic cyclogenesis areas shifted southward under SSP2-4.5 and SSP5-8.5 scenarios in the periods of the middle and end of the century. Such southward shifts are consistent with the higher cyclone numbers projected for the British Isles, the North Sea, and the Baltic Sea. At the same time, cyclone tracks from the North Sea and the Baltic Sea cyclogenesis areas were characterized by the comparable northward shift at the end of the 21st century under both scenarios. Over the Mediterranean Sea, the most substantial shift in the average cyclone track was expected under the SSP5-8.5 scenario: northward for the western Mediterranean cyclogenesis area and southward for both the eastern Mediterranean cyclogenesis areas. For the Black Sea cyclogenesis area, the most pronounced shift was northward in the middle of the 21st century under the SSP2-4.5 scenario. The northward shift of the western Mediterranean cyclogenesis area was consistent with the higher frequency of cyclones over Central Europe.
The northward shift in average cyclone tracks in the middle latitudes agreed with the northward shift of the jet stream position [32] and positive anomalies of the 250 hPa meridional wind in the 40° N to 60° N latitudinal band, under different future scenarios of climate change in the 21st century [87]. In addition, in [88], based on the CMIP5 models, there was a decrease in the winter frequency of blockings in central and northwestern Europe, which corresponded to the northward shift in the average cyclone tracks from the western Mediterranean and the Black Sea cyclogenesis areas in this study.

4. Conclusions and Discussion

The following conclusions were reached on the basis of the analysis of winter (DJF) cyclonic activity (the frequency of cyclones, the number of cyclogenesis events, the number of cyclones, and the average cyclone tracks) in the Mediterranean–Black Sea region, as a part of the North Atlantic–European sector, at the beginning (2000 to 2014), middle (2043 to 2057), and end (2086 to 2100) of the 21st century, using the recent-generation CMIP6 multimodel ensemble simulation under the scenarios of the intermediate (SSP2-4.5) and highest (SSP5-8.5) emissions.
In general, for the North Atlantic–European sector, we showed that the recent (2000 to 2014) historical spatial patterns of the winter frequency of cyclones and the number of cyclogenesis events will apparently be maintained in the future, but most areas of maximum cyclonic activity are projected to shrink and become noticeably weaker, especially at the end of the century and under the SSP5-8.5 scenario. Absolute anomalies of the future frequency of winter cyclones, relative to the recent historical period at the beginning of the century, showed that, among the models there was a consistent decrease over the eastern Mediterranean Sea and north of Scandinavia, while there was an increase over Central Europe and British Isles (due mostly to the January and December input), and the value of the anomalies increased from the SSP2-4.5 to the SSP5-8.5 scenario.
This pattern was consistent with the dipole pattern shown in [8] using two domains (the British Isles and Iberia) and with a tripolar pattern over the European region that was mentioned, for example, in [9,27]. The reasons for the detected pattern are likely related to a poleward shift of atmospheric rivers and moisture corridors [8], an extension of the North Atlantic storm track into Europe [27]. The North Atlantic storm track slightly weakens on its northern and southern flanks in association with the North Atlantic jet stream, which strengthens and extends further into Europe under future climate change conditions [9,32]. Generally, this tripolar pattern over the Atlantic–European region is consistent with the broadening of the tropic and polar amplification of global warming in winter [13,14].
The area-averaged winter cyclone numbers (the frequency of cyclones, the number of cyclones, and the number of cyclogenesis events) over the western Mediterranean, the eastern Mediterranean, and the Black Sea subregions are not expected to show continuous reductions, on the one hand, from the beginning to the end of the century and, on the other hand, when moving from the milder (SSP2-4.5) to the more extreme (SSP5-8.5) scenario. Nevertheless, the largest drop of the median of all characteristics is expected for the end of the century under the SSP5-8.5 scenario, while the values in the middle of the 21st century under the same scenario are highest among climate change responses. For the SSP2-4.5 scenario, area-averaged cyclone numbers are projected to decrease in the middle of the century in the eastern Mediterranean (especially in the frequency of cyclones) and the Black Sea subregions. Over the western Mediterranean subregion, there will be an increase in the frequency of cyclones and a decrease in the number of cyclogenesis events. Such varying cyclone change responses in the Mediterranean–Black Sea subregions, which do not correspond to the monotonous global warming trend, may be linked to long-term (decadal–multidecadal) variability or to the choice of the boundaries of the subregions.
The average position of cyclone tracks originating from the cyclogenesis areas, according to CMIP6 multimodel ensemble projection, was found to be consistent with an increase in cyclonic activity in Central Europe, due to a northward shift in the average track of the western Mediterranean cyclogenesis area and a southward shift in the average track of the North Atlantic cyclogenesis areas. The average tracks in the other cyclogenesis areas are characterized by a southward shift in the eastern Mediterranean region and by a northward shift in the Black Sea region.
Such shifts in cyclone tracks were typical during the second part of the 20th century and the beginning of the 21st century [22,37]. They generally occur as a result of a change in the North Atlantic oscillation phase, due to a change in the intensity and position of the Icelandic Low and the Azores High. In the 21st century, the positive NAO phase is expected to prevail [89], characterized by a shift of the North Atlantic storm track to Northern Europe and a decrease of cyclonic activity over the Mediterranean Sea. From this point of view, our results correspond to the strengthening of the NAO (the transition to a positive phase), as under SSP2-4.5 scenario, our results showed an increase in the frequency of cyclones in the winter months over Europe and a decrease in the frequency of cyclones in the winter months in the Mediterranean region. However, the frequency of cyclones is also expected to decrease over Iceland, the Norwegian Sea, and the White Sea. The structure of the anomaly fields of the frequency of cyclones is more similar to the structure of the negative phase of the East Atlantic/West Russia pattern, which, as shown for the historical period in [90,91], corresponds to the circulation pattern opposite to the blocking in the following centers: the British Isles, the Baltic region, the northeastern coast of the Mediterranean region, the Black Sea region, and southwestern part of Eastern Europe.
Accordingly, in comparison with the first assessment of future global changes of objectively identified cyclones in the newest-generation CMIP6 models in [27], we focused on future changes of cyclonic activity in the Mediterranean–Black Sea region for the 21st century, adding the analysis of cyclogenesis events and the shift in cyclone tracks over the North Atlantic–European sector, as well as specifically comparing recent and future area-averaged cyclone numbers over the western and eastern Mediterranean subregions and the Black Sea subregion. In general, our study showed that future winter cyclonic activity in the Mediterranean–Black Sea region will respond unevenly to global climate changes, due to regional and monthly features and long-term quasiperiodic variability. In our future research, we plan to focus on a more detailed study of the quantitative characteristics and causes of future cyclonic activity in the Mediterranean–Black Sea region, using a regional model.

Author Contributions

All authors contributed to the study’s conception and design. Conceptualization, E.N.V.; methodology, A.S.L. and V.N.M.; software, V.Y.Z. and A.S.L.; validation, A.S.L. and V.Y.Z.; formal analysis, A.S.L. and V.Y.Z.; investigation, V.N.M. and A.S.L.; resources, A.S.L. and V.Y.Z.; data curation, A.S.L.; writing—original draft preparation, V.N.M. and A.S.L.; writing—review and editing, E.N.V.; visualization, A.S.L.; supervision, V.N.M.; project administration, E.N.V.; funding acquisition, E.N.V. All authors have read and agreed to the published version of the manuscript.

Funding

This research was funded by the state assignment of the Institute of Natural and Technical Systems, project reg. no. 121122300072–3.

Data Availability Statement

Cyclone identification and tracking programs are patented in the Unified Register of Russian Programs for Electronic Computers and Databases (certificates no. 2021662858 and no. 2021666926). Data supporting the reported results are available on request.

Acknowledgments

We greatly appreciate the free access to the datasets of CMIP6 (available online: https://esgf-data.dkrz.de/search/cmip6-dkrz/, accessed on 25 July 2022), NCEP/NCAR reanalysis (available online: https://psl.noaa.gov/data/reanalysis/reanalysis.shtml, accessed on 25 July 2022) and ERA5 reanalysis (available online: https://cds.climate.copernicus.eu/#!/search?text=ERA5&type=dataset, accessed on 25 July 2022).

Conflicts of Interest

The authors declare no conflict of interest.

Appendix A

Figure A1. Anomalies (%) of the frequency of winter cyclones relative to the recent historical period (2000 to 2014) at the beginning of the century: (a,c) at the middle of the 21st century; (b,d) at the end of the 21st century; (a,b) under the SSP2-4.5 scenario; (c,d) under the SSP5-8.5 scenario. Stippling indicates where 70% of the models agree on the sign of change.
Atmosphere 13 01573 g0a1
Figure A2. Anomalies (%) of the frequency of cyclones relative to the recent historical period (2000 to 2014) at the beginning of the century in December (left column), January (central column), and February (right column): (af) at the middle of the 21st century; (gl) at the end of the 21st century; (ac,gi) under the SSP2-4.5 scenario; (df,jl) under the SSP5-8.5 scenario. Stippling indicates where 70% of the models agree on the sign of change.
Atmosphere 13 01573 g0a2

References

  1. Khromov, S.P.; Petrosyants, M.A. Meteorology and Climatology, 5th ed.; MSU: Moscow, Russia, 2001; 528p. [Google Scholar]
  2. Lionello, P.; Bhend, J.; Buzzi, A.; Della-Marta, P.; Krichak, S.; Jansà, A.; Maheras, P.; Sanna, A.; Trigo, I.; Trigo, R. Cyclones in the Mediterranean region: Climatology and effects on the environment. In Mediterranean Climate Variability; Lionello, P., Malanotte-Rizzoli, P., Boscolo, R., Eds.; Elsevier: Amsterdam, The Netherlands, 2006; Volume 4, pp. 325–372. [Google Scholar] [CrossRef]
  3. Sinclair, V.A.; Rantanen, M.; Haapanala, P.; Räisänen, J.; Järvinen, H. The characteristics and structure of extra-tropical cyclones in a warmer climate. Weather Clim. Dyn. 2020, 1, 1–25. [Google Scholar] [CrossRef]
  4. Löptien, U.; Zolina, O.; Gulev, S.; Latif, M.; Soloviov, V. Cyclone life cycle characteristics over the Northern Hemisphere in coupled GCMs. Clim. Dyn. 2008, 31, 507–532. [Google Scholar] [CrossRef]
  5. Raible, C.C.; Pinto, J.G.; Ludwig, P.; Messmer, M. A review of past changes in extratropical cyclones in the northern hemisphere and what can be learned for the future. Wiley Interdiscip. Rev. Clim. Chang. 2021, 12, e680. [Google Scholar] [CrossRef]
  6. Flaounas, E.; Davolio, S.; Raveh-Rubin, S.; Pantillon, F.; Miglietta, M.M.; Gaertner, M.A.; Hatzaki, M.; Homar, V.; Khodayar, S.; Korres, G.; et al. Mediterranean cyclones: Current knowledge and open questions on dynamics, prediction, climatology and impacts. Weather Clim. Dyn. 2022, 3, 173–208. [Google Scholar] [CrossRef]
  7. Giorgi, F. Climate change hot-spots. Geophys. Res. Lett. 2006, 33, L08707. [Google Scholar] [CrossRef]
  8. Sousa, P.M.; Ramos, A.M.; Raible, C.C.; Messmer, M.; Tomé, R.; Pinto, J.G.; Trigo, R.M. North Atlantic integrated water vapor transport—From 850 to 2100 CE: Impacts on western European rainfall. J. Clim. 2020, 33, 263–279. [Google Scholar] [CrossRef]
  9. Zappa, G.; Shaffrey, L.C.; Hodges, K.I.; Sansom, P.G.; Stephenson, D.B. A multimodel assessment of future projections of North Atlantic and European extratropical cyclones in the CMIP5 climate models. J. Clim. 2013, 26, 5846–5862. [Google Scholar] [CrossRef]
  10. Yettella, V.; Kay, J.E. How will precipitation change in extratropical cyclones as the planet warms? Insights from a large initial condition climate model ensemble. Clim. Dyn. 2017, 49, 1765–1781. [Google Scholar] [CrossRef]
  11. Raible, C.C.; Messmer, M.; Lehner, F.; Stocker, T.F.; Blender, R. Extratropical cyclone statistics during the last millennium and the 21st century. Clim. Past 2018, 14, 1499–1514. [Google Scholar] [CrossRef] [Green Version]
  12. Hawcroft, M.; Walsh, E.; Hodges, K.; Zappa, G. Significantly increased extreme precipitation expected in Europe and North America from extratropical cyclones. Environ. Res. Lett. 2018, 13, 124006. [Google Scholar] [CrossRef]
  13. Zappa, G.; Shepherd, T.G. Storylines of atmospheric circulation change for European regional climate impact assessment. J. Clim. 2017, 30, 6561–6577. [Google Scholar] [CrossRef]
  14. Hochman, A.; Alpert, P.; Kunin, P.; Rostkier-Edelstein, D.; Harpaz, T.; Saaroni, H.; Messori, G. The dynamics of cyclones in the twentyfirst century: The Eastern Mediterranean as an example. Clim. Dyn. 2020, 54, 561–574. [Google Scholar] [CrossRef]
  15. Seidel, D.J.; Fu, Q.; Randel, W.J.; Reichler, T.J. Widening of the tropical belt in a changing climate. Nat. Geosci. 2008, 1, 21–24. [Google Scholar] [CrossRef]
  16. Fischer-Bruns, I.; Storch, H.V.; González-Rouco, J.F.; Zorita, E. Modelling the variability of midlatitude storm activity on decadal to century time scales. Clim. Dyn. 2005, 25, 461–476. [Google Scholar] [CrossRef]
  17. Feng, S.; Fu, Q. Expansion of global drylands under a warming climate. Atmos. Chem. Phys. 2013, 13, 10081–10094. [Google Scholar] [CrossRef]
  18. Chang, E.K.; Guo, Y.; Xia, X. CMIP5 multimodel ensemble projection of storm track change under global warming. J. Geophys. Res. Atmos. 2012, 117, D23118. [Google Scholar] [CrossRef]
  19. Black, E.; Brayshaw, D.J.; Rambeau, C.M. Past, present and future precipitation in the Middle East: Insights from models and observations. Philos. Trans. R. Soc. A 2010, 368, 5173–5184. [Google Scholar] [CrossRef]
  20. Harvey, B.J.; Shaffrey, L.C.; Woollings, T.J. Equator-topole temperature differences and the extra-tropical storm track responses of the CMIP5 climate models. Clim. Dyn. 2014, 43, 1171–1182. [Google Scholar] [CrossRef]
  21. Nissen, K.M.; Leckebusch, G.C.; Pinto, J.G.; Renggli, D.; Ulbrich, S.; Ulbrich, U. Cyclones causing wind storms in the Mediterranean: Characteristics, trends and links to large-scale patterns. Nat. Hazards Earth Syst. Sci. 2010, 10, 1379–1391. [Google Scholar] [CrossRef]
  22. Voskresenskaya, E.N.; Maslova, V.N. Winter-spring cyclonic variability in the Mediterranean-Black Sea region associated with global processes in the ocean-atmosphere system. Adv. Sci. Res. 2011, 6, 237–243. [Google Scholar] [CrossRef]
  23. Black, E. The influence of the North Atlantic Oscillation and European circulation regimes on the daily to interannual variability of winter precipitation in Israel. Int. J. Climatol. 2012, 32, 1654–1664. [Google Scholar] [CrossRef]
  24. Maslova, V.N.; Voskresenskaya, E.N.; Lubkov, A.S.; Yurovsky, A.V. Temporal variability and predictability of intense cyclones in the Western and Eastern Mediterranean. Atmosphere 2021, 12, 1218. [Google Scholar] [CrossRef]
  25. Gagen, M.H.; Zorita, E.; McCarroll, D.; Zahn, M.; Young, G.H.; Robertson, I. North Atlantic summer storm tracks over Europe dominated by internal variability over the past millennium. Nat. Geosci. 2016, 9, 630–635. [Google Scholar] [CrossRef]
  26. Nissen, K.M.; Leckebusch, G.C.; Pinto, J.G.; Ulbrich, U. Mediterranean cyclones and windstorms in a changing climate. Reg. Environ. Chang. 2014, 14, 1873–1890. [Google Scholar] [CrossRef]
  27. Priestley, M.D.; Catto, J.L. Future changes in the extratropical storm tracks and cyclone intensity, wind speed, and structure. Weather Clim. Dyn. 2022, 3, 337–360. [Google Scholar] [CrossRef]
  28. Eichler, T.P.; Gaggini, N.; Pan, Z. Impacts of global warming on Northern Hemisphere winter storm tracks in the CMIP5 model suite. J. Geophys. Res. Atmos. 2013, 118, 3919–3932. [Google Scholar] [CrossRef]
  29. Ulbrich, U.; Leckebusch, G.C.; Pinto, J.G. Extra-tropical cyclones in the present and future climate: A review. Theor. Appl. Climatol. 2009, 96, 117–131. [Google Scholar] [CrossRef]
  30. Feser, F.; Barcikowska, M.; Krueger, O.; Schenk, F.; Weisse, R.; Xia, L. Storminess over the North Atlantic and northwestern Europe—A review. Q. J. R. Meteorol. Soc. 2015, 141, 350–382. [Google Scholar] [CrossRef]
  31. Michaelis, A.C.; Willison, J.; Lackmann, G.M.; Robinson, W.A. Changes in winter North Atlantic extratropical cyclones in high-resolution regional pseudo–global warming simulations. J. Clim. 2017, 30, 6905–6925. [Google Scholar] [CrossRef]
  32. Harvey, B.J.; Cook, P.; Shaffrey, L.C.; Schiemann, R. The response of the northern hemisphere storm tracks and jet streams to climate change in the CMIP3, CMIP5, and CMIP6 climate models. J. Geophys. Res. Atmos. 2020, 125, e2020JD032701. [Google Scholar] [CrossRef]
  33. Lionello, P.; Dalan, F.; Elvini, E. Cyclones in the Mediterranean region: The present and the doubled CO2 climate scenarios. Clim. Res. 2002, 22, 147–159. [Google Scholar] [CrossRef]
  34. Zappa, G.; Hawcroft, M.K.; Shaffrey, L.; Black, E.; Brayshaw, D.J. Extratropical cyclones and the projected decline of winter Mediterranean precipitation in the CMIP5 models. Clim. Dyn. 2015, 45, 1727–1738. [Google Scholar] [CrossRef]
  35. Trigo, I.F.; Davies, T.D.; Bigg, G.R. Decline in Mediterranean rainfall caused by weakening of Mediterranean cyclones. Geophys. Res. Lett. 2000, 27, 2913–2916. [Google Scholar] [CrossRef]
  36. Flocas, H.A.; Simmonds, I.; Kouroutzoglou, J.; Keay, K.; Hatzaki, M.; Bricolas, V.; Asimakopoulos, D. On cyclonic tracks over the Eastern Mediterranean. J. Clim. 2010, 23, 5243–5257. [Google Scholar] [CrossRef]
  37. Maslova, V.N.; Voskresenskaya, E.N.; Lubkov, A.S.; Yurovsky, A.V.; Zhuravskiy, V.Y.; Evstigneev, V.P. Intense cyclones in the Black Sea region: Change, variability, predictability and manifestations in the storm activity. Sustainability 2020, 12, 4468. [Google Scholar] [CrossRef]
  38. Lionello, P.; Trigo, I.F.; Gil, V.; Liberato, M.L.; Nissen, K.M.; Pinto, J.G.; Raible, C.C.; Reale, M.; Tanzarella, A.; Trigo, R.M.; et al. Objective climatology of cyclones in the Mediterranean region: A consensus view among methods with different system identification and tracking criteria. Tellus A Dyn. Meteorol. Oceanogr. 2016, 68, 29391. [Google Scholar] [CrossRef]
  39. Enzel, Y.; Bookman, R.; Sharon, D.; Gvirtzman, H.; Dayan, U.; Ziv, B.; Stein, M. Late Holocene climates of the Near East deduced from Dead Sea level variations and modern regional winter rainfall. Quat. Res. 2003, 60, 263–273. [Google Scholar] [CrossRef]
  40. Reale, M.; Narvaez, W.D.C.; Cavicchia, L.; Conte, D.; Coppola, E.; Flaounas, E.; Giorgi, F.; Gualdi, S.; Hochman, A.; Li, L.; et al. Future projections of Mediterranean cyclone characteristics using the Med-CORDEX ensemble of coupled regional climate system models. Clim. Dyn. 2022, 58, 2501–2524. [Google Scholar] [CrossRef]
  41. Lionello, P.; Giorgi, F. Winter precipitation and cyclones in the Mediterranean region: Future climate scenarios in a regional simulation. Adv. Geosci. 2007, 12, 153–158. [Google Scholar] [CrossRef] [Green Version]
  42. Peleg, N.; Bartov, M.; Morin, E. CMIP5-predicted climate shifts over the East Mediterranean: Implications for the transition region between Mediterranean and semi-arid climates. Int. J. Climatol. 2015, 35, 2144–2153. [Google Scholar] [CrossRef]
  43. Hochman, A.; Harpaz, T.; Saaroni, H.; Alpert, P. Synoptic classification in 21st century CMIP5 predictions over the Eastern Mediterranean with focus on cyclones. Int. J. Climatol. 2018, 38, 1476–1483. [Google Scholar] [CrossRef]
  44. Wang, X.L.; Swail, V.R.; Zwiers, F.W. Climatology and changes of extratropical cyclone activity: Comparison of ERA-40 with NCEP/NCAR reanalysis for 1958–2001. J. Clim. 2006, 19, 3145–3166. [Google Scholar] [CrossRef]
  45. Sinclair, M.R. An objective cyclone climatology for the Southern Hemisphere. Mon. Weather Rev. 1994, 122, 2239–2256. [Google Scholar] [CrossRef]
  46. Sinclair, M.R. Objective identification of cyclones and their circulation intensity, and climatology. Weather Forecast. 1997, 12, 591–608. [Google Scholar] [CrossRef]
  47. Serreze, M.C. Climatological aspects of cyclone development and decay in the Arctic. Atmos.-Ocean 1995, 33, 1–23. [Google Scholar] [CrossRef]
  48. Simmonds, I.; Burke, C.; Keay, K. Arctic climate change as manifest in cyclone behavior. J. Clim. 2008, 21, 5777–5796. [Google Scholar] [CrossRef]
  49. Pinto, J.G.; Spangehl, T.; Ulbrich, U.; Speth, P. Sensitivities of a cyclone detection and tracking algorithm: Individual tracks and climatology. Meteor. Z. 2005, 14, 823–838. [Google Scholar] [CrossRef]
  50. Raible, C.C.; Della-Marta, P.M.; Schwierz, C.; Wernli, H.; Blender, R. Northern Hemisphere extratropical cyclones: A comparison of detection and tracking methods and different reanalyses. Mon. Weather Rev. 2008, 136, 880–897. [Google Scholar] [CrossRef]
  51. Hodges, K.I.; Hoskins, B.J.; Boyle, J.; Thorncroft, C. A comparison of recent reanalysis datasets using objective feature tracking: Storm tracks and tropical easterly waves. Mon. Weather Rev. 2003, 131, 2012–2037. [Google Scholar] [CrossRef]
  52. Bardin, M.Y.; Polonsky, A.B. North Atlantic oscillation and synoptic variability in the European-Atlantic region in winter. Izv. Atmos. Ocean. Phys. 2005, 41, 127–136. [Google Scholar]
  53. Rudeva, I.; Gulev, S.K. Climatology of cyclone size characteristics and their changes during the cyclone life cycle. Mon. Weather Rev. 2007, 135, 2568–2587. [Google Scholar] [CrossRef]
  54. Zhuravsky, V.Y.; Voskresenskaya, E.N. Technology of cyclones sepaparion from global reanalyes data seta on meteorological fields. Monit. Syst. Environ. 2018, 1, 74–78. [Google Scholar] [CrossRef]
  55. Grist, J.P.; Josey, S.A.; Sinha, B.; Catto, J.L.; Roberts, M.J.; Coward, A.C. Future evolution of an eddy rich ocean associated with enhanced East Atlantic storminess in a coupled model projection. Geophys. Res. Lett. 2021, 48, e2021GL092719. [Google Scholar] [CrossRef]
  56. Muskulus, M.; Jacob, D. Tracking cyclones in regional model data: The future of Mediterranean storms. Adv. Geosci. 2005, 2, 13–19. [Google Scholar] [CrossRef]
  57. Meehl, G.A.; Boer, G.J.; Covey, C.; Latif, M.; Stouffer, R.J. The coupled model intercomparison project (CMIP). Bull. Am. Meteorol. Soc. 2000, 81, 313–318. [Google Scholar] [CrossRef]
  58. Meehl, G.A.; Covey, C.; McAvaney, B.; Latif, M.; Stouffer, R.J. Overview of the coupled model intercomparison project. Bull. Am. Meteorol. Soc. 2005, 86, 89–93. [Google Scholar] [CrossRef]
  59. Eyring, V.; Bony, S.; Meehl, G.A.; Senior, C.A.; Stevens, B.; Stouffer, R.J.; Taylor, K.E. Overview of the Coupled Model Intercomparison Project Phase 6 (CMIP6) experimental design and organization. Geosci. Model Dev. 2016, 9, 1937–1958. [Google Scholar] [CrossRef]
  60. Priestley, M.D.; Ackerley, D.; Catto, J.L.; Hodges, K.I.; McDonald, R.E.; Lee, R.W. An overview of the extratropical storm tracks in CMIP6 historical simulations. J. Clim. 2020, 33, 6315–6343. [Google Scholar] [CrossRef]
  61. Fernandez-Granja, J.A.; Casanueva, A.; Bedia, J.; Fernandez, J. Improved atmospheric circulation over Europe by the new generation of CMIP6 earth system models. Clim. Dyn. 2021, 56, 3527–3540. [Google Scholar] [CrossRef]
  62. Zappa, G.; Shaffrey, L.C.; Hodges, K.I. The ability of CMIP5 models to simulate North Atlantic extratropical cyclones. J. Clim. 2013, 26, 5379–5396. [Google Scholar] [CrossRef]
  63. Akperov, M.; Rinke, A.; Mokhov, I.I.; Semenov, V.A.; Parfenova, M.R.; Matthes, H.; Adakudlu, M.; Boberg, F.; Christensen, J.H.; Dembitskaya, M.A.; et al. Future projections of cyclone activity in the Arctic for the 21st century from regional climate models (Arctic-CORDEX). Glob. Planet. Change 2019, 182, 103005. [Google Scholar] [CrossRef]
  64. Cherchi, A.; Fogli, P.G.; Lovato, T.; Peano, D.; Iovino, D.; Gualdi, S.; Masina, S.; Scoccimarro, E.; Materia, S.; Bellucci, A.; et al. Global mean climate and main patterns of variability in the CMCC-CM2 coupled model. J. Adv. Model. 2018, 11, 185–209. [Google Scholar] [CrossRef]
  65. Lovato, T.; Peano, D.; Butenschön, M.; Materia, S.; Iovino, D.; Scoccimarro, E.; Fogli, P.G.; Cherchi, A.; Bellucci, A.; Gualdi, S.; et al. CMIP6 simulations with the CMCC Earth System Model (CMCC-ESM2). J. Adv. Model. 2022, 14, e2021MS002814. [Google Scholar] [CrossRef]
  66. Boucher, O.; Servonnat, J.; Albright, A.L.; Aumont, O.; Balkanski, Y.; Bastrikov, V.; Bekki, S.; Bonnet, R.; Bony, S.; Bopp, L.; et al. Presentation and evaluation of the IPSL-CM6A-LR climate model. J. Adv. Model. 2020, 12, e2019MS002010. [Google Scholar] [CrossRef]
  67. Müller, W.A.; Jungclaus, J.H.; Mauritsen, T.; Baehr, J.; Bittner, M.; Budich, R.; Bunzel, F.; Esch, M.; Ghosh, R.; Haak, H.; et al. A higher-resolution version of the Max Planck Institute Earth System Model (MPI-ESM1.2-HR). J. Adv. Model 2018, 10, 1383–1413. [Google Scholar] [CrossRef]
  68. Mauritsen, T.; Bader, J.; Becker, T.; Behrens, J.; Bittner, M.; Brokopf, R.; Brovkin, V.; Claussen, M.; Crueger, T.; Esch, M.; et al. Developments in the MPI-M Earth System Model version 1.2 (MPI-ESM1.2) and its response to increasing CO2. J. Adv. Model 2019, 11, 998–1038. [Google Scholar] [CrossRef]
  69. Seland, Ø.; Bentsen, M.; Olivié, D.; Toniazzo, T.; Gjermundsen, A.; Graff, L.S.; Debernard, J.B.; Gupta, A.K.; He, Y.-C.; Kirkevåg, A.; et al. Overview of the Norwegian Earth System Model (NorESM2) and key climate response of CMIP6 DECK, historical, and scenario simulations. Geosci. Model Dev. 2020, 13, 6165–6200. [Google Scholar] [CrossRef]
  70. Lee, W.-L.; Wang, Y.-C.; Shiu, C.-J.; Tsai, I.; Tu, C.-Y.; Lan, Y.-Y.; Chen, J.-P.; Pan, H.-L.; Hsu, H.-H. Taiwan Earth System Model: Description and evaluation of mean. Geosci. Model Dev. 2020, 13, 3887–3904. [Google Scholar] [CrossRef]
  71. IPCC SRES: Special Report on Emissions Scenarios: A Special Report of Working Group III of the Intergovernmental Panel on Climate Change; Nakićenović, N.; Swart, R. (Eds.) Cambridge University Press: Cambridge, UK, 2000. [Google Scholar]
  72. IPCC: Climate Change 2001: The Scientific Basis. Contribution of Working Group I to the Third Assessment Report of the Intergov-ernmental Panel on Climate Change; Houghton, J.T.; Ding, Y.; Griggs, D.J.; Noguer, M.; van der Linden, P.J.; Dai, X.; Maskell, K.; Johnson, C.A. (Eds.) Cambridge University Press: Cambridge, UK; New York, NY, USA, 2001; 881p. [Google Scholar]
  73. IPCC: Climate Change 2007: Synthesis Report. Contribution of Working Groups I, II and III to the Fourth Assessment Report of the Intergovernmental Panel on Climate Change; Core Writing Team; Pachauri, R.K.; Reisinger, A. (Eds.) IPCC: Geneva, Switzerland, 2007; 104p. [Google Scholar]
  74. IPCC: Climate Change 2013: The Physical Science Basis. Contribution of Working Group I to the Fifth Assessment Report of the Intergovernmental Panel on Climate Change; Stocker, T.F.; Qin, D.; Plattner, G.-K.; Tignor, M.S.; Allen, K.; Boschung, J.; Nauels, A.; Xia, Y.; Bex, V.; Midgley, P.M. (Eds.) Cambridge University Press: Cambridge, UK; New York, NY, USA, 2013; 1535p. [Google Scholar]
  75. IPCC: Summary for Policymakers. In Climate Change 2021: The Physical Science Basis. Contribution of Working Group I to the Sixth Assessment Report of the Intergovernmental Panel on Climate Change; Masson-Delmotte, V.; Zhai, P.; Pirani, A.; Connors, S.L.; Péan, C.; Berger, S.; Caud, N.; Chen, Y.; Goldfarb, L.; Gomis, M.I.; et al. (Eds.) Cambridge University Press: Cambridge, UK; New York, NY, USA, 2021; pp. 3–32. [Google Scholar]
  76. Hausfather, Z.; Peters, G.P. Emissions—The ‘business as usual’ story is misleading. Nature 2020, 577, 618–620. [Google Scholar] [CrossRef]
  77. Pekarnikova, M.; Polonsky, A. Anthropogenic climate change and international-juridical activity on climate mitigation. Part 2. Implementation of climate legal acts at the present stage and their prospects. Gosudarstvo i pravo 2021, 5, 118–124. [Google Scholar] [CrossRef]
  78. Polonsky, A.; Pekarnikova, M.E. Anthropogenic climate change and international-juridical activity on climate mitigation. Part 1. From the UN Framework Convention to the Paris Agreement. Gosudarstvo i pravo 2021, 4, 104–113. [Google Scholar] [CrossRef]
  79. Kalnay, E.; Kanamitsu, M.; Kistler, R.; Collins, W.; Deaven, D.; Gandin, L.; Iredell, M.; Saha, S.; White, G.; Woollen, J.; et al. The NCEP/NCAR 40-year reanalysis project. Bull. Am. Meteorol. Soc. 1996, 77, 437–472. [Google Scholar] [CrossRef]
  80. Hersbach, H.; Bell, B.; Berrisford, P.; Hirahara, S.; Horányi, A.; Muñoz-Sabater, J.; Nicolas, J.; Peubey, C.; Radu, R.; Schepers, D.; et al. The ERA5 global reanalysis. Q. J. R. Meteorol. Soc. 2020, 146, 1999–2049. [Google Scholar] [CrossRef]
  81. Ziv, B.; Harpaz, T.; Saaroni, H.; Blender, R. A new methodology for identifying daughter cyclogenesis: Application for the Mediterranean Basin. Int. J. Climatol. 2015, 35, 3847–3861. [Google Scholar] [CrossRef]
  82. Meinshausen, M.; Nicholls, Z.R.J.; Lewis, J.; Gidden, M.J.; Vogel, E.; Freund, M.; Beyerle, U.; Gessner, C.; Nauels, A.; Bauer, N.; et al. The shared socio-economic pathway (SSP) greenhouse gas concentrations and their extensions to 2500. Geosci. Model Dev. 2020, 13, 3571–3605. [Google Scholar] [CrossRef]
  83. Harvey, B.J.; Shaffrey, L.C.; Woollings, T.J.; Zappa, G.; Hodges, K.I. How large are projected 21st century storm track changes? Geophys. Res. Lett. 2012, 39, L18707. [Google Scholar] [CrossRef]
  84. Chylek, P.; Dubey, M.K.; Lesins, G.; Li, J.; Hengartner, N. Imprint of the Atlantic multi-decadal oscillation and Pacific decadal oscillation on southwestern US climate: Past, present, and future. Clim. Dyn. 2014, 43, 119–129. [Google Scholar] [CrossRef]
  85. Chylek, P.; Klett, J.D.; Dubey, M.K.; Hengartner, N. The role of Atlantic Multi-decadal Oscillation in the global mean temperature variability. Clim. Dyn. 2016, 47, 3271–3279. [Google Scholar] [CrossRef]
  86. Kumar, S.; Kinter, J.; Dirmeyer, P.A.; Pan, Z.; Adams, J. Multidecadal climate variability and the “warming hole” in North America: Results from CMIP5 twentieth-and twenty-first-century climate simulations. J. Clim. 2013, 26, 3511–3527. [Google Scholar] [CrossRef]
  87. Lv, Y.; Guo, J.; Li, J.; Han, Y.; Xu, H.; Guo, X.; Cao, L.; Gao, W. Increased Turbulence in the Eurasian Upper-Level Jet Stream in Winter: Past and Future. Earth Space Sci. 2021, 8, e2020EA001556. [Google Scholar] [CrossRef]
  88. Masato, G.; Hoskins, B.J.; Woollings, T. Winter and Summer Northern Hemisphere Blocking in CMIP5 Models, J. Clim. 2013, 26, 7044–7059. [Google Scholar] [CrossRef]
  89. Pinto, J.G.; Ulbrich, U.; Leckebusch, G.C.; Spangehl, T.; Reyers, M.; Zacharias, S. Changes in storm track and cyclone activity in three SRES ensemble experiments with the ECHAM5/MPI-OM1 GCM. Clim. Dyn. 2007, 29, 195–210. [Google Scholar] [CrossRef]
  90. Bardin, M.Y.; Platova, T.V.; Samokhina, O.F. Specific features of variability of cyclone activity in northern extratropics associated with leading atmospheric circulation modes in Atlantic-European sector. Fundam Appl. Climatol. 2015, 2, 14–40. [Google Scholar]
  91. Maslova, V.; Voskresenskaya, E.; Yurovsky, A.; Bardin, M. Winter cyclone regimes over the North Atlantic region. Theor. Appl. Climatol. 2022, 148, 1689–1711. [Google Scholar] [CrossRef]
Figure 1. Boundaries of the subregions for calculating area-averaged numbers: WM—western Mediterranean (green rectangle, 1° W to 21° E, 41° N to 47° N); EM—eastern Mediterranean (blue rectangle, 21° W to 36° E, 33° N to 37° N); and BS—Black Sea (red rectangle, 27° W to 42° E, 41° N to 47° N).
Atmosphere 13 01573 g001
Figure 2. Winter cyclone numbers (total for 15 seasons) in the recent historical period (HIS, from 2000 to 2014): (a,c,e) frequency; (b,d,f) cyclogenesis events; based on: (a,b) NCEP/NCAR reanalysis; (c,d) ERA5 reanalysis; and (e,f) CMIP6 ensemble.
Atmosphere 13 01573 g002
Figure 3. Frequency (total number for 15 seasons) of winter cyclones in the ensemble of the CMIP6 models: (a,c) at the middle of the 21st century; (b,d) at the end of the 21st century; (a,b) under the SSP2-4.5 scenario; and (c,d) under the SSP5-8.5 scenario.
Atmosphere 13 01573 g003
Figure 4. Number of winter cyclogenesis events (total for 15 seasons) according to the ensemble of the CMIP6 models: (a,c) at the middle of the 21st century; (b,d) at the end of the 21st century; (a,b) under the SSP2-4.5 scenario; and (c,d) under the SSP5-8.5 scenario.
Atmosphere 13 01573 g004
Figure 5. Absolute anomalies of the frequency of winter cyclones (difference in totals for 15 seasons) relative to the recent historical period (from 2000 to 2014) of the beginning of the century: (a,c) at the middle of the 21st century; (b,d) at the end of the 21st century; (a,b) under the SSP2-4.5 scenario; and (c,d) under the SSP5-8.5 scenario. Stippling indicates where 70% of the models agree on the sign of change.
Atmosphere 13 01573 g005
Figure 6. Absolute anomalies of the frequency of cyclones (difference in totals for 15 months) relative to the recent historical period (from 2000 to 2014) at the beginning of the century in December (left column), January (central column) and February (right column): (af) at the middle of the 21st century; (gl) at the end of the 21st century; (ac, gi) under the SSP2-4.5 scenario; and (df, jl) under the SSP5-8.5 scenario. Stippling indicates where 70% of the models agree on the sign of change.
Atmosphere 13 01573 g006
Figure 7. Boxplots of the area-averaged winter cyclone numbers (total for 15 seasons): (ac) frequency of cyclones; (df) number of cyclones; (gi) number of cyclogenesis events. Cyclone numbers are averaged over the following subregions (see Figure 1): (a,d,g) western Mediterranean; (b,e,h) eastern Mediterranean; (c,f,i) Black Sea. The averaging periods are the recent historical period (blue), middle of the century under the SSP2-4.5 scenario (light green), end of the century under the SSP2-4.5 scenario (green), middle of the century under the SSP5-8.5 scenario (orange), and end of the century under the SSP5-8.5 scenario (red). The black line in the boxes is the median, the boxes’ range is from the 25th percentile to the 75th percentile, the whiskers’ range is from the 5th percentile to the 95th percentile, and the white dots mark the outliers.
Atmosphere 13 01573 g007
Figure 8. The average position of cyclone tracks originating from the cyclogenesis areas marked by blue rectangles. The blue track is for the period of the beginning of the century, the light green track is for the mid-21st century under the SSP2-4.5 scenario, the green track is for the end of the century under the SSP2-4.5 scenario, the orange track is for the mid-21st century under the SSP5-8.5 scenario, and the red track is for the end of the century under the SSP5-8.5 scenario.
Atmosphere 13 01573 g008
Table 1. CMIP6 models analyzed in this study.
ModelDeveloper, CountryResolution
CMCC-CM2-SR5 [64]Euro-Mediterranean Center on Climate Change, Italy1.25 × 0.94
CMCC-ESM2 [65]1.25 × 0.94
IPSL-CM6A-LR [66]Institut Pierre Simon Laplace, France2.5 × 1.27
MPI-ESM1-2-HR [67]Max Planck Institute for Meteorology, Germany0.94 × 0.93
MPI-ESM1-2-LR [68]1.88 × 1.85
NorESM2-LM [69]Norwegian Climate Centre, Norway2.5 × 1.89
NorESM2-MM [69]1.25 × 0.94
TaiESM1 [70]Research Center for Environmental Changes, Academia Sinica, Taiwan1.25 × 0.94
Table 2. Spatial linear correlation coefficient (r) and root mean square error (RMSE) between the frequency of cyclones over the North Atlantic–European sector in the CMIP6 models and NCEP/NCAR reanalysis in the period from 2000 to 2014. The highest (for r) and lowest (for RMSE) 30% values of the entire range of the comparison parameters (for both reanalyses and all 12 months) are marked in bold.
CMIP6 ModelParameterOctoberNovemberDecemberJanuaryFebruaryMarch
CMCC-CM2-SR5r0.140.340.260.380.320.21
RMSE7.036.366.526.765.756.39
CMCC-ESM2r0.190.240.310.380.210.21
RMSE7.27.026.196.216.236.51
IPSL-CM6A-LRr0.280.140.320.260.280.33
RMSE5.486.185.446.084.976.02
MPI-ESM1-2-HRr0.040.210.290.440.290.2
RMSE14.719.1910.049.5511.2813.08
MPI-ESM1-2-LRr0.320.340.40.370.450.33
RMSE4.615.935.65.824.575.18
NorESM2-LMr0.340.270.220.180.340.2
RMSE4.425.015.466.114.724.9
NorESM2-LMr0.220.190.310.350.310.18
RMSE7.748.237.818.387.488.09
TaiESM1r0.180.30.330.350.170.16
RMSE7.576.466.027.016.547.22
Table 3. Spatial linear correlation coefficient (r) and root mean square error (RMSE) between the frequency of cyclones over the North Atlantic–European sector in the CMIP6 models and ERA5 reanalysis in the period from 2000 to 2014. The highest (for r) and lowest (for RMSE) 30% values of the entire range of the comparison parameters (for both reanalyses and all 12 months) are marked in bold.
CMIP6 ModelParameterOctoberNovemberDecemberJanuaryFebruaryMarch
CMCC-CM2-SR5r0.190.440.450.410.350.2
RMSE6.955.795.516.095.86.88
CMCC-ESM2r0.260.390.470.460.360.29
RMSE6.786.085.285.415.76.13
IPSL-CM6A-LRr0.330.270.440.370.280.35
RMSE5.585.884.945.335.545.93
MPI-ESM1-2-HRr0.10.230.230.350.190.11
RMSE14.719.1910.049.5511.2813.08
MPI-ESM1-2-LRr0.310.220.330.320.260.31
RMSE5.626.575.816.016.015.9
NorESM2-LMr0.360.420.410.380.340.29
RMSE5.65.245.015.535.685.89
NorESM2-LMr0.320.390.510.520.420.27
RMSE6.816.836.286.726.417.41
TaiESM1r0.210.420.460.470.360.21
RMSE7.35.745.175.85.826.99
Publisher’s Note: MDPI stays neutral with regard to jurisdictional claims in published maps and institutional affiliations.

