Article

Vertical Profiling of Fresh Biomass Burning Aerosol Optical Properties over the Greek Urban City of Ioannina, during the PANACEA Winter Campaign

by
Christina-Anna Papanikolaou
1,*,
Alexandros Papayannis
1,*,
Maria Mylonaki
1,
Romanos Foskinis
1,
Panagiotis Kokkalis
2,
Eleni Liakakou
3,
Iasonas Stavroulas
3,4,
Ourania Soupiona
1,
Nikolaos Hatzianastassiou
5,
Maria Gavrouzou
5,
Eleni Kralli
1 and
Dimitra Anagnou
1
1
Laser Remote Sensing Unit, Department of Physics, National and Technical University of Athens, 15780 Zografou, Greece
2
Physics Department, Kuwait University, P.O. Box 5969, Safat 13060, Kuwait
3
Institute for Environmental Research and Sustainable Development, National Observatory of Athens, Palaia Penteli, 15236 Athens, Greece
4
Environmental Chemical Processes Laboratory, Department of Chemistry, University of Crete, 71003 Crete, Greece
5
Department of Physics, University of Ioannina, 54110 Ioannina, Greece
*
Authors to whom correspondence should be addressed.
Atmosphere 2022, 13(1), 94; https://doi.org/10.3390/atmos13010094
Submission received: 8 December 2021 / Revised: 29 December 2021 / Accepted: 5 January 2022 / Published: 7 January 2022
(This article belongs to the Special Issue Feature Papers in Atmosphere Science)

Abstract

:
Vertical profiling of aerosol particles was performed during the PANhellenic infrastructure for Atmospheric Composition and climatE chAnge (PANACEA) winter campaign (10 January 2020–7 February 2020) over the city of Ioannina, Greece (39.65° N, 20.85° E, 500 m a.s.l.). The middle-sized city of Ioannina suffers from wintertime air pollution episodes due to biomass burning (BB) domestic heating activities. The lidar technique was applied during the PANACEA winter campaign on Ioannina city, to fill the gap of knowledge of the spatio-temporal evolution of the vertical mixing of the particles occurring during these winter-time air pollution episodes. During this campaign the mobile single-wavelength (532 nm) depolarization Aerosol lIdAr System (AIAS) was used to measure the spatio-temporal evolution of the aerosols’ vertical profiles within the Planetary Boundary Layer (PBL) and the lower free troposphere (LFT; up to 4 km height a.s.l.). AIAS performed almost continuous lidar measurements from morning to late evening hours (typically from 07:00 to 19:00 UTC), under cloud-free conditions, to provide the vertical profiles of the aerosol backscatter coefficient (baer) and the particle linear depolarization ratio (PLDR), both at 532 nm. In this study we emphasized on the vertical profiling of very fresh (~hours) biomass burning (BB) particles originating from local domestic heating activities in the area. In total, 33 out of 34 aerosol layers in the lower free troposphere were characterized as fresh biomass burning ones of local origin, showing a mean particle linear depolarization value of 0.04 ± 0.02 with a range of 0.01 to 0.09 (532 nm) in a height region 1.21–2.23 km a.s.l. To corroborate our findings, we used in situ data, particulate matter (PM) concentrations (PM2.5) from a particulate sensor located close to our station, and the total black carbon (BC) concentrations along with the respective contribution of the fossil fuel (BCff) and biomass/wood burning (BCwb) from the Aethalometer. The PM2.5 mass concentrations ranged from 5.6 to 175.7 μg/m3, while the wood burning emissions from residential heating were increasing during the evening hours, with decreasing temperatures. The BCwb concentrations ranged from 0.5 to 17.5 μg/m3, with an extremely high mean contribution of BCwb equal to 85.4%, which in some cases during night-time reached up to 100% during the studied period.

1. Introduction

Wildfires, agricultural fires, and the use of wood as fuel for domestic heating during the winter season, are the major sources of the biomass burning (BB) particles [1,2,3]. Biomass combustion is considered one of the main global sources of air pollution, especially when they are related to residential heating; it is calculated to contribute more than 50% of Black Carbon (BC) and Organic Carbon (OC) and approximately 45% of PM2.5 [4]. In urban environments, BC is mainly emitted from traffic and residential heating as a result of incomplete combustion of fossil and/or biomass fuel [3].
During the last decade, Greece has faced a severe financial crisis. Many households contributed to the already existing problem of air particle pollution by using wood as heating material [5,6,7,8,9]. Thus, the local emissions of BB related particles may have led to a sharp increase in the intensity of air pollution episodes during cold winter periods, especially under specific meteorological conditions (e.g., stagnant air masses under temperature inversions) within a shallow Planetary Boundary Layer (PBL) as discussed by Kassomenos et al. (2003) and Sindosi et al. (2003, 2019, 2021) [10,11,12,13].
Several middle- and large-sized Greek cities are suffering from high particulate matter (PM) concentrations, either locally produced or transported long distances. The PANhellenic infrastructure for Atmospheric Composition and climatE chAnge (PANACEA) gives the opportunity to study the atmospheric composition in these cities, focusing on the anthropogenic sources (e.g., industrial, transportation, and domestic heating activities). Within the PANACEA context, simultaneous measurements of aerosols have been performed in several Greek urban and regional background stations during different seasons, using a synergy of in situ and remote sensing instrumentation (https://panacea-ri.gr (accessed on 12 February 2021) [14] to assess the emission sources, the physicochemical properties, as well as the climate and health impacts.
The middle-sized city of Ioannina (~112,486 inhabitants) is situated in the Epirus mountainous region in Northwestern Greece. Ioannina frequently suffers from wintertime air pollution episodes due to BB domestic heating activities [12,15], mainly due to its local topography leading to the formation of stagnant air masses over the city. The high levels of particulate matter concentrations, at ground level, exceed the current annual limit value of 25 µg/m3 [13] as set by the European 2008/50/EC Air Quality Directive regarding PM2.5 mass concentrations. Despite the severity of these air particulate pollution episodes occurring during winter-time, there has been a lack of knowledge of the spatio-temporal evolution of the vertical mixing of the particles over the Ioannina basin; this information would be extremely valuable to forecast air pollution episodes and provide tools to policy makers to reduce air pollution in the area and the relevant mortality and morbidity issues attributed to PM exposure.
To fulfill this lack of information, the lidar technique was applied during the PANACEA winter campaign (10 January 2020–7 February 2020) at Ioannina, as it is an ideal tool to monitor the spatio-temporal evolution of the atmospheric structure and the PM distribution with increased temporal (30–60 s) and spatial (7.5 m) resolution. Therefore, in this work we present, for the first time, the evolution of the vertical distribution of aerosol optical properties, the aerosol backscatter coefficient (baer), and the particle linear depolarization ratio (PLDR), during 13-day measurements as retrieved from the mobile single-wavelength (532 nm) depolarization Aerosol lIdAr System (AIAS), within the PBL and the lower free troposphere (LFT), up to 4 km height a.s.l. The lidar measurements were complemented by in situ fine aerosol (PM2.5) mass concentration and black carbon (BC) measurements, as well as meteorological data (temperature (T), relative humidity (RH), wind speed, and direction) obtained at the lidar site.

2. Lidar Location and Methodology

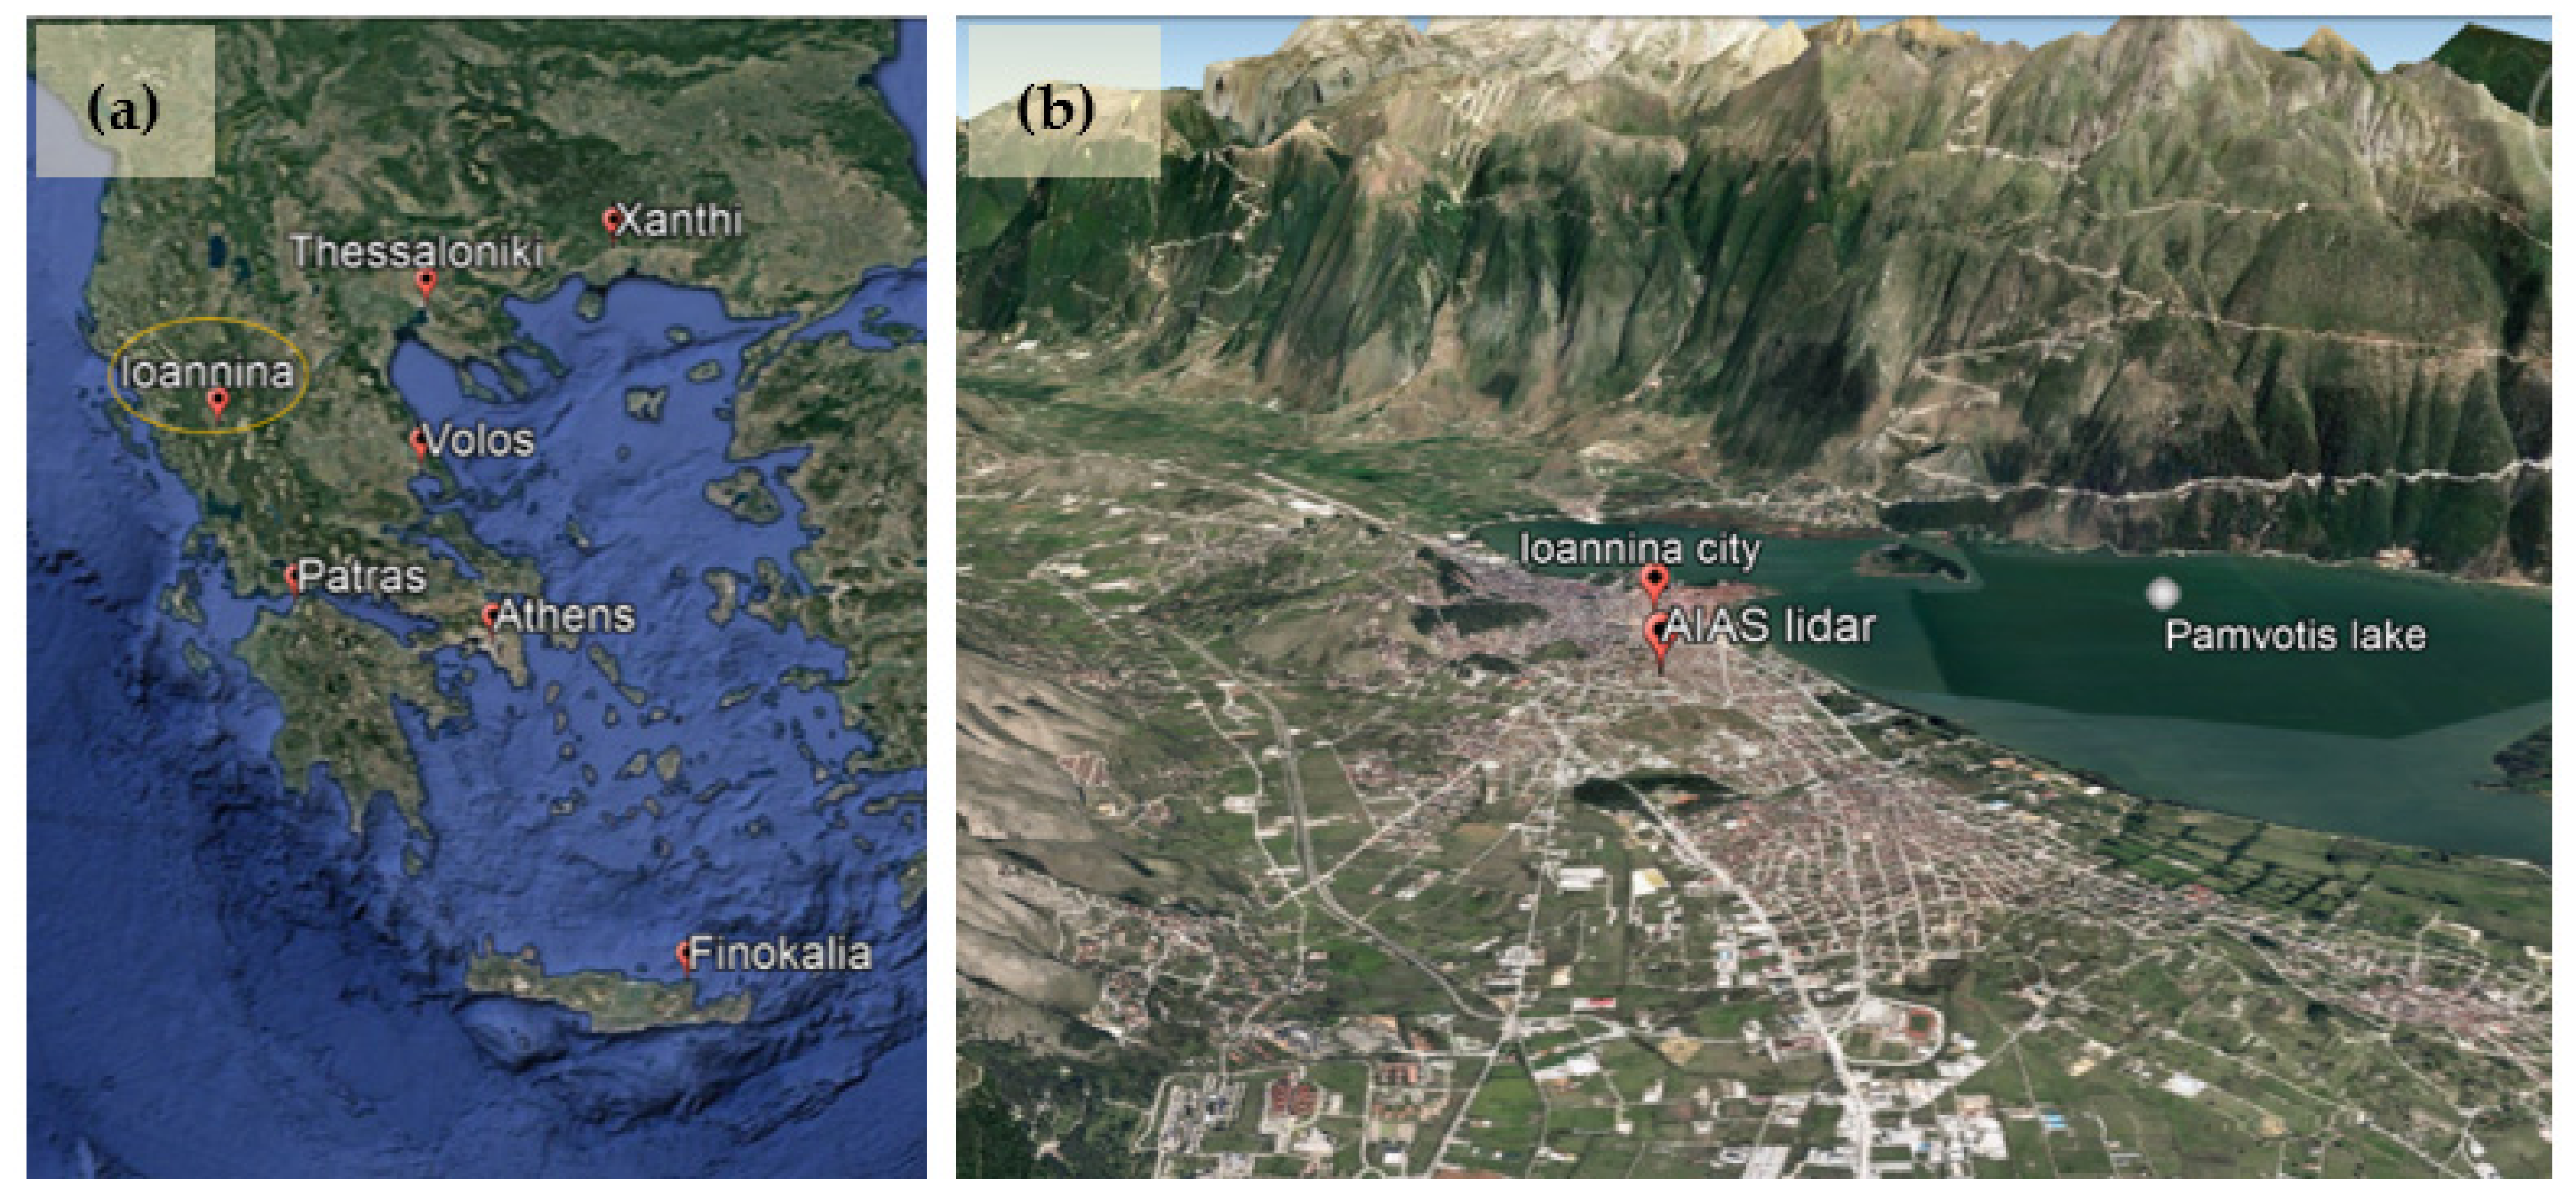
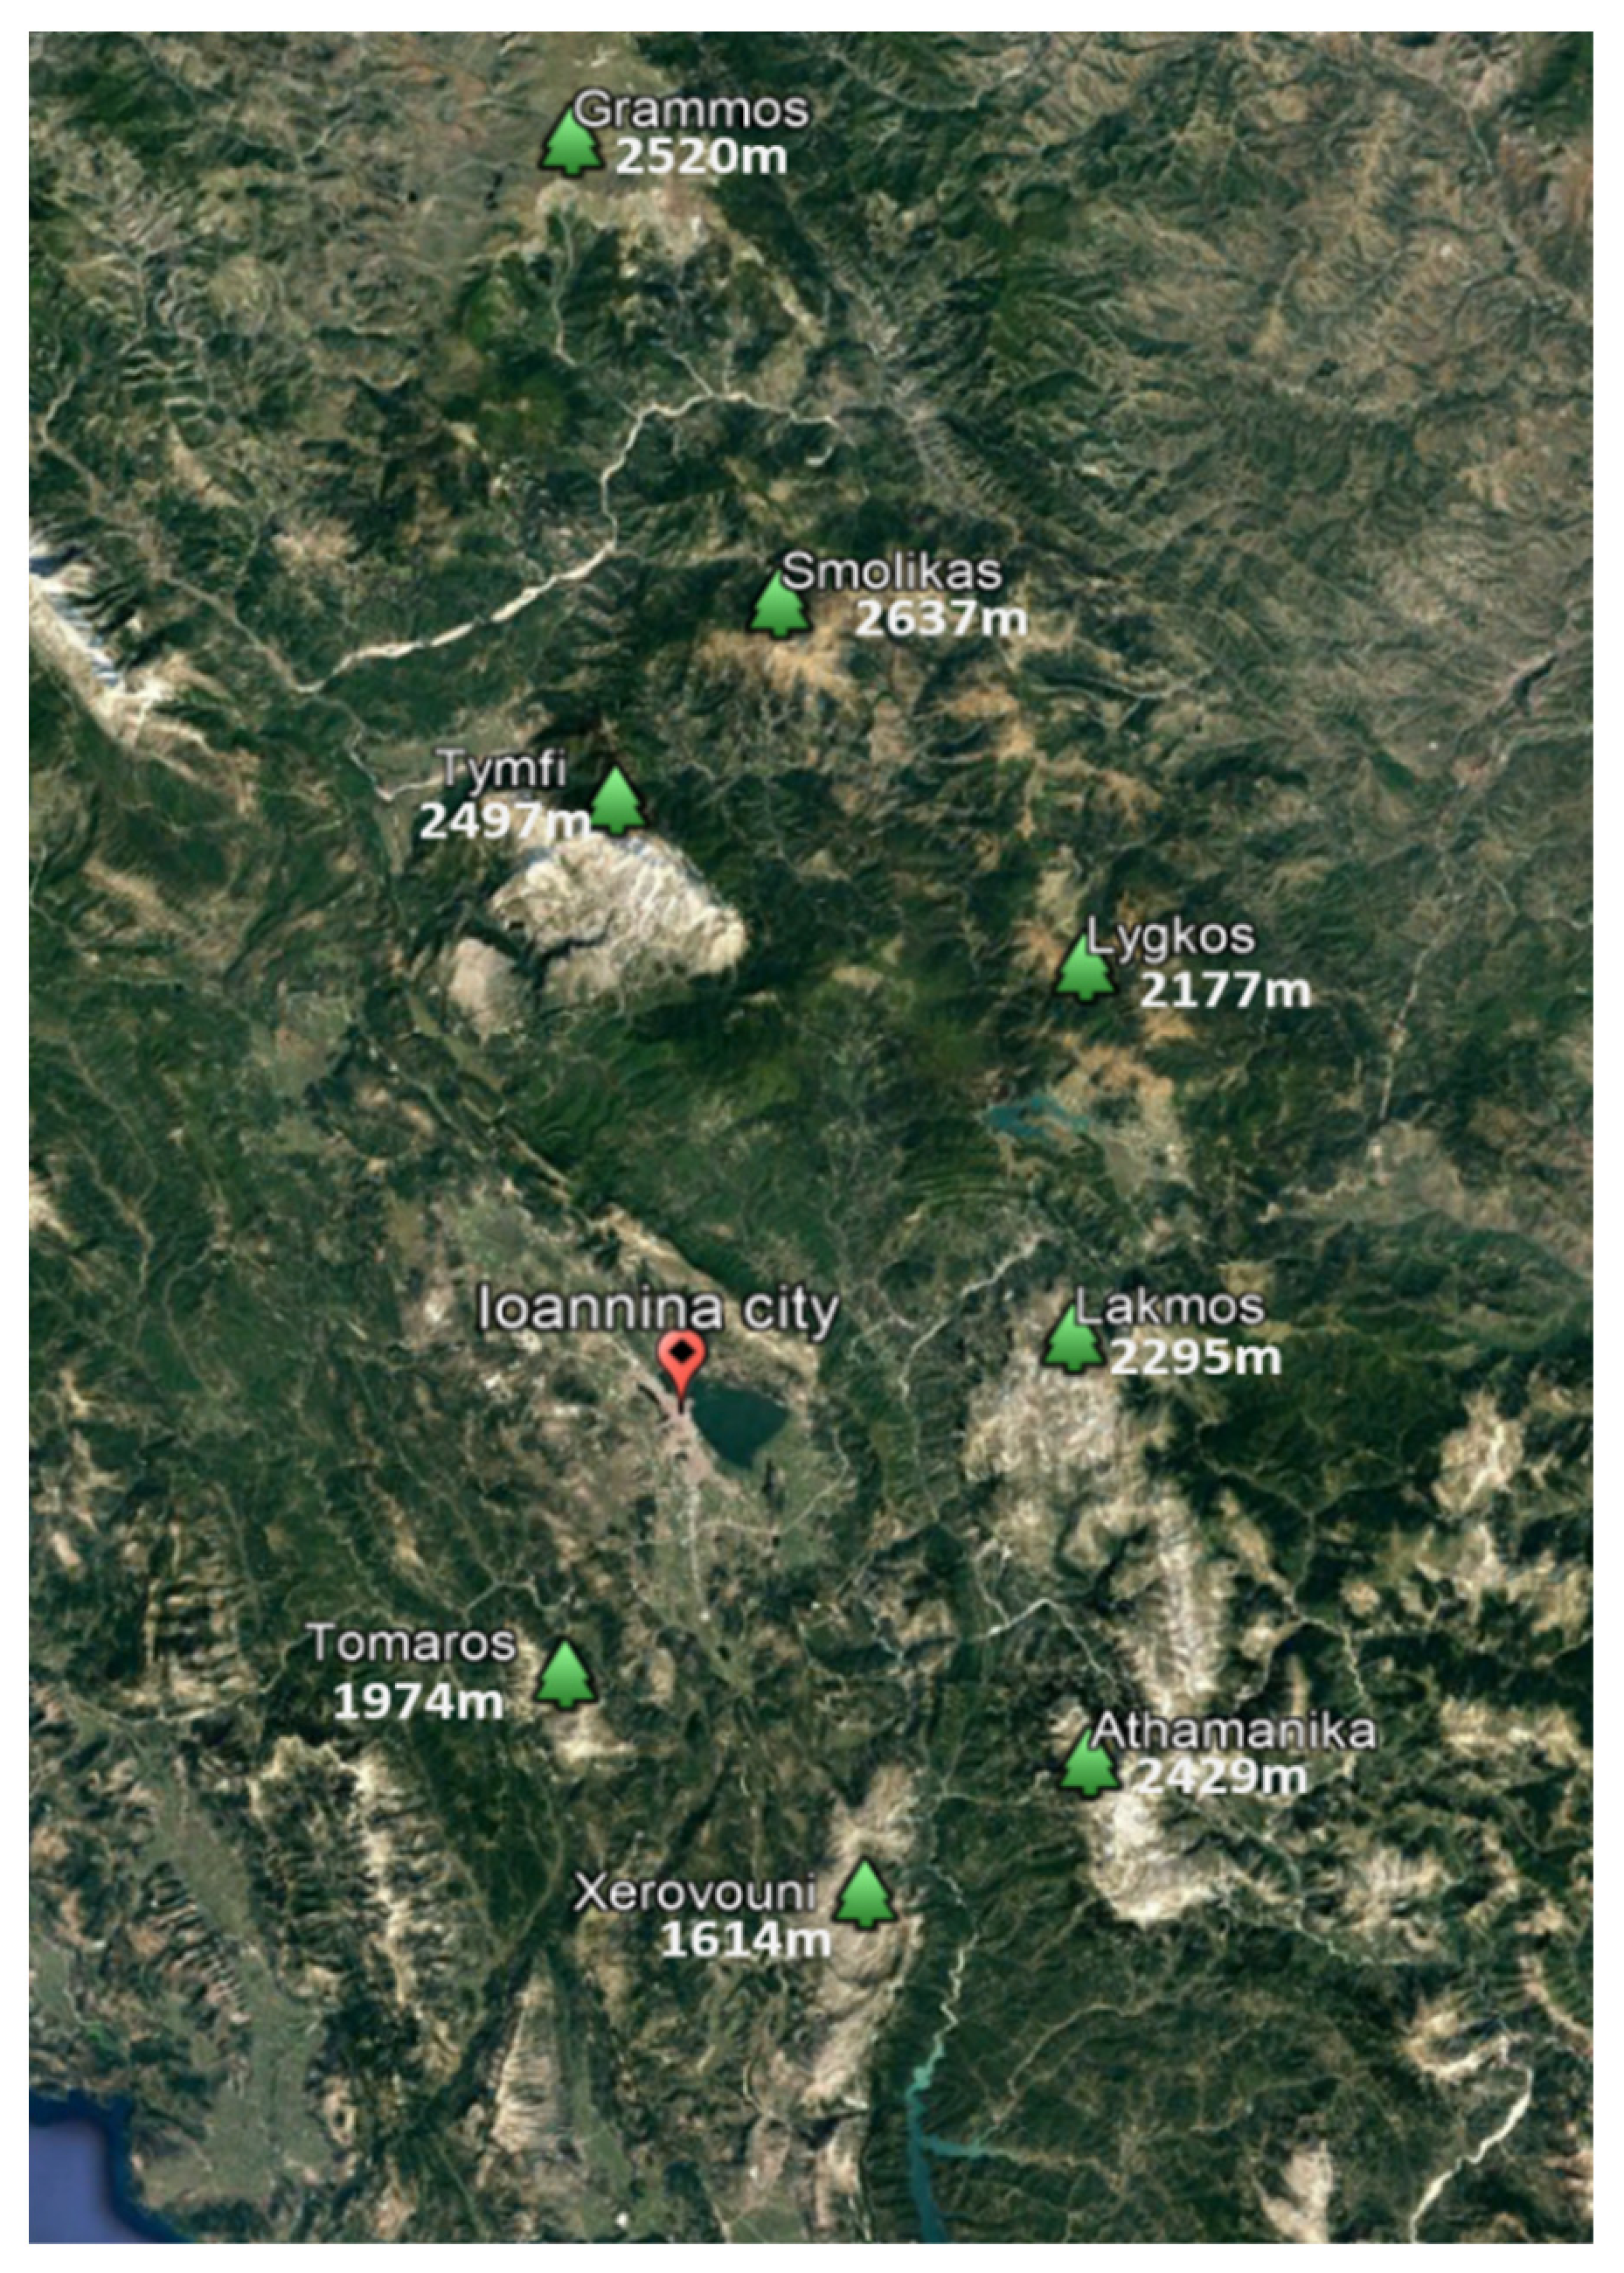
2.1. Location and Description of the NTUA Lidar System

The city of Ioannina is the capital of the region of Epirus, in Northwestern Greece (Figure 1a). It is located near Lake Pamvotis (coverage 19 km2) inside a basin surrounded by high mountains (Figure 1b): the Pindos mountains on the east, and other mountains on the south and the southwest side of the city. Figure A1 depicts the mountains’ names and the corresponding summits’ height. The location of the city plays a major role in the air mass circulation over the studied area, which during the winter period usually remains constraint within a shallow PBL accompanied by stagnant air masses due to strong temperature inversions occurring from evening to late morning hours, especially during cold winter nights. In this context, all emissions from the city’s anthropogenic activities (transport and domestic heating) are trapped inside a shallow PBL, leading to the formation of intense smog events and very poor air quality levels [12,13,15]
During the campaign, the AIAS elastic depolarization lidar system, operated by the National and Technical University of Athens (NTUA) in cooperation with the Biomedical Research Foundation Academy of Athens (BRFAA), was located 1–1.5 km from the city center and Lake Pamvotis (39.65° N, 20.85° E, 500 m a.s.l). AIAS emits a linearly polarized laser beam at 532 nm to the atmosphere and detects the parallel and vertical components of the elastically backscattered lidar signal at 532 nm using a combination of analogue and photon-counting signal digitizers. The spatial vertical resolution is equal to 7.5 m and the temporal resolution of the acquired lidar signals is 1.5 min. The full overlap height of AIAS is reached at 250 m above ground level (a.g.l.). The technical characteristics of the AIAS lidar system are provided by Papayannis et al. (2020) and Mylonaki et al. (2021) [14,16].
Figure 1. (a) PANACEA sites during the winter campaign 2020; (b) AIAS mobile lidar system location (39.65° N, 20.85° E) inside the Ioannina basin. The map shows the Ioannina city, Lake Pamvotis, and the surrounding area (Google Earth Pro v7.1.5. Epirus Region, Greece. Borders and labels, places layers. NOAA. Accessed January, 2021).
Atmosphere 13 00094 g001

2.2. Methods, Models and Tools

The AIAS lidar system was operated almost in a continuous mode from early morning hours (~06:30 UTC) until the late evening ones (~19:30 UTC), with one-hour break in the afternoon, to retrieve the vertical profiles of the baer and the PLDR at 532 nm. In total, 42 measurements were performed during morning, noon, and evening hours. Special emphasis was given to the analysis of the vertical profiles of baer and PLDR during the late afternoon and evening hours, when the BB activity for domestic heating purposes was more intense and very fresh (~hours) BB particles were produced. By excluding the cloudy days and the measurements that were not useable due to unfavorable meteorological conditions (e.g., most of the morning measurements were under fog conditions), in total 17 aerosol profiles of the optical properties were analyzed and presented in this study, showing the vertical mixing of the particles occurring during winter-time in Ioannina city. The late afternoon and evening measurements, along with the one morning measurement that were used in this study, can be seen in Figure 2.

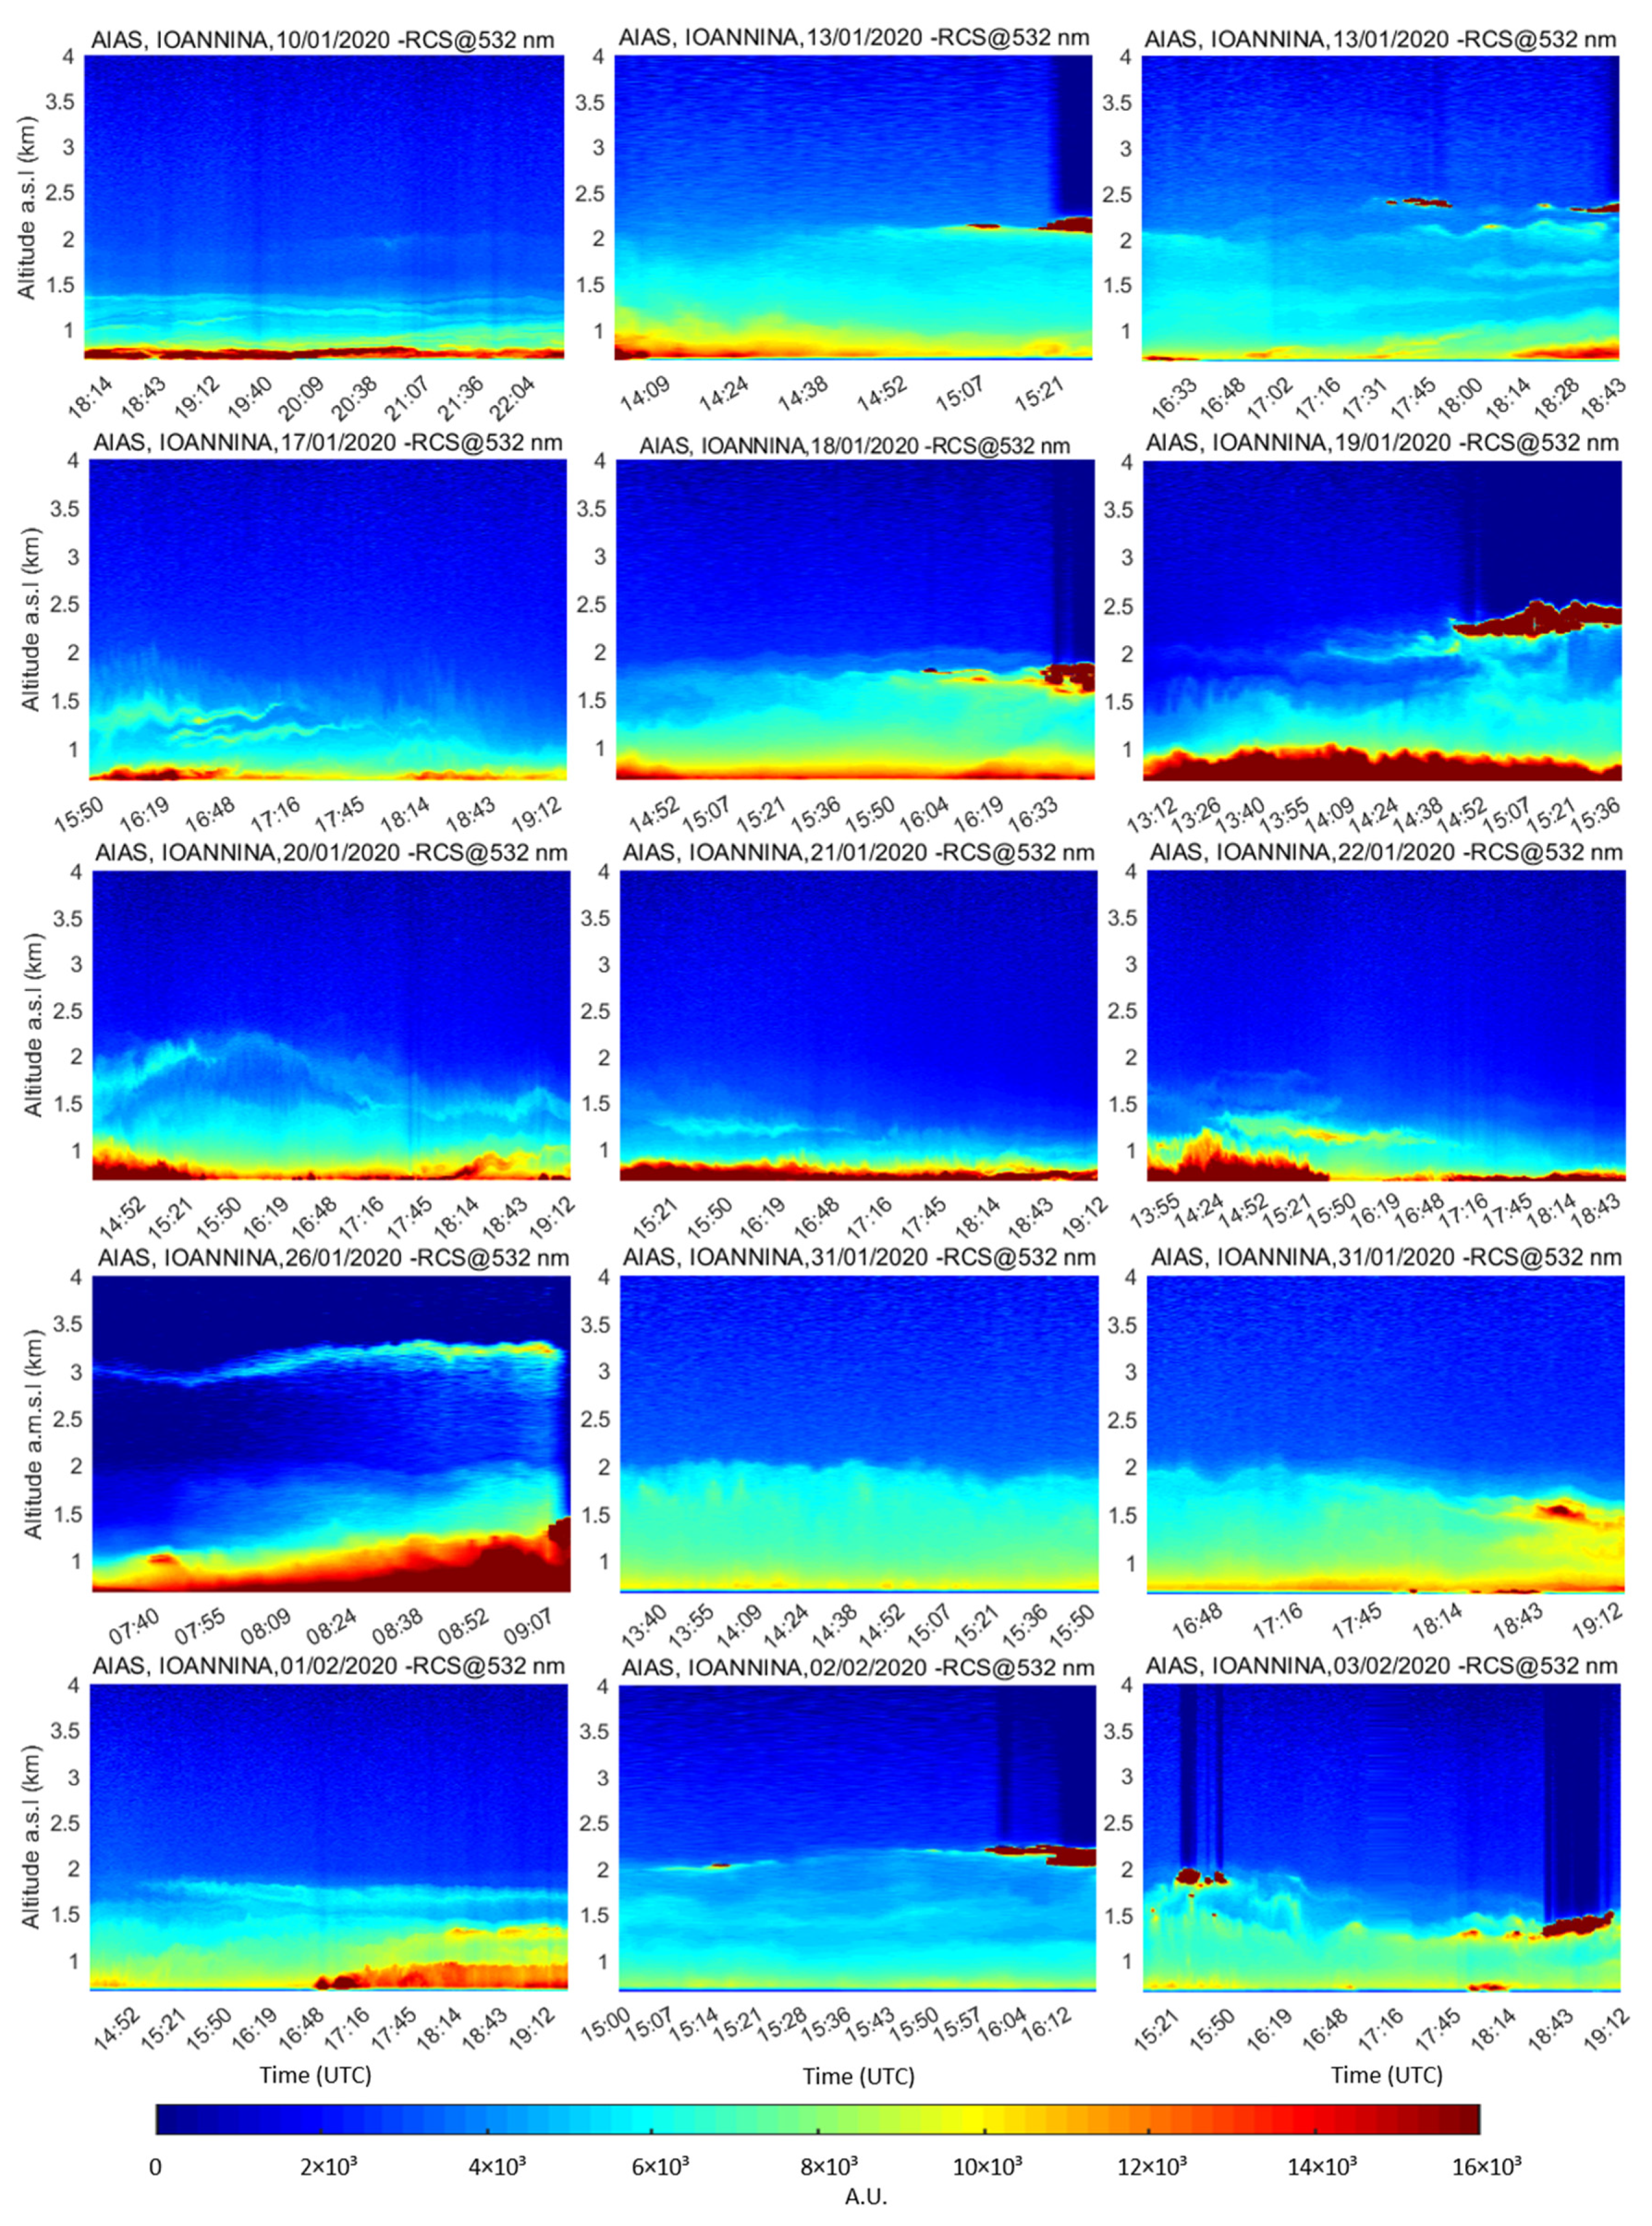
2.2.1. Lidar Data Processing

The acquired lidar data were processed, in a near real-time lidar mode, using the Single Calculus Chain (SCC) as described by D’Amico et al. (2015) and Mattis et al. (2016) [17,18], to retrieve the vertical profiles of the baer and the PLDR at 532 nm. Since AIAS is a depolarization lidar system, a calibration constant was needed for the PLDR value to be calculated. The calibration method used for AIAS was the “±45° calibration”, which uses two measurements taken by rotating the depolarization analyzer at ±45° [19,20]. The calculation of PLDR by the SCC is fully described by D’Amico et al. (2015, 2016), and Mattis et al. (2016) [17,18,21]]. In order to retrieve the profiles of baer an assumption of a constant lidar ratio (LR) has to be made [22,23], regarding the specific aerosol type [24]. In this study, two aerosol types were identified: (i) the majority of the studied cases referred to locally produced BB aerosols, while one case (ii) was identified as long-range transport of dust aerosols in the free troposphere. Concerning the BB aerosols, as their LR values may vary in the range 43 to 98 sr [25,26,27,28,29,30,31] the LR assumed for the studied BB cases in this study was equal to 70 ± 20 sr, as mostly observed in this kind of aerosols. On the other hand, the LR value used for the dust case was equal to 50 ± 15 sr according to Groß et al. (2011), Sicard et al. (2016), Soupiona et al. (2020), and Mylonaki et al. (2021) [14,32,33,34]. The corresponding systematic errors of the retrieved baer and PLDR values using the SCC processing chain can be found in [18,21]. In our case the corresponding uncertainty of baer and PLDR is of the order of ~11 ± 8% and 16 ± 11%, respectively [14].

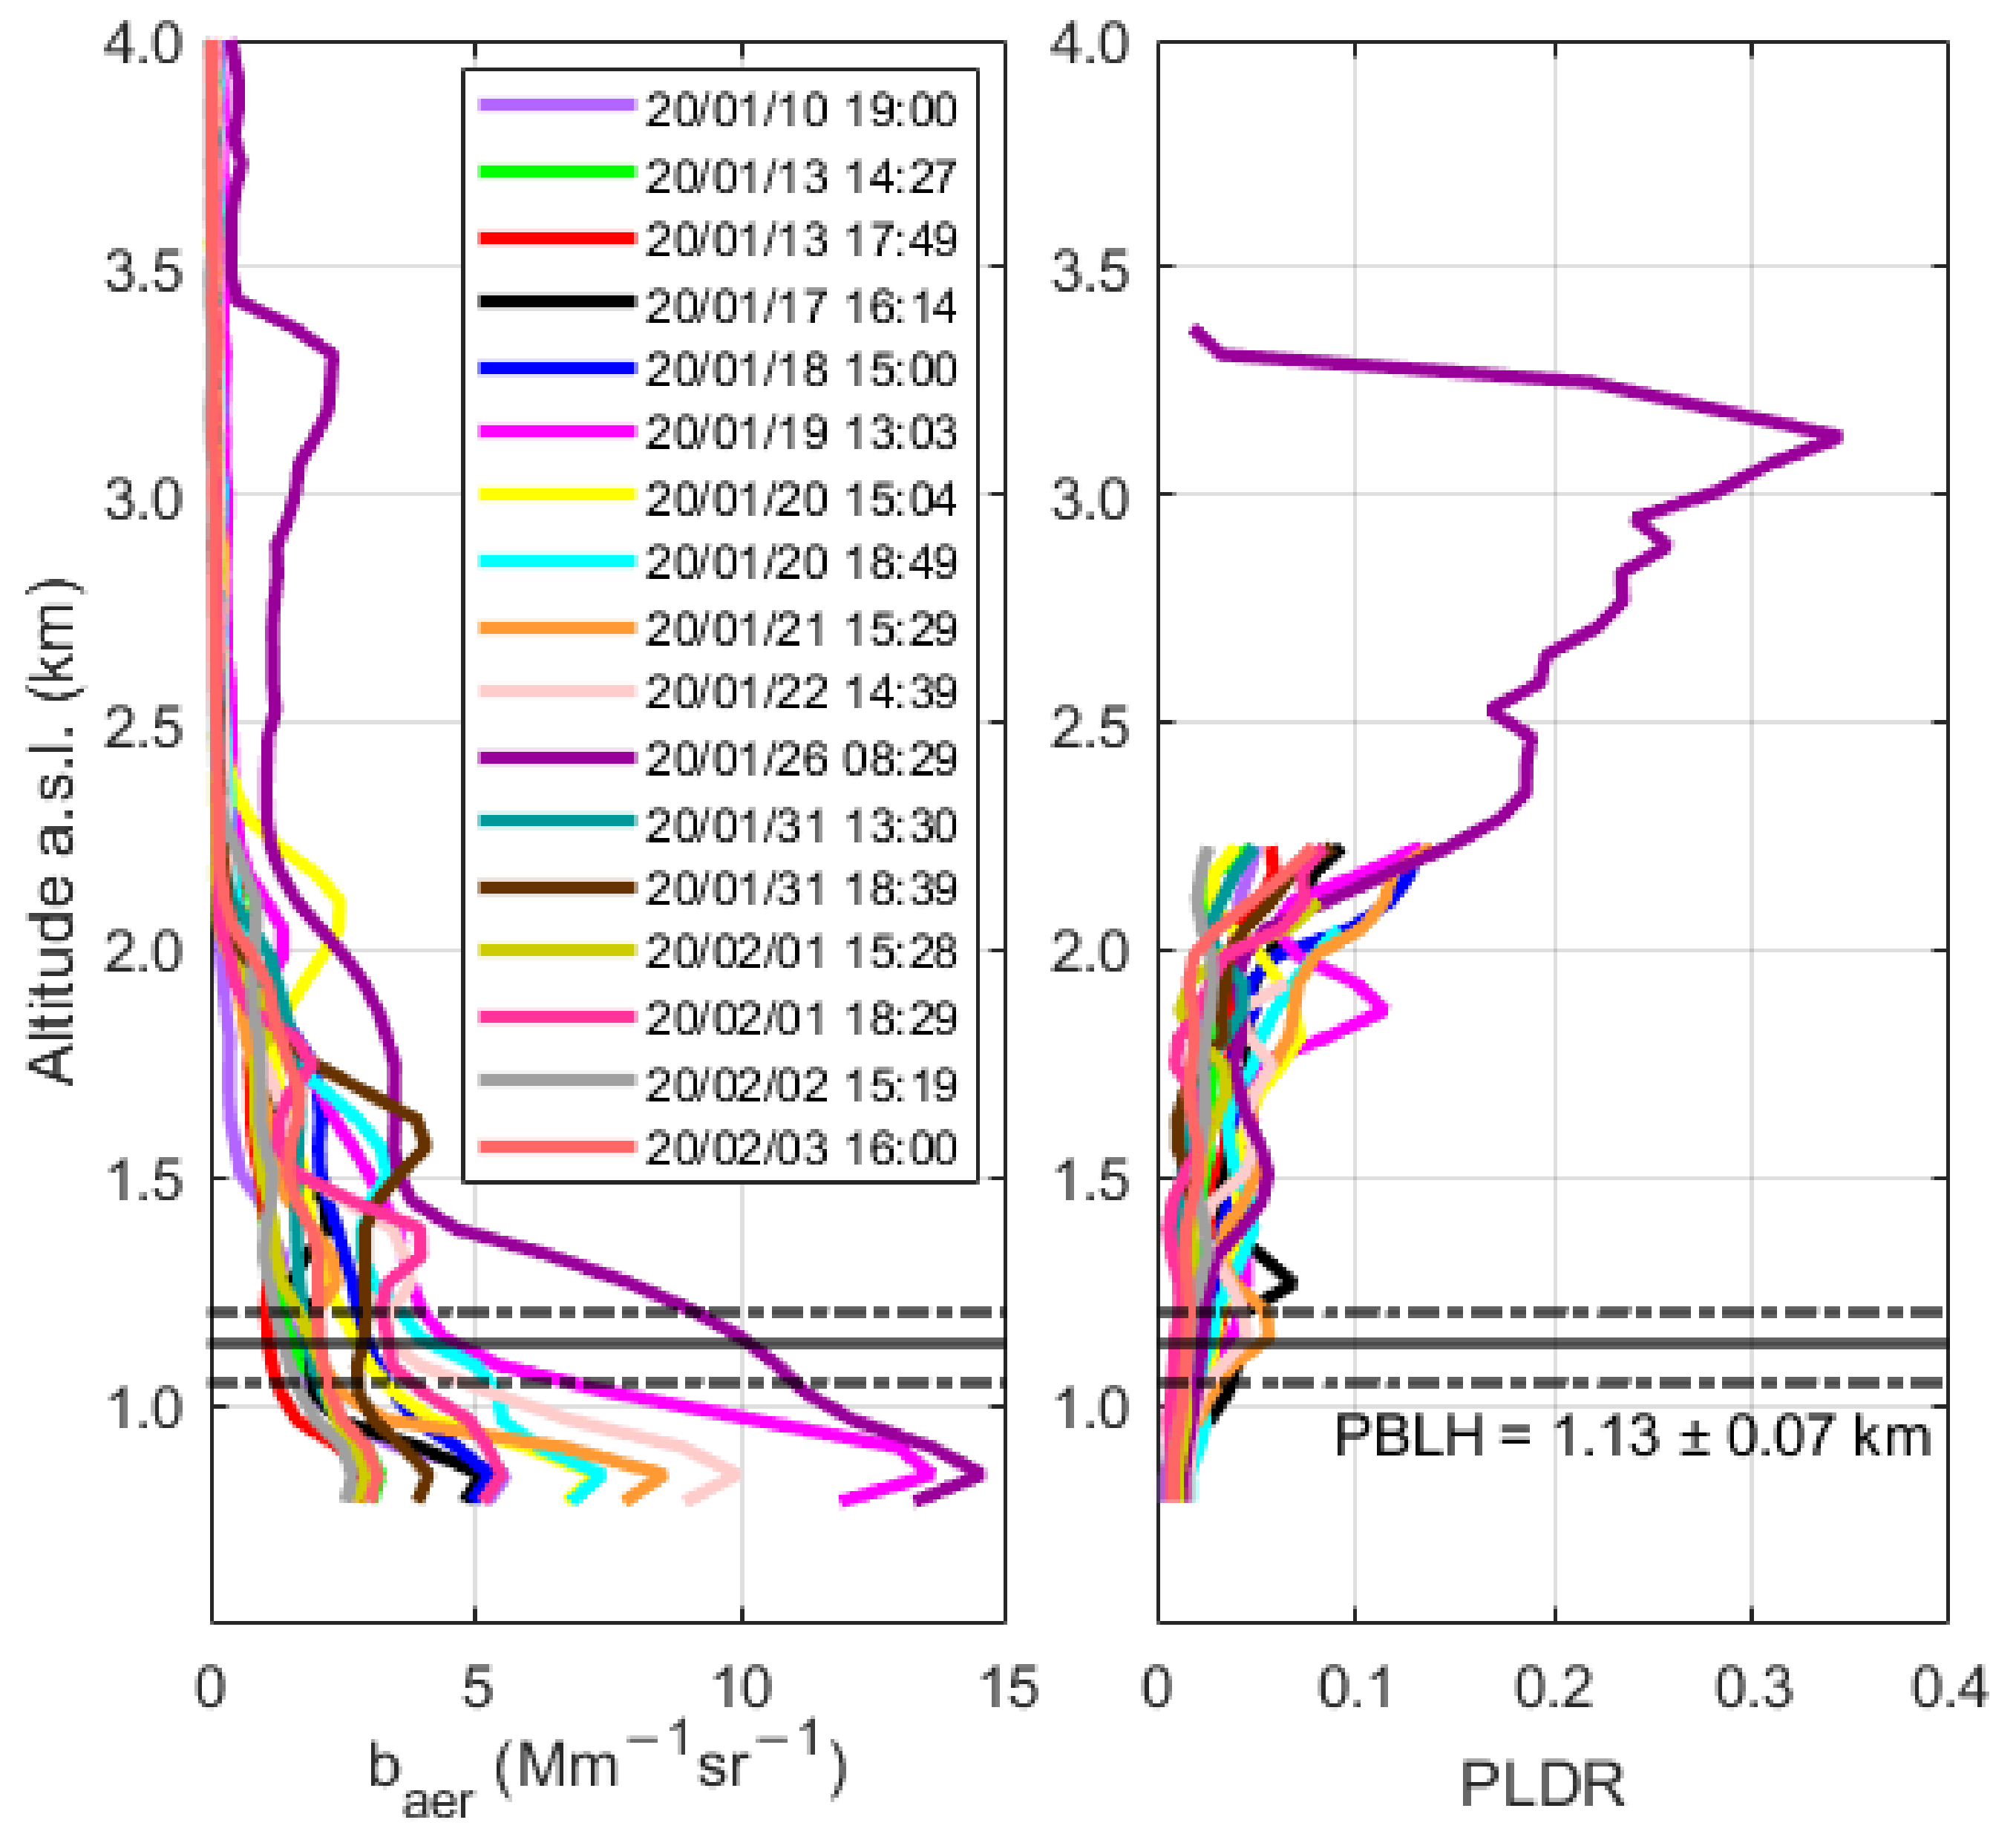
2.2.2. Planetary Boundary Layer Height Calculation

It is well established that the variability of the planetary boundary layer height (PBLH) over ground depends mainly on the topographical characteristics of the area under study, as well as on the prevailing synoptic and micrometeorological conditions site, taking into account the season of the measurements [35,36]. On the other hand, the PBLH variation is mostly related to the vertical mixing and thus, it can directly control the dispersion of air pollutants inside the PBL [37,38]. Thus, the PBLH remains a crucial input parameter to atmospheric models, enabling a realistic description of the lower atmospheric dynamics and providing accurate and real-time air-pollution dispersion forecasts. The role of the PBLH becomes more important during the cold winter periods, when low-altitude temperature inversions form, which play a major role in the confinement of local emissions inside a shallow PBL, leading to increased air pollutants loadings near ground. In our study, the PBLH variation was estimated by applying the extended-Kalman filtering (EKF) technique to the range-corrected and background-subtracted (RCS) lidar signals [39].

2.2.3. Hybrid Single Particle Langrangian Integrated Trajectory Model (HYSPLIT)

The air mass trajectories arriving over the Ioannina city from long ranges (greater than several km distances) were calculated using the Hybrid Single-Particle Lagrangian Integrated Trajectory model (HYSPLIT) in the backward mode (https://www.ready.noaa.gov (accessed on 10 December 2020)) as described by Stein et al. (2015) [40]. This enabled us to identify the origin of the air masses observed by the lidar in the LFT and consequently the associated aerosols’ source region. For the backward air mass trajectory analysis, the “normal” method was used, based on the GDAS1 (Global Data Analysis System) meteorological data. The vertical motion used to calculate the air mass trajectories was taken from the model’s vertical velocity. As initial values for the model, we used the geographical coordinates of the AIAS lidar system (39.65° N, 20.85° E) and the altitude (a.s.l.) of the observed aerosol layers. The duration of the air mass trajectories calculation was set to 144 h in order to obtain representative results of the PM source regions.

2.2.4. Moderate Resolution Imaging Spectroradiometer (MODIS)

In this study active fire data from the Moderate Resolution Imaging Spectroradiometer (MODIS) flying on the Terra and Aqua satellites in complementary orbits [41], were used during the time period of the campaign. The data were distributed through the Fire Information for Resource Management System (FIRMS) (https://firms.modaps.eosdis.nasa.gov/map/ (accessed on 11 December 2020)). In order to have a better estimation of the active fires during the studied period, the confidence of the fire data was selected to be higher than 70%. The active fire data were used in order to ensure that the BB aerosols observed with the AIAS mobile lidar system over the Ioannina city were locally originated and there was no other contribution from other relevant sources in Greece, Balkans, and Europe during this time period. However, since these data were only used for a specific reason (i.e., to confirm the local origin of the emitted BB aerosols) no further results related to the active fires are presented here.

2.2.5. Low-Cost Sensors
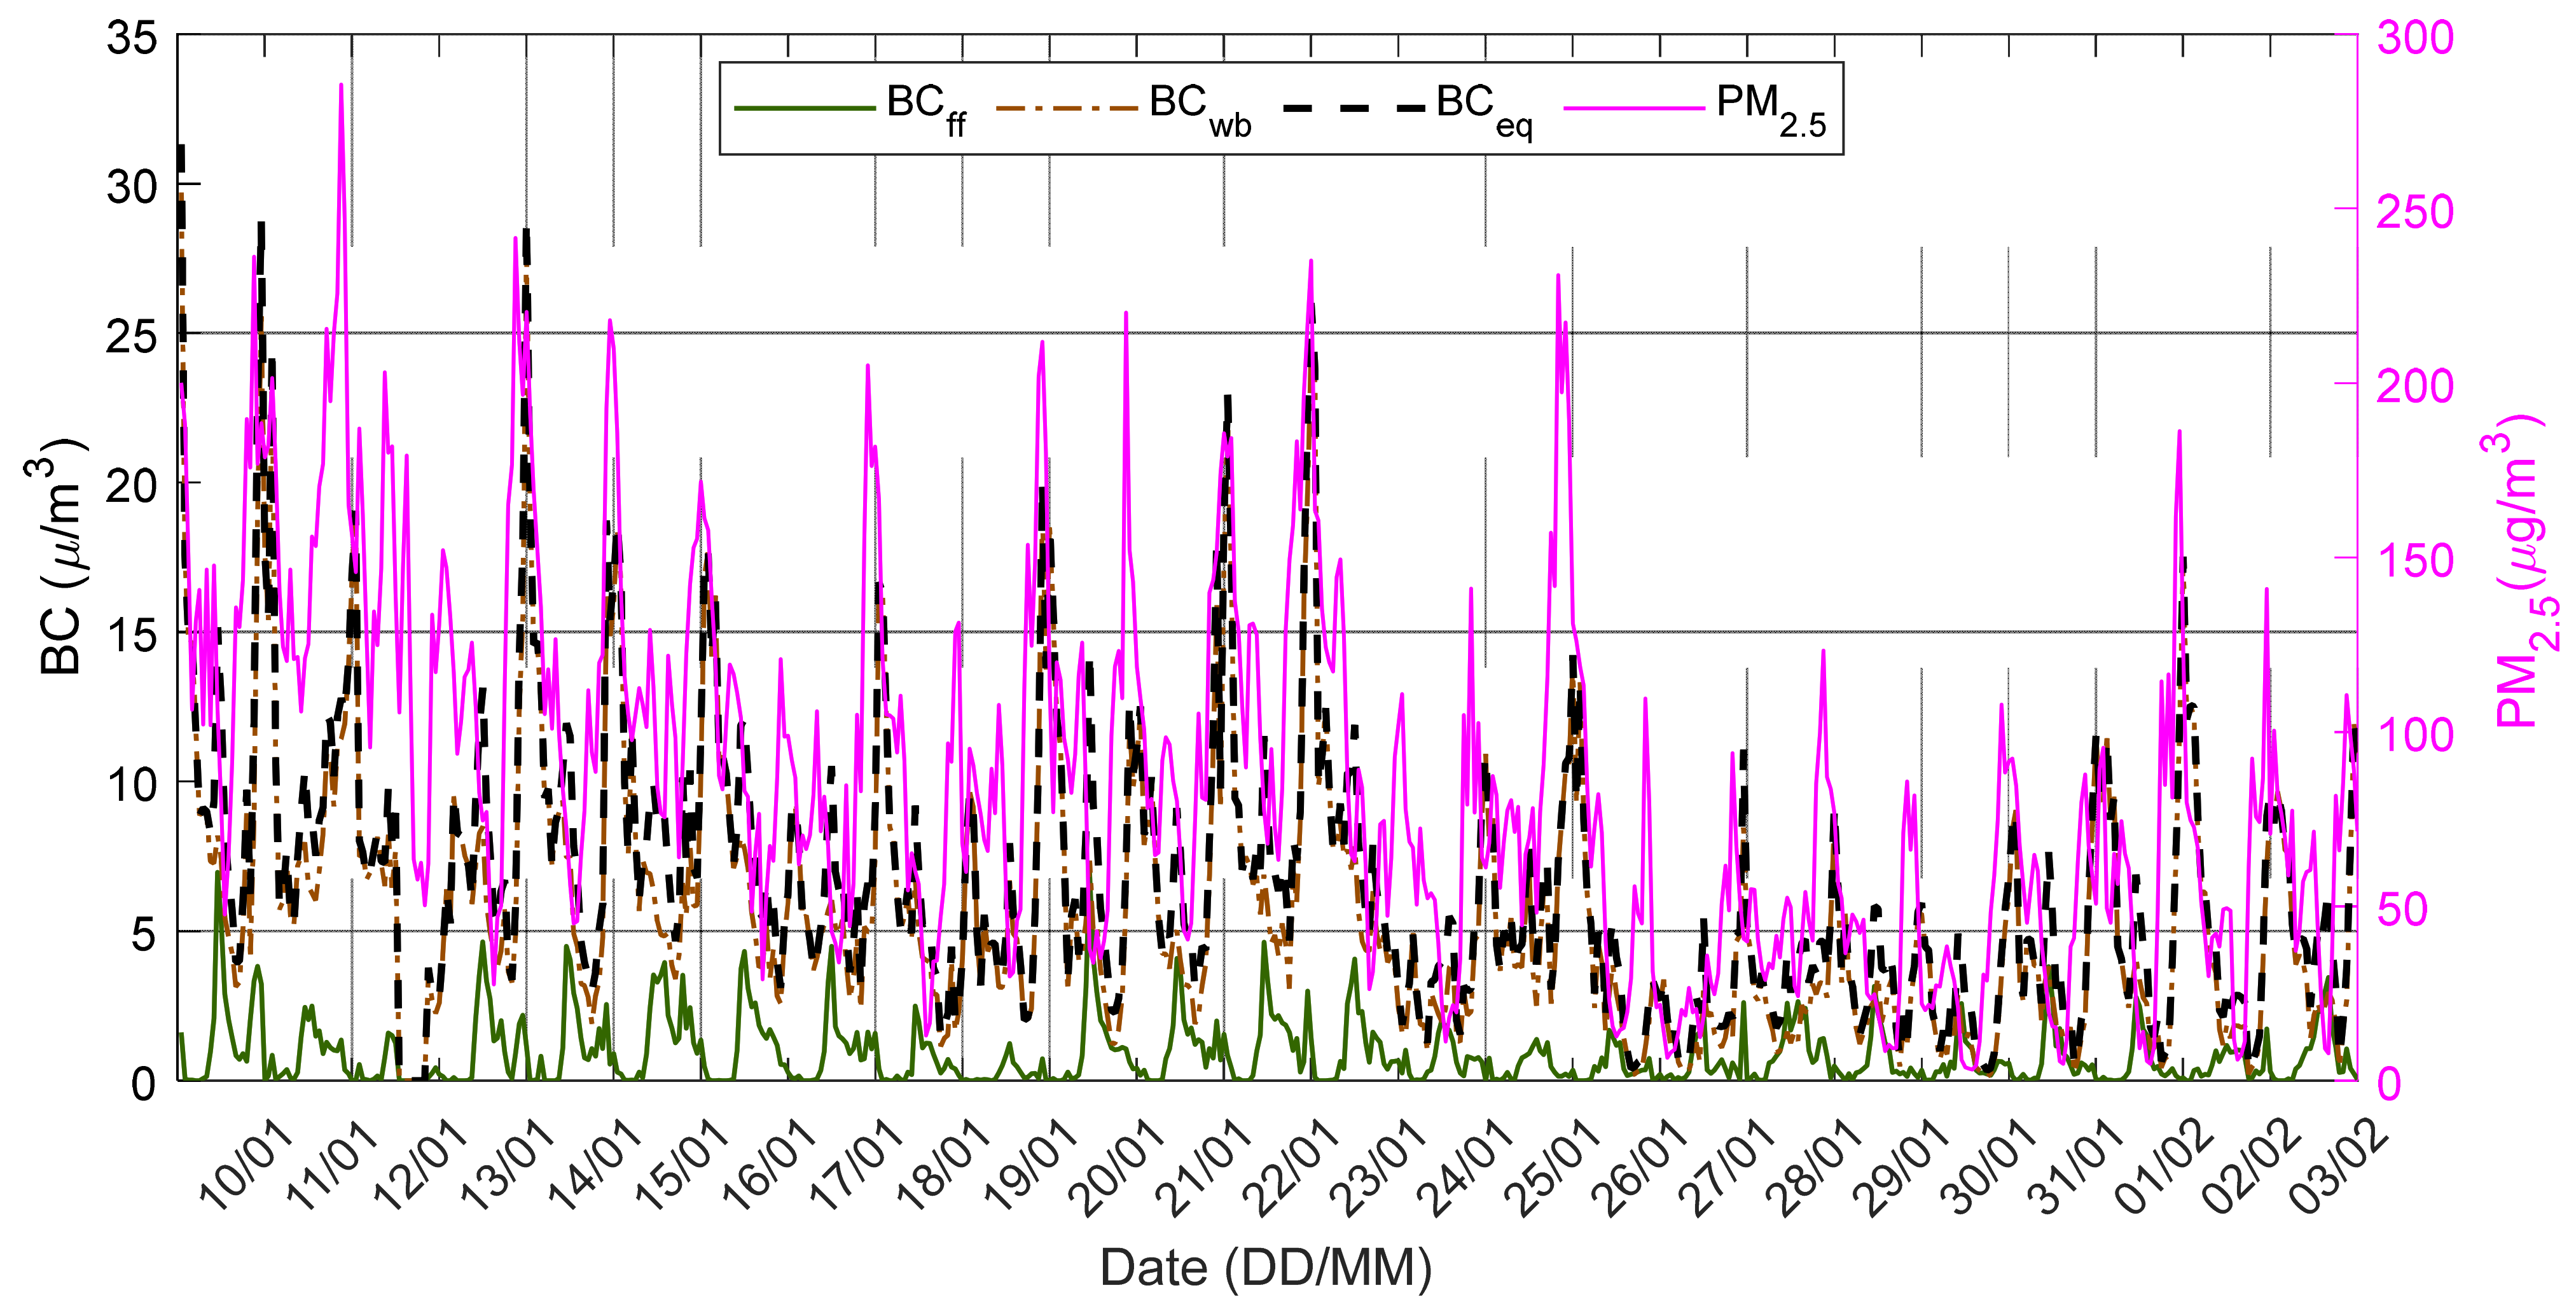
The Purple Air PA-II sensor (PurpleAir Inc., Draper, UT, USA) is a low-cost PM monitoring device, based on an optical particle counter (OPC), PMS5003, Plantower Ltd., Beijing, China), which provides mass concentrations (PM1, PM2.5, and PM10 fractions), along with the T, RH, and barometric pressure (P) data at a 2-min resolution. The sampled air mass is guided throw a built-in fan to the laser detector after two 90° turns. As an output the sensor provides PM1, PM2.5, and PM10 mass concentrations, as well as the cumulative particle size distribution in six size ranges (lower than 0.3 μm, 0.5 μm, 1 μm, 2.5 μm, 5 μm, and 10 μm) among other parameters [42,43]. In this study we used the PM2.5 mass concentration, as well as T and RH data derived from the sensor PANACEA-013 located at Anatoli in the south suburbs of Ioannina city after applying a quadratic regression model correction derived during an extensive characterization campaign held at Ioannina during winter and spring time 2019–2020, using as reference a 32 channel HORIBA APDA-372 (Horiba Ltd., Kyoto, Japan) optical particle counter, an instrument that is a reference-equivalent method for determining PM2.5 and PM10 according to EN 14,907 and EN 12,341 standards. The correction, when applied, was found to yield significant decrease in the normalized Root Mean Squared Error (nRMSE) as well as an almost 10-fold decrease in the Mean Absolute Error (MAE). A detailed description on the PA-II correction, specific for the Ioannina environment can be found in Stavroulas et al. (2020) [42].

2.2.6. Aethalometer

BC measurements were obtained using a seven-wavelength dual spot aethalometer (AE-33, Magee Scientific, Berkeley, CA, USA in the same sampling site as the lidar system. The AE-33 was sampling total suspended particles at 2 lt/min, through short conductive tubing, on a PTFE-coated glass-fiber filter tape (Part No, 8060). BC concentration was determined using the 880 nm aethalometer channel using an MAE provided by the manufacturer. The AE-33 compensates for the filter loading effect in real-time utilizing the Dual Spot technology while a correction specific to the filter material used; it also applied regarding the multiple scattering artefact [44]. The 1-min resolution BC measurements were averaged on an hourly basis. Source specific BC fractions, namely those related to wood burning (BCwb) and fossil fuel combustion (BCff) were calculated by the instrument, applying the “Aethalometer Model” at the 470 and 950 nm wavelength pair, assuming a fixed Absorption Ångström Exponent (AAE) for wood burning (AAEwb = 2) and fossil fuel combustion (AAEff = 1) [45].

3. Results and Discussion

Figure 2 presents the vertical distribution of baer and PLDR at 532 nm, as observed by the AIAS mobile depolarization lidar during the winter PANACEA campaign over the city of Ioannina. The under-study cases are presented with a different color for each day and time. The PBLH along with its standard deviation (std) is also shown by the black solid and dashed lines, respectively.
The majority of the cases presented here show low altitude aerosol layers (from near ground up to 2.40 km a.s.l.) with quite low PLDR values (lower than 0.11), except for the case of the 26 January 2020, when dust aerosol layers (Figure 3; purple solid line) were observed from 2.71 up to 3.48 km altitude, showing increased PLDR values reaching up to 0.34. The mean value of PBLH of all the under-study cases was found equal to 1.13 ± 0.07 km a.s.l. The mean values of the aerosol optical properties (baer and PLDR) were calculated within the PBL and inside each one of the aerosol layers observed above it.
In Figure 4, we present the geometrical and optical properties observed over Ioannina during this campaign. The black rhombus denotes the PBLH values, while the different-colored-bars denote the top and bottom of the aerosol layers (AL) above it (Figure 4a). The mean values of baer and PLDR at 532 nm, along with their standard deviation (std) as they were calculated inside the PBL (black rhombus) and the AL (different-colored-squares), are also presented (Figure 4b,c). In the same graph can also be found, the wind speed and direction (Figure 4d), the PM2.5 mass concentrations, with the T and RH (Figure 4), and the BC (wb, ff) mass concentrations (Figure 4f), as obtained during the available days of the winter PANACEA campaign. The results presented in Figure 4 and the corresponding meteorological data are extensively presented in Table A1 and Table A2, while the timeseries analysis of the BC, along with the BCwb, BCff and PM2.5 mass concentrations during the campaign are also presented in Figure A2.
From the analysis of the data presented in Figure 4a, we found that the PBLH ranged from 1.02 to 1.31 km a.s.l during the afternoon and evening hours of the campaign. The mean altitude of the AL found in the FT was equal to 1.21 ± 0.06 km for the BB smoke particles, and of 3.16 ± 0.27 km for the dust aerosol layer on 26 January. Specifically, the BB aerosols were initially emitted in the PBL during daytime, and were later convected into the LFT due to the prevailing unstable conditions which are connected to thermals of warm air rising from ground up to the top of the PBL, in the form of updrafts [36,46]. Thus, BB smoke layers were found during the campaign in the LFT (1.21 to 2.23 km), while the long-range transported dust layer was detected at higher altitudes (3.16 km). This could also be related to the fact that the sources of the BB aerosols (fireplaces and wood stoves) are local ones at near ground levels, typically smoldering fires with low injection heights [47,48], in contrast to the dust and mixed dust aerosols, which are generally found in higher heights, typically between 3–6 km a.s.l. [49].
The mean value of baer at 532 nm within the PBL during the campaign (Figure 4b) was found equal to 4.61 ± 2.88 Mm−1sr−1. However, in some days of measurements (i.e., 19, 22 and 26 January) the mean baer was greater than 7.96 Mm−1sr−1 reaching up to the value of 12.19 Mm−1sr−1, while in the rest of the days it ranged from 2.03 ± 0.74 to 6.05 ± 0.91 Mm−1sr−1. The FT BB aerosol layers showed a mean baer of 1.45 ± 0.43 Mm−1sr−1, ranging between 0.37 ± 0.11 and 2.91 ± 0.91 Mm−1sr−1. The mixed dust aerosol layer showed a value of baer equal to 1.50 ± 0.59 Mm−1sr−1. The mean values of the PLDR (Figure 4c), indicative of the aerosols’ shape, were found to be extremely low inside the PBL and ranged between 0.01 ± 0.01 and 0.03 ± 0.01. Regarding the FT aerosol layers, the mean PLDR values were found equal to 0.04 ± 0.02 and reached values up to 0.09 ± 0.03, which are typical for BB aerosol and BB mixtures (Table 1) [1,14,26,30,31,50,51,52,53]. On the other hand, the mean PLDR value of the aerosol layer on 26 January 2020, was equal 0.20 ± 0.10, indicating the presence of dust aerosols [14,33,53,54,55].
At ground level, the average wind speed during the period of measurements was extremely low (0.7 ± 0.2 m/s) with values ranging from 0.3 to 1.2 m/s, with a mean North-Northwest direction (Figure 4d). At the same level, the PM2.5 mass concentrations ranged from 5.6 to 175.7 μg/m3, while the T and RH did not vary significantly during the campaign time period ranged from 3.7 to 11.1 °C and 34 to 93%, respectively (Figure 4e, Table A2). The BC concentrations presented a mean value of 6.6 ± 5.1 μg/m3 (0.8 to 17.5 μg/m3) and exhibit a similar trend to the PM2.5 concentrations. It is evident, that the increase in the BC consternations at the surface, especially during evening hours, can be attributed mostly to wood burning activities. There is no clear linkage between the wind direction-intensity (Figure 4d) and the recorded hourly BC values (Figure 4f), at least for the cases examined and presented in this study, which are characterized by small wind intensities (0.3–1.3 m/s) and limited direction range (90o range covering from W to NNE), even though the aforementioned meteorological properties (along with temperature) are playing an important role in the development of the PBLH, which may affect also the distribution of particles at the lowest atmospheric height. The reason behind this can be the amount of wood burning, that is higher than any other anthropogenic-industrial activity that take place in the area. According to previous studies [3,7,8] related to wood burning, the BC concentrations seem to also increase with the absence of precipitation, along with wind speeds lower than 3 m /s and a shallow PBL, it should be noted that the period of measurements was very dry, essentially there was no rain except for the 26 January (0.6 mm). The participation of the fossil fuel in the BC mass concentrations values was nearly negligible throughout most of the period (0.1 to 35.8%), with extremely low values ranging from 0 to 1.3 μg/m3, while the wood burning BCwb mass concentrations (0.5 to 17.5 μg/m3), at most times, were almost largely dominated by the BC, with contribution that for two cases (i.e., 10 January and 1 February) reached the extreme value of 100% (64.1–100%). According to [42], during the period 15 December 2019 to 13 January 2020, an average BC concentration of 5.02 μg/m3 was measured in Ioannina reaching up to 31 μg/m3 (hourly max), with an extremely high BCwb contribution of 75%, that during night-time was reaching up to 88%.
Relevant studies related to BC measurements showed that in Athens (Greece), during the last few years, the BC concentrations reached values up to 32.7 μg/m3, while the BCwb contribution ranged from 20–25% up to 40% of the BC, during the night [3,7,8,56]. In other European cities (e.g., Granada, Lisbon, London, Madrid, Paris, Porto, Rome, or Zurich) measurements during the winter period showed mean BC concentrations lower than 13.1 μg/m3 with a BCwb contribution that did not exceed 47 ± 6% of the BC [56,57,58,59,60,61] apart from the BCwb contribution of 88% in rural area of Spain, during the winter of 2014–2015, as described by Becerril-valle et al. (2017) [62]. It is of interest to mention that BC concentrations emitted in a middle-sized urban city such as Ioannina (~280 inhabitants/km2) during winter is of the same order, and in some cases even greater, than the BC emissions in some of the biggest European cities and capitals (~3000–20,000 inhabitants/km2). This is the result of a decrease in consumption of conventional fuel for residential heating (e.g., oil) in Ioannina and the strengthened use of cheaper wood or pellet burning during the times of austerity in Greece.
In most of the studied cases, the PM2.5 and BCwb concentrations were lower during early afternoon hours, than during night-time. These quantities were also decreasing as T increased. Temperature plays a very important role in the development of the PBLH, which may affect also the distribution of aerosols inside the PBL. Decreased solar radiation and thus temperature can prevent the vertical mixing of aerosols. Especially during the cold winter periods, when low-altitude temperature inversions can be formed and thus the local emissions can be trapped inside a shallow PBL, leading to increased particle concentrations near ground. Based on the relatively similar behavior of the PM2.5 and the BCwb concentrations and the inversely proportional between PM2.5, BC, BCwb, and T, an analysis was applied to find the correlation between the aforementioned quantities. In Figure 5 we present the linear fits, along with the coefficients of determination and the linear regression equations, as obtained for the following quantities: (a) BC and PM2.5, (b) BCwb and BC, (c) BCwb and PM2.5, (d) BC and T, (e) BCwb and T, and, finally, (f) PM2.5 and T, respectively. The correlation plots between the BCff and the quantities BC, PM2.5, and T can be found in Figure A3 in the Appendix A.
The coefficients of determination along with the linear regression equations for each plot are revealing a significant correlation between the parameters presented in the correlation plots in Figure 5. These results highlight the strong correlation between BC, BCwb, and PM2.5 ((a) R2 = 0.90, (b) R2 = 0.99, (c) R2 = 0.89), along with the almost complete composition of BC aerosols by biomass (wood) burning particles and the very important contribution of wood burning. The inverse relationship between both BCwb and PM2.5 with T ((d) R2 = 0.69, (e) R2 = 0.69, and (f) R2 = 0.82) is also pointed out. In addition, the trends in BC concentrations appeared to be almost similar to those of PM2.5 concentrations (Figure 4 and Figure A2). These similar trends, along with the highly correlated BC, BCwb, and PM2.5 concentrations, suggesting that the PM2.5 may contain a significant proportion of BC, and hence BCwb concentrations in the study area for the studied period.
Figure 5. Correlation graphs between: (a) BC and PM2.5, (b) BCwb and BC, (c) BCwb and PM2.5, (d) BC and T, (e) BCwb and T, and, finally, (f) PM2.5 and T.
Atmosphere 13 00094 g005

3.1. Case Studies

Moreover, we selected to analyze three cases of typical interest. The first two were related to local BB aerosols emitted from local sources namely wood burning for heating purposes, during afternoon and early night-time hours. The third case was related to the long-range transport event of dust aerosols over the city.

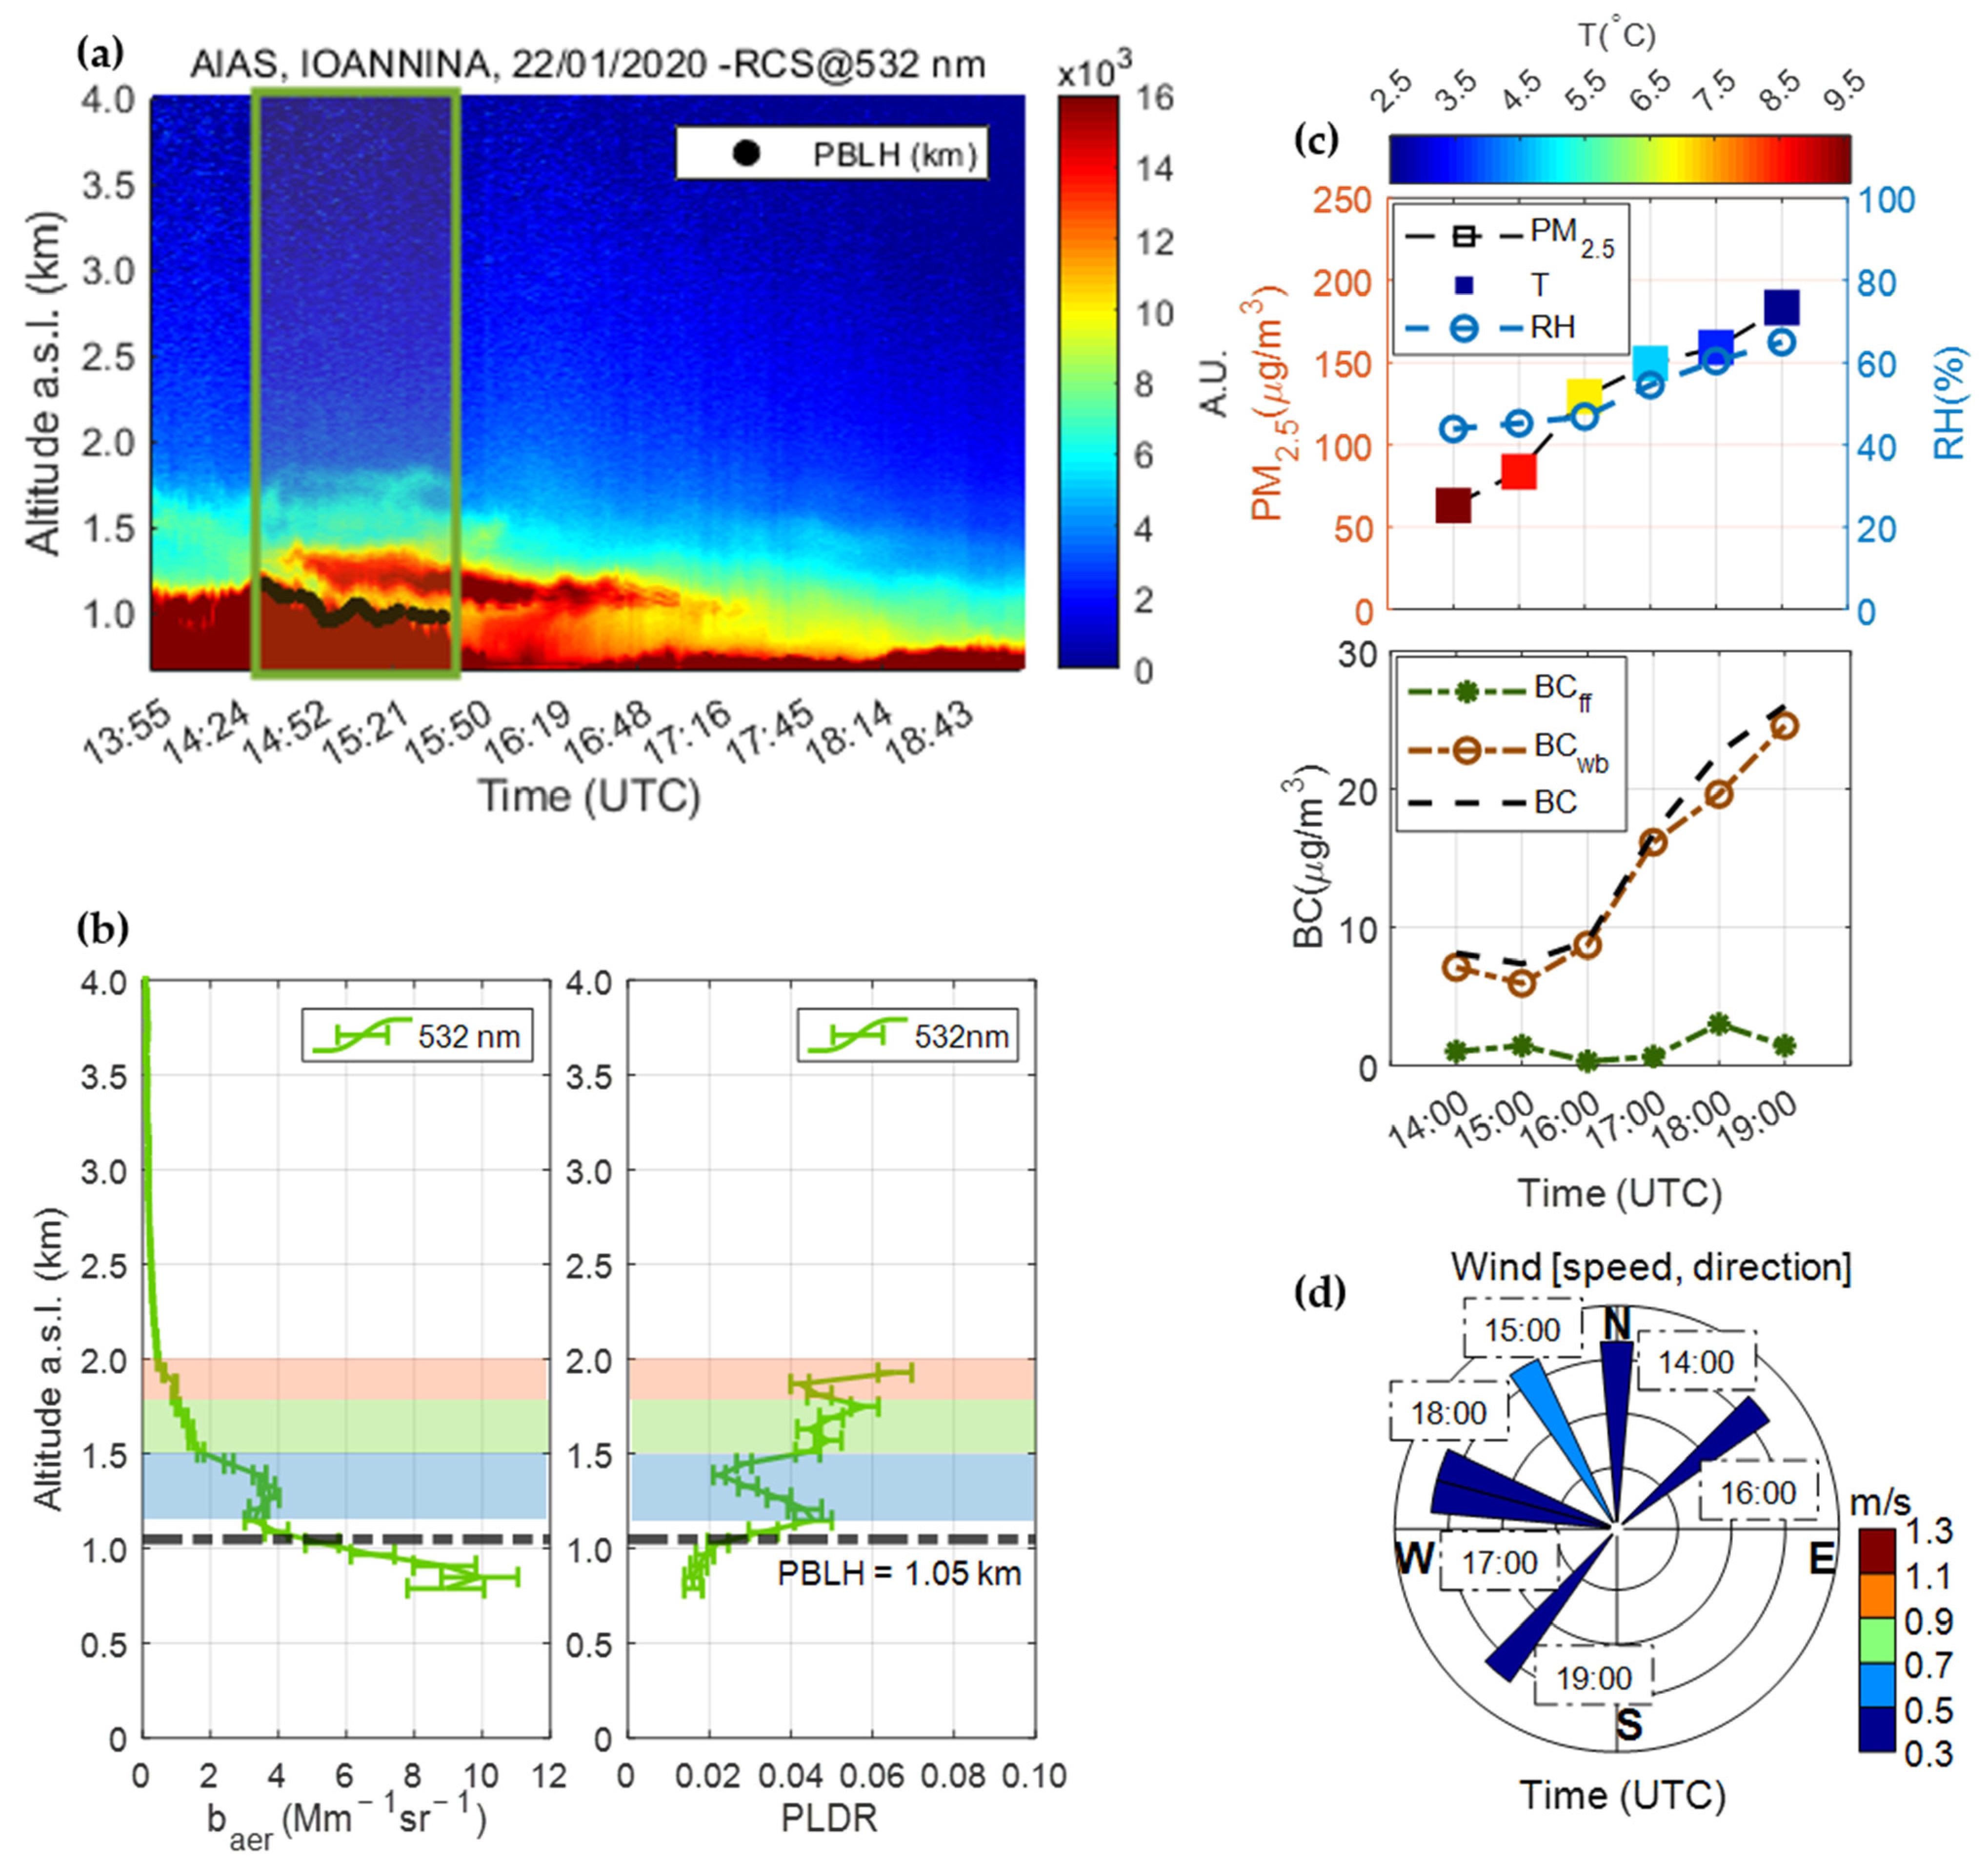
3.1.1. Local Biomass Burning Aerosol: Case I

Figure 6a illustrates the spatio-temporal evolution of the range-corrected lidar signals obtained by AIAS at 532 nm, from 0.52 up to 4 km height a.s.l., over the city of Ioannina, on 22 January 2020 between 13:54 and 19:09 UTC. The color scale on the right side of the figure indicates the range -corrected signal in arbitrary units (A.U.). Furthermore, in the same figure we present the PBLH (black dots). What is easily observed is an intense confinement of aerosols from ground up to 1.05 km height, which indicates the presence of locally emitted aerosols. Increased aerosol backscattering is also observed near ground during the lidar measurements that day (13:56–19:09 UTC). The green-colored rectangle indicates the time window (14:39–15:41 UTC), in which the retrieval of the vertical profile of the aerosol optical properties baer and PLDR took place.
In Figure 6b the 3-colored horizontal shadowed rectangles represent the geometrical boundaries of the studied aerosol layers, while the black dashed line delineates the mean value of the PBLH inside the temporal window. Finally, in Figure 6c we present (upper graph) the hourly variation of the PM2.5 mass concentration (μg/m3), the T (°C), the RH (%), given by the Purple Air sensor, while in the same figure (lower graph) we show the BC mass concentration levels ) (μg/m3) along with the contribution of the fossil fuel (BCff) and wood burning (BCwb) to the total BC mass concentrations measured by the aethalometer.
Figure 6. (a) Spatio-temporal evolution of the range-corrected lidar signal at 532 nm, and (b) the vertical distribution of baer (Mm−1sr−1) and PLDR at 532 nm, as observed by the AIAS mobile lidar on 22 January 2020 between 14:39–15:41 UTC over the city of Ioannina. The 3-colored-shadowed rectangles represent the geometrical boundaries of the studied aerosol layers. The black dashed line represents the mean PBLH. (c) Upper graph: Temporal evolution of the PM2.5 mass concentration (μg/m3), versus T (°C), and RH (%); lower graph: BC mass concentrations (μg/m3) at ground level, along with the contribution of the fossil fuel (BCff) and wood burning (BCwb) to the total BC concentrations. (d) The wind speed and direction (hourly mean), during the measurement time.
Atmosphere 13 00094 g006
On 22 January (Figure 6a,b) we observed three aerosol layers over the PBL that is situated at 1.05 km a.s.l. The first layer (denoted by the blue shadowed rectangle) was found between 1.15 and 1.57 km. The second one (green shadowed rectangle) was found from 1.58 to 1.75 km and the last and higher one (orange shadowed rectangle) between 1.76 and 1.99 km. On that day the mean baer value inside the PBL was found equal to 7.96 ± 1.88 Mm−1sr−1. Regarding the three aerosol layers mentioned above (from the lower to the higher one), their mean baer values were found equal to 2.91 ± 0.91, 1.29 ± 0.18 and 0.80 ± 0.25 Mm−1sr−1, respectively. The mean PLDR value was 0.02 ± 0.01 inside the PBL, while the mean PLDR values at the three layers were equal to 0.04 ± 0.01, 0.05 ± 0.01 and 0.06 ± 0.02, respectively, which are in accordance with values found in the literature indicating the presence of fresh BB aerosols. During the lidar measurement time, the ground level PM2.5 mass concentrations were very high ranging from 63.3 to 183.3 μg/m3, in line with the decrease in temperature during late afternoon and night-time hours (from 9.6 °C at 14:00 UTC down to 2.5 °C at 19:00 UTC). In the same period the RH increased from 44 to 65%, while the wind speed was extremely low (0.3 to 0.5 m/s) with the North (Northeast, Northwest) direction during early afternoon (14:00–16:00), changed to the West (Northwest, Southwest) direction during night-time (17:00–19:00). The BC concentration levels, during the same time period, showed an increase from 7.4 to 26.0 μg/m3, with the contribution of the BCwb concentrations (80.7 to 96.7%) being almost equal to the total BC concentrations (6.0–24.6 μg/m3). The corresponding BCff concentrations showed a very low variability, being always lower than 3.0 μg/m3.

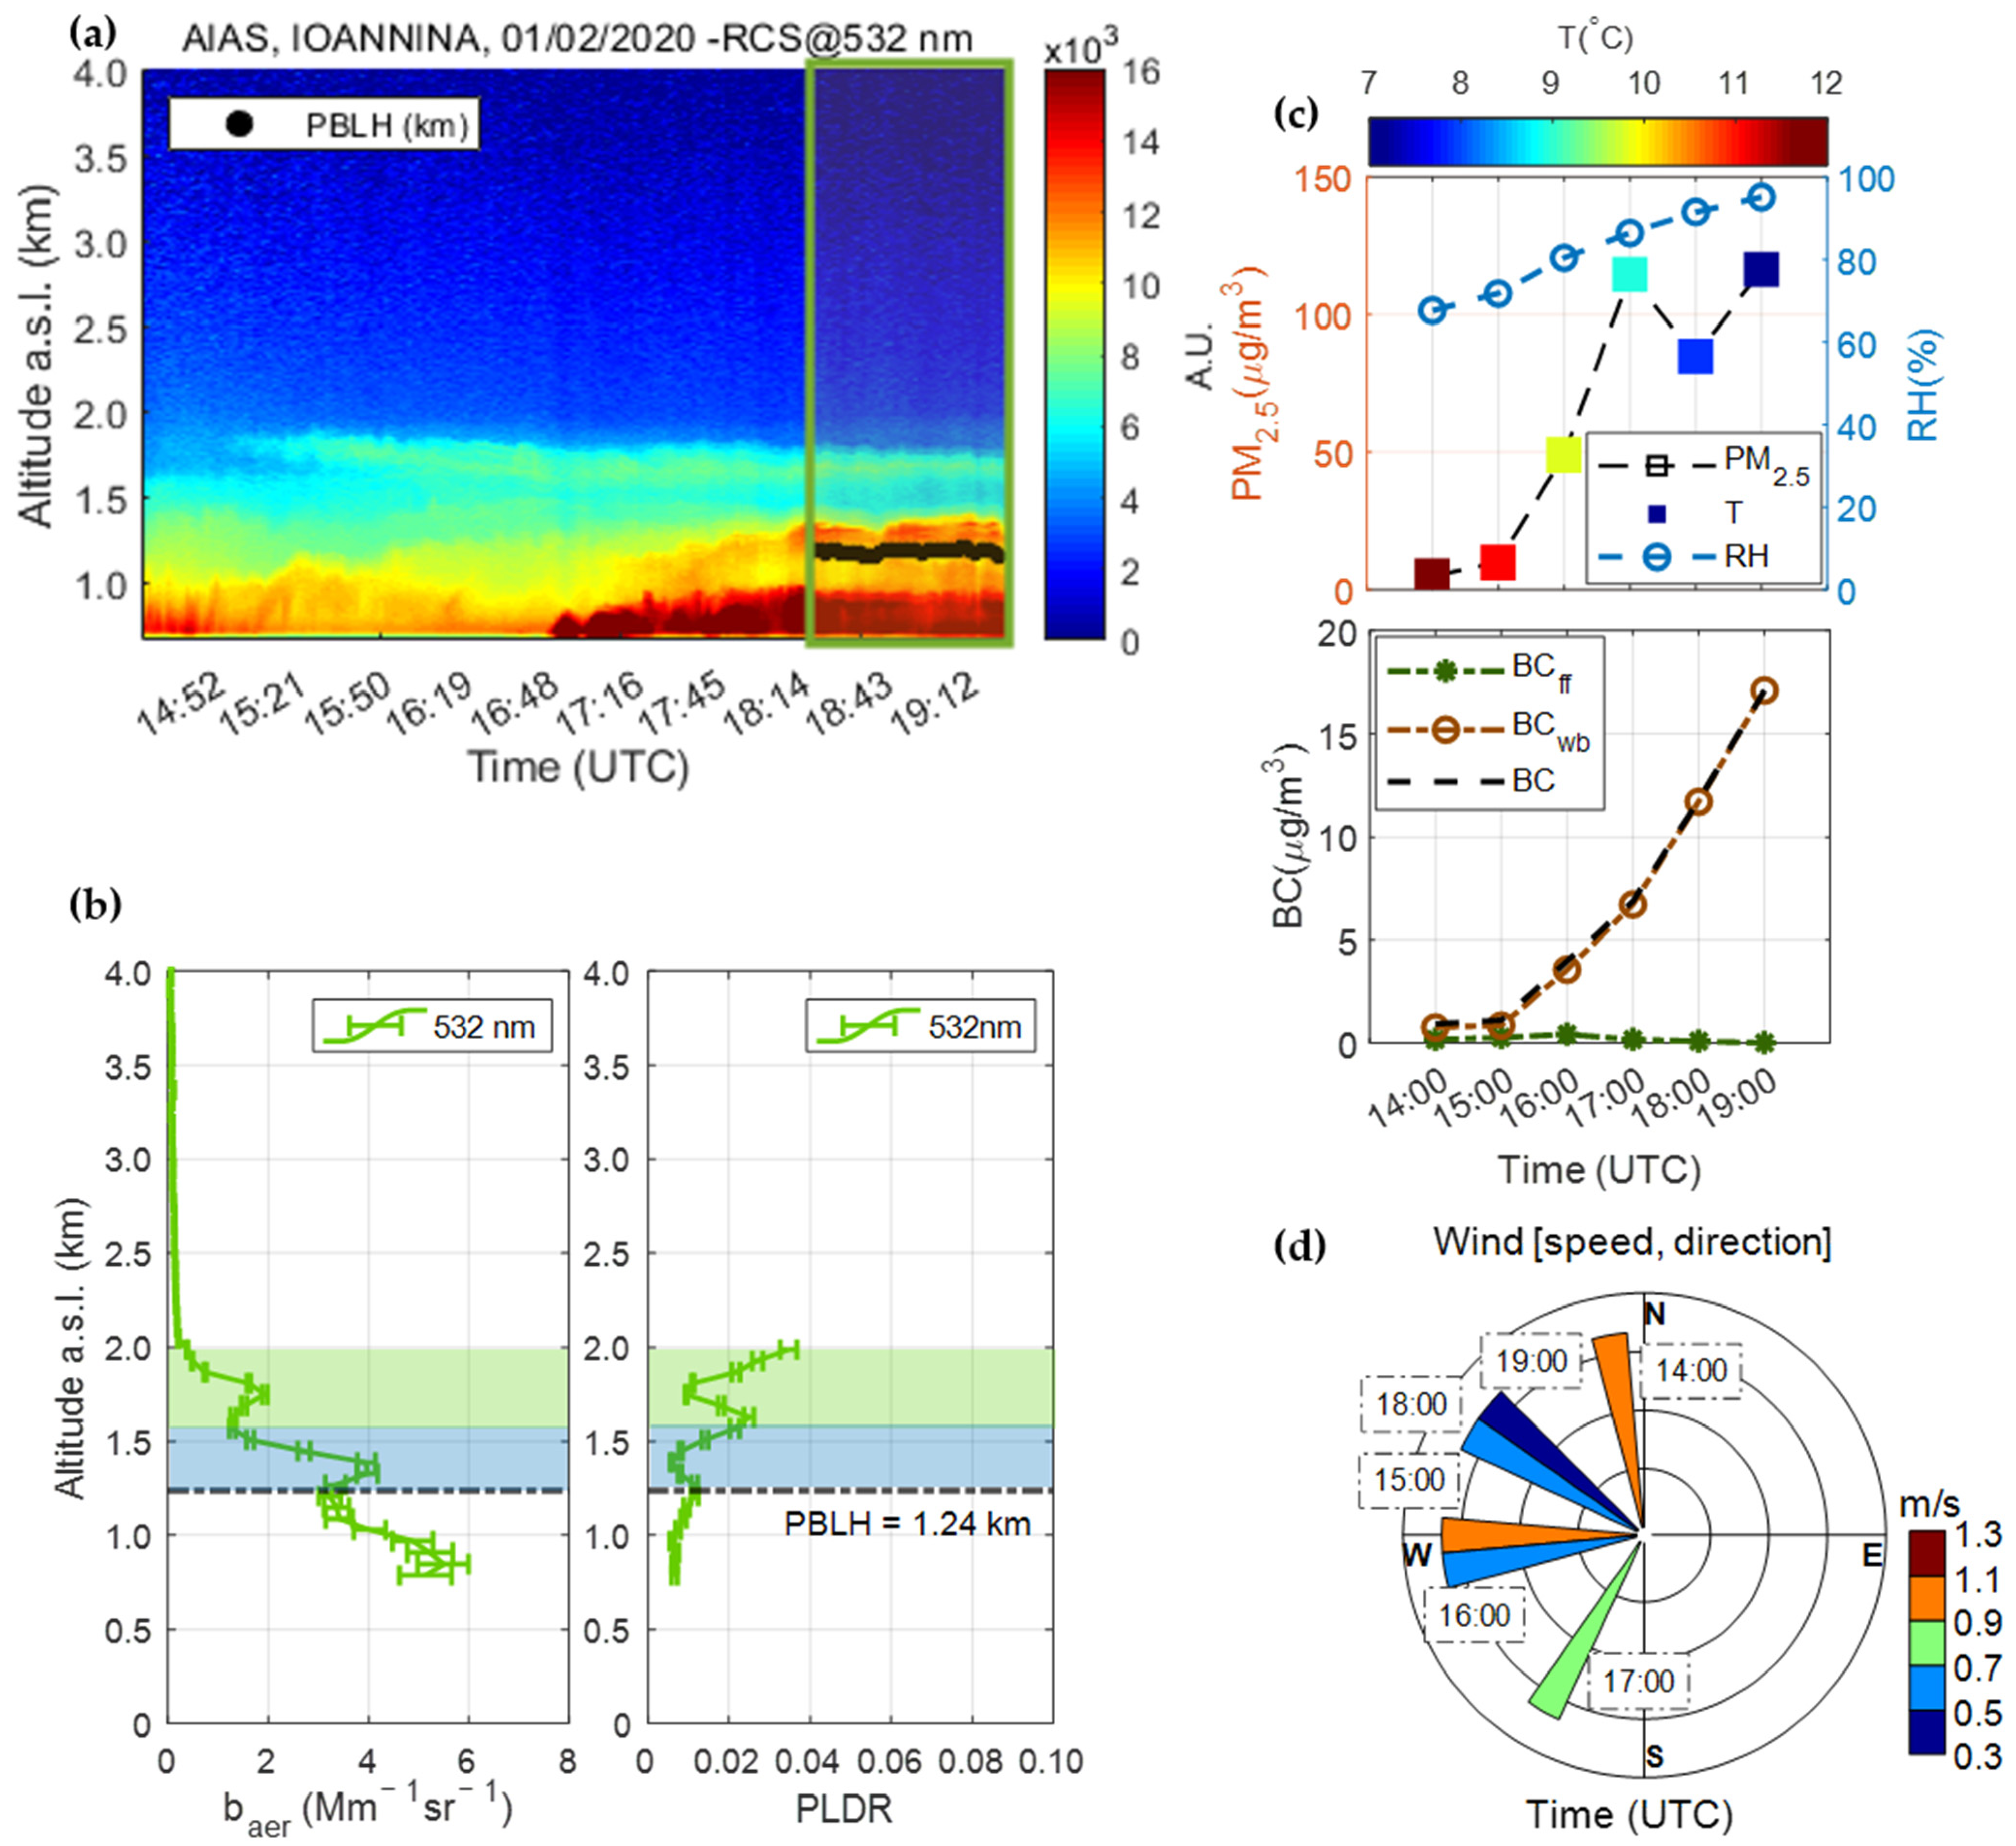
3.1.2. Local Biomass Burning Aerosol: Case II

Τhe second case of local BB emissions is shown in Figure 7, where we present the spatio-temporal evolution of the range-corrected lidar signals at 532 nm (as in Figure 6a) from 0.52 up to 4 km height a.s.l., on 1 February 2020, between 14:32 to 19:31 UTC. In this Figure we can observe the spatio-temporal evolution of the PBLH denoted by the black dots, showing a shallow PBL confined from ground up to 1.24 km a.s.l. with a high aerosol load. Over the PBL a distinct aerosol layer (with yellow-brownish color topped by a light blue-yellowish thin layer) centered at ~1.39 km height extending up to 2 km height. We selected to further analyze the lidar data obtained from 18:29 to 19:31 UTC (within the green-colored rectangle, Figure 7a).
The corresponding aerosol optical properties within the selected time-range were retrieved again by the SCC and are shown in Figure 7b; for two FT layers: the first between 1.24 and 1.57 km height a.s.l. (light blue shadowed rectangle) and the second (green shadowed rectangle) from 1.57 to 2.04 km height a.s.l. and inside the PBL. In the FT region the mean baer was found equal to 2.87 ± 1.06 and 0.80 ± 0.25 Mm−1sr−1, for the light blue and green layer, while the relevant mean PLDR values were 0.01 ± 0.01 and 0.03 ± 0.02, respectively. Inside the PBL the mean value of baer was found equal to 4.23 ± 0.94 Mm−1sr−1, and the corresponding mean PLDR value was very low again, equal to 0.01 ± 0.01. All values of PLDR measured inside the PBL and the FT. During the lidar measurement time on that day the PM2.5 concentrations ranged from 4.9 to 116.4 μg/m3 inside the PBL, showing again the presence of local aerosol emissions, especially during the cold (~8°C) evening hours (17:00–19:00 UTC) with high (~91%) RH values (Figure 7c-upper graph) and wind speed ranging from 0.3 to 0.9 m/s, while its direction changed from South to North-Northwest. During these evening hours, the total BC concentrations increased from 0.9 to 17.1 μg/m3 and the corresponding BCwb concentrations showed a very similar growth rate and contribution reaching up to 100% of the total BC, thus proving that the aerosol source is again the local BB activities. During the whole measurement period the BCff remained extremely low (0.1–0.4 μg/m3), showing no contribution from other local aerosol sources than the BB ones. During same hours, the PM2.5 concentrations were found ranging from 5.0 to 116.4 μg/m3.
Figure 7. (a) Spatio-temporal evolution of the range-corrected signal at 532 nm, (b) the vertical distribution of baer (Mm−1sr−1) and PLDR at 532 nm, as observed by the AIAS mobile lidar on 1 February 2020 between 14:32 and 19:31 UTC over the city of Ioannina. The 2-colored-shadowed rectangle represent the geometrical boundaries of the studied aerosol layers. The black dashed line represents the mean PBLH. (c) Upper graph: Temporal evolution of the PM2.5 mass concentration (μg/m3), versus T (°C), and RH (%); lower graph: BC mass concentrations (μg/m3) at ground level, along with the contribution of the fossil fuel (BCff) and wood burning (BCwb) activities to the total BC concentrations. (d) The wind speed and direction (hourly mean), during the measurement time.
Atmosphere 13 00094 g007

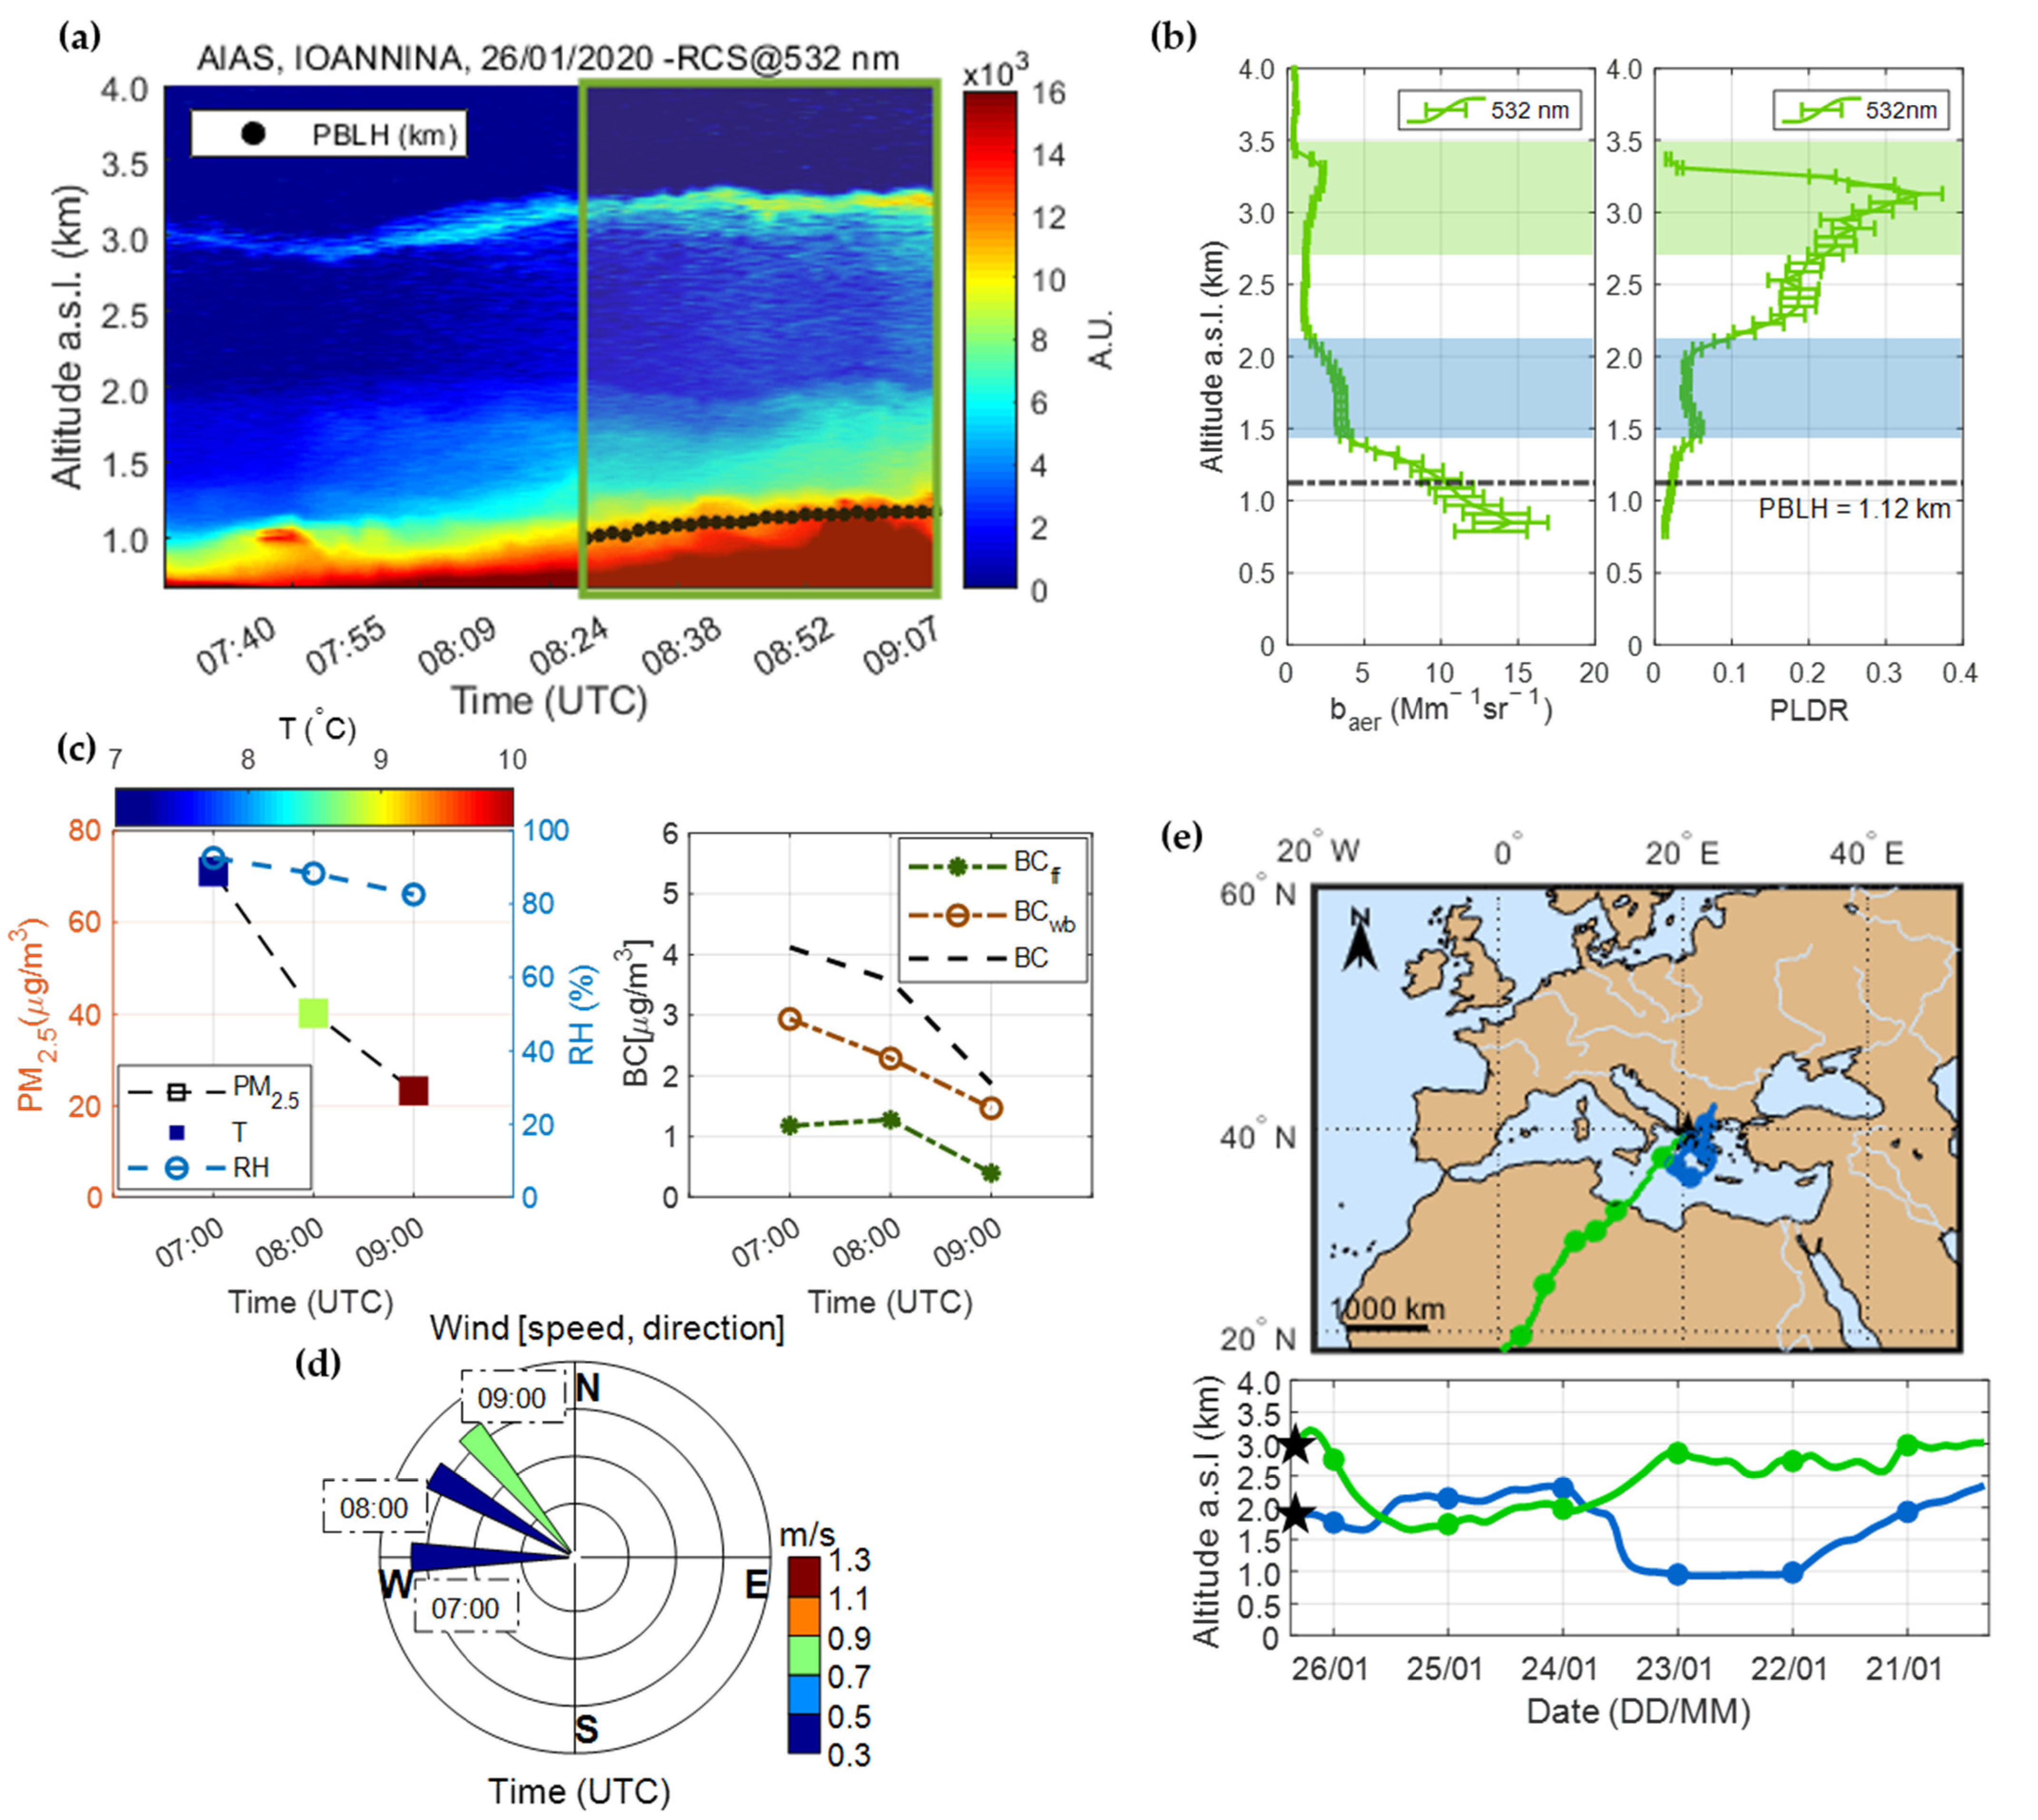
3.1.3. Dust Aerosol Mixtures

The third case concerns a long-range transport of dust aerosols over the measuring site. In Figure 8a we present the spatio-temporal evolution of the range-corrected lidar signals at 532 nm from 0.52 up to 4 km height a.s.l., on 26 January 2020 (07:28–09:07 UTC). The PBLH (denoted by the black dots) at ~1.12 km a.s.l. can also be seen. Over the PBL we clearly see an aerosol layer extending from the top of the PBL up to ~2.34 km height and a filamented one at ~3.10 km height. We selected to analyze the aerosol data obtained in the time period from 08:29 to 09:04 UTC, (green rectangle; Figure 8a). The vertical profile of the aerosol optical properties (baer, PLDR) retrieved by the SCC is shown in Figure 8b. In this figure we have selected two different layer stratifications over the PBL (mean PBLH equal to 1.12 km a.s.l.) denoted by two colors: the first one (blue shadowed rectangle) located between 1.45 and 2.34 km and the second one (green shadowed rectangle) from 2.71 to 3.49 km a.s.l.
In Figure 8e we present the backward air mass trajectories ending after 144 h over the city of Ioannina at 08:00 UTC on 26 January, at the two heights where the aerosol layers were observed. Based on the results of the HYSPLIT model (Figure 8e) we see that the air mass (green colored trajectory) left the African continent on 25 January, having remained over Libya, at 2–3 km height, for more than 112 h, and thus being enriched with dust particles, which finally arrived over Ioannina at the level of the second layer above the PBL. According to HYSPLIT, the air mass (blue colored trajectory) arriving at the first layer above the PBL originated and travelled over not remotely located areas, i.e., Southern Greece and the Ionian Sea and thus being enriched with marine and local produced aerosols. Regarding the properties of that layer (blue colored) we measured a mean baer value of 2.59 ± 1.03 Mm−1sr−1 and a mean PLDR value of 0.08 ± 0.05. Inside the second layer we found a mean baer value of 1.50 ± 0.59 Mm−1sr−1 and a mean PLDR value of 0.20 ± 0.10. The PLDR value obtained between 2.71–3.48 km height a.s.l. can be attributed to dust aerosol mixtures that as indicated by HYSPLIT trajectories can enriched the air mass on the way to Greece. Such PLDR values are in accordance with previous studies on dust aerosols and dust mixtures [14,26,30,53,54,55,63,64,65,66,67].
During this case, the PM2.5 concentrations were still high (between 23.3 and 71.1 μg/m3) with temperature variations, at ground level, between 7.2–10.1°C, and RH values equal to 88 ± 5%. The wind speed for the measurement time ranged from 0.3 to 0.7 m/s, with North-Northwest direction. The BC levels were found ranging in much lower levers, from 1.9 to 4.1 μg/m3. In contrast to the previous case studies, the PM2.5 and BC concentrations were decreasing from 07:00 to 09:00 UTC in line with the increasing T and the expanding PBL, leading to vertical mixing of particles accumulated within the surface and lower PBL. In this case, the BCwb (1.5 to 2.9 μg/m3) contribution to the total BC concentrations (~64.1–78.6%) was strongly differentiated from the previous two case studies. On the other hand, the BCff contribution to the total BC concentrations was much higher compared to other days (21.4–35.9%), indicating a much more important presence of fossil fuel burning activity during that day.

4. Conclusions

During the PANACEA winter campaign (10 January–7 February 2020) the AIAS mobile depolarization lidar was placed in the city of Ioannina at 500 m a.s.l, which during cold winter days is characterized by extremely high (highest all over Greece) concentrations of fine carbonaceous aerosols from BB. The aim was to study the spatio-temporal evolution of the fresh BB aerosols within the PBL and LFT. In this study, we analyzed 17 cases as they have been observed by AIAS, complemented with in situ (PM2.5, BC, BCff, and BCwb) and meteorological (T, RH, wind speed, and direction) data.
In total, 33 out of 34 aerosol layers observed in the LFT were characterized as BB of local origin. These layers showed mean baer (532 nm) values of 1.45 ± 0.43 Mm−1sr−1 (from 0.37 ± 0.11 to 2.91 ± 0.91 Mm−1sr−1), with a mean PLDR (532 nm) value of 0.04 ± 0.02 (from 0.01 to 0.09), at altitudes between 1.21 and 2.23 km a.s.l. There was a single case observed on 26 January 2020, attributed to dust with a mean baer value equal to 1.50 ± 0.59 Mm−1sr−1, and a mean PLDR of 0.20 ± 0.10, in the altitude range from 2.71 to 3.49 km. The PBLH during the campaign ranged from 1.02 to 1.31 km, with a mean value of 1.13 ± 0.07 km, within it the mean baer value was found equal to 4.61 ± 2.88 Mm−1sr−1 (from 2.03 ± 0.74 to 12.19 ± 1.66 Mm−1sr−1), with the PLDR value ranging between 0.01 ± 0.01 and 0.03 ± 0.01, indicating a strong presence of fresh BB aerosols, which is intensified within a shallow PBL by extensive residential heating during cold and calm conditions.
At ground level, the PM2.5 mass concentrations ranged from 5.6 to 175.7 μg/m3, while the T and RH ranged from 3.7 to 11.1 °C and 34 to 93%, respectively. Wind speed presented extremely low values (0.33 to 1.16 m/s), contributing to increased BC concentrations, due to air mass stagnant conditions. The BC presented a mean value of 6.6 ± 5.0 μg/m3 (from 0.8 to 17.5 μg/m3), while the wood burning emissions from residential heating, were increasing during the evening hours and decreasing temperatures. The BCwb concentrations ranged from 0.5 to 17.5 μg/m3, with an extremely high a mean BCwb to BC contribution of 85.4%, which in some cases during night-time reached up to 100%. The diurnal pattern of the BC was following almost identically the variation of BCwb. This could be attributed to the almost constant meteorological conditions prevailed during the campaign period and the high amount of wood burning activities which did not allow us to record significant fingerprints of any other anthropogenic-industrial activity. The only exception in the above statement is the small increase in BCff during North prevailing winds.
Overall, our study showed that the BCwb to the BC values in Ioannina were very high, and exacerbated by the shallow PBL and the stagnant air conditions during cold winter days. Τhe corresponding locally produced BB aerosol layers presented extremely low PLDR values inside the PBL (0.02 ± 0.01) and in the FT (0.04 ± 0.02). The results of this work can be used in different modelling schemes to forecast severe air pollution episodes in the city of Ioannina and to provide tools to the Greek authorities to reduce the air pollution levels of the city.

Author Contributions

Conceptualization, A.P.; methodology, A.P. and C.-A.P.; lidar measurements, C.-A.P., R.F. and A.P.; data analysis, C.-A.P.; investigation, C.-A.P. and A.P.; PM2.5, BC, and the meteorological data, E.L., I.S., N.H. and M.G.; writing—original draft preparation, C.-A.P.; review and editing, A.P., M.M., P.K., E.L., O.S., N.H., M.G., E.K. and D.A., visualization, C.-A.P.; supervision, A.P. All authors have read and agreed to the published version of the manuscript.

Funding

This research was funded by the PANhellenic infrastructure for Atmospheric Composition and climatE change (PANACEA) research project (MIS 5021516), implemented under the Action Reinforcement of the Research and Innovation Infrastructure, and the Operational Program Competitiveness, Entrepreneurship, and Innovation (NSRF 2014–2020), co-financed by Greece and the European Union (European Regional Development Fund).

Institutional Review Board Statement

Not applicable.

Acknowledgments

We acknowledge support of this work by the project “PANhellenic infrastructure for Atmospheric Composition and climatE change” (MIS 5021516), which is implemented under the Action “Reinforcement of the Research and Innovation Infrastructure”, funded by the Operational Programme “Competitiveness, Entrepreneurship and Innovation” (NSRF 2014–2020) and co-financed by Greece and the European Union (European Regional Development Fund). The Biomedical Research Foundation of the Academy of Athens (BRFAA) is acknowledged for the provision of its mobile platform to host the NTUA AIAS lidar system. The authors gratefully acknowledge the NOAA Air Resources Laboratory (ARL) for the provision of the HYSPLIT transport and dispersion model and/or READY website (https://www.ready.noaa.gov, accessed on 10 December 2020) used in this publication.

Conflicts of Interest

The authors declare no conflict of interest.

Appendix A

Figure A1. The terrain Google Earth map of the Ioannina basin showing the city and the and the surrounding mountains, along with their names and top’s height.
Atmosphere 13 00094 g0a1
Table A1. Date, time, and mean height of the aerosol layers (ALH; grey shadowed cells represent the PBLH and mean values inside the PBL), mean baer, and PLDR at 532 nm inside the aerosol layers, as observed by the AIAS lidar system, during the PANACEA winter campaign.
DateTimeALHbaerPLDR
(DD/MM)(UTC)(km)(Mm−1sr−1)
10/0119:00–19:301.073.38 ± 1.700.01 ± 0.01
1.21 ± 0.121.52 ± 0.160.02 ± 0.01
1.36 ± 0.151.12 ± 0.310.01 ± 0.01
1.75 ± 0.240.37 ± 0.110.02 ± 0.01
13/0114:27–15:041.092.59 ± 0.570.01 ± 0.01
1.42 ± 0.331.12 ± 0.300.02 ± 0.01
2.05 ± 0.180.73 ± 0.180.03 ± 0.01
13/0116:59–17:311.072.03 ± 0.740.01 ± 0.01
1.36 ± 0.211.02 ± 0.090.03 ± 0.01
1.96 ± 0.150.69 ± 0.080.04 ± 0.01
2.23 ± 0.120.48 ± 0.040.06 ± 0.01
17/0116:14–16:471.153.14 ± 1.440.03 ± 0.01
1.21 ± 0.061.77 ± 0.220.05 ± 0.02
1.42 ± 0.151.82 ± 0.310.04 ± 0.01
18/0115:00–15:401.203.88 ± 0.960.02 ± 0.01
1.78 ± 0.271.53 ± 0.620.05 ± 0.02
19/0113:03–13:401.189.43 ± 3.670.02 ± 0.01
1.54 ± 0.332.68 ± 1.040.05 ± 0.02
2.05 ± 0.181.02 ± 0.300.09 ± 0.03
20/0115:04–15:371.085.11 ± 1.780.02 ± 0.01
1.51 ± 0.181.71 ± 0.260.04 ± 0.01
2.08 ± 0.331.46 ± 0.710.06 ± 0.03
20/0118:49–19:191.096.05 ± 0.910.02 ± 0.01
1.72 ± 0.391.93 ± 1.070.06 ± 0.02
21/0115:29–16:021.025.76 ± 2/720.02 ± 0.01
1.33 ± 0.181.91 ± 0.400.04 ± 0.01
1.66 ± 0.151.02 ± 0.230.05 ± 0.01
22/0114:39–15:411.057.96 ± 1.890.02 ± 0.01
1.36 ± 0.212.91 ± 0.910.04 ± 0.01
1.66 ± 0.091.29 ± 0.180.05 ± 0.01
1.87 ± 0.120.80 ± 0.250.06 ± 0.02
26/0108:29–09:041.1212.19 ± 1.660.02 ± 0.01
1.89 ± 0.282.59 ± 1.030.08 ± 0.05
3.10 ± 0.251.50 ± 0.590.20 ± 0.10
31/0113:30–14:051.182.34 ± 0.500.01 ± 0.01
1.69 ± 0.481.38 ± 0.460.02 ± 0.01
31/0118:39–19:211.313.20 ± 0.500.01 ± 0.01
1.75 ± 0.362.09 ± 1.390.03 ± 0.01
01/0215:28–16:021.132.44 ± 0.400.01 ± 0.01
1.42 ± 0.151.13 ± 0.170.02 ± 0.01
1.90 ± 0.150.72 ± 0.390.03 ± 0.02
01/0218:29–19:311.244.23 ± 0.940.01 ± 0.01
1.39 ± 0.182.87 ± 1.060.01 ± 0.01
1.81 ± 0.241.05 ± 0.610.03 ± 0.02
02/0215:19–15:451.112.16 ± 0.490.01 ± 0.01
1.45 ± 0.121.09 ± 0.070.02 ± 0.01
1.75 ± 0.180.92 ± 0.090.02 ± 0.01
2.14 ± 0.210.62 ± 0.280.03 ± 0.02
03/0216:00–16:361.192.52 ± 0.460.01 ± 0.01
1.36 ± 0.151.86 ± 0.250.02 ± 0.01
1.81 ± 0.301.18 ± 0.480.02 ± 0.01
Table A2. Hourly averaged data of PM2.5 and BC, along with the meteorological parameters (T, RH, wind speed, and direction), during the PANACEA winter campaign in Ioannina. All data presented are averaged for the same time periods during which the lidar profiles were retrieved.
DateTimePM2.5BCBCwbBCffTRHWind SpeedWind Direction
(DD/M)(UTC)(μg/m3)(μg/m3)(μg/m3)(μg/m3)(°C)(%)(m/s)(°)
10/0119:00–20:00205.917.517.50.03.7650.3187.8
13/0114:00–15:0041.63.73.50.29.8580.956.4
13/0117:00–18:00140.412.711.61.16.0750.378.3
17/0116:00–17:0063.35.95.20.79.8340.9141.2
18/0115:00–16:0050.42.21.50.78.3710.5104.1
19/0113:00–14:0046.62.12.00.18.6610.5116.0
20/0115:00–16:0065.53.92.81.18.6620.994.1
20/0118:00–20:00137.110.710.30.44.0820.6202.1
21/0115:00–16:0096.79.88.90.96.8480.6101.2
22/0114:00–16:00106.77.76.51.29.1450.7106.7
26/0108:00–09:0055.43.62.31.38.8880.3194.8
31/0113:00–14:006.70.80.50.310.1590.897.9
31/0118:00–19:00104.510.310.00.35.6860.8185.2
01/0215:00–16:0016.12.52.20.311.1721.236.3
01/0218:00–20:00145.514.414.40.07.5930.7213.1
02/0216:00–17:0011.11.00.60.311.1730.8125.5
03/0216:00–17:0052.13.82.71.110.6810.864.5
Figure A2. Time series analysis of BC, BCwb, BCff, and PM2.5 concentration (μg/m3) for the period 10 January 2020–3 February 2020 in Ioannina city.
Atmosphere 13 00094 g0a2
Figure A3. Correlation graphs between: (a) BCff and PM2.5, (b) BCff and T, and, finally, (c) BCff and BC.
Atmosphere 13 00094 g0a3

References

  1. Nepomuceno Pereira, S.; Preißler, J.; Guerrero-Rascado, J.L.; Silva, A.M.; Wagner, F. Forest fire smoke layers observed in the free troposphere over Portugal with a multiwavelength Raman lidar: Optical and microphysical properties. Sci. World J. 2014, 2014, 421838. [Google Scholar] [CrossRef] [PubMed]
  2. Diapouli, E.; Kalogridis, A.C.; Markantonaki, C.; Vratolis, S.; Fetfatzis, P.; Colombi, C.; Eleftheriadis, K. Annual variability of black carbon concentrations originating from biomass and fossil fuel combustion for the suburban aerosol in Athens, Greece. Atmosphere 2017, 8, 234. [Google Scholar] [CrossRef] [Green Version]
  3. Liakakou, E.; Stavroulas, I.; Kaskaoutis, D.G.; Grivas, G.; Paraskevopoulou, D. Long-term variability, source apportionment and spectral properties of black carbon at an urban background site in Athens, Greece. Atmos. Environ. 2020, 222, 117137. [Google Scholar] [CrossRef]
  4. Klimont, Z.; Kupiainen, K.; Heyes, C.; Purohit, P.; Cofala, J.; Rafaj, P.; Borken-Kleefeld, J.; Schöpp, W. Global anthropogenic emissions of particulate matter including black carbon. Atmos. Chem. Phys. 2017, 17, 8681–8723. [Google Scholar] [CrossRef] [Green Version]
  5. Sarigiannis, D.A.; Karakitsios, S.P.; Kermenidou, M.; Nikolaki, S.; Zikopoulos, D.; Semelidis, S.; Papagiannakis, A.; Tzimou, R. Total exposure to airborne particulate matter in cities: The effect of biomass combustion. Sci. Total Environ. 2014, 493, 795–805. [Google Scholar] [CrossRef]
  6. Fameli, K.-M.; Assimakopoulos, V.D. The new open Flexible Emission Inventory for Greece and the Greater Athens Area (FEI-GREGAA): Account of pollutant sources and their importance from 2006 to 2012. Atmos. Environ. 2016, 137, 17–37. [Google Scholar] [CrossRef]
  7. Fourtziou, L.; Liakakou, E.; Stavroulas, I.; Theodosi, C.; Zarmpas, P.; Psiloglou, B.; Sciare, J.; Maggos, T.; Bairachtari, K.; Bougiatioti, A.; et al. Multi-tracer approach to characterize domestic wood burning in Athens (Greece) during wintertime. Atmos. Environ. 2017, 148, 89–101. [Google Scholar] [CrossRef]
  8. Gratsea, M.; Liakakou, E.; Mihalopoulos, N.; Adamopoulos, A.; Tsilibari, E.; Gerasopoulos, E. The combined effect of reduced fossil fuel consumption and increasing biomass combustion on Athens’ air quality, as inferred from long term CO measurements. Sci. Total Environ. 2017, 592, 115–123. [Google Scholar] [CrossRef]
  9. Athanasopoulou, E.; Speyer, O.; Brunner, D.; Vogel, H.; Vogel, B.; Mihalopoulos, N.; Gerasopoulos, E. Changes in domestic heating fuel use in Greece: Effects on atmospheric chemistry and radiation. Atmos. Chem. Phys. 2017, 17, 10597–10618. [Google Scholar] [CrossRef] [Green Version]
  10. Kassomenos, P.A.; Sindosi, O.A.; Lolis, C.J.; Chaloulakou, A. On the relation between seasonal synoptic circulation types and spatial air quality characteristics in Athens, Greece. J. Air Waste Manag. Assoc. 2003, 53, 309–324. [Google Scholar] [CrossRef] [Green Version]
  11. Sindosi, O.A.; Katsoulis, B.D.; Bartzokas, A. An objective definition of air mass types affecting athens, greece; The corresponding atmospheric pressure patterns and air pollution levels. Environ. Technol. 2003, 24, 947–962. [Google Scholar] [CrossRef]
  12. Sindosi, O.; Markozannes, G.; Rizos, E.; Ntzani, E. Effects of economic crisis on air quality in Ioannina, Greece. J. Environ. Sci. Health -Part A Toxic/Hazardous Subst. Environ. Eng. 2019, 54, 768–781. [Google Scholar] [CrossRef]
  13. Sindosi, O.A.; Hatzianastassiou, N. PM 10 Concentrations in a Provincial City of Inland Greece in the Times of Austerity and Their Relationship with Meteorological and Socioeconomic Conditions. Water Air Soil Pollut. 2021, 232, 77. [Google Scholar] [CrossRef]
  14. Mylonaki, M.; Papayannis, A.; Papanikolaou, C.-A.; Foskinis, R.; Soupiona, O.; Maroufidis, G.; Anagnou, D.; Kralli, E. Tropospheric vertical profiling of the aerosol backscatter coefficient and the particle linear depolarization ratio for different aerosol mixtures during the PANACEA campaign in July 2019 at Volos, Greece. Atmos. Environ. 2021, 247, 118184. [Google Scholar] [CrossRef]
  15. Kaskaoutis, D.G.; Grivas, G.; Theodosi, C.; Tsagkaraki, M.; Paraskevopoulou, D.; Stavroulas, I.; Liakakou, E.; Gkikas, A.; Hatzianastassiou, N.; Wu, C.; et al. Carbonaceous aerosols in contrasting atmospheric environments in Greek cities: Evaluation of the EC-tracer methods for secondary organic carbon estimation. Atmosphere 2020, 11, 161. [Google Scholar] [CrossRef] [Green Version]
  16. Papayannis, A.; Kokkalis, P.; Mylonaki, M.; Soupiona, R.; Papanikolaou, C.A.; Foskinis, R. Recent upgrades of the EOLE and AIAS lidar systems of the National Technical University of Athens operating since 2000 in Athens, Greece. EPJ Web Conf. 2020, 237, 4–7. [Google Scholar] [CrossRef]
  17. D’Amico, G.; Amodeo, A.; Baars, H.; Binietoglou, I.; Freudenthaler, V.; Mattis, I.; Wandinger, U.; Pappalardo, G. EARLINET Single Calculus Chain-overview on methodology and strategy. Atmos. Meas. Tech. 2015, 8, 4891–4916. [Google Scholar] [CrossRef] [Green Version]
  18. Mattis, I.; D’Amico, G.; Baars, H.; Amodeo, A.; Madonna, F.; Iarlori, M. EARLINET Single Calculus Chain-Technical-Part 2: Calculation of optical products. Atmos. Meas. Tech. 2016, 9, 3009–3029. [Google Scholar] [CrossRef] [Green Version]
  19. Belegante, L.; Antonio Bravo-Aranda, J.; Freudenthaler, V.; Nicolae, D.; Nemuc, A.; Ene, D.; Alados-Arboledas, L.; Amodeo, A.; Pappalardo, G.; D’Amico, G.; et al. Experimental techniques for the calibration of lidar depolarization channels in EARLINET. Atmos. Meas. Tech. 2018, 11, 1119–1141. [Google Scholar] [CrossRef] [Green Version]
  20. Freudenthaler, V. About the effects of polarising optics on lidar signals and the Δ90 calibration. Atmos. Meas. Tech. 2016, 9, 4181–4255. [Google Scholar] [CrossRef] [Green Version]
  21. D’Amico, G.; Amodeo, A.; Mattis, I.; Freudenthaler, V.; Pappalardo, G. EARLINET Single Calculus Chain-technical andndash; Part 1: Pre-processing of raw lidar data. Atmos. Meas. Tech. 2016, 9, 491–507. [Google Scholar] [CrossRef] [Green Version]
  22. Klett, J.D. Stable analytical inversion solution for processing lidar returns. Appl. Opt. 1981, 20, 211. [Google Scholar] [CrossRef] [Green Version]
  23. Klett, J.D. Lidar inversion with variable backscatter/extinction ratios. Appl. Opt. 1985, 24, 1638–1643. [Google Scholar] [CrossRef]
  24. Papayannis, A.; Amiridis, V.; Mona, L.; Tsaknakis, G.; Balis, D.; Bo, J. Systematic lidar observations of Saharan dust over Europe in the frame of EARLINET (2000–2002). J. Geophys. Res.: Atmos. 2008, 113. [Google Scholar] [CrossRef] [Green Version]
  25. Groß, S.; Esselborn, M.; Weinzierl, B.; Wirth, M.; Fix, A.; Petzold, A. Aerosol classification by airborne high spectral resolution lidar observations. Atmos. Chem. Phys. 2013, 13, 2487–2505. [Google Scholar] [CrossRef] [Green Version]
  26. Burton, S.P.; Ferrare, R.A.; Vaughan, M.A.; Omar, A.H.; Rogers, R.R.; Hostetler, C.A.; Hair, J.W. Aerosol classification from airborne HSRL and comparisons with the CALIPSO vertical feature mask. Atmos. Meas. Tech. 2013, 6, 1397–1412. [Google Scholar] [CrossRef] [Green Version]
  27. Murayama, T.; Müller, D.; Wada, K.; Shimizu, A.; Sekiguchi, M.; Tsukamoto, T. Characterization of Asian dust and Siberian smoke with multi-wavelength Raman lidar over Tokyo, Japan in spring 2003. Geophys. Res. Lett. 2004, 31, 1–5. [Google Scholar] [CrossRef] [Green Version]
  28. Balis, D.S.; Amiridis, V.; Zerefos, C.; Gerasopoulos, E.; Andreae, M.; Zanis, P.; Kazantzidis, A.; Kazadzis, S.; Papayannis, A. Raman lidar and sunphotometric measurements of aerosol optical properties over Thessaloniki, Greece during a biomass burning episode. Atmos. Environ. 2003, 37, 4529–4538. [Google Scholar] [CrossRef]
  29. Müller, D. Indo-Asian pollution during INDOEX: Microphysical particle properties and single-scattering albedo inferred from multiwavelength lidar observations. J. Geophys. Res. 2003, 108, 4600. [Google Scholar] [CrossRef]
  30. Burton, S.P.; Ferrare, R.A.; Hostetler, C.A.; Hair, J.W.; Rogers, R.R.; Obland, M.D.; Butler, C.F.; Cook, A.L.; Harper, D.B.; Froyd, K.D. Aerosol classification using airborne High Spectral Resolution Lidar measurements-methodology and examples. Atmos. Meas. Tech. 2012, 5, 73–98. [Google Scholar] [CrossRef] [Green Version]
  31. Nicolae, D.; Nemuc, A.; Müller, D.; Talianu, C.; Vasilescu, J.; Belegante, L.; Kolgotin, A. Characterization of fresh and aged biomass burning events using multiwavelength Raman lidar and mass spectrometry. J. Geophys. Res. Atmos. 2013, 118, 2956–2965. [Google Scholar] [CrossRef]
  32. Groß, S.; Tesche, M.; Freudenthaler, V.; Toledano, C.; Wiegner, M.; Ansmann, A.; Althausen, D.; Seefeldner, M. Characterization of Saharan dust, marine aerosols and mixtures of biomass-burning aerosols and dust by means of multi-wavelength depolarization and Raman lidar measurements during SAMUM 2. Tellus Ser. B Chem. Phys. Meteorol. 2011, 63, 706–724. [Google Scholar] [CrossRef]
  33. Soupiona, O.; Papayannis, A.; Kokkalis, P.; Foskinis, R.; Sánchez Hernández, G.; Ortiz-Amezcua, P.; Mylonaki, M.; Papanikolaou, C.-A.; Papagiannopoulos, N.; Samaras, S.; et al. Saharan dust intrusions over the northern Mediterranean region in the frame of EARLINET (2014–2017): Properties and impact in radiative forcing. Atmos. Chem. Phys. Discuss. 2020, 2020, 1–22. [Google Scholar] [CrossRef]
  34. Sicard, M.; Barragan, R.; Dulac, F.; Alados-Arboledas, L.; Mallet, M. Aerosol optical, microphysical and radiative properties at regional background insular sites in the western Mediterranean. Atmos. Chem. Phys. 2016, 16, 12177–12203. [Google Scholar] [CrossRef] [Green Version]
  35. Stull, R.B. Boundary Layer Meteorology. An Introduction to Boundary Layer Meteorology; Springer Science & Business Media: Berlin/Heidelberg, Germany, 1988. [Google Scholar]
  36. Papanastasiou, D.K.; Melas, D. Statistical characteristics of ozone and PM 10 levels in a medium-sized Mediterranean city. Int. J. Environ. Pollut. 2009, 36, 127–138. [Google Scholar] [CrossRef]
  37. Emeis, S.; Schäfer, K. Remote sensing methods to investigate boundary-layer structures relevant to air pollution in cities. Bound. -Layer Meteorol. 2006, 121, 377–385. [Google Scholar] [CrossRef]
  38. Su, T.; Li, Z.; Kahn, R. Relationships between the planetary boundary layer height and surface pollutants derived from lidar observations over China: Regional pattern and influencing factors. Atmos. Chem. Phys. 2018, 18, 15921–15935. [Google Scholar] [CrossRef] [Green Version]
  39. Kokkalis, P.; Alexiou, D.; Papayannis, A.; Rocadenbosch, F.; Soupiona, O.; Raptis, P.I.; Mylonaki, M.; Tzanis, C.G.; Christodoulakis, J. Application and Testing of the Extended-Kalman-Filtering Technique for Determining the Planetary Boundary-Layer Height over Athens, Greece. Bound. -Layer Meteorol. 2020, 176, 125–147. [Google Scholar] [CrossRef]
  40. Stein, A.F.; Draxler, R.R.; Rolph, G.D.; Stunder, B.J.B.; Cohen, M.D.; Ngan, F. Noaa’s hysplit atmospheric transport and dispersion modeling system. Bull. Am. Meteorol. Soc. 2015, 96, 2059–2077. [Google Scholar] [CrossRef]
  41. Giglio, L.; Schroeder, W.; Justice, C.O. The collection 6 MODIS active fire detection algorithm and fire products. Remote Sens. Environ. 2016, 178, 31–41. [Google Scholar] [CrossRef] [Green Version]
  42. Stavroulas, I.; Grivas, G.; Michalopoulos, P.; Liakakou, E.; Bougiatioti, A.; Kalkavouras, P.; Fameli, K.M.; Hatzianastassiou, N.; Mihalopoulos, N.; Gerasopoulos, E. Field evaluation of low-cost PM sensors (Purple Air PA-II) Under variable urban air quality conditions, in Greece. Atmosphere 2020, 11, 926. [Google Scholar] [CrossRef]
  43. Kosmopoulos, G.; Salamalikis, V.; Pandis, S.N.; Yannopoulos, P.; Bloutsos, A.A.; Kazantzidis, A. Low-cost sensors for measuring airborne particulate matter: Field evaluation and calibration at a South-Eastern European site. Sci. Total Environ. 2020, 748, 141396. [Google Scholar] [CrossRef]
  44. Drinovec, L.; Močnik, G.; Zotter, P.; Prévôt, A.S.H.; Ruckstuhl, C.; Coz, E.; Rupakheti, M.; Sciare, J.; Müller, T.; Wiedensohler, A.; et al. The “dual-spot” Aethalometer: An improved measurement of aerosol black carbon with real-time loading compensation. Atmos. Meas. Tech. 2015, 8, 1965–1979. [Google Scholar] [CrossRef] [Green Version]
  45. Sandradewi, J.; Prévôt, A.S.H.; Szidat, S.; Perron, N.; Alfarra, M.R.; Lanz, V.A.; Weingartner, E.; Baltensperger, U. Using aerosol light absorption measurements for the quantitative determination of wood burning and traffic emission contributions to particulate matter. Environ. Sci. Technol. 2008, 42, 3316–3323. [Google Scholar] [CrossRef]
  46. Banks, R.F.; Tiana-Alsina, J.; Baldasano, J.M.; Rocadenbosch, F.; Papayannis, A.; Solomos, S.; Tzanis, C.G. Sensitivity of boundary-layer variables to PBL schemes in the WRF model based on surface meteorological observations, lidar, and radiosondes during the HygrA-CD campaign. Atmos. Res. 2016, 176–177, 185–201. [Google Scholar] [CrossRef]
  47. Amiridis, V.; Giannakaki, E.; Balis, D.S.; Gerasopoulos, E.; Pytharoulis, I.; Zanis, P.; Kazadzis, S.; Melas, D.; Zerefos, C.; Sensing, R. and Physics Smoke injection heights from agricultural burning in Eastern Europe as seen by CALIPSO. Atmos. Chem. Phys. 2010, 10, 11567–11576. [Google Scholar] [CrossRef] [Green Version]
  48. Labonne, M.; Bréon, F.M.; Chevallier, F. Injection height of biomass burning aerosols as seen from a spaceborne lidar. Geophys. Res. Lett. 2007, 34. [Google Scholar] [CrossRef]
  49. Nisantzi, A.; Mamouri, R.E.; Ansmann, A.; Hadjimitsis, D. Injection of mineral dust into the free troposphere during fire events observed with polarization lidar at Limassol, Cyprus. Atmos. Chem. Phys. 2014, 14, 12155–12165. [Google Scholar] [CrossRef] [Green Version]
  50. Stachlewska, I.S.; Samson, M.; Zawadzka, O.; Harenda, K.M.; Janicka, L.; Poczta, P.; Szczepanik, D.; Heese, B.; Wang, D.; Borek, K.; et al. Modification of local urban aerosol properties by long-range transport of biomass burning aerosol. Remote Sens. 2018, 10, 412. [Google Scholar] [CrossRef] [Green Version]
  51. Papanikolaou, C.A.; Giannakaki, E.; Papayannis, A.; Mylonaki, M.; Soupiona, O. Canadian biomass burning aerosol properties modification during a long-ranged event on August 2018. Sensors 2020, 20, 5442. [Google Scholar] [CrossRef]
  52. Burton, S.P.; Hair, J.W.; Kahnert, M.; Ferrare, R.A.; Hostetler, C.A.; Cook, A.L.; Harper, D.B.; Berkoff, T.A. Observations of the spectral dependence of linear particle depolarization ratio of aerosols using NASA Langley airborne High Spectral Resolution Lidar. Atmos. Chem. Phys. 2015, 15, 13453–13473. [Google Scholar] [CrossRef] [Green Version]
  53. Mylonaki, M.; Giannakaki, E.; Papayannis, A.; Papanikolaou, C.; Komppula, M. Aerosol type classification analysis using EARLINET multiwavelength and depolarization lidar observations. Atmos. Chem. Phys. 2021, 21, 2211–2227. [Google Scholar] [CrossRef]
  54. Groß, S.; Freudenthaler, V.; Wirth, M.; Weinzierl, B. Towards an aerosol classification scheme for future EarthCARE lidar observations and implications for research needs. Atmos. Sci. Lett. 2015, 16, 77–82. [Google Scholar] [CrossRef] [Green Version]
  55. Kalogridis, A.; Vratolis, S.; Liakakou, E.; Gerasopoulos, E.; Mihalopoulos, N. Assessment of wood burning versus fossil fuel contribution to wintertime black carbon and carbon monoxide concentrations in Athens, Greece. Atmos. Chem. Phys. 2018, 18, 10219–10236. [Google Scholar] [CrossRef] [Green Version]
  56. Herich, H.; Hueglin, C.; Buchmann, B. Techniques A 2. 5 year’ s source apportionment study of black carbon from wood burning and fossil fuel combustion at urban and rural sites in Switzerland. Atmos. Meas. Tech. 2011, 4, 1409–1420. [Google Scholar] [CrossRef] [Green Version]
  57. Titos, G.; Águila, A.; Cazorla, A.; Lyamani, H.; Casquero-vera, J.A.; Colombi, C.; Cuccia, E.; Gianelle, V.; Mo, G.; Alastuey, A.; et al. Science of the Total Environment Spatial and temporal variability of carbonaceous aerosols: Assessing the impact of biomass burning in the urban environment. Sci. Total Environ. 2017, 578, 613–625. [Google Scholar] [CrossRef] [Green Version]
  58. Fuller, G.W.; Sciare, J.; Lutz, M.; Moukhtar, S.; Wagener, S. New Directions: Time to tackle urban wood burning? Atmos. Environ. 2013, 68, 295–296. [Google Scholar] [CrossRef]
  59. Fuller, G.W.; Tremper, A.H.; Baker, T.D.; Espen, K.; Butter, D. Contribution of wood burning to PM 10 in London. Atmos. Environ. 2014, 87, 87–94. [Google Scholar] [CrossRef] [Green Version]
  60. Costabile, F.; Alas, H.; Aufderheide, M.; Avino, P.; Amato, F.; Argentini, S.; Id, F.B.; Berico, M.; Bernardoni, V.; Biondi, R.; et al. First Results of the “Carbonaceous Aerosol in Rome and Environs (CARE)” Experiment: Beyond Current Standards for PM 10. Atmosphere 2017, 8, 249. [Google Scholar] [CrossRef] [Green Version]
  61. Borrego, C.; Valente, J.; Carvalho, A.; Sá, E.; Lopes, M.; Miranda, A.I. Contribution of residential wood combustion to PM10 levels in Portugal. Atmos. Environ. 2010, 44, 642–651. [Google Scholar] [CrossRef] [Green Version]
  62. Becerril-Valle, M.; Coz, E.; Prévôt, A.S.H.; Močnik, G.; Pandis, S.N.; de la Campa, A.S.; Alastueyj, A.; Díaza, E.; Pérezk, R.M.; Artíñano, B. Characterization of atmospheric black carbon and co-pollutants in urban and rural areas of Spain v o. Atmos. Environ. 2017, 169, 36–53. [Google Scholar] [CrossRef]
  63. Burton, S.P.; Vaughan, M.A.; Ferrare, R.A.; Hostetler, C.A. Separating mixtures of aerosol types in airborne High Spectral Resolution Lidar data. Atmos. Meas. Tech. 2014, 7, 419–436. [Google Scholar] [CrossRef] [Green Version]
  64. Groß, S.; Freudenthaler, V.; Schepanski, K.; Toledano, C.; Schäfler, A.; Ansmann, A.; Weinzierl, B. Optical properties of long-range transported Saharan dust over Barbados as measured by dual-wavelength depolarization Raman lidar measurements. Atmos. Chem. Phys. 2015, 15, 11067–11080. [Google Scholar] [CrossRef] [Green Version]
  65. Müller, D.; Heinold, B.; Tesche, M.; Tegen, I.; Althausen, D.; Arboledas, L.A.; Amiridis, V.; Amodeo, A.; Ansmann, A.; Balis, D.; et al. EARLINET observations of the 14-22-May long-range dust transport event during SAMUM 2006: Validation of results from dust transport modelling. Tellus Ser. B Chem. Phys. Meteorol. 2009, 61, 325–339. [Google Scholar] [CrossRef] [Green Version]
  66. Papayannis, A.; Mamouri, R.E.; Amiridis, V.; Remoundaki, E.; Tsaknakis, G.; Kokkalis, P.; Veselovskii, I.; Kolgotin, A.; Nenes, A.; Fountoukis, C. Optical-microphysical properties of Saharan dust aerosols and composition relationship using a multi-wavelength Raman lidar, in situ sensors and modelling: A case study analysis. Atmos. Chem. Phys. 2012, 12, 4011–4032. [Google Scholar] [CrossRef] [Green Version]
  67. Soupiona, O.; Samaras, S.; Ortiz-Amezcua, P.; Böckmann, C.; Papayannis, A.; Moreira, G.A.; Benavent-Oltra, J.A.; Guerrero-Rascado, J.L.; Bedoya-Velásquez, A.E.; Olmo, F.J.; et al. Retrieval of optical and microphysical properties of transported Saharan dust over Athens and Granada based on multi-wavelength Raman lidar measurements: Study of the mixing processes. Atmos. Environ. 2019, 214. [Google Scholar] [CrossRef]
Figure 2. Spatio-temporal evolution of the range-corrected lidar signal at 532 nm for the days used in this study during the PANACEA winter campaign (10 January 2020–3 February 2020) in Ioannina city.
Atmosphere 13 00094 g002
Figure 3. Vertical distribution of baer (Mm−1sr−1) and PLDR at 532 nm, as observed by the AIAS mobile lidar during the winter PANACEA campaign over the city of Ioannina. Each case shown is presented with different color. The PBLH along with its standard deviation is presented with the black solid and dashed lines, respectively.
Atmosphere 13 00094 g003
Figure 4. Temporal variation of (a) the PBL altitude (a.s.l.; black rhombus) along with the base and top of each aerosol layer (AL; colored bars) (km) and the corresponding mean values of (b) baer and std (Mm−1sr−1) and (c) PLDR and std at 532 nm, as obtained by the AIAS mobile depolarization lidar, along with the (d) wind speed (m/s) and direction (°), (e) PM2.5 mass concentrations (μg/m3), T (°C), RH (%), (f) the BC mass concentrations (μg/m3) along with the contribution of the fossil fuel and wood burning to the total BC mass concentrations, during the PANACEA winter campaign in Ioannina. All data presented are averaged for the same time periods during which the lidar profiles were retrieved.
Atmosphere 13 00094 g004
Figure 8. (a) Spatio-temporal evolution of the range-corrected signal at 532 nm, (b) the vertical distribution of baer (Mm−1sr−1) and PLDR at 532 nm, as observed by the AIAS mobile lidar during the 26 January 2020 between 08:29 and 09:04 UTC over the city of Ioannina, the 2-colored-shoadowed rectangles represent the geometrical boundaries of the studied aerosol layers. The black dashed line represents the PBLH. (c) The PM2.5 concentration (μg/m3), the T (°C), RH (%), and the BC levels (μg/m3) along with the participation of the fossil fuel and wood burning to the total BC concentrations. (d) The wind speed and direction (hourly mean), during the measurement time. (e) The HYSPLIT air mass back trajectories for the 2 aerosol layers.
Atmosphere 13 00094 g008
Table 1. PLDR (532 nm) values of fresh BB aerosols as cited in the relevant literature (2012–today).
ReferencePLDR
Burton et al., 2012 [30]0.02–0.05
Nicolae et al., 2013 [31]<0.05 (0.02–0.04)
Burton et al., 2013 [26]0.03–0.06
Nepomuceno Pereira et al., 2014 [1]≤0.05
Burton et al., 2015 [52]0.02–0.03
Stachlewska et al., 2018 [50]≤0.065
Papanikolaou et al., 2020 [51]0.05 ± 0.04
This study0.02 ± 0.01 (PBL)
0.04 ± 0.02 (FT)
Publisher’s Note: MDPI stays neutral with regard to jurisdictional claims in published maps and institutional affiliations.

