
Geothermal Energy Potential for Cooling/Heating Greenhouses in Hot Arid Regions

 , and
, and 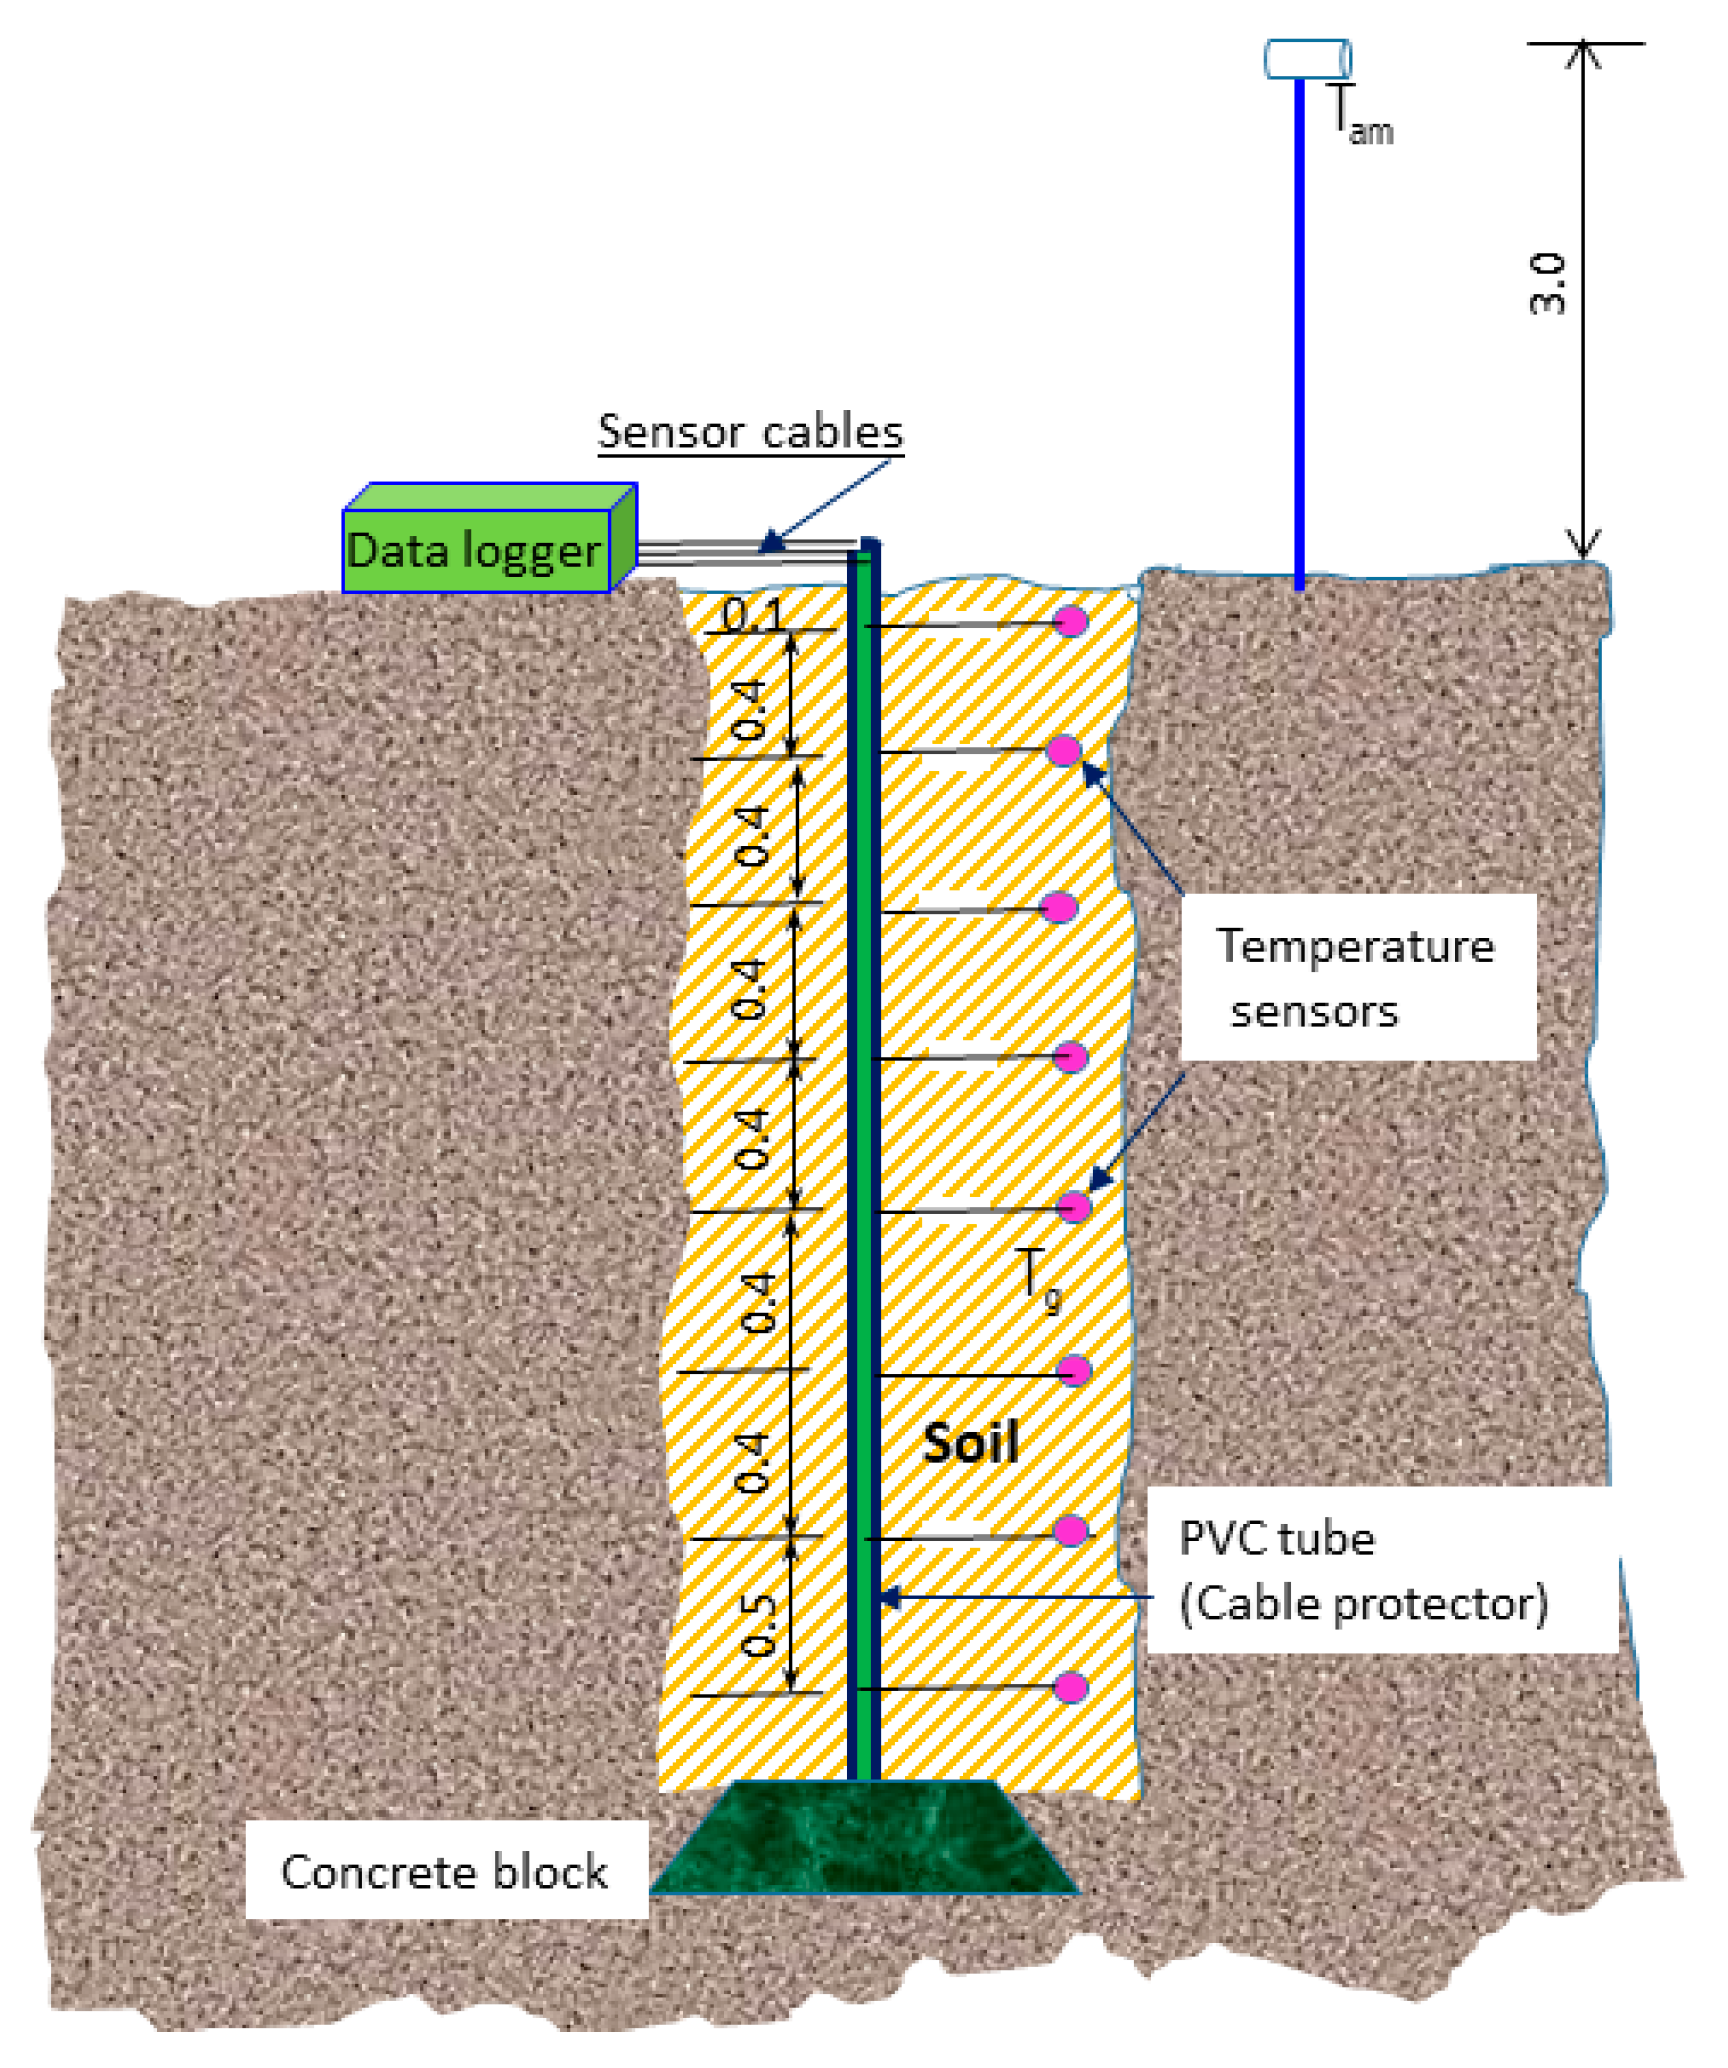
Abstract
:1. Introduction
2. Methodology
2.1. Study Area
2.2. Measuring Underground Temperature Profiles
2.3. Possibility of Condensation in the Buried CL-EAHE Pipes
2.4. Geothermal Cooling/Heating Capacity
3. Results and Discussion
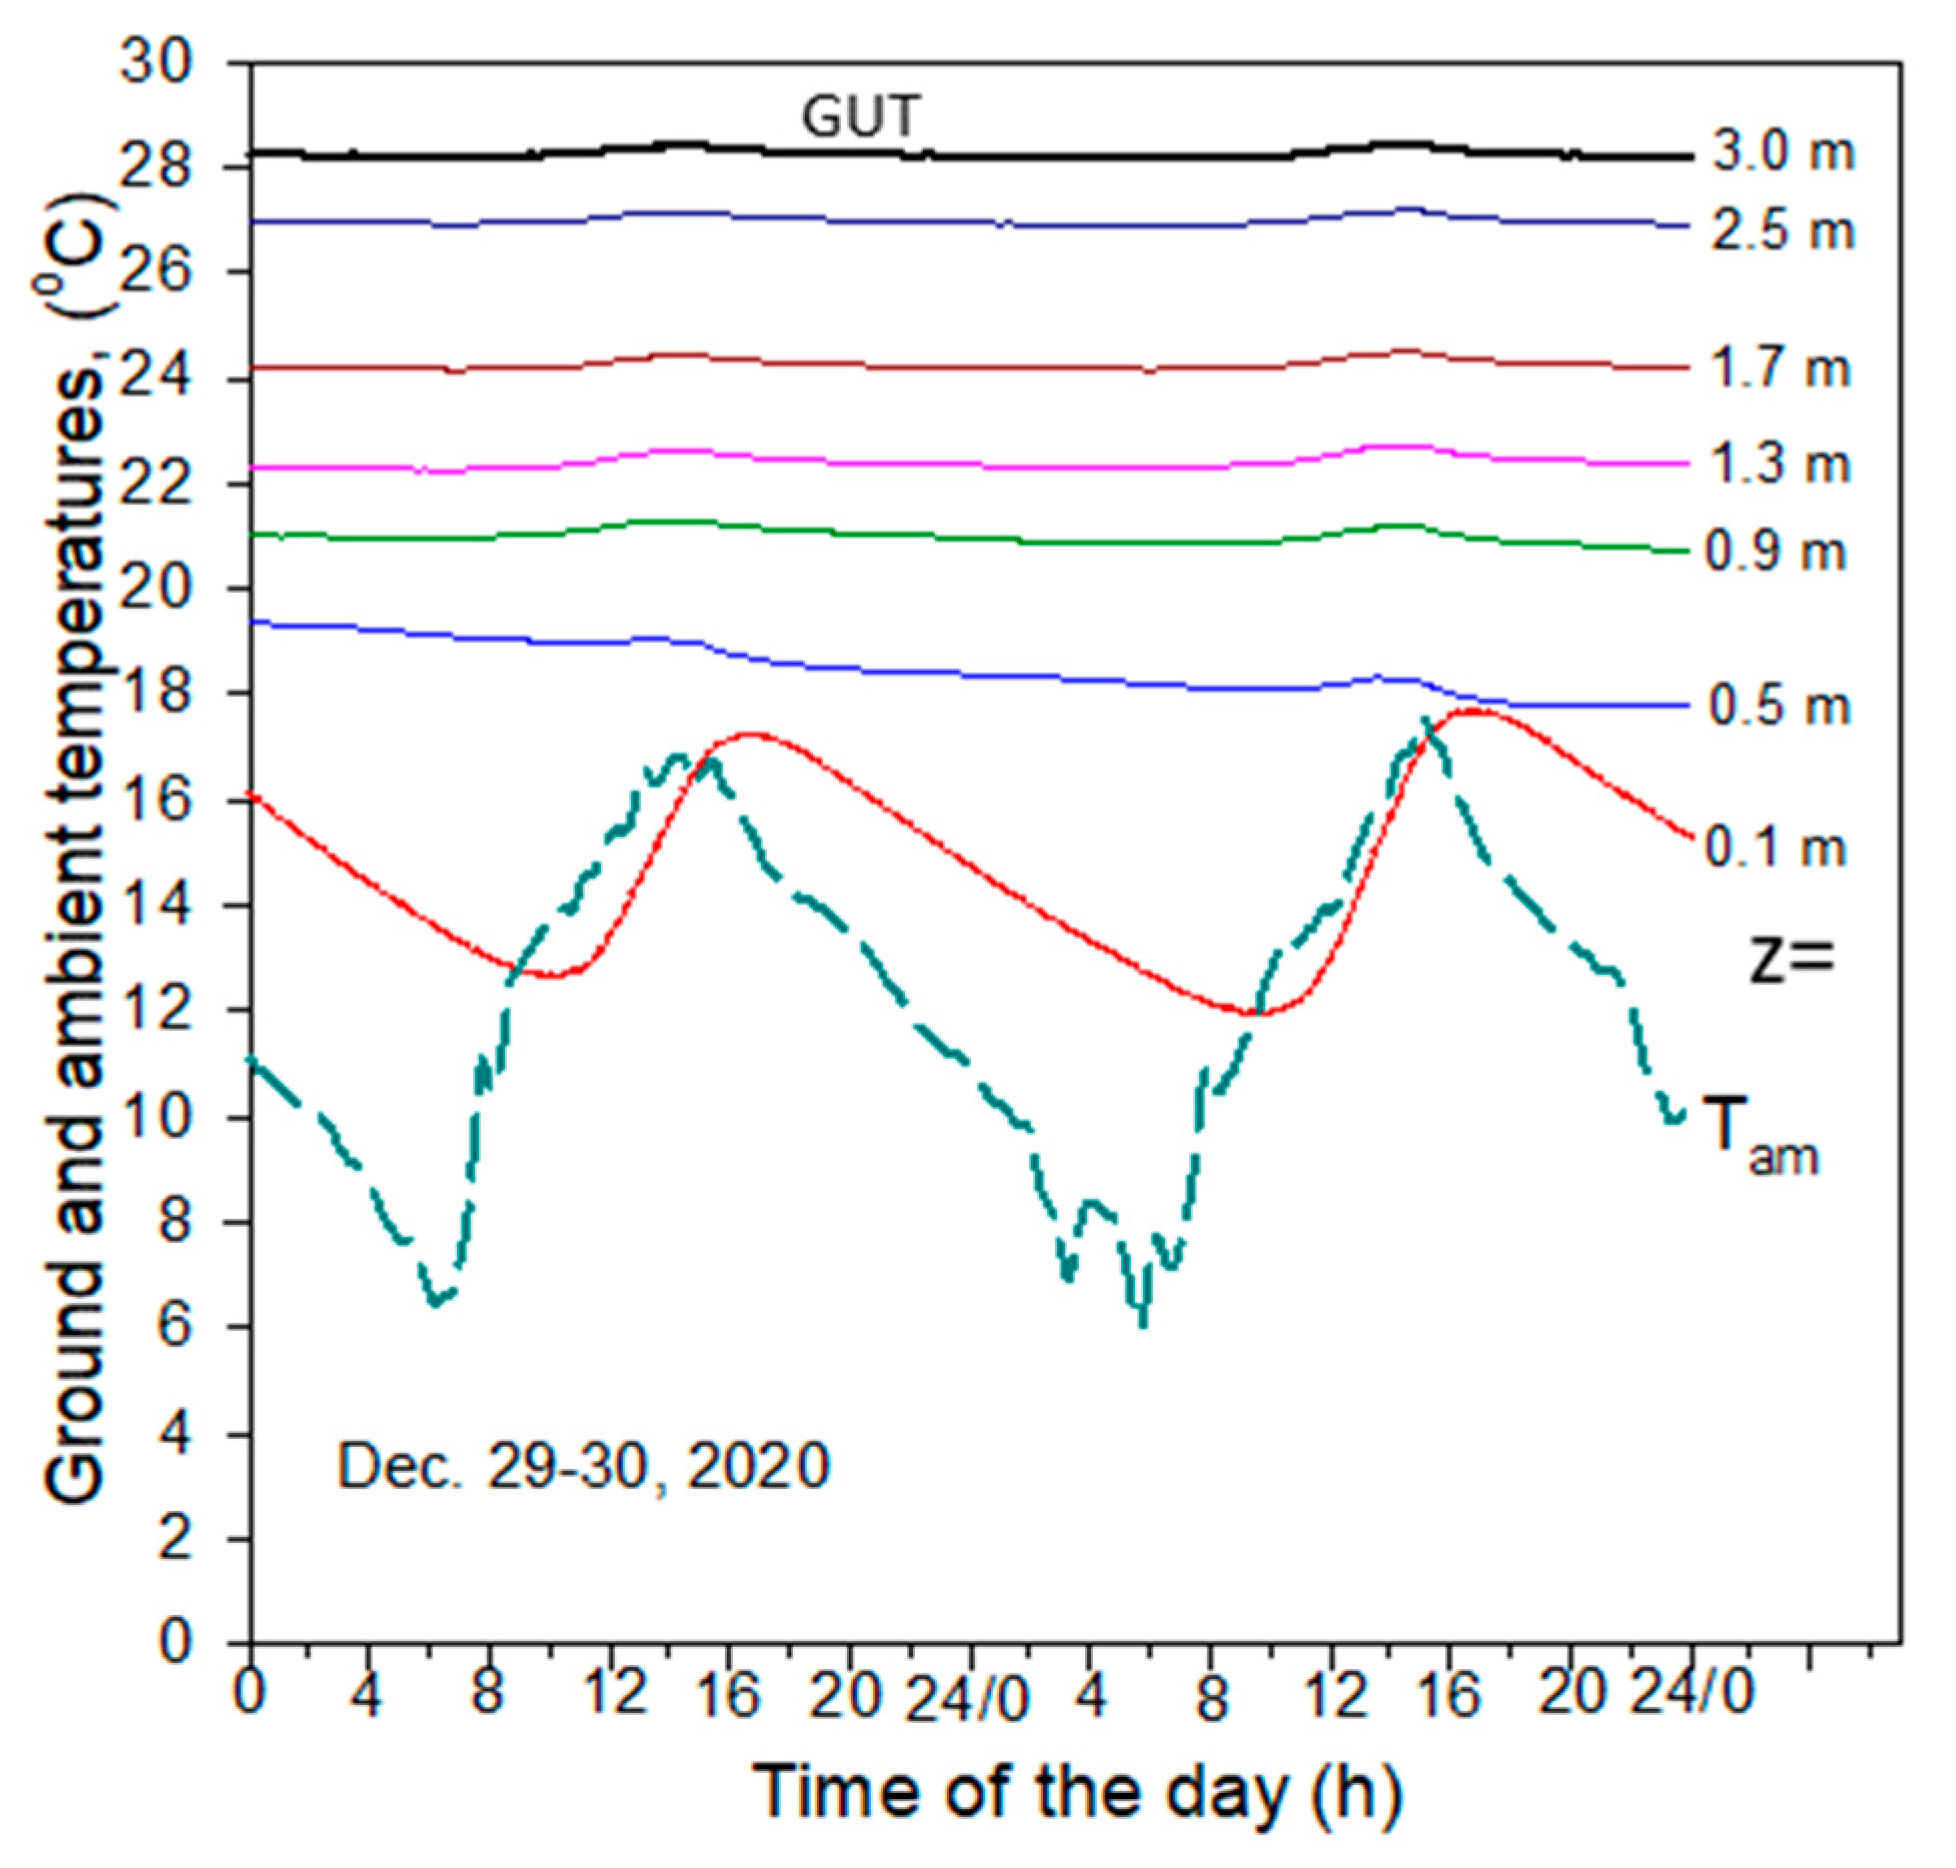
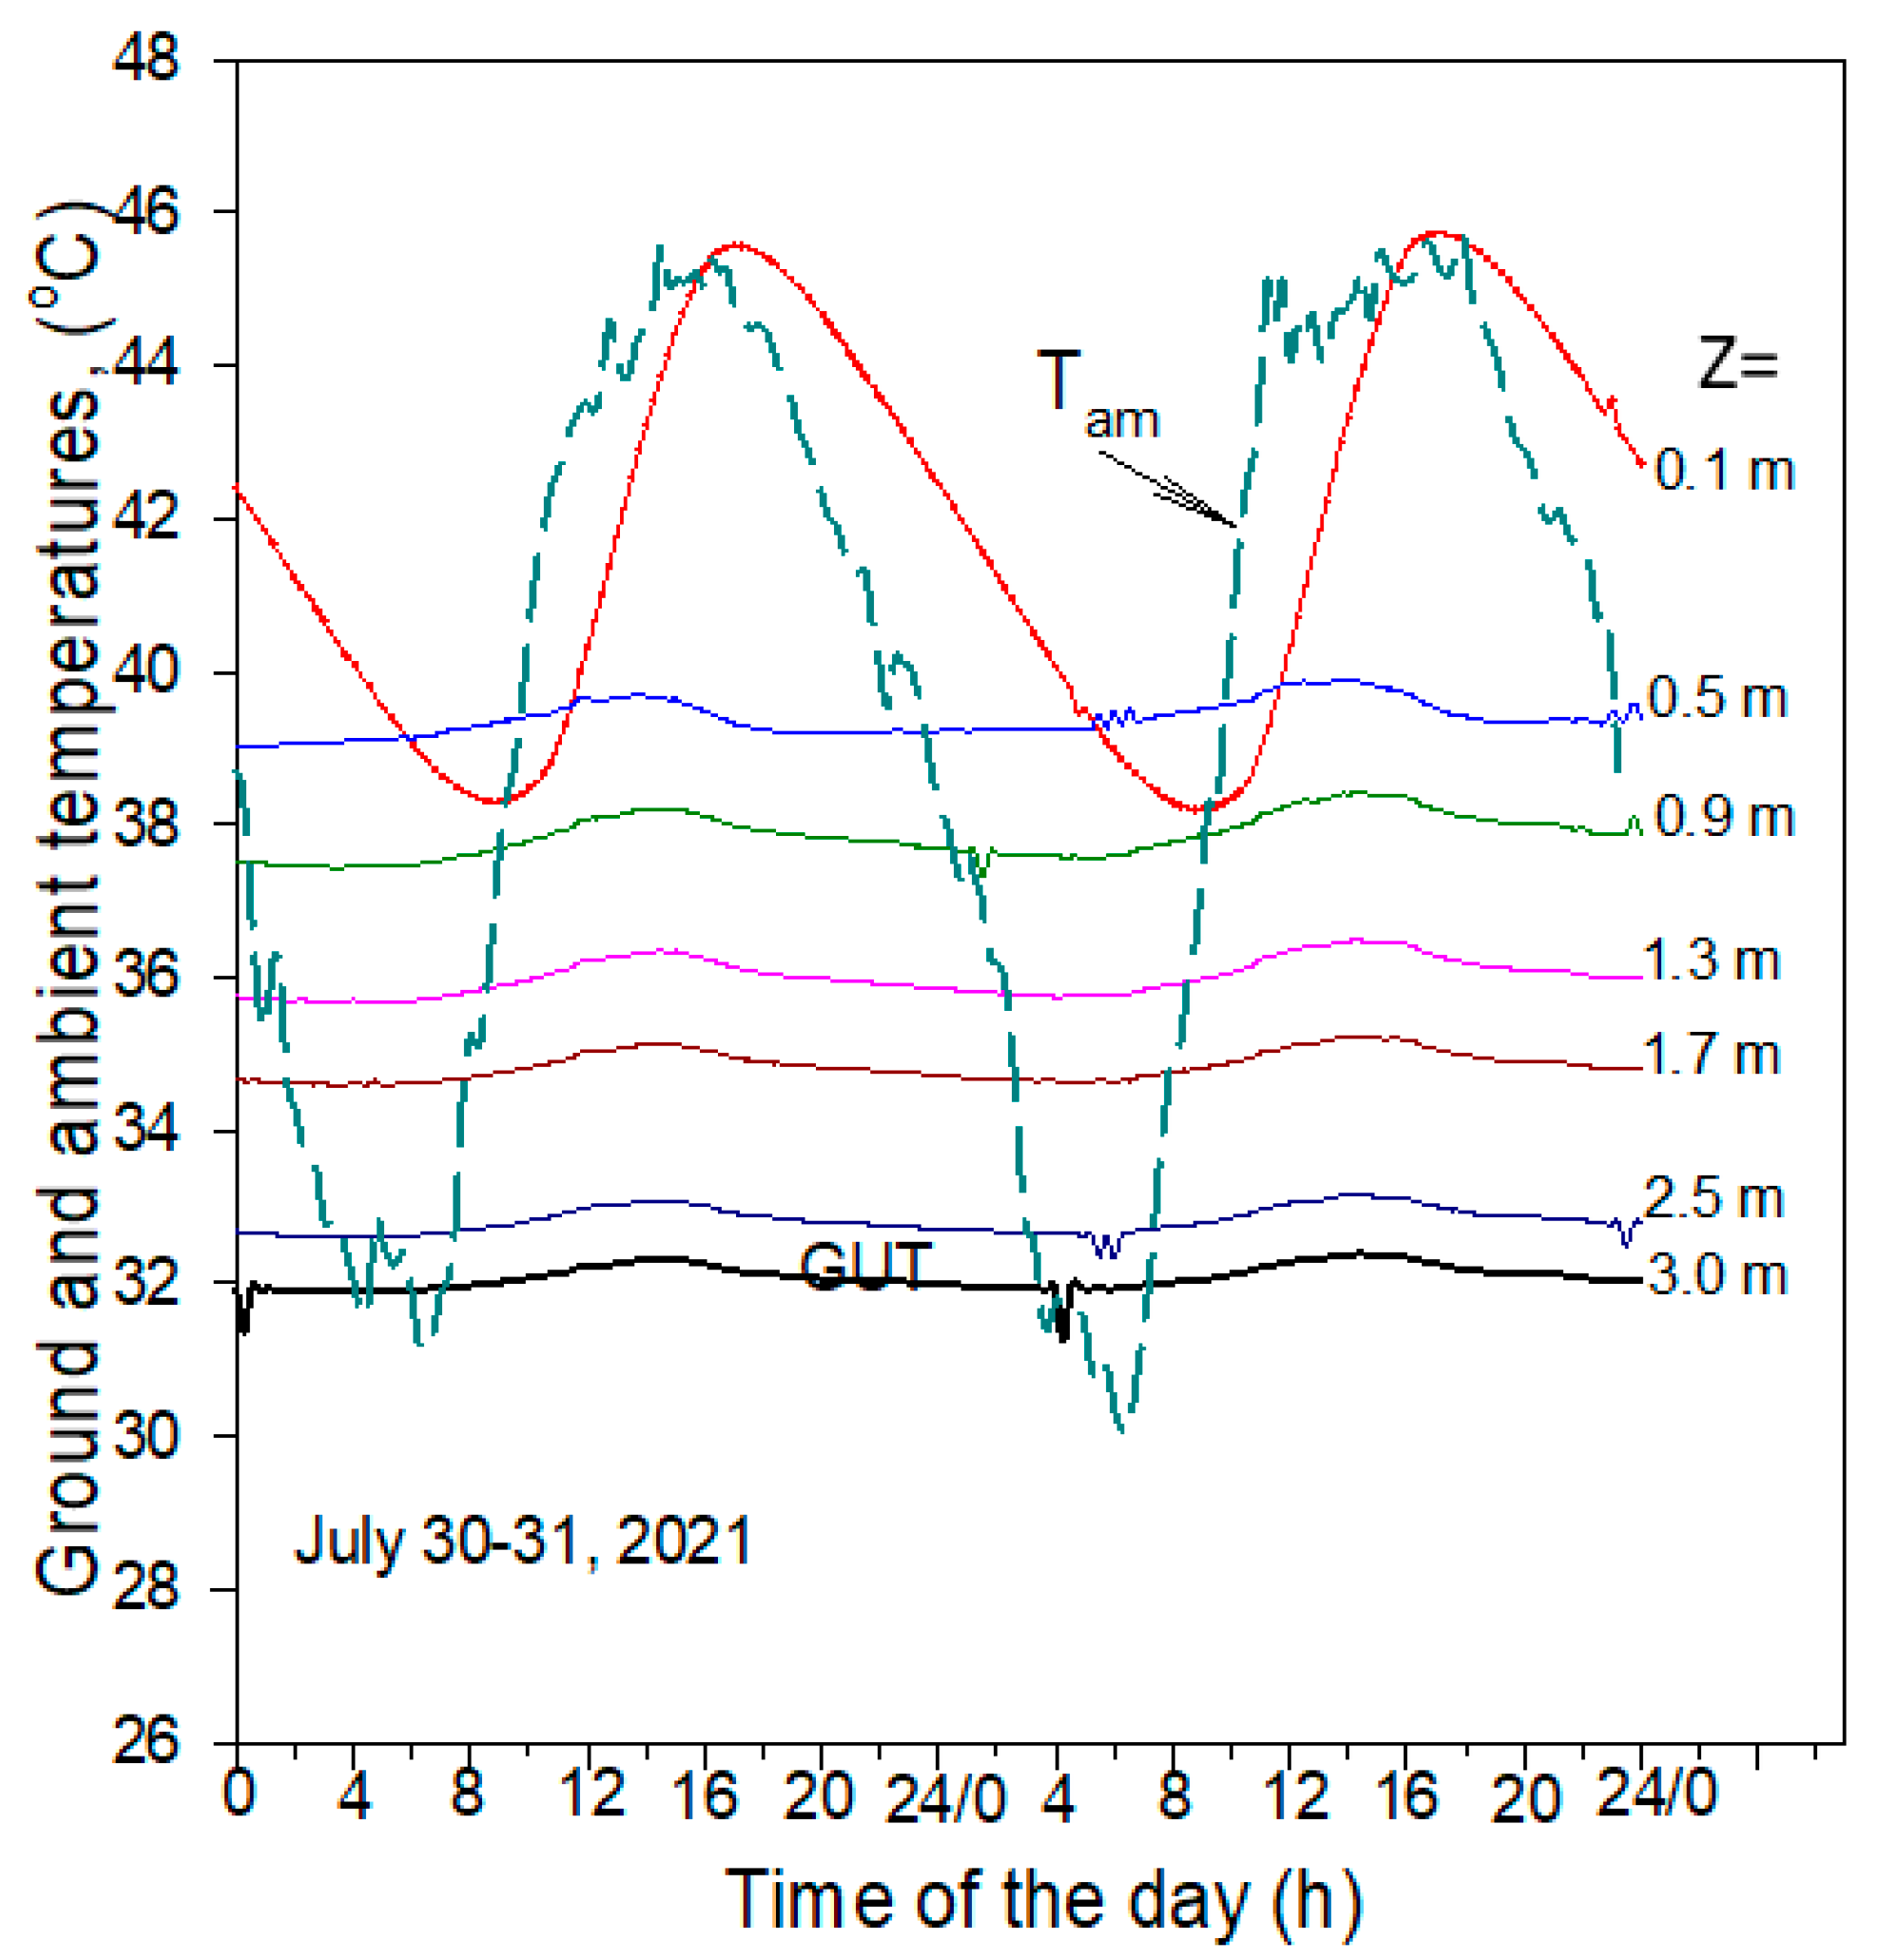
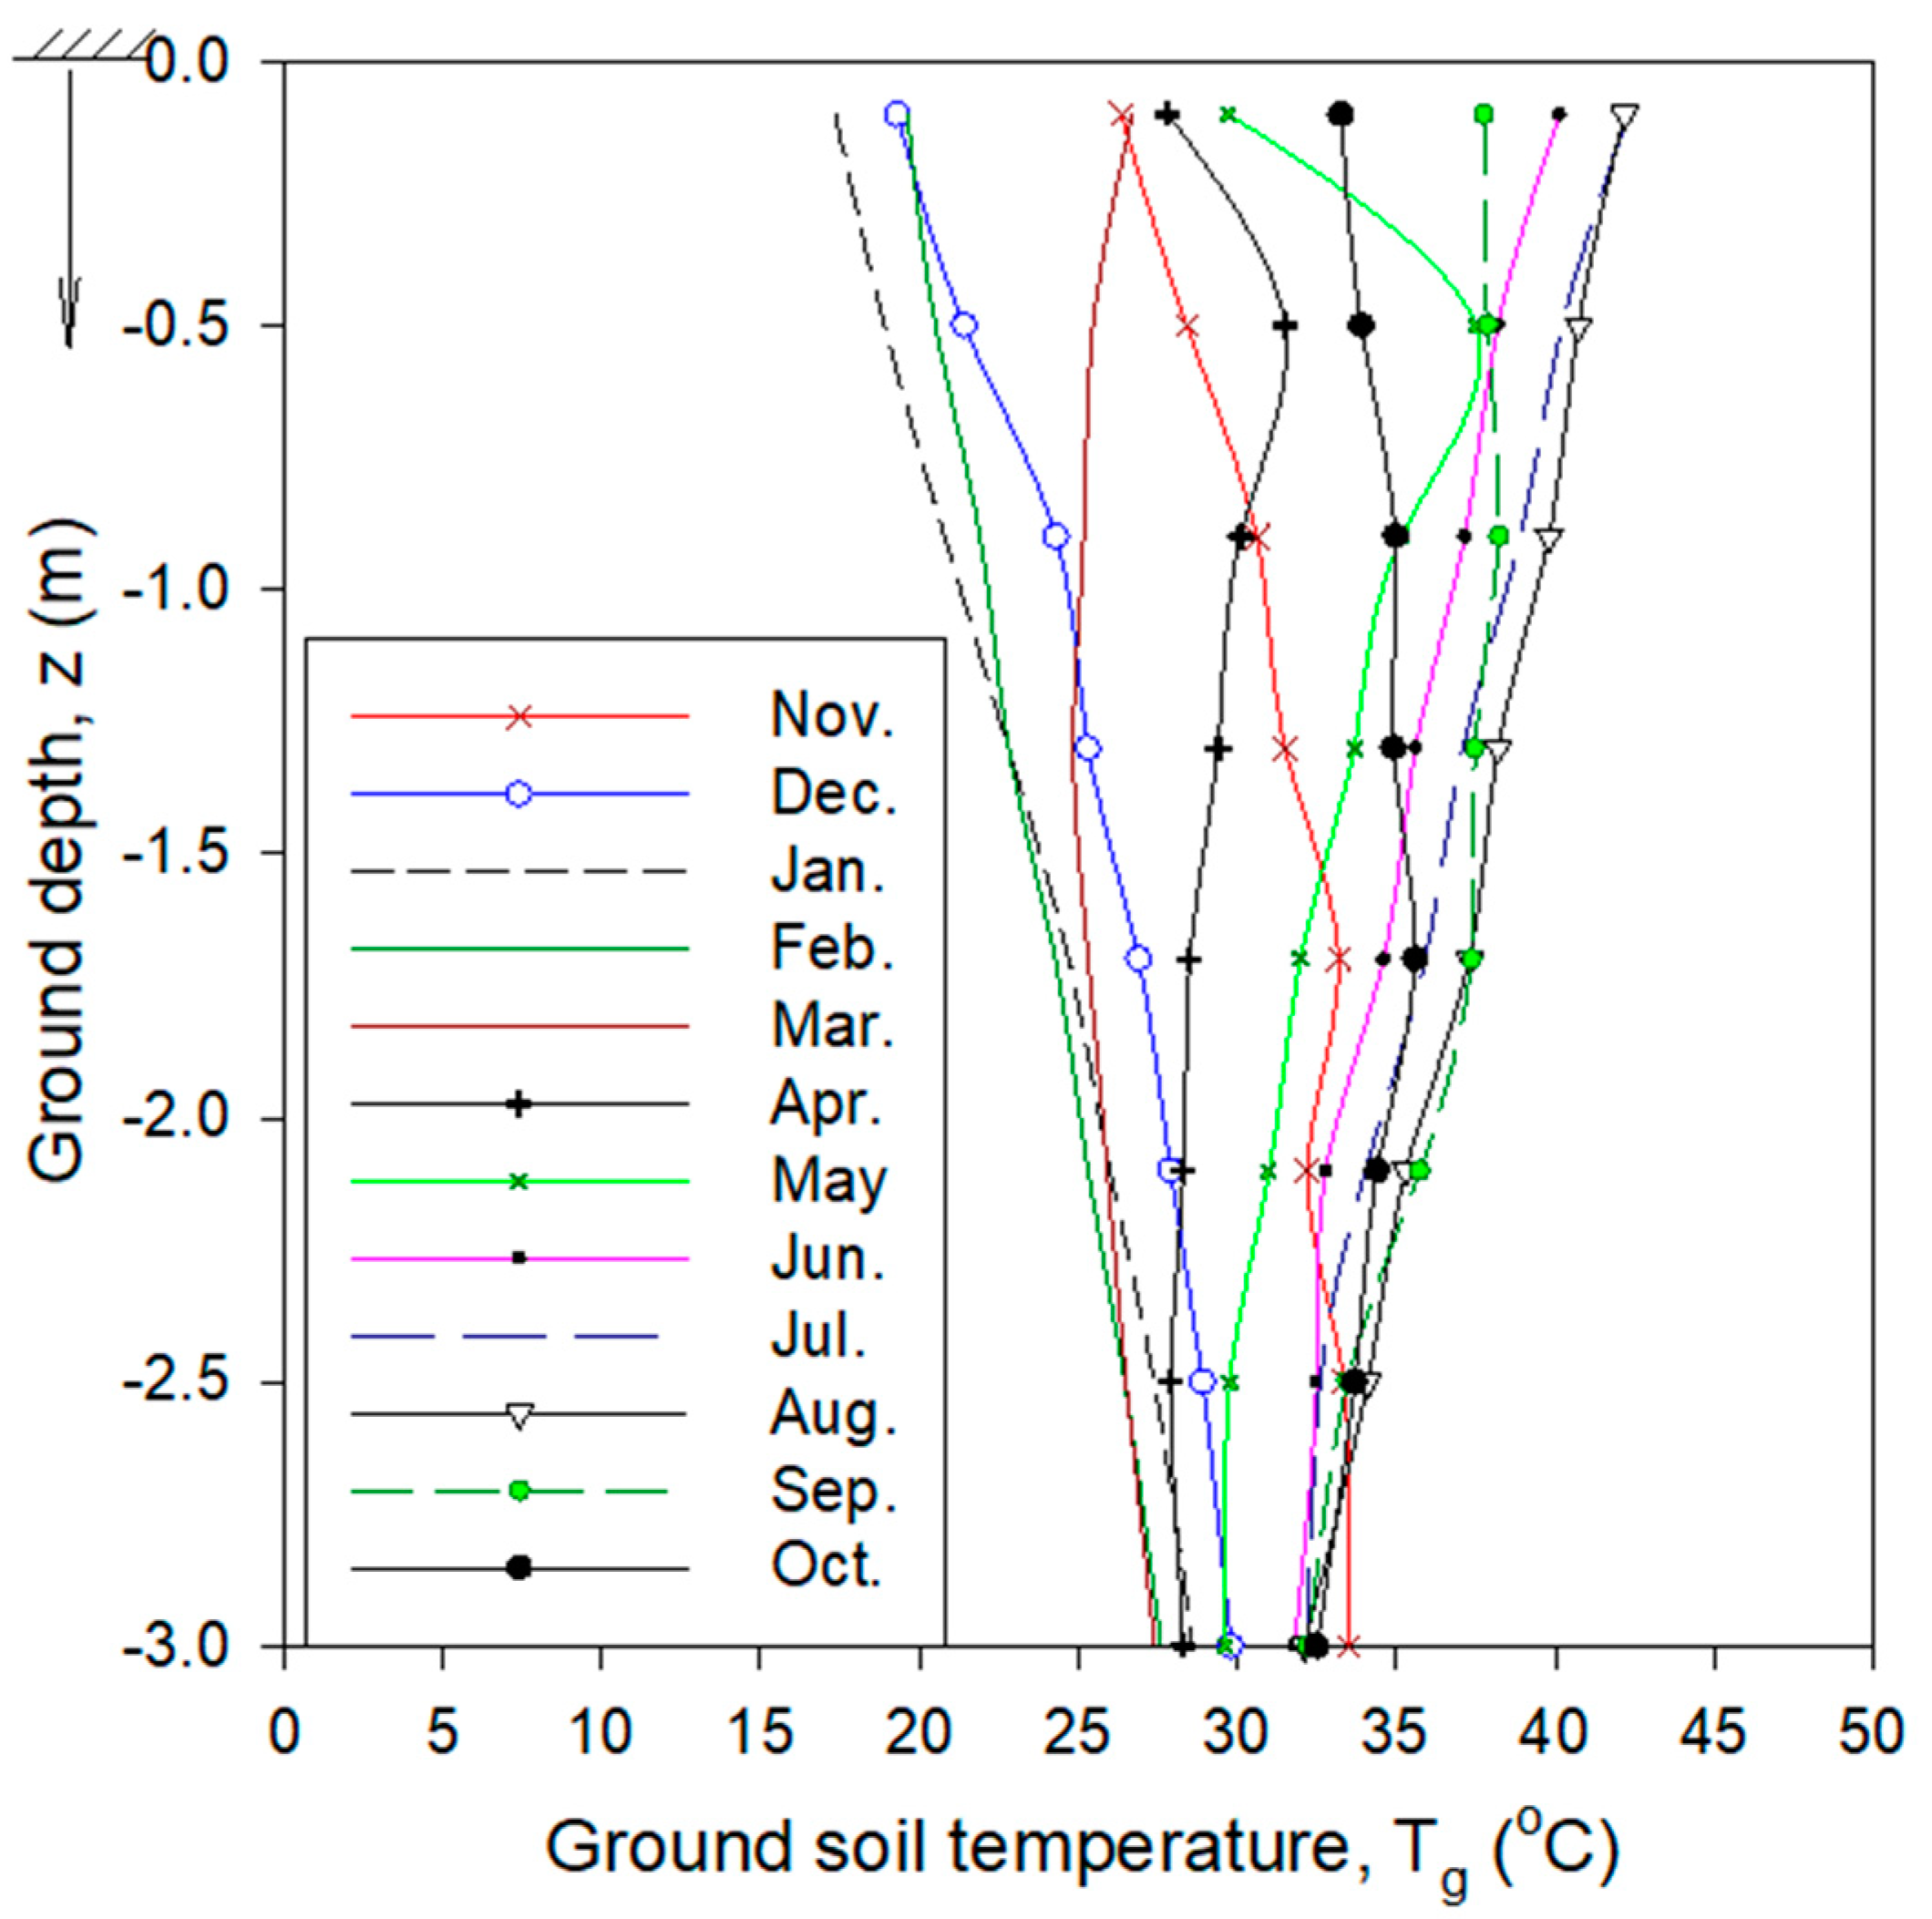
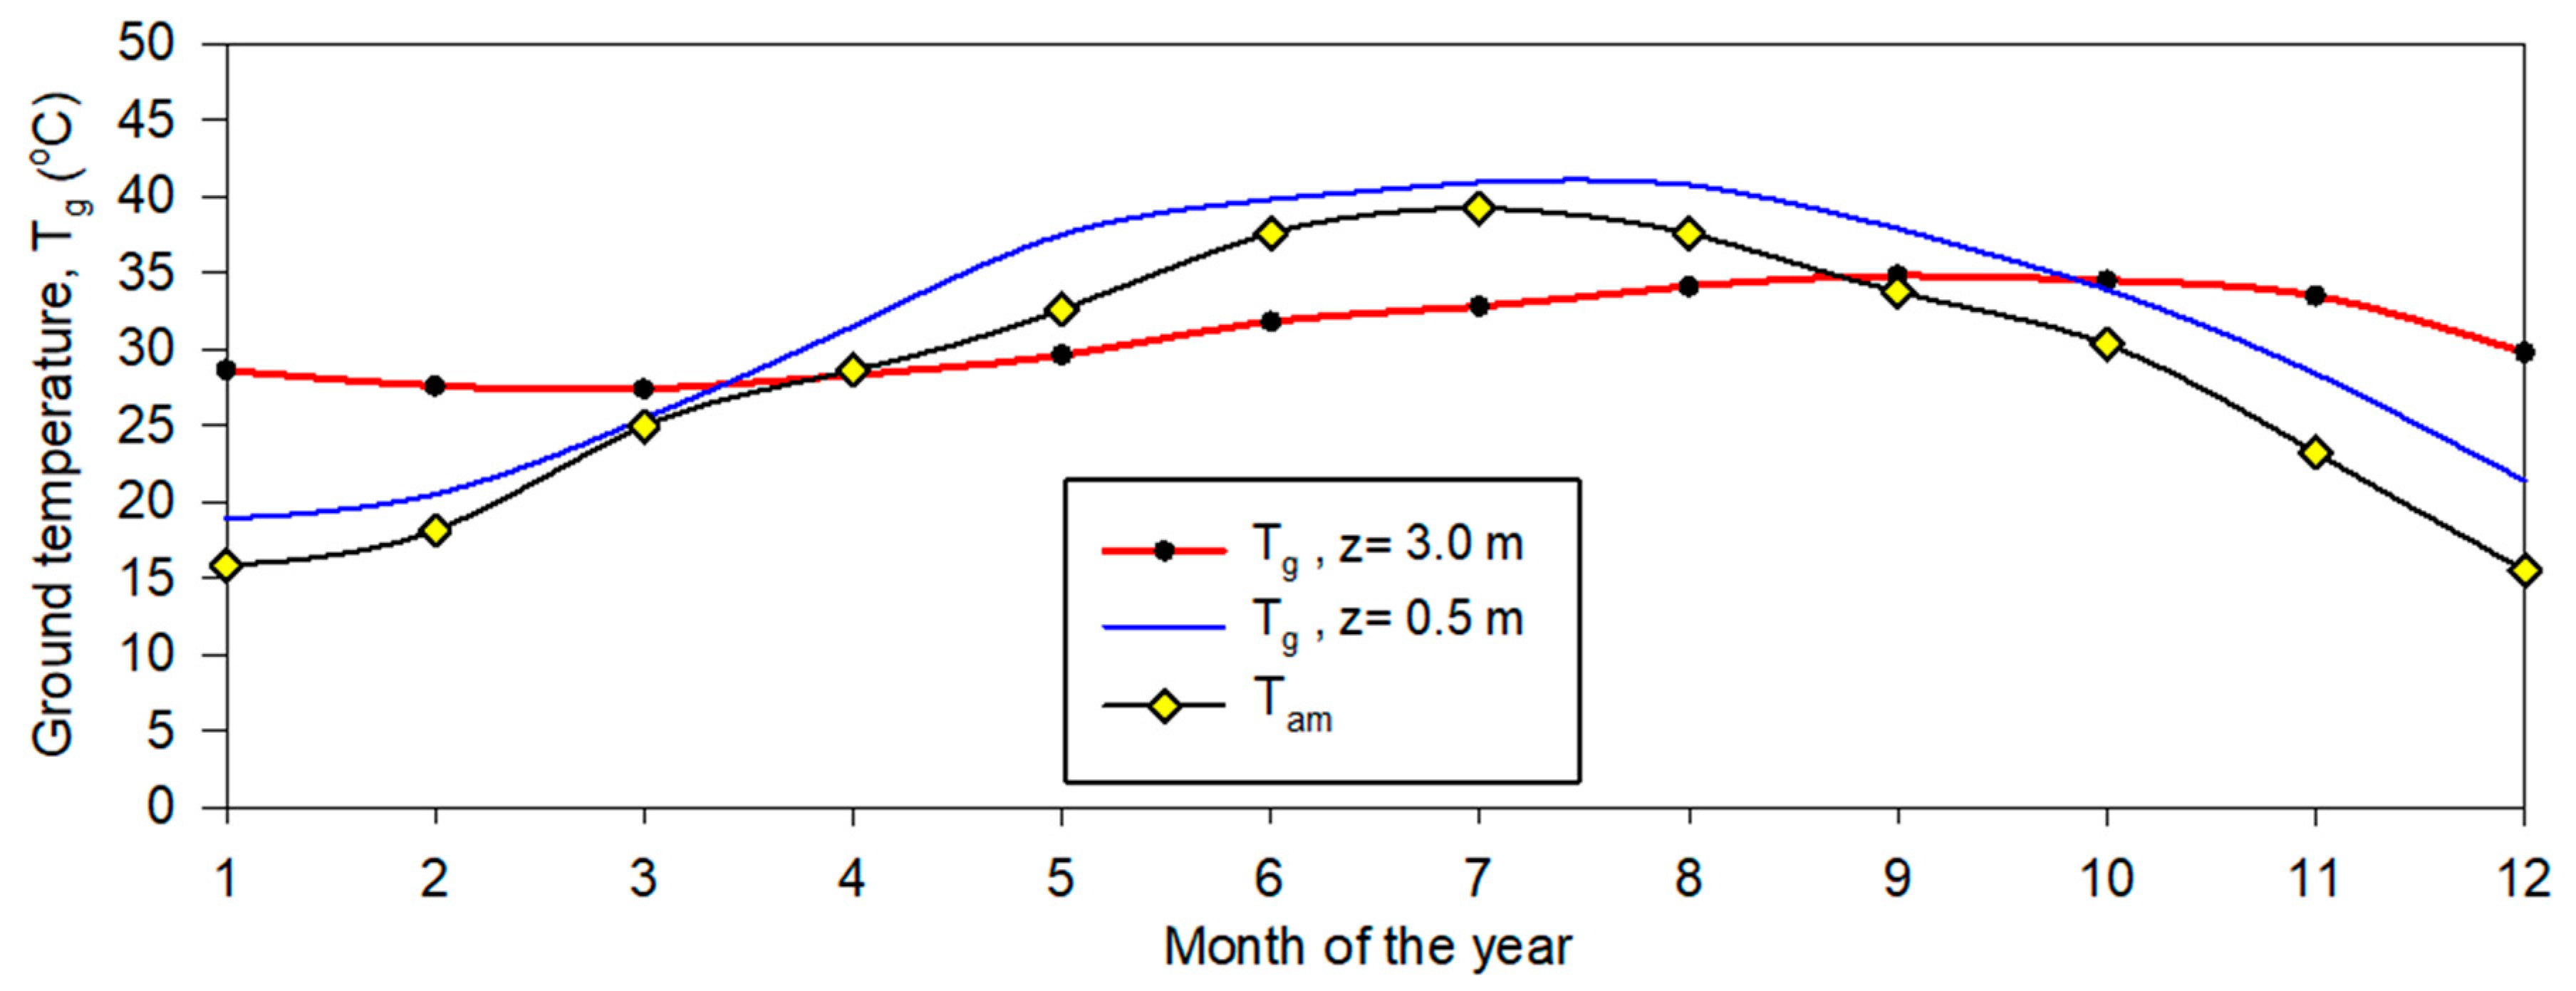
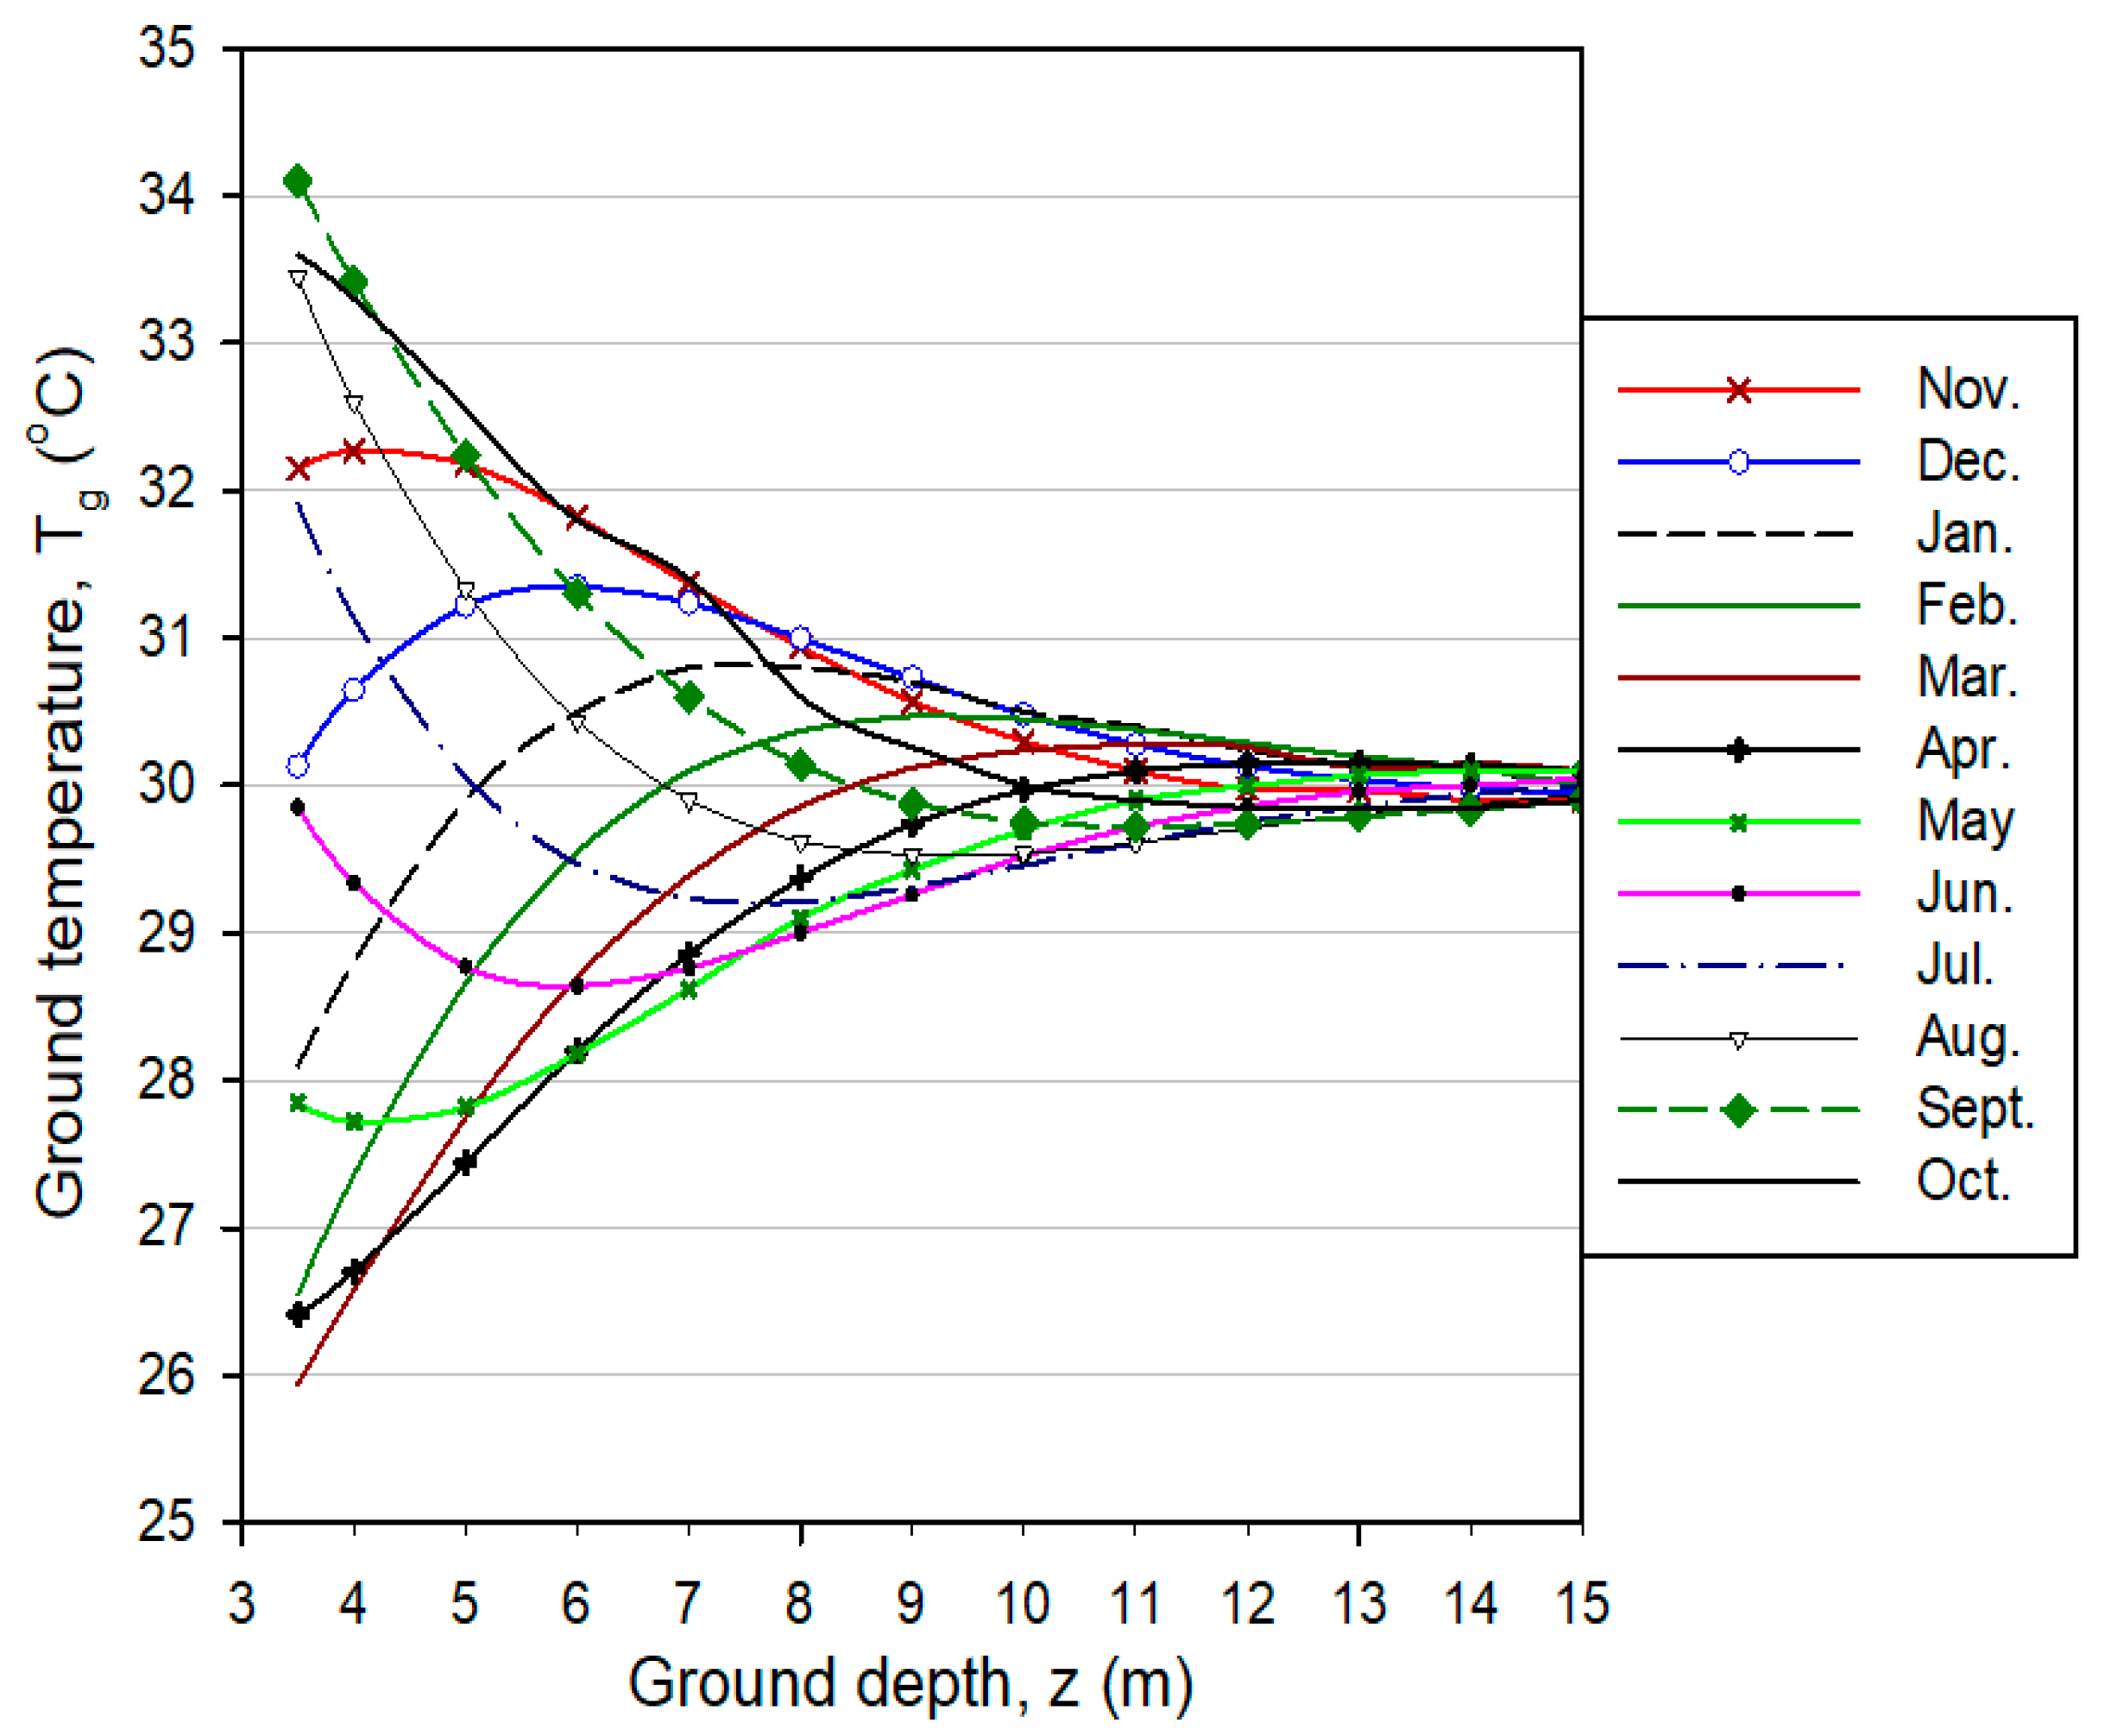
3.1. Underground Soil Temperature
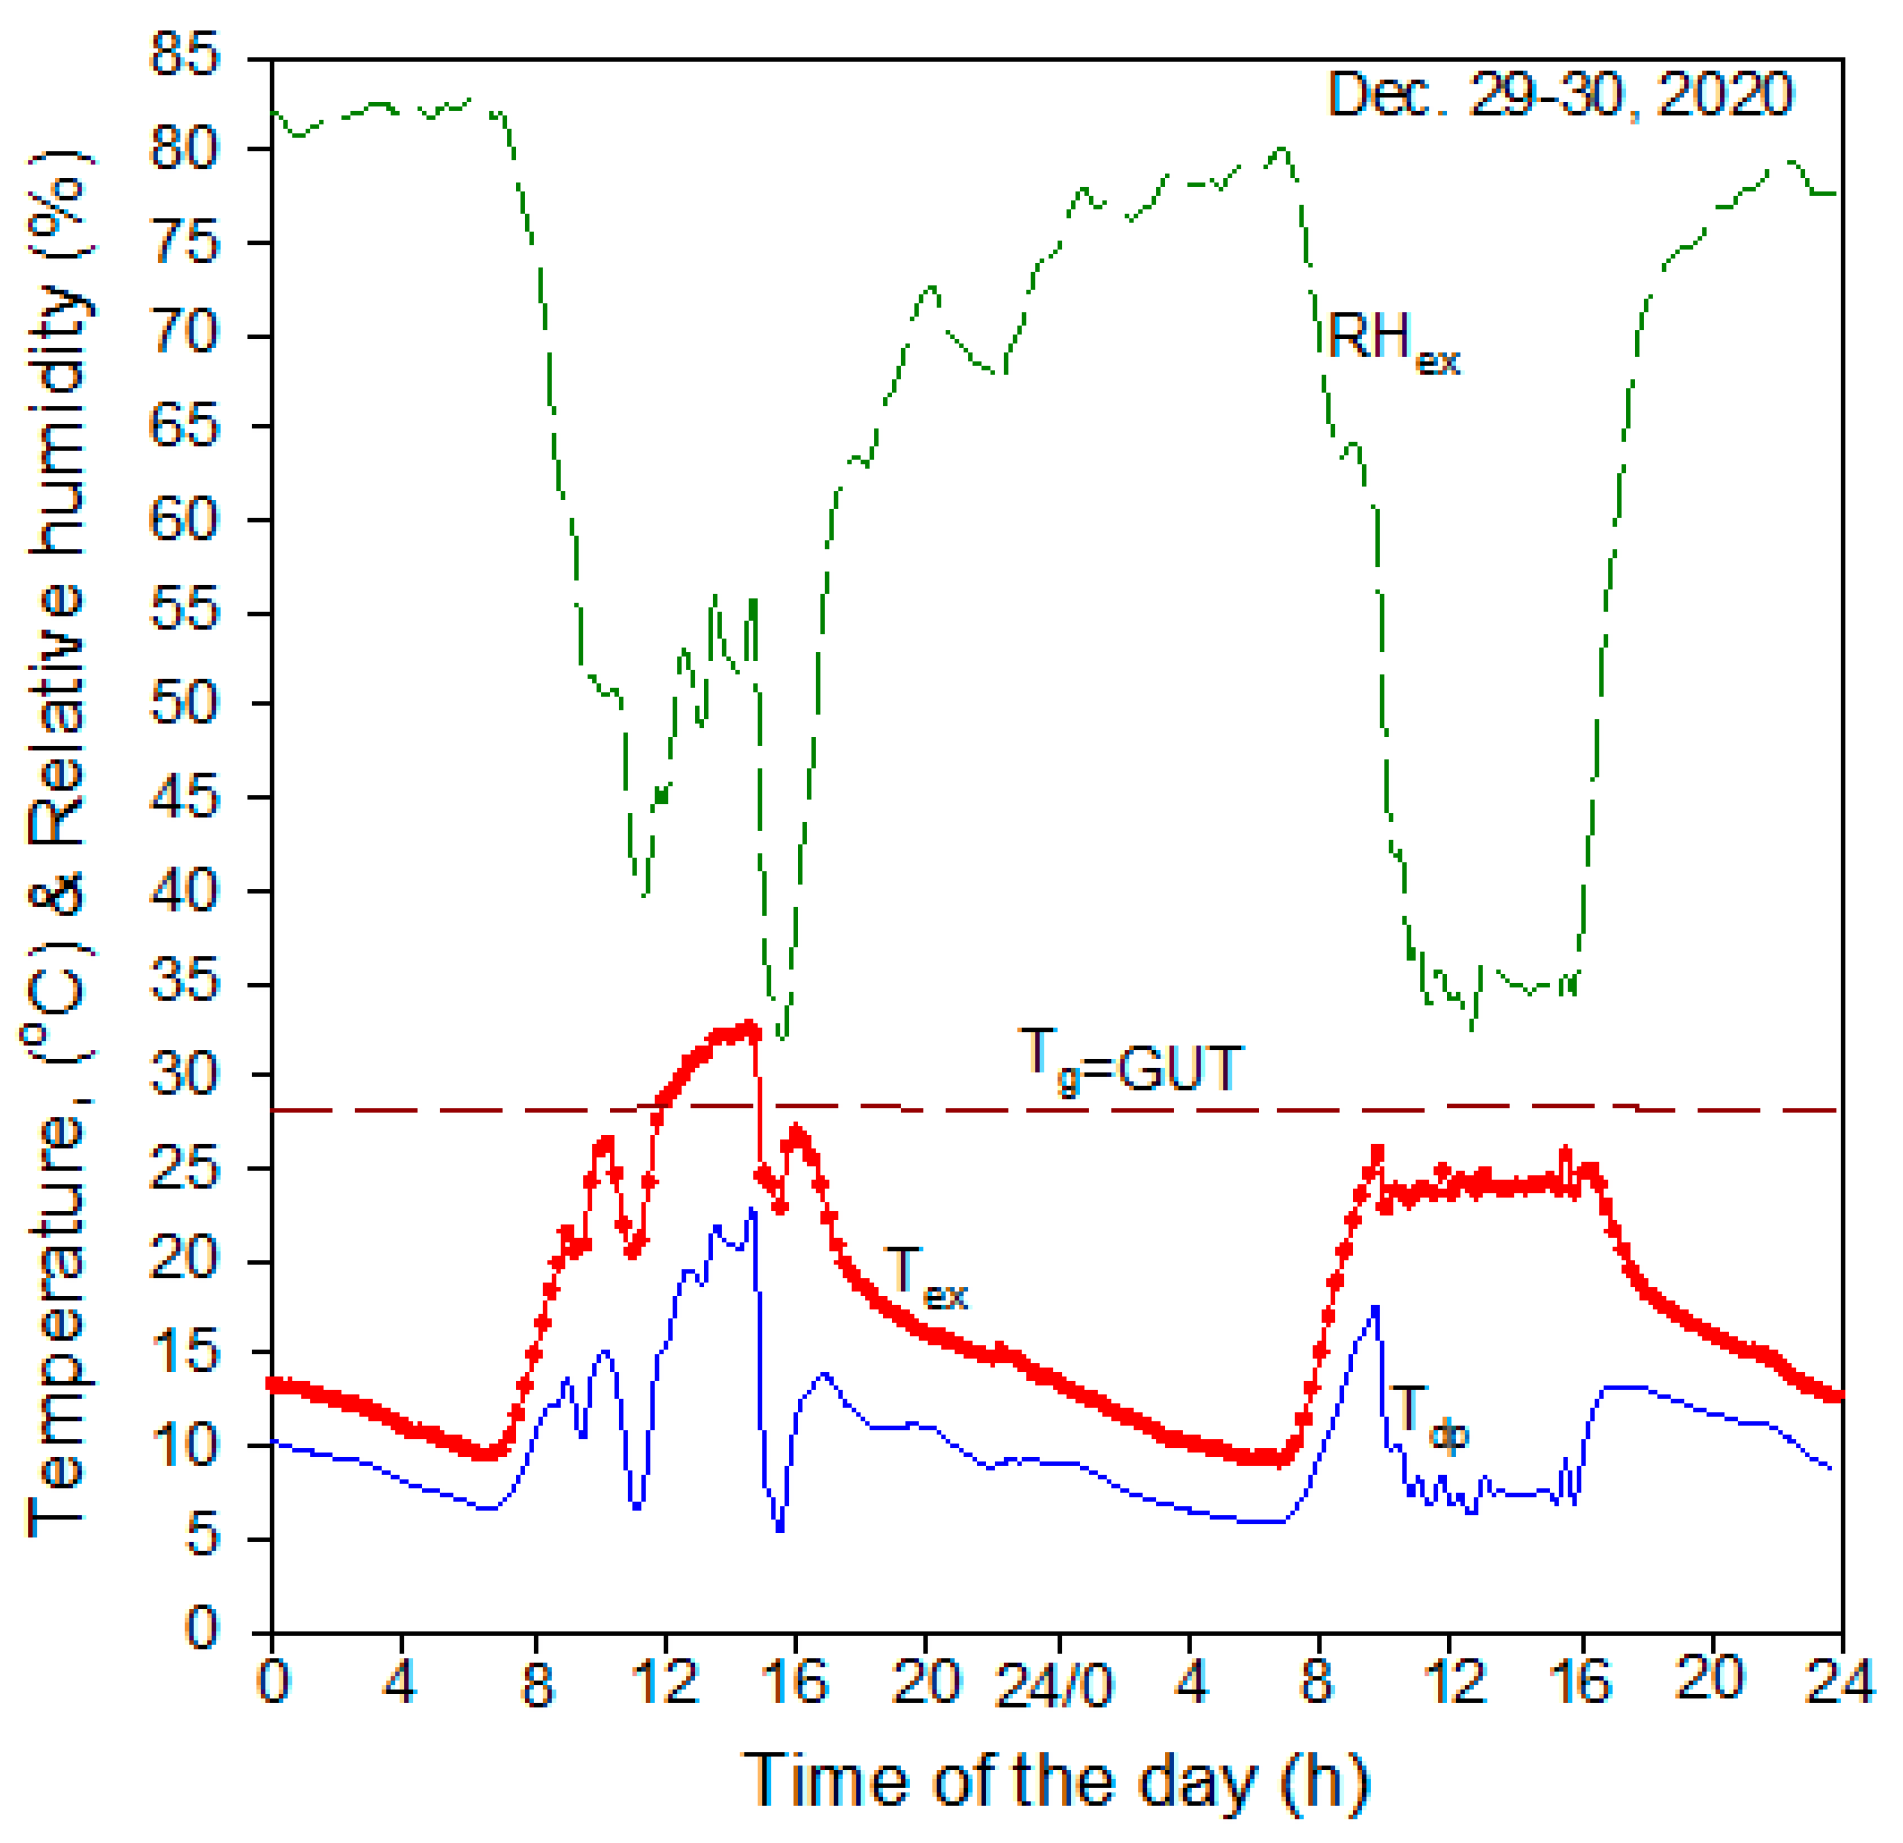
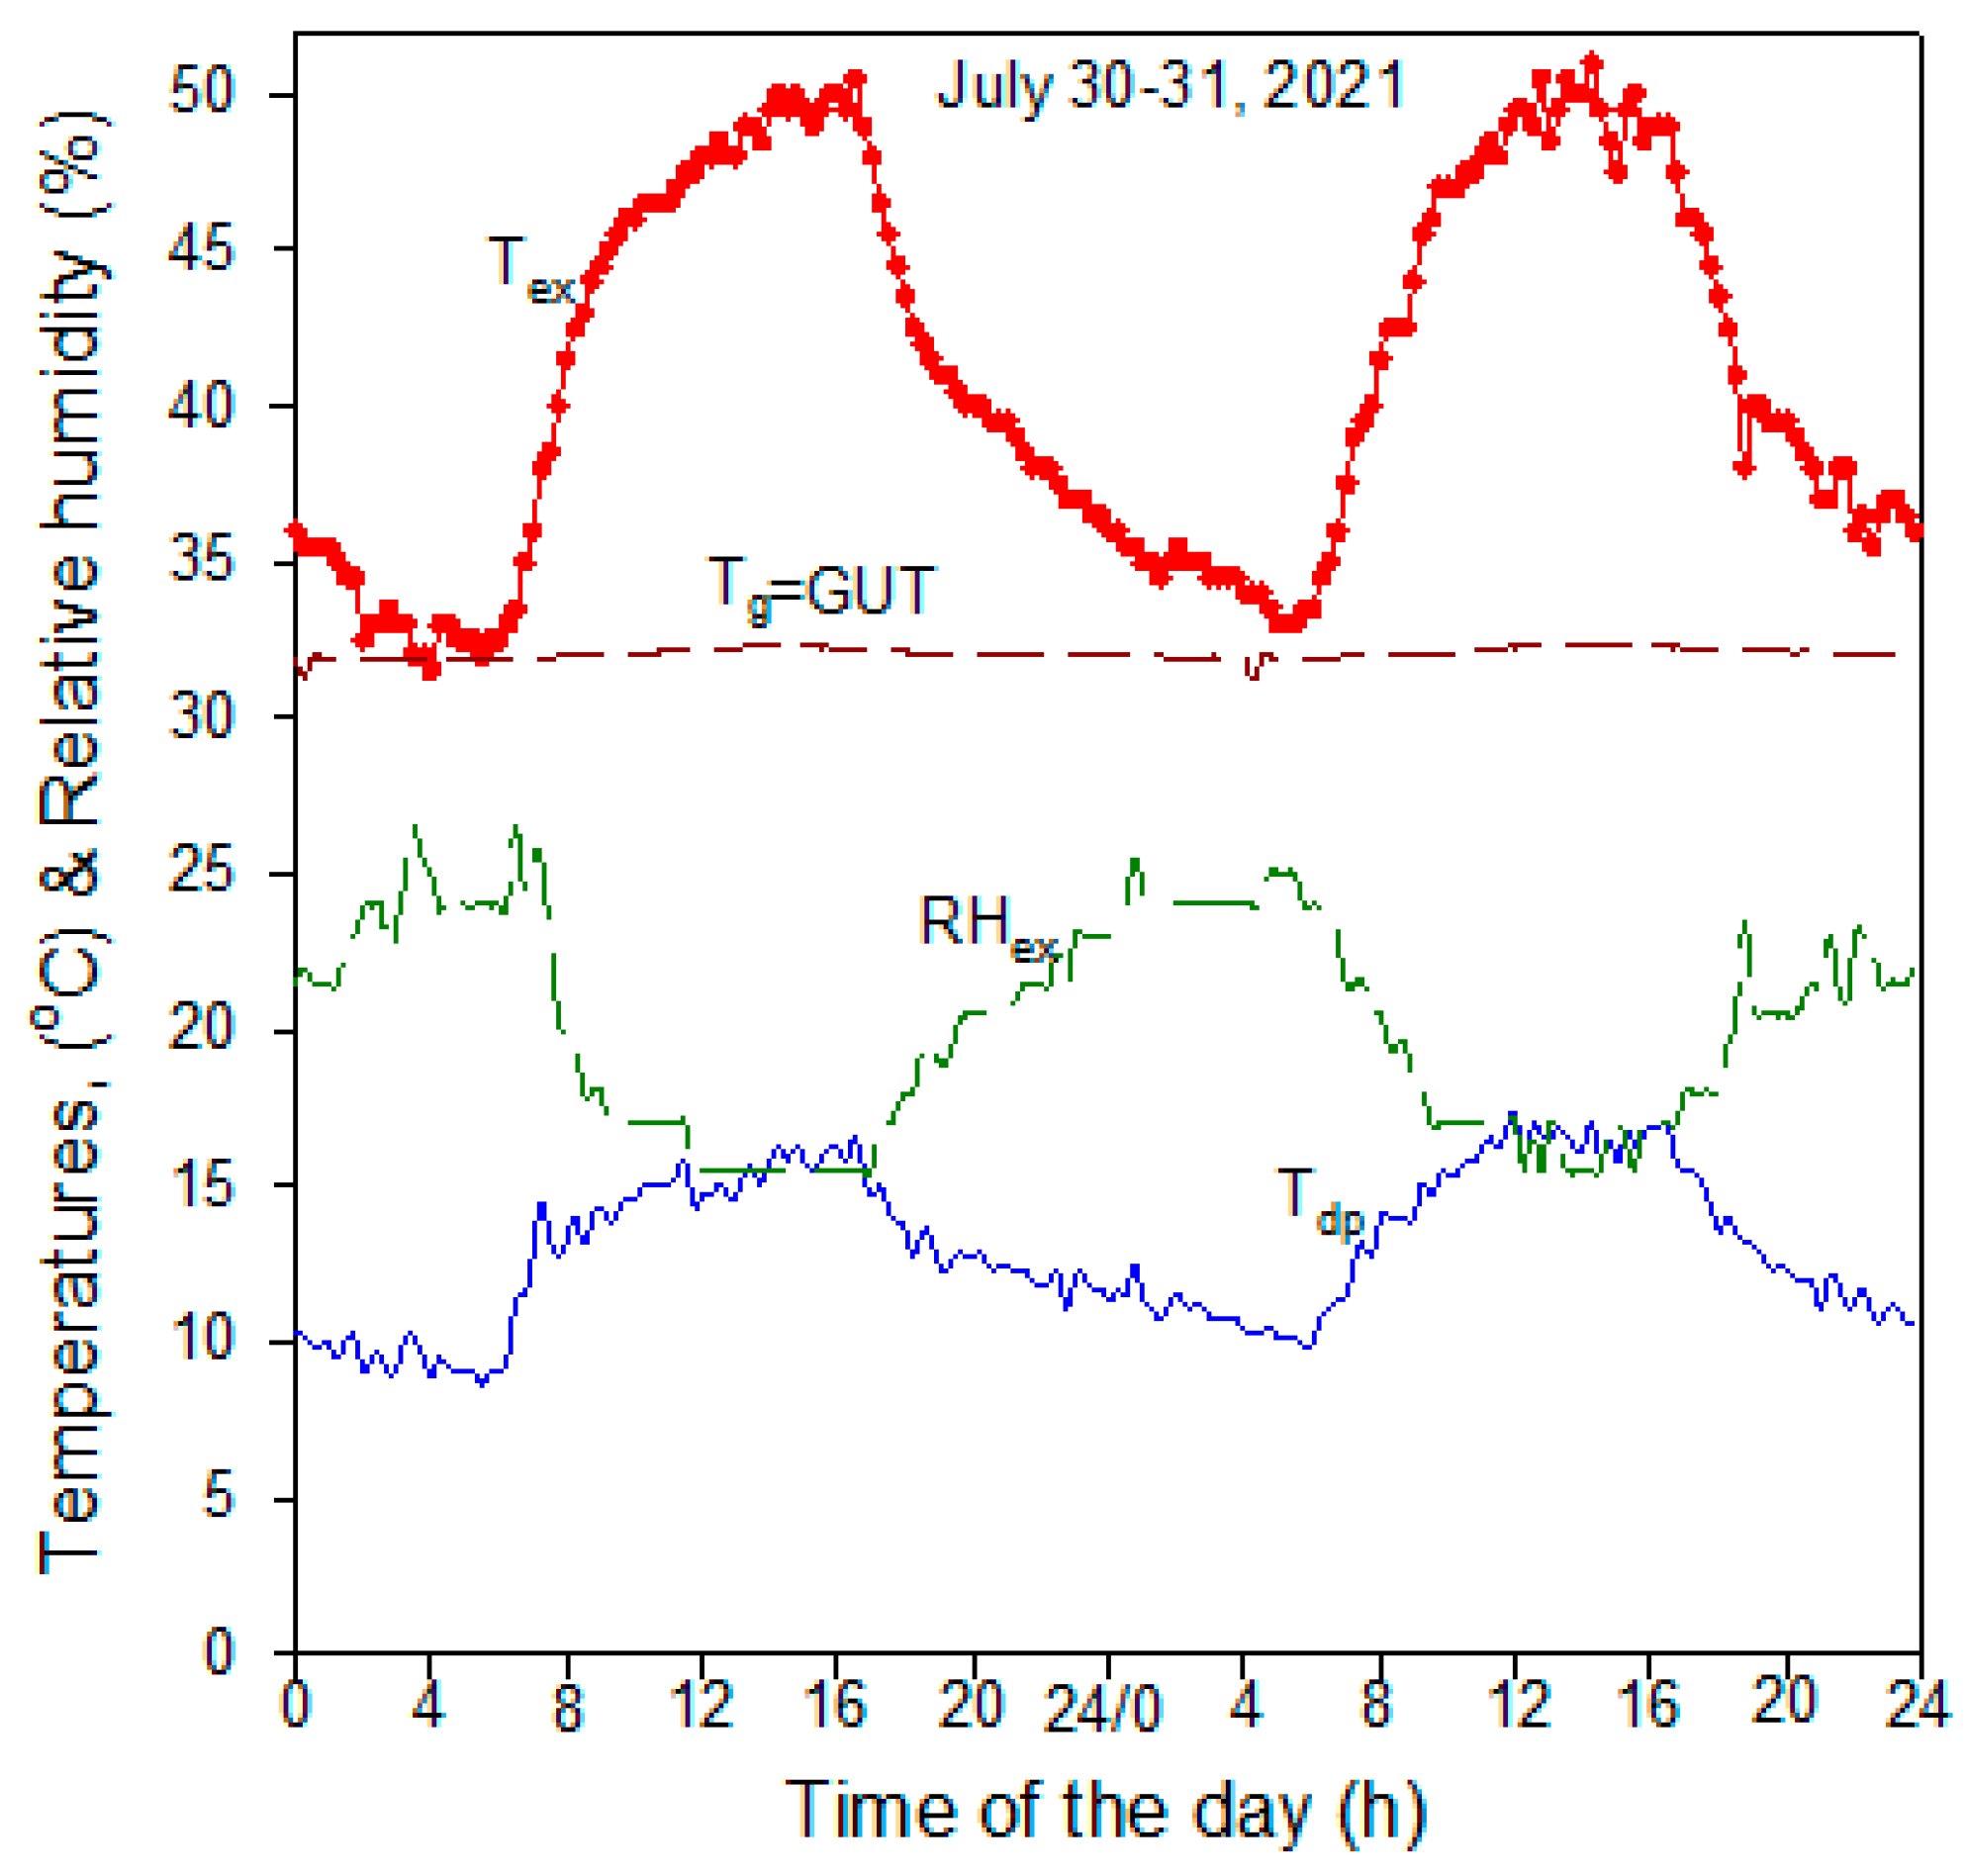
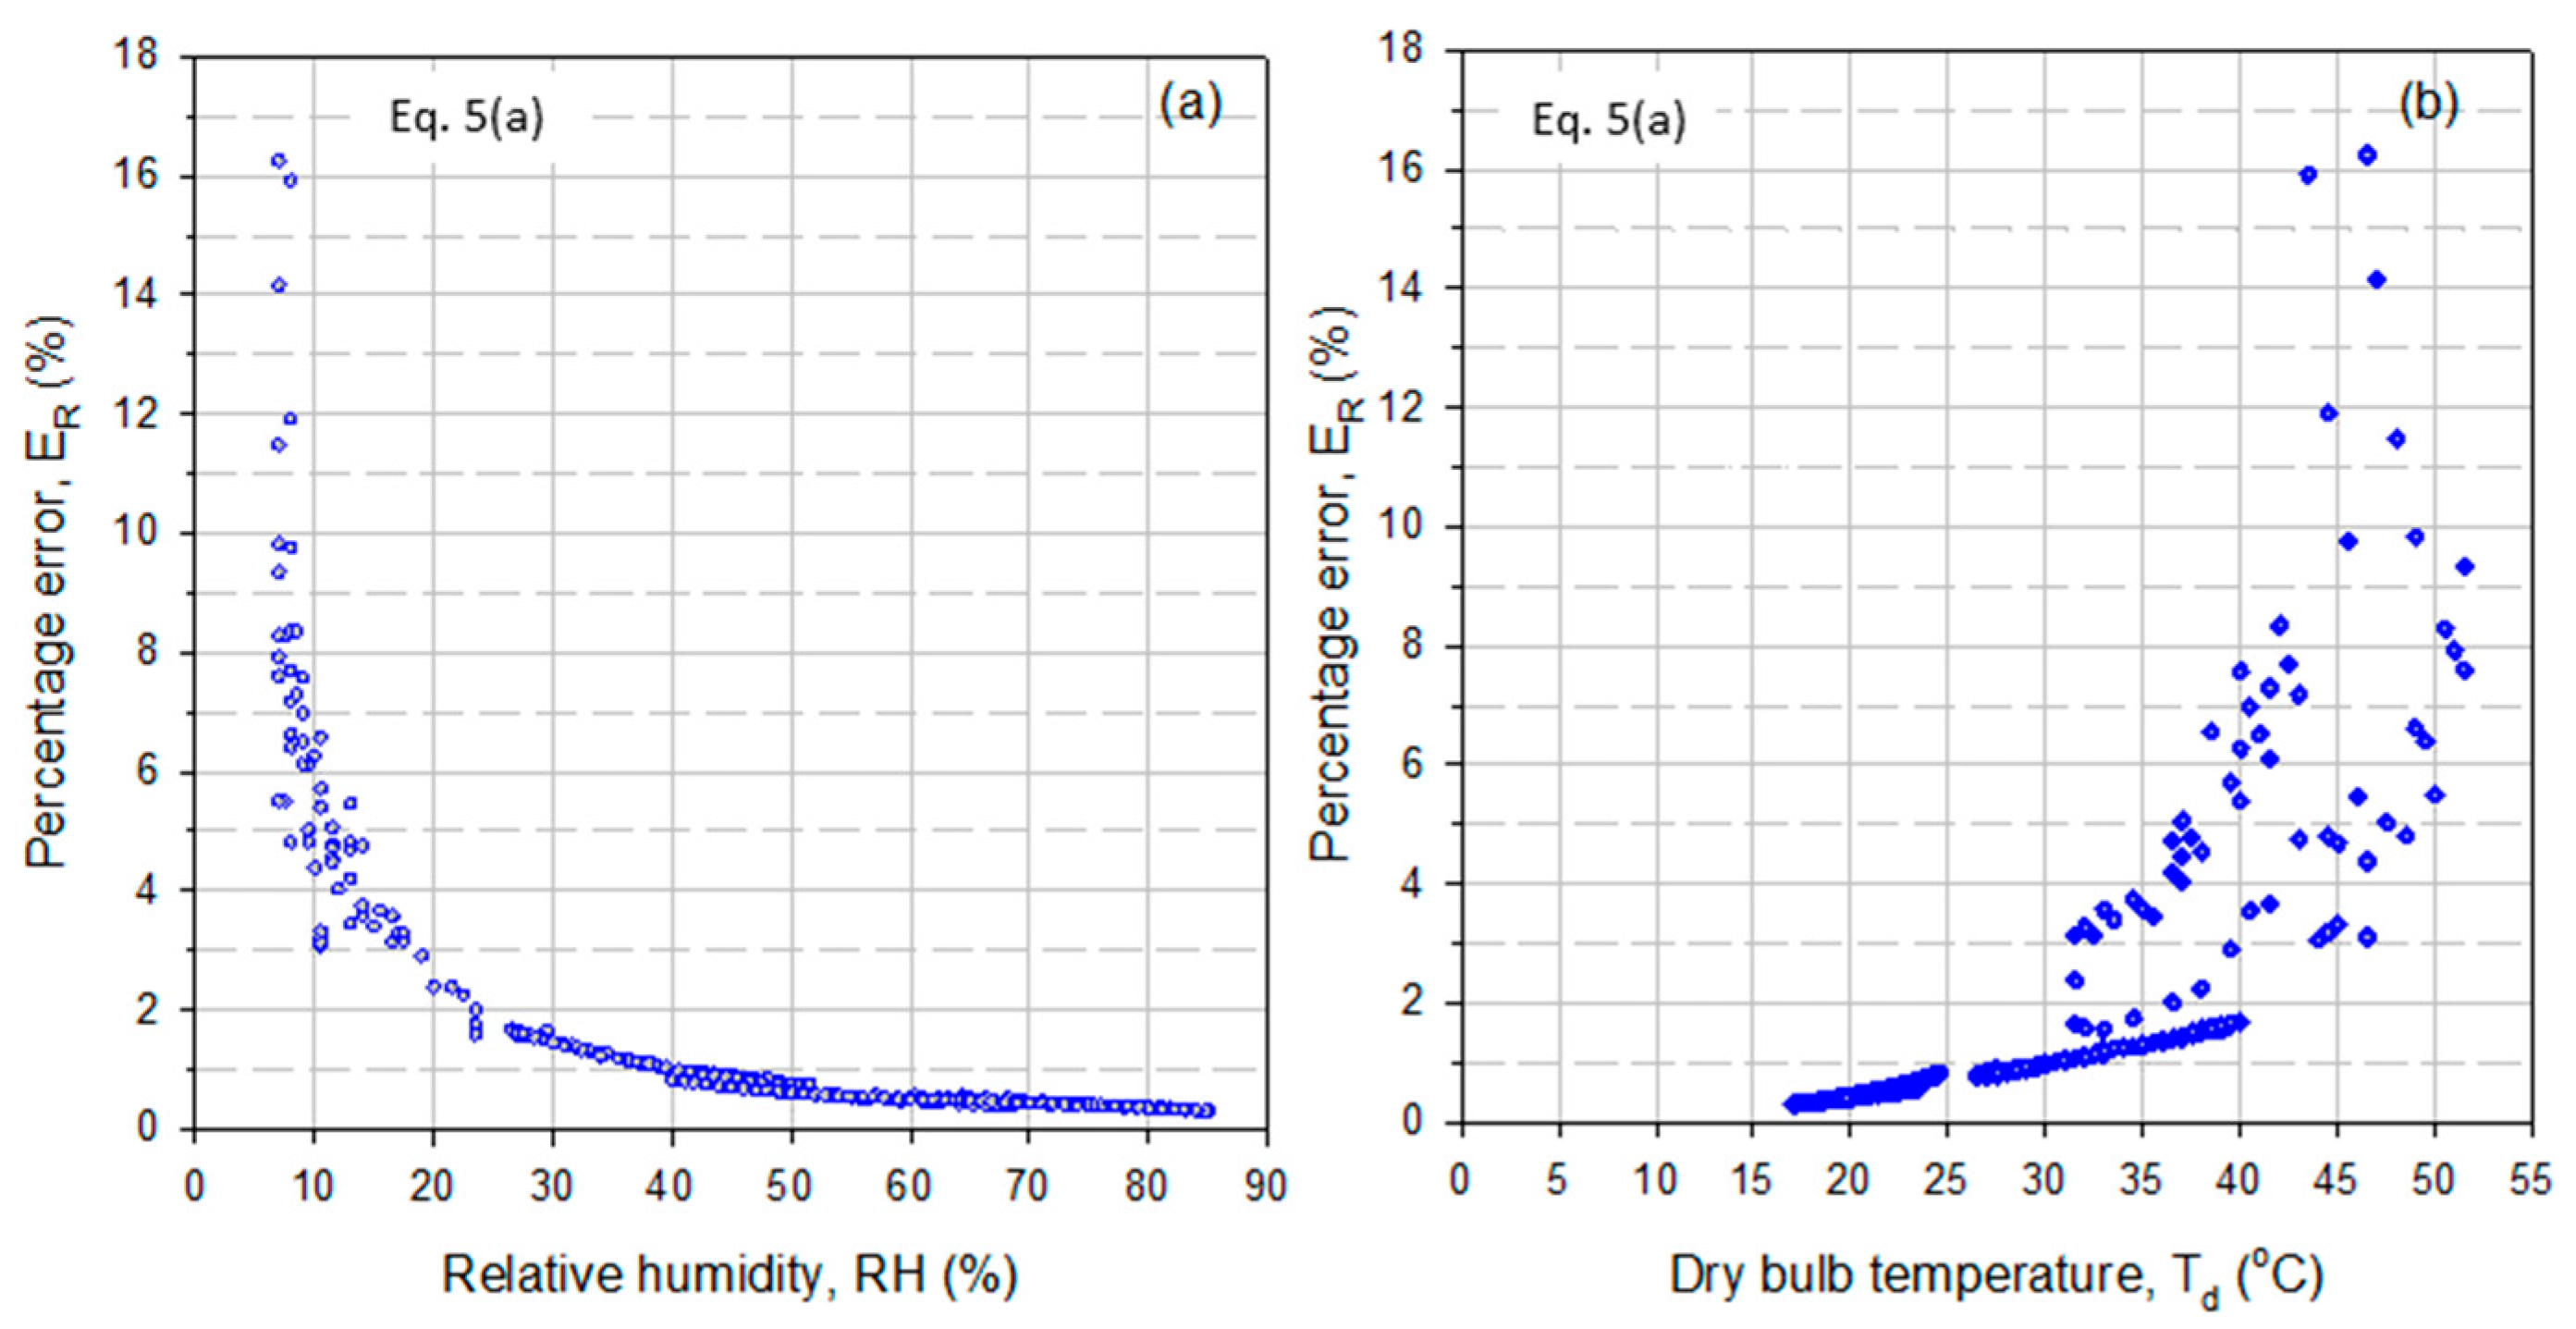
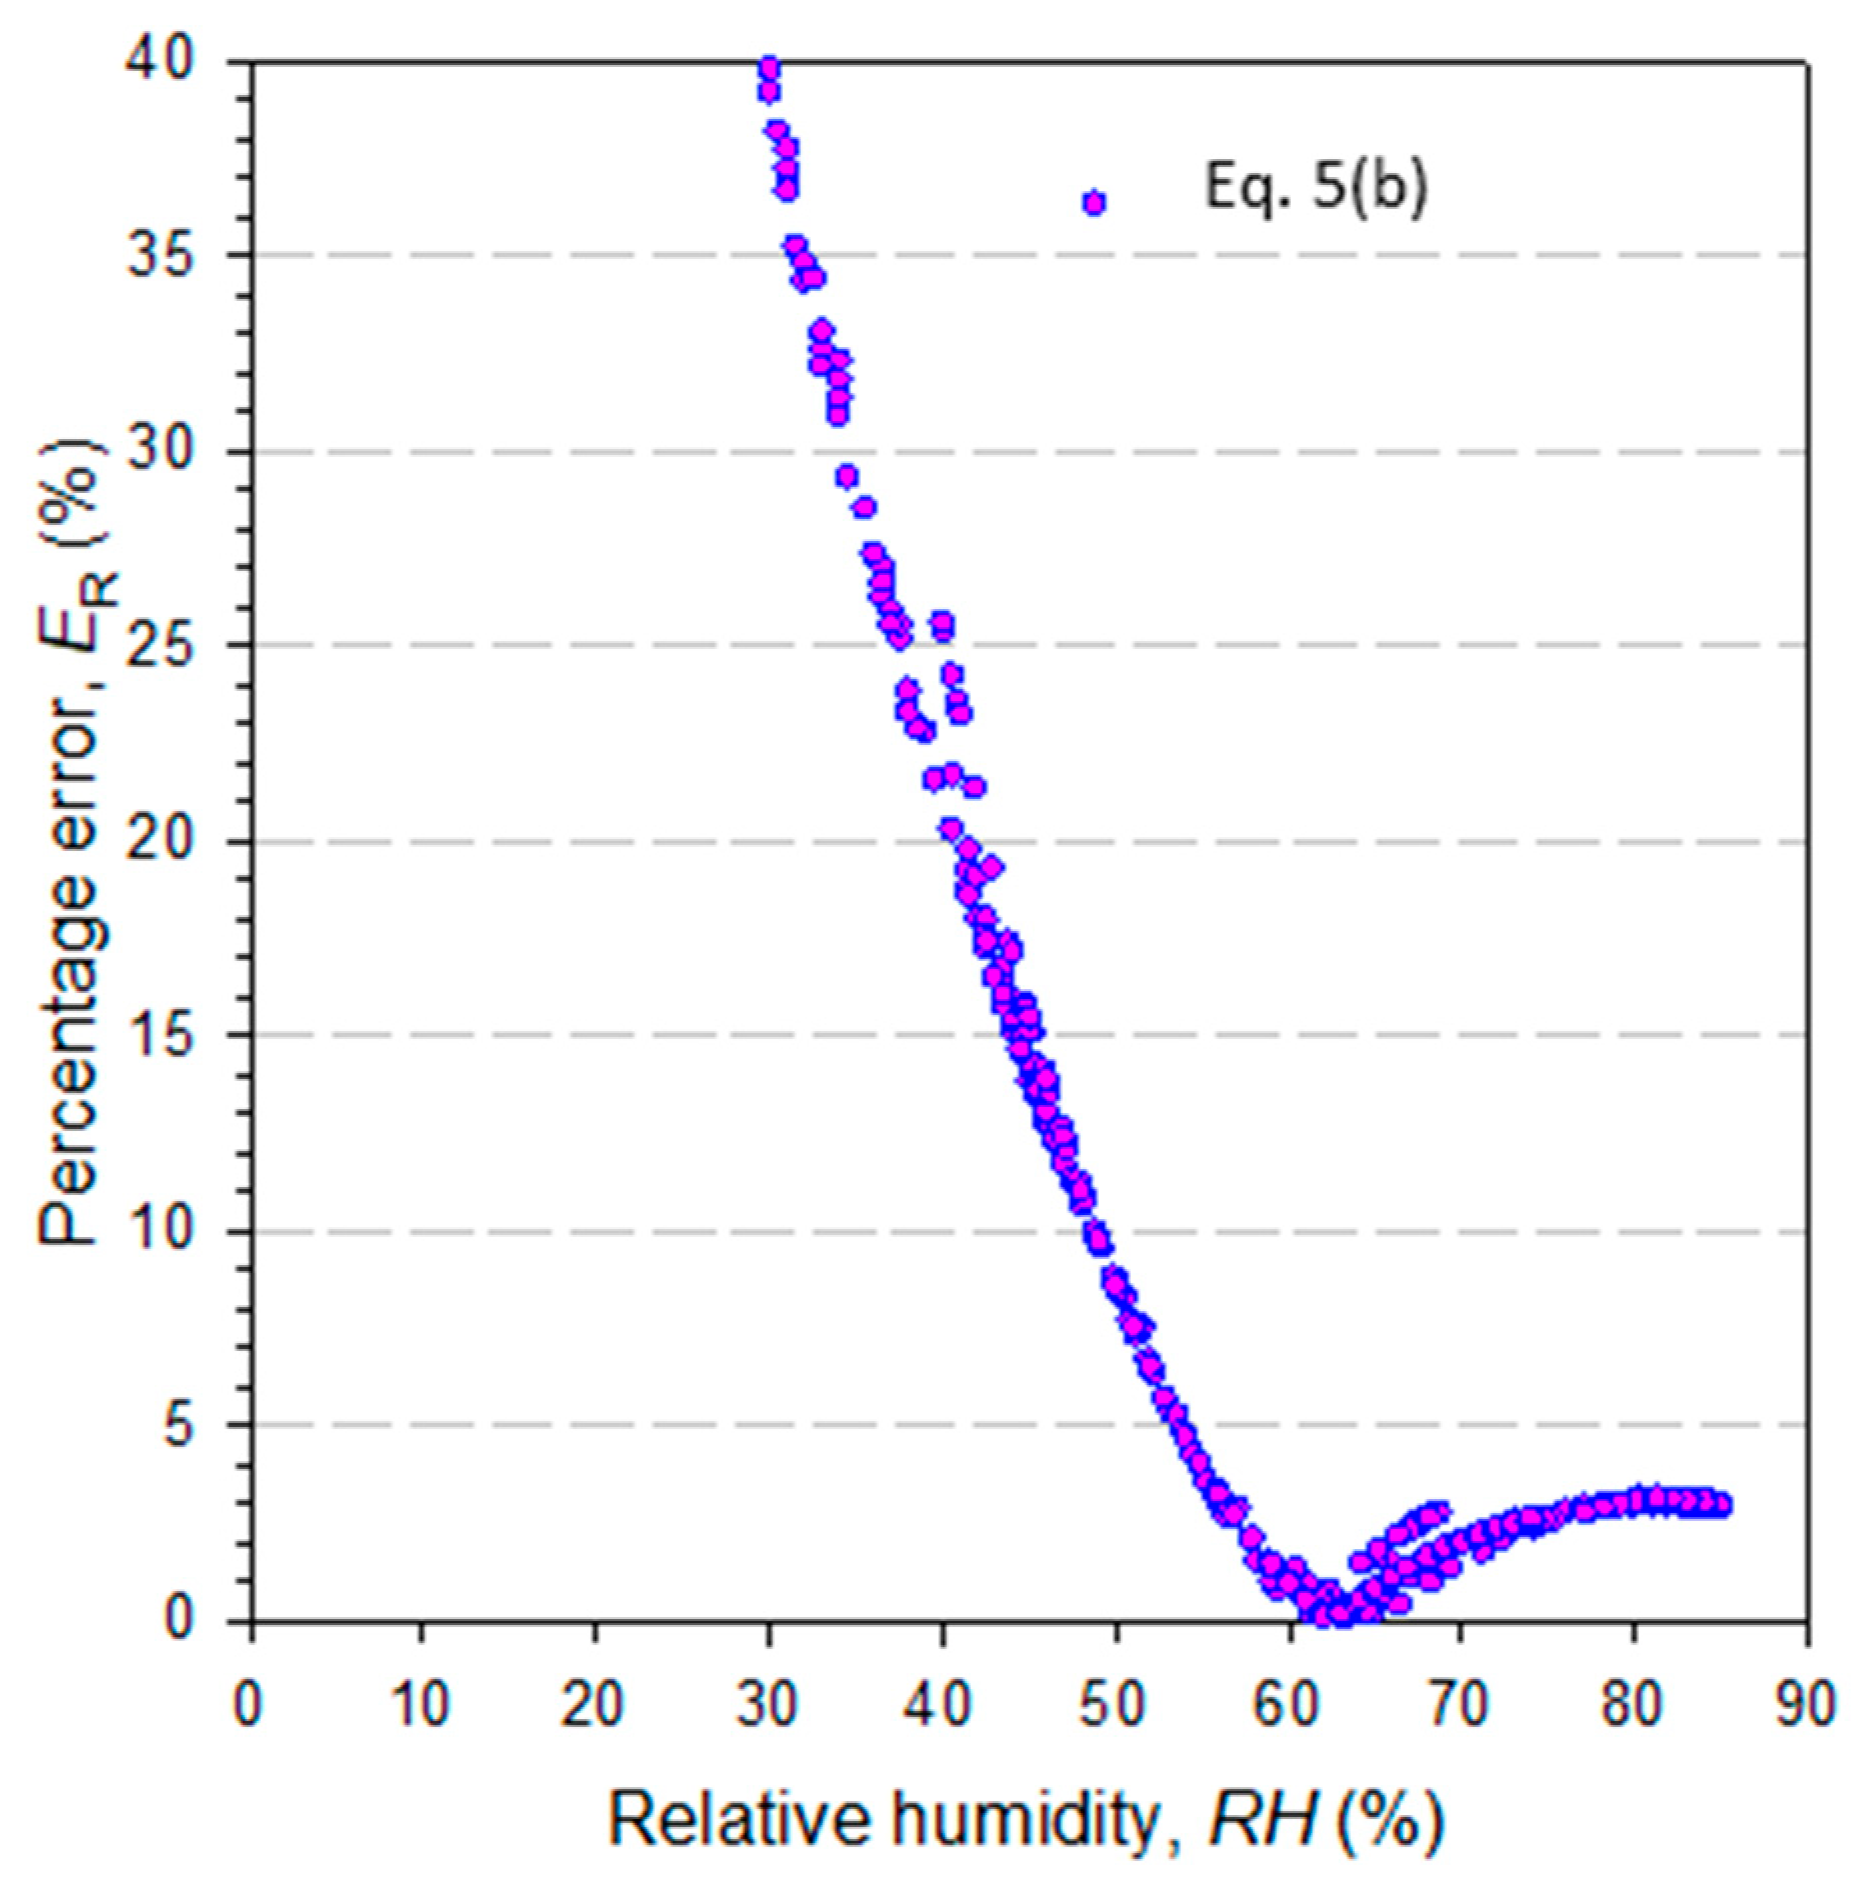
3.2. Possibility of Condensation in the EAHE Pipes
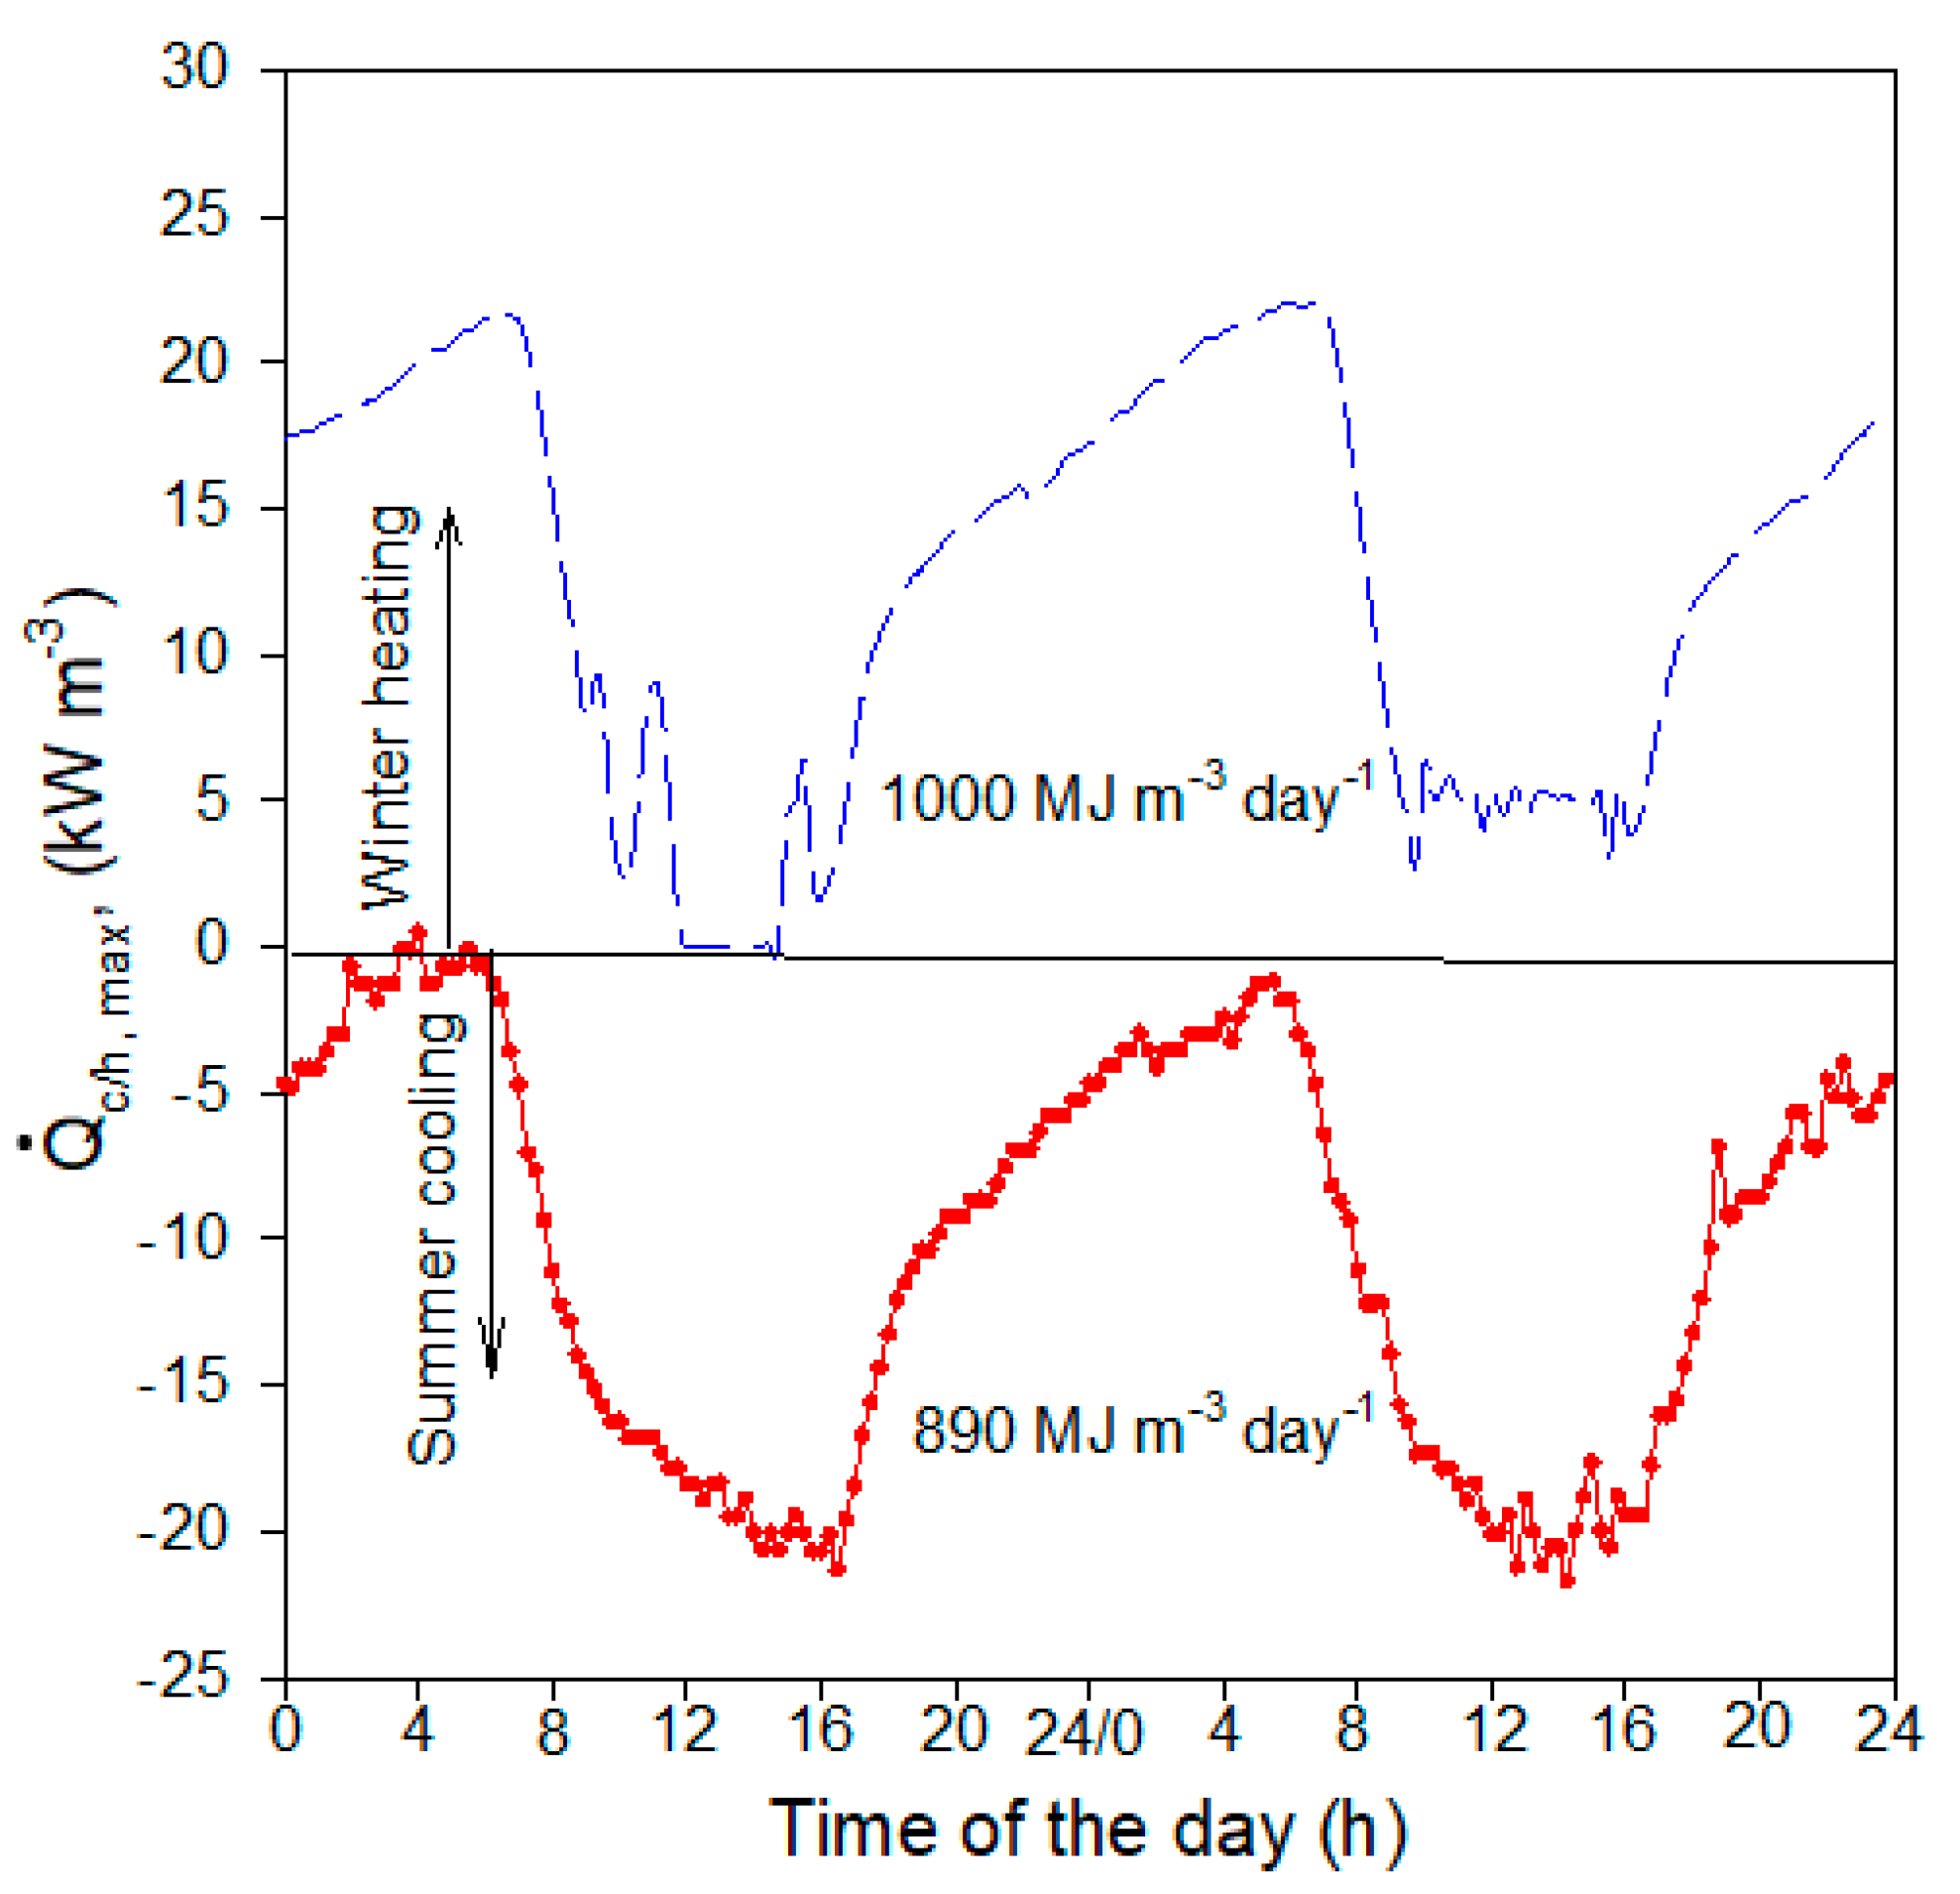
3.3. Maximum Cooling/Heating Capacity
4. Conclusions
Author Contributions
Funding
Acknowledgments
Conflicts of Interest
Nomenclature
| Symbol | Description | (unit) |
| Inner surface area of EAHE pipe | (m2) | |
| Specific heat of flowing air through EAHE pipes | (J kg−1 °C−1) | |
| d | Inner diameter of the EAHE pipes | (m) |
| ER | Percentage error | (%) |
| Convective heat transfer coefficient between inner surface of EAHE pipe and flowing air | (W m−2 °C−1) | |
| k | Thermal conductivity of flowing air | (W m−1 °C−1) |
| L | Length of one EAHE pipe | (m) |
| Mass flow rate of flowing air through EAHE pipes | (kg s−1) | |
| Nusselt number | ) | |
| Pa | Actual water vapor pressure | (Pa) |
| Prandtl number | ) | |
| Ps | Saturation water vapor pressure | (Pa) |
| Cooling/heating capacity | (W) | |
| Cooling/heating potential | (J) | |
| Reynolds number | ) | |
| RH | Relative humidity of air | (%) |
| RHex | Relative humidity of air exhausted from the greenhouse | (%) |
| t | Time | (s; day; month) |
| Tamp | Amplitude of the annual ground surface temperature | (°C) |
| Td | Dry bulb temperature of air or ambient temperature (Tam = Td) | (°C) |
| Tdp | dew point temperature of flowing air in the EAHE pipe | (°C) |
| Tex | Temperature of air exhausted from the greenhouse | (°C) |
| Underground soil temperature | (°C) | |
| Tin | Inlet hot/cold air temperature to the EAHE pipes | (°C) |
| Tm | Mean ground surface temperature, annual average | (°C) |
| Outlet hot/cooled air temperature from the EAHE pipes | (°C) | |
| Outlet hot/cooled air temperature from the EAHE pipes | (°C) | |
| v | Velocity of flowing air through EAHE Pipe | (m s−1) |
| z | Depth below the soil surface | (m) |
| Greek letter | ||
| αs | Thermal diffusivity of soil | (m2/day) |
| ρ | Density of flowing air through EAHE pipe | (kg m−3) |
| µ | Dynamic viscosity of flowing air through EAHE pipe | (kg m−1 s−1) |
| Interval of time | (s, h, day, etc.) | |
| Abbreviations | ||
| CL-EAHE | Closed-loop earth to air heat exchanger | |
| EAHE | Earth to air heat exchanger | |
| KSA | the Kingdom of Saudi Arabia | |
| OL-EAHE | Open loop earth to air heat exchanger | |
| GUT | Ground undisturbed temperature | (°C) |
References
- Abdel-Ghany, A.M.; Picuno, P.; Al-Helal, I.M.; Alsadon, A.; Ibrahim, A.; Shady, M. Radiometric characterization, solar and thermal radiation in a greenhouse as affected by shading configuration in an arid climate. Energies 2015, 8, 13928–13937. [Google Scholar] [CrossRef] [Green Version]
- Al-Helal, I.M.; Al-Hamdan, A.M. Effect of arid environment on radiative properties of greenhouse polyethylene cover. Sol. Energy 2009, 83, 790–798. [Google Scholar] [CrossRef]
- Alkoaik, F.N.; Al-Faraj, A.A.; Al-Helal, I.M.; Ronnel, B.F.; Mansour, N.I.; Abdel-Ghany, A.M. Toward sustainability in rural areas: Composting palm tree residues in rotation bioreactors. Sustainability 2019, 12, 201. [Google Scholar] [CrossRef] [Green Version]
- El Haj, A.M.; Sadeghzadeh, M.; Ahmadi, M.H.; Al-Shabi, M.; Albawab, M.; Anvari-Moghaddam, A.; Bani-Hani, E. Space cooling using geothermal single-effect water/lithium bromide absorption chiller. Energy Sci. Eng. 2021, 9, 1747–1760. [Google Scholar] [CrossRef]
- El Haj, A.M.; Aryanfar, Y.; Radman, S.; Yousef, B.; Pakatchian, M. Energy and exergy analyses of single flash geothermal power plant at optimum separator temperature. Int. J. Low-Carbon Technol. 2021, 16, 873–881. [Google Scholar]
- El Haj, A.M.; Aryanfar, Y.; Javaherian, A.; Khosravi, A.; Aghaei, K.; Hosseinzadeh, S.; Pabon, J.; Mahmoudi, S.M.S. Energy, exergy, economic and exergoenvironmental analyses of transcritical CO2 cycle powered by single flash geothermal power plant. Int. J. Low-Carbon Technol. 2021, 16, 1504–1518. [Google Scholar] [CrossRef]
- Demirbas, A.; Alidrisi, H.; Ahmed, W.; Sheikh, M.H. Potential of geothermal energy in the Kingdom of Saudi Arabia. Energy Sources Part A Recovery Util. Environ. Eff. 2016, 38, 2238–2243. [Google Scholar] [CrossRef]
- Lashin, A.; Al Arifi, N. Geothermal energy potential of southwestern of Saudi Arabia “exploitation and possible power generation”: A case study at AlKhouba area-Jazan. Renew. Sustain. Energy Rev. 2014, 30, 771–789. [Google Scholar] [CrossRef]
- Bharadwaj, S.S.; Bansal, N.K. Temperature distribution inside ground for various surface conditions. Build. Environ. 1981, 16, 183–192. [Google Scholar] [CrossRef]
- Vidhi, R. A review of underground soil and night sky as passive heat sink: Design configurations and models. Energies 2018, 11, 2941. [Google Scholar] [CrossRef] [Green Version]
- Díaz-Hernández, H.P.; Macias-Melo, E.V.; Aguilar-Castro, K.M.; Hernández-Pérez, I.; Xamán, J.; Serrano-Arellano, J.; López-Manrique, L.M. Experimental study of an earth to air heat exchanger (EAHE) for warm humid climatic conditions. Geothermics 2020, 84, 101741. [Google Scholar] [CrossRef]
- Hermes, V.F.; Ramalho, J.V.A.; Rocha, L.A.O.; Santos, E.D.; Marques, W.C.; Costi, J.; Rodrigues, M.K.; Isoldi, L.A. Further realistic annual simulations of earth-air heat exchangers installations in a coastal city. Sustain. Energy Technol. Assess. 2020, 37, 100603. [Google Scholar] [CrossRef]
- Bisoniya, T.S. Design of earth–air heat exchanger system. Geotherm Energy 2015, 3, 18. [Google Scholar] [CrossRef] [Green Version]
- Cao, S.; Li, F.; Li, X.; Yang, B. Feasibility analysys of earth-air heat exchanger (EAHE) in a sports and culture centre in Tianjin, China. Case Stud. Therm. Eng. 2021, 26, 101654. [Google Scholar] [CrossRef]
- Le, A.T.; Wang, L.; Wang, Y.; Li, D. Measurement investigation on the feasibility of shallow geothermal energy for heating and cooling applied in agricultural greenhouses of Shouguang City: Ground temperature profiles and geothermal potential. Inf. Process. Agric. 2021, 8, 251–269. [Google Scholar] [CrossRef]
- Hebbal, B.; Marif, Y.; Hamdani, M.; Belhadj, M.M.; Bouguettaia, H.; Bechki, D. The geothermal potential of underground buildings in hot climates: Case of southern Algeria. Case Stud. Therm. Eng. 2021, 28, 101422. [Google Scholar] [CrossRef]
- Tiwari, G.N.; Akhtar, M.A.; Shukla, A.; Emran Khan, M. Annual thermal performance of greenhouse with an earth-air heat exchanger: An experimental validation. Rene Energy 2006, 31, 2432–2446. [Google Scholar] [CrossRef]
- Ghosal, M.K.; Tiwari, G.N.; Das, D.K.; Pandey, K.P. Modeling and comparative thermal performance of ground air collector and earth air heat exchanger for heating of greenhouse. Energy Build. 2005, 37, 613–621. [Google Scholar] [CrossRef]
- Stanciu, D.; Stanciu, C.; Paraschiv, I. Mathematical links between optimum solar collector tilts in isotropic sky for intercepting maximum solar irradiance. J. Atmos. Sol.-Terr. Phys. 2016, 137, 58–65. [Google Scholar] [CrossRef]
- Ozgener, O.; Ozgener, L.; Goswami, D.Y. Experimental prediction of total thermal resistance of a closed loop EAHE for greenhouse cooling system. Int. Commun. Heat Mass Transf. 2011, 38, 711–717. [Google Scholar] [CrossRef]
- Ozgener, O.; Ozgener, L.; Goswami, D.Y. Seven years energetic and exergetic monitoring for vertical and horizontal EAHE assisted agricultural building heating. Renew. Sustain. Energy Rev. 2017, 80, 175–184. [Google Scholar] [CrossRef]
- Hepbasli, A. Low exergy modelling and performance analysis of greenhouses coupled to closed earth-to-air heat exchangers (EAHEs). Energy Build. 2013, 64, 224–230. [Google Scholar] [CrossRef]
- Bisoniya, T.S.; Kumar, A.; Baredar, P. Experimental and analytical studies of earth-air heat exchanger (EAHE) systems in India: A review. Renew. Sustain. Energy Rev. 2013, 19, 238–246. [Google Scholar] [CrossRef]
- Kasuda, T.; Archenbach, P.R. Earth temperature and thermal diffusivity at selected stations in the United States. ASHRAE Trans. 1965, 71, 61–74. [Google Scholar]
- NASA Technical Note, NASA TN D-8401, Equations for the Determination of Humidity from Dew Point Ad Psychometric Data. Available online: https://www.nasa.gov/centers/dryden/pdf/87878main_H937.pdf (accessed on 14 August 2021).
- Dew Point Temperature—An Overview, Science Direct Topics. Available online: https://www.sciencedirect.com/topics/engineering/dewpoint-temperature (accessed on 17 July 2021).
- Buck, A.L. New equations for computing vapour pressure and enhancement factor. J. Appl. Meteorol. 1981, 20, 1527–1532. [Google Scholar] [CrossRef] [Green Version]


Publisher’s Note: MDPI stays neutral with regard to jurisdictional claims in published maps and institutional affiliations. |
© 2022 by the authors. Licensee MDPI, Basel, Switzerland. This article is an open access article distributed under the terms and conditions of the Creative Commons Attribution (CC BY) license (https://creativecommons.org/licenses/by/4.0/).
Share and Cite
Al-Helal, I.; Alsadon, A.; Marey, S.; Ibrahim, A.; Shady, M.; Abdel-Ghany, A. Geothermal Energy Potential for Cooling/Heating Greenhouses in Hot Arid Regions. Atmosphere 2022, 13, 105. https://doi.org/10.3390/atmos13010105
Al-Helal I, Alsadon A, Marey S, Ibrahim A, Shady M, Abdel-Ghany A. Geothermal Energy Potential for Cooling/Heating Greenhouses in Hot Arid Regions. Atmosphere. 2022; 13(1):105. https://doi.org/10.3390/atmos13010105
Chicago/Turabian StyleAl-Helal, Ibrahim, Abdullah Alsadon, Samy Marey, Abdullah Ibrahim, Mohamed Shady, and Ahmed Abdel-Ghany. 2022. "Geothermal Energy Potential for Cooling/Heating Greenhouses in Hot Arid Regions" Atmosphere 13, no. 1: 105. https://doi.org/10.3390/atmos13010105