Article

A Comparison Analysis of Causative Impact of PM2.5 on Acute Exacerbation of Chronic Obstructive Pulmonary Disease (COPD) in Two Typical Cities in China

1
Engineering Technology Center of Remote Sensing Big Data Application of Guangdong Province, Guangdong Open Laboratory of Geospatial Information Technology and Application, Key Laboratory of Guangdong for Utilization of Remote Sensing and Geographical Information System, Guangzhou Institute of Geography, Guangdong Academy of Sciences, Guangzhou 510070, China
2
Southern Marine Science and Engineering Guangdong Laboratory, Guangzhou 511458, China
3
State Key Laboratory of Resources and Environmental Information System, Institute of Geographic Sciences and Natural Resources Research, Chinese Academy of Sciences, Beijing 100101, China
4
Jiangsu Center for Collaborative Innovation in Geographical Information Resource Development and Application, Nanjing Normal University, Nanjing 210023, China
5
College of Resources and Environment, University of Chinese Academy of Sciences, Beijing 100101, China
*
Author to whom correspondence should be addressed.
Atmosphere 2021, 12(8), 970; https://doi.org/10.3390/atmos12080970
Submission received: 17 June 2021 / Revised: 24 July 2021 / Accepted: 26 July 2021 / Published: 28 July 2021
(This article belongs to the Special Issue Health Effects of Urban Atmospheric Aerosols)

Abstract

:
Chronic obstructive pulmonary disease (COPD) is a major and increasingly prevalent respiratory health problem worldwide and the fine particulate matter (PM2.5) is now becoming a rising health threat to it. This study aims to conduct a comparison analysis of health effect on acute exacerbation of COPD (AECOPD) associated with PM2.5 exposure in two typical cities (Beijing and Shenzhen) with different levels of PM2.5 pollution. Both correlational relationship and causal connection between PM2.5 exposure and AECOPD are investigated by adopting a time series analysis based on the generalized additive model (GAM) and convergent cross mapping (CCM). The results from GAM indicate that a 10 μg/m3 increase in PM2.5 concentration is associated with 2.43% (95% CI, 0.50–4.39%) increase in AECOPD on Lag0-2 in Beijing, compared with 6.65% (95% CI, 2.60–10.87%) on Lag0-14 in Shenzhen. The causality detection with CCM reveals similar significant causative impact of PM2.5 exposure on AECOPD in both two study areas. Findings from two methods agree that PM2.5 has non-negligible health effect on AECOPD in both two study areas, implying that air pollution can cause adverse consequences at much lower levels than common cognition. Our study highlights the adverse health effect of PM2.5 on people with COPD after exposure to different levels of PM2.5 and emphasizes that adverse effect in area with relative low pollution level cannot be overlooked. Governments in both high-pollution and low-pollution cities should attach importance to the adverse effects of PM2.5 on humans and take corresponding measures to control and reduce the related losses.

1. Introduction

Chronic obstructive pulmonary disease (COPD) is a major and increasingly prevalent respiratory health problem in the global, with a current estimate 700 million patients and 3.2 million deaths worldwide [1,2]. So far, smoking has been recognized as the most common factor in the etiology of COPD. Other associated factors, including dusts, gases, biological and chemical exposures, have also been found in both smokers and nonsmokers [3,4]. With the deterioration of air quality in recent decades, fine particulate matter (PM2.5) is now becoming a rising health threat to human respiratory system [5]. PM2.5 is an inhalable matter which can be deposited into lower bronchus and lung parenchyma and effect the respiratory system by inducing inflammatory reaction, which is known to cause acute exacerbations of respiratory disease [6]. Recently, PM2.5 has been proven to be a primary detrimental factor for COPD by plentiful epidemiological studies [7,8,9,10]. In addition, there are also substantial evidences indicating that short-term exposure to PM2.5 can lead to acute exacerbation and even an increased risk of death in COPD patients [11,12,13,14]. A panel study in Beijing [15] also finds out that COPD patients are more susceptible to respiratory inflammation following PM2.5 exposure than individuals without COPD.
It is reported that the morbidity and mortality rate of COPD is increasing in the Asia-Pacific regions [16,17]. In China, the prevalence of COPD in the population over 40 years old is estimated to be 13.7% [18], making it a health issue that should not be overlooked. In addition, COPD usually brings a substantial economic burden to healthcare services [19]. According to the National Heart Lung Blood Institute, the direct cost of COPD was estimated to be $29.5 billion in the U.S. in 2009 [20]. In Singapore, the average direct cost of COPD was $9.9 million per year from 2005 to 2009 [17]. Therefore, controlling the burden of COPD can be beneficial to effectively alleviate the pressure on healthcare services and social economy. To reduce the disease burden of COPD, it is important to explore the adverse health effects on COPD patients associated with exposure to PM2.5 pollution. Several time series studies have been conducted in this purpose. A case crossover study in Ontario, U.S. [21] observed positive associations of COPD with PM2.5, indicating a 7.00% (95% confidence interval, CI, 6.00–8.00%) increase in COPD exacerbation cases associated to 3.4 μg/m3 increase in PM2.5 concentration. Similar results were also detected in China. Ko et al. [22] observed that a 10 μg /m3 increase in the 5-day cumulative average concentration of PM2.5 was associated with 3.10% (95% CI, 2.60–3.60%) increases in COPD hospital visits, in Hongkong. Bao et al. [23] found that a 10 μg/m3 increase in PM2.5 concentration at a lag of 0–7 days was associated with 1.190% (95% CI, 0.176–2.215%) increase in hospital outpatients for COPD in Lanzhou. A newly conducted case-crossover study in Taiwan [24] showed that each interquartile range increase in PM2.5 was associated with 6.6% (95% CI, 0.5–13.0%) increase in risk of COPD exacerbation.
However, there are still some insufficiencies in current studies. On one hand, related studies in Chinese cities are limited and lack comparison among cities with different PM2.5 levels. On the other hand, most of the studies mainly focus on the correlational relationship between the disease and air pollutions revealed by relative risk (RR) or odds ratio, the causal connection between the two is unknown. In this study, we intend to explore the adverse health effect of PM2.5 on acute exacerbation of COPD (AECOPD) in Beijing and Shenzhen, two typical cities with large differences in PM2.5 concentration. In addition, to reveal the correlational relationship between AECOPD and PM2.5 by adopting a regression model-based lag effect analysis, we also detect the causal connection between the two by applying a model-free method.

2. Materials and Methods

2.1. Study Areas

To perform a comparison analysis on health effect associated with different levels of PM2.5, two typical study areas, Beijing urban area and Shenzhen City are selected. Beijing, as the capital city of China, is the national political and economic center. With the development of Jing-Jin-Ji metropolitan area, which is dominated by heavy industry, air quality in Beijing has suffered a severe deterioration in recent decades [25]. Haze weather occurs frequently and the adverse health effect of air pollution, especially PM2.5, has drawn great public attention. Therefore, Beijing urban area (including Dongcheng, Xicheng, Chaoyang, Haidian, Fengtai, Shijingshan), is chosen as the typical area with high PM2.5 level in this study for comparison. Shenzhen, a young city in China, was once praised as an Environmental Protection Model City in 1997 for its favorable air environment. Playing an important role in the Pearl River Delta region, which is one of the most developed regions with the highest aggregation of industry in China, air quality in Shenzhen has also deteriorated and affected the living condition of local citizens in some way [26,27]. Nevertheless, compared to Beijing, PM2.5 level in Shenzhen is still considered quite low [28]. In this study, Shenzhen City is chosen as the typical area with low PM2.5 for comparison.

2.2. Data Collection

Daily AECOPD records were obtained at ten comprehensive hospitals in Beijing urban area (from Xu’s study [29]) and 66 major hospitals in Shenzhen City (Figure 1), from 1 January 2013 to 31 December 2013. Monitoring data of PM2.5 was gathered from Beijing Environmental Protection Bureau and Shenzhen Environmental Monitoring Center, including data from 17 monitoring sites located in Beijing urban area and 19 sites in Shenzhen City (Figure 1), following the Chinese National Ambient Air Quality Standards (GB3095-2012) [30]. Daily-averaged concentration is used to represent the degree of the exposure to PM2.5. There are some missing values in the 17 monitoring sites in Beijing which may cause some gaps in the time series analysis. To fill them up, we applied the linear interpolation method by using a three-day average. In addition, to control for the confounding factors, we also collected the weather conditions during the same period, involving daily mean temperature (°C) and relative humidity (%), from the official website of the Chinese Meteorological Bureau.

2.3. Methods

2.3.1. Lag Effect Analysis

The core model used in lag effect analysis is a generalized additive model (GAM) which is suitable for exploring and fitting non-linear relationship between the response and the predictor variables. In this study, we use it to investigate the exposure-response relationship between the exposure to PM2.5 and the occurrence of AECOPD. However, the adverse health effect of the exposure is not limited to the period when the exposure occurs. There could be a lag before a response in human body. Therefore, we combined the GAM with a distributed lag nonlinear model (DLNM) [31] which can provide a detailed time-course representation of the lag procedure, to examine the health effect associated with PM2.5. The main advantage of the DLNM is that it allows the model to estimate the overall cumulative lag effect as the sum of the single-day lag effects over the whole selected lag period [32]. In addition, the level of PM2.5, we also added several confounding variables involving the calendar time, week and holiday effect, as well as meteorological variables for improving the model performance [33,34]. The calendar time, temperature and relative humidity are expressed as smoothing spline functions, while the week and holiday effects are added as two dummy variables in the model. Degrees of freedom (df) of smoothing functions are determined by the Akaike’s information criterion. We applied a generalized cross validation to guide the determination of df until the sum of absolute difference got a minimum. In this study, df was set to 7 for calendar time and 3 for temperature and relative humidity in both two study areas to account for the potential nonlinear effects. The final lag effect model is of the following form:
L o g [ E ( Y t ) ] = α + β f ( X t L ) + S ( t i m e , d f ) + β w D O W t + β h H o l i d a y t + S ( Z t , d f )
where t is the day for observation; X t L represents the concentration of PM2.5 with a lag period of L; f ( X t L ) stands for the lag model involving a single-day lag mode and a cumulative lag mode; E ( Y t ) is the expected number of cases on day t; α is the intercept term; β represents the log-RR of cases associated with a unit increase of PM2.5.; S ( t i m e , d f ) and S ( Z t , d f ) are the smoothing splines of calendar time and metrological factors (temperature and relative humidity); DOW and Holiday stand for the week and holiday effects with coefficient β w and β h , respectively.
To perform the analysis, DLNM and Mixed GAM Computation Vehicle (MGCV) packages in R (3.4.0, University of Auckland, Auckland, New Zealand) were used. The outcomes are calculated as RR or percent change in daily counts and at the 95% CI, in association with a unit (10 µg/m3) increase of PM2.5 concentration.

2.3.2. Causative Impact Detection

The causative impact detection is conducted by applying the convergent cross mapping (CCM) method proposed by Sugihara et al. [35]. Previous studies prove that it shows advantage in distinguishing causality from standard correlations based on a time series analysis (at least 25 pairs of observations) [36,37]. In nonlinear dynamic systems, variables are often inseparable and contain multi-dimensional information, making unstable correlation and weak coupling relation common in the correlation relationships of the system. For the most frequently used causality analysis method, the Granger causality analysis [38], it tends to behave poorly in detecting causality in weak-to-moderate coupling relations. Instead, CCM is insensitive to manual setting of parameters and can extract reliable causality between diverse variables, making it more suitable for revealing potential causality in nonlinear dynamic systems [39,40]. In CCM, the complex and nonlinear systems is analyzed through state-space reconstruction and the reconstructed shadow manifold of the two variables corresponds to each other in the time dimension. Giving two time series of variables X{x1,x2,…,xL} and Y{y1,y2,…,yL} (L is the length of time period), CCM algorithm can be conducted in four steps, as follows:
Step One
Reconstruct the shadow manifold, Mx and My, using the lagged-coordinate vectors X and Y, which is:
M x : x ( t ) = x t , x t τ , x t 2 τ , , x t ( E 1 ) τ
M y : y ( t ) = y t , y t τ , y t 2 τ , , y t ( E 1 ) τ
where t ranges from 1 + (E − 1)   τ to L; E is the dimension in which the reconstructed attractor is embedded; τ is the time lag. Assuming there is N pairs of observations, EN − 1 [35].
Step Two
Determine the weight. Since M y is diffeomorphic to M x , there will be synchronous lagged-coordinate vector x ( t ) and its E + 1 nearest neighbors on M x , which can be used to build the weight w i , defined as:
w i = u i j = 1 E + 1 u j
where
u i = e x p ( d [ x ( t ) , x ( t i ) ] d [ x ( t ) , x ( t 1 ) ] ) ,   ( i = 1 , 2 , , E + 1 )
For each x ( t ) , the nearest neighbor search gets a set of distances sorted from the closest to the outermost by an associated set of time {t1,t2,…,tE+1}. The distance is measured as the Euclidean distance between the two vectors.
Step Three
Use the w i to create a cross-mapped estimation of y t by calculating with a weighted mean the nearest neighbors in M y . The cross-mapped estimation is express as:
y ^ t | M x = i = 1 E + 1 w i y t i
Step Four
Calculate the CCM correlation coefficient. The degree of consistency between the cross-mapped estimation and the true value determines the predictive ability of Y on X [37], which can be quantified by Pearson correlation coefficient between original and estimated time-series. It is also referred to as the CCM correlation coefficient ( ρ ), defined as:
ρ Y Y ^ = ρ ( y t , y ^ t | M x )
Meanwhile, a t-statistic for correlation coefficient at a level of significance is calculated as:
t = ρ Y Y ^ S ρ w h e r e   S ρ = 1 ρ Y Y ^ 2 N 2
In CCM method, determining the optimal E and τ is crucial to the analysis. Supposing that Emax is the optimal dimension, the dimensionality generically ranges between (Emax − 1)/2 and Emax, based on Whitney’s theorem [41]. In this study, dimension (E) from the two times series is defined as 2 using the false nearest neighbor method and the value of τ is set to 2 based on the average mutual information criterion for both study areas.

3. Results and Discussion

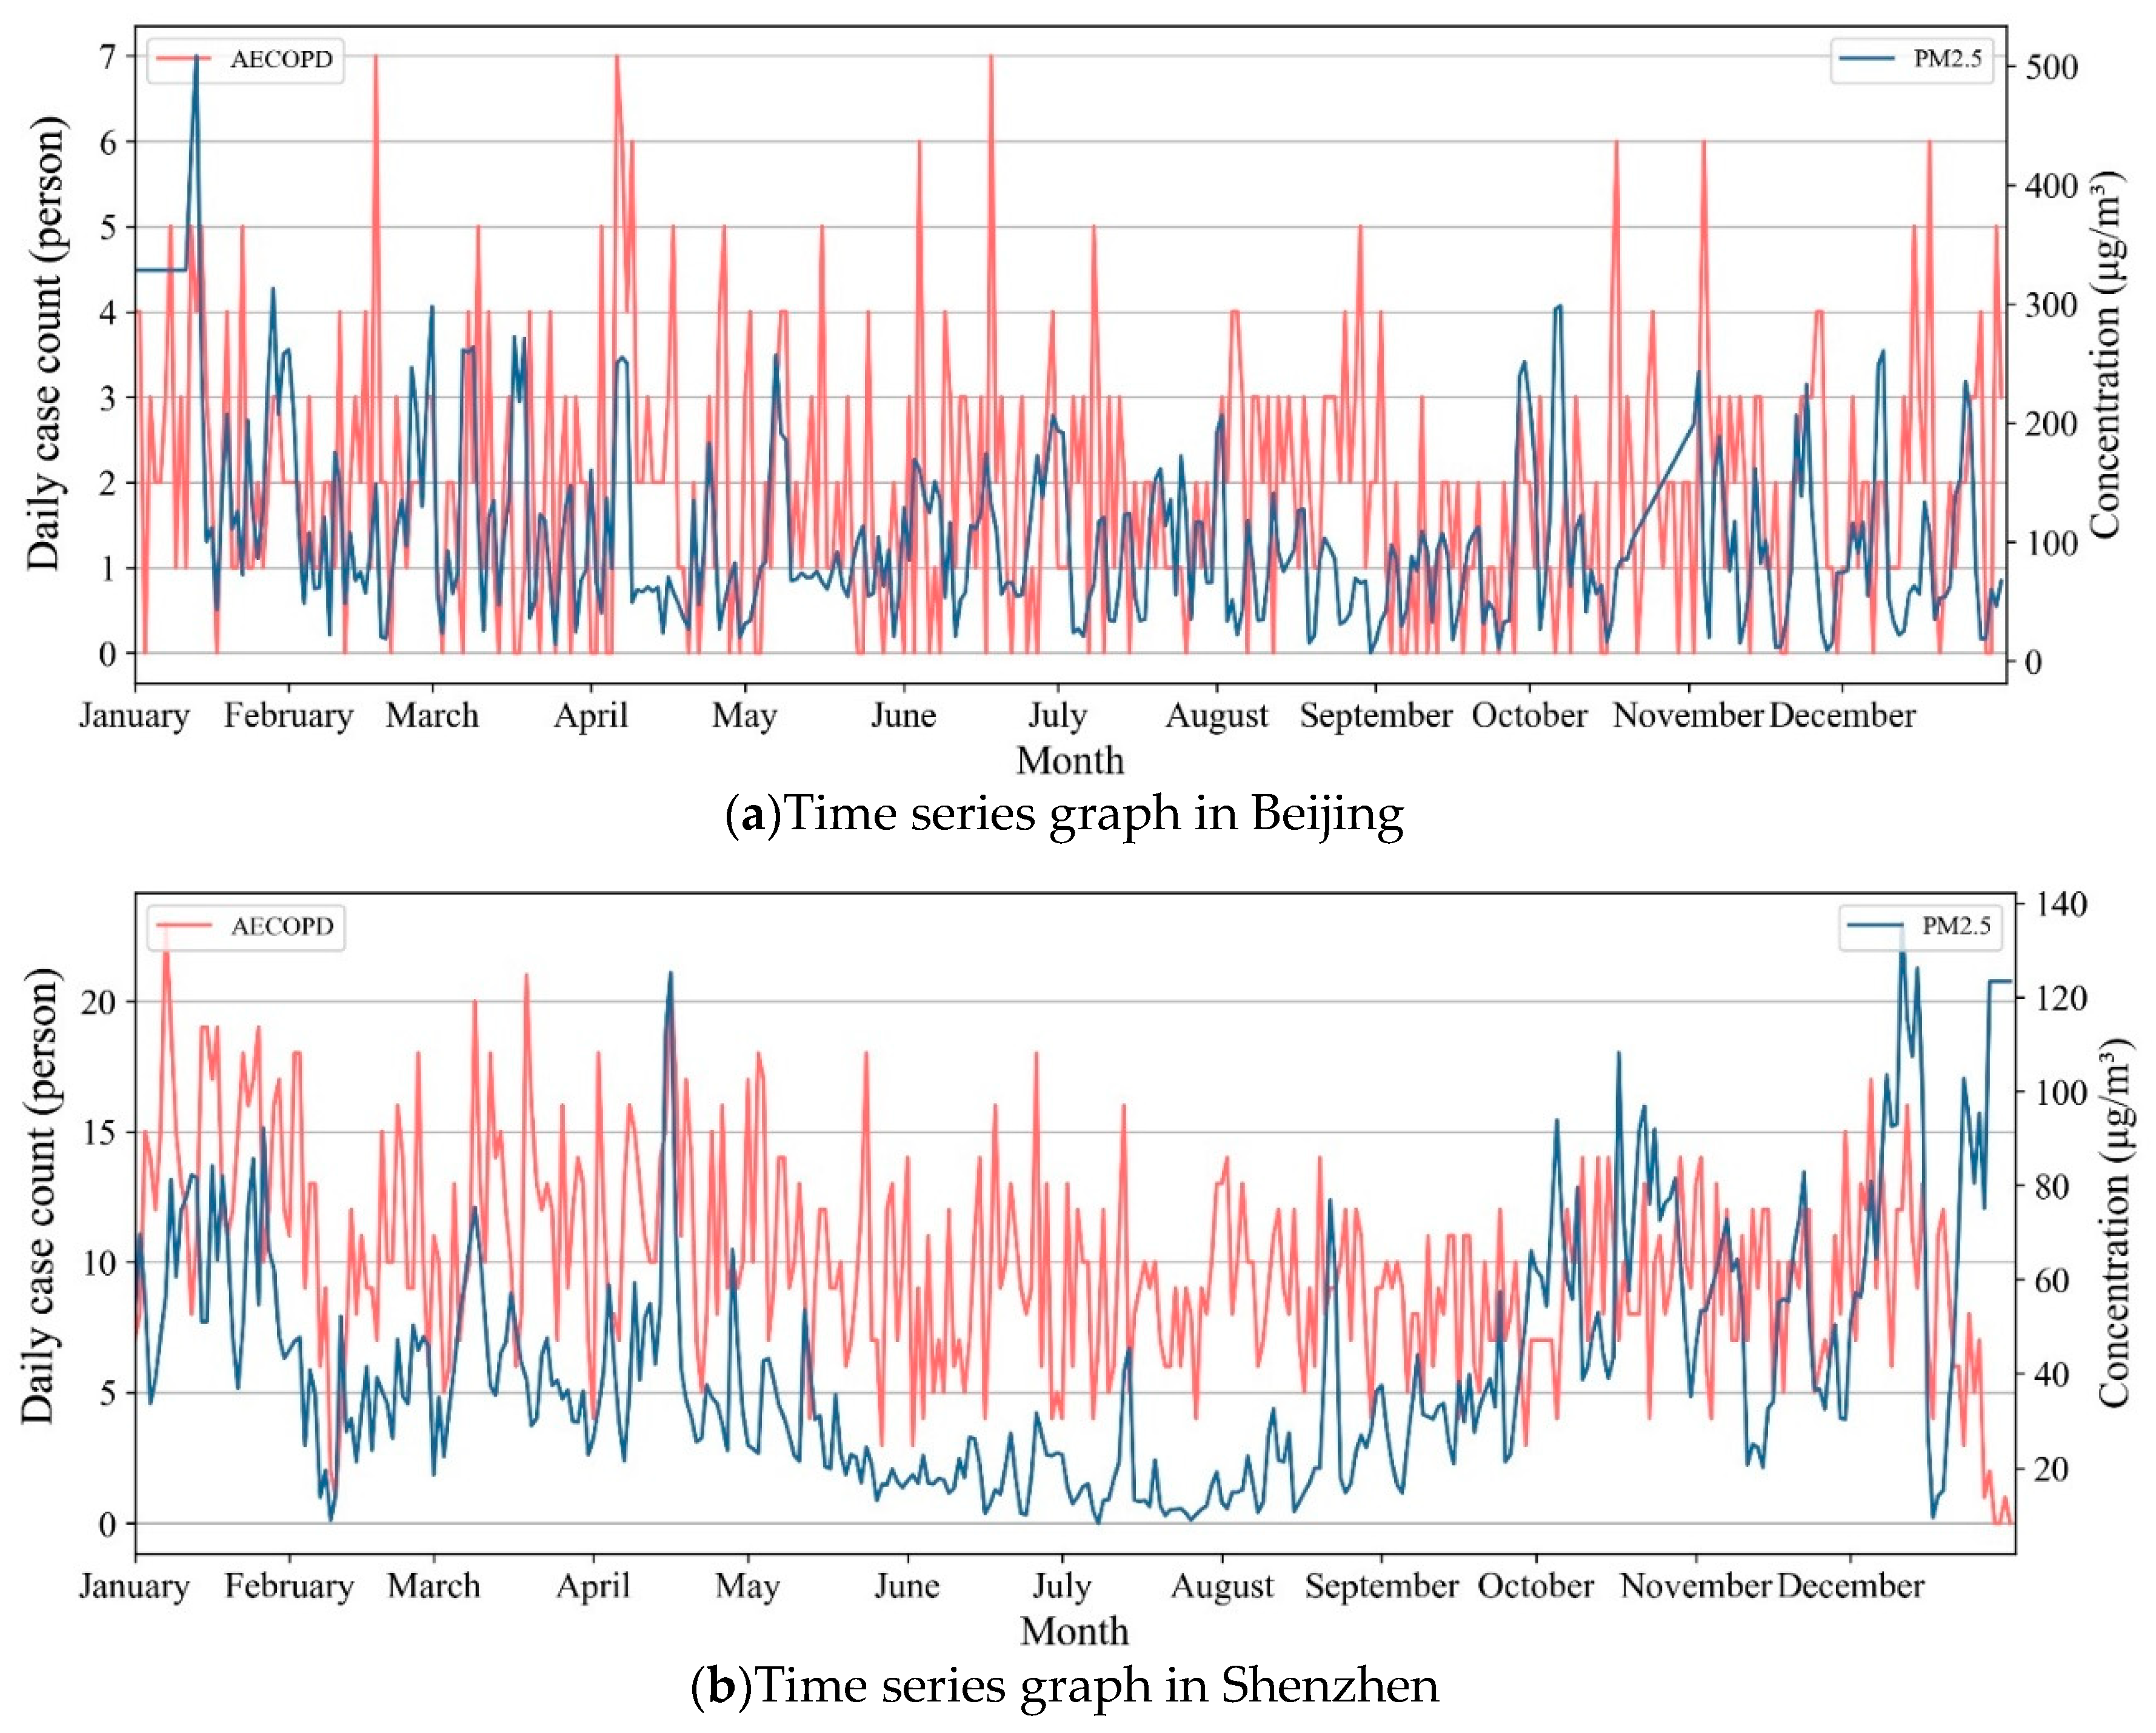
3.1. Descriptive Statistics

During the study period, the average daily PM2.5 concentration was 102 μg/m3, ranging from 6.7 μg/m3 to 508.5 μg/m3 in Beijing and 37 μg/m3, ranging from 7.9 μg/m3 to 129.8 μg/m3 in Shenzhen. There were 155 days (45.7%) in Beijing and 321 days (88%) in Shenzhen when the daily PM2.5 concentration met the national standard, according to the Chinese Ambient Air Quality Standards (Grade II, 75 μg/m3 for 24 h average PM2.5 concentration). However, only 30 days in Beijing and 120 days in Shenzhen met the WHO Air Quality Standards, which is 25 μg/m3 for 24 h average PM2.5 concentration. Based on the statistics above, PM2.5 pollution in Beijing was much more severe than that in Shenzhen in 2013.
At the same time, a total of 712 and 3634 AECOPD cases were recorded from the selected hospitals in Beijing and Shenzhen in 2013, respectively. The statistical characteristics of AECOPD, PM2.5 concentration and meteorological factors in Beijing and Shenzhen in 2013 are summarized in Table 1. The average daily count of AECOPD was 2 in Beijing (ranged from 0 to 7) and 10 in Shenzhen (ranged from 1 to 23). The time series graph in Figure 2 shows the temporal distribution of AECOPD and PM2.5 concentrations in 2013. The curve of PM2.5 in Shenzhen showed an apparent decrease of concentration during the summer period (June, July, August), which is correlated to the monsoon from the sea in summer [42]. The curve of PM2.5 in Beijing showed no noticeable trend. Judging from the time series graph, no particular association between the AECOPD and PM2.5 can be observed in both study areas through the unaided viewing.

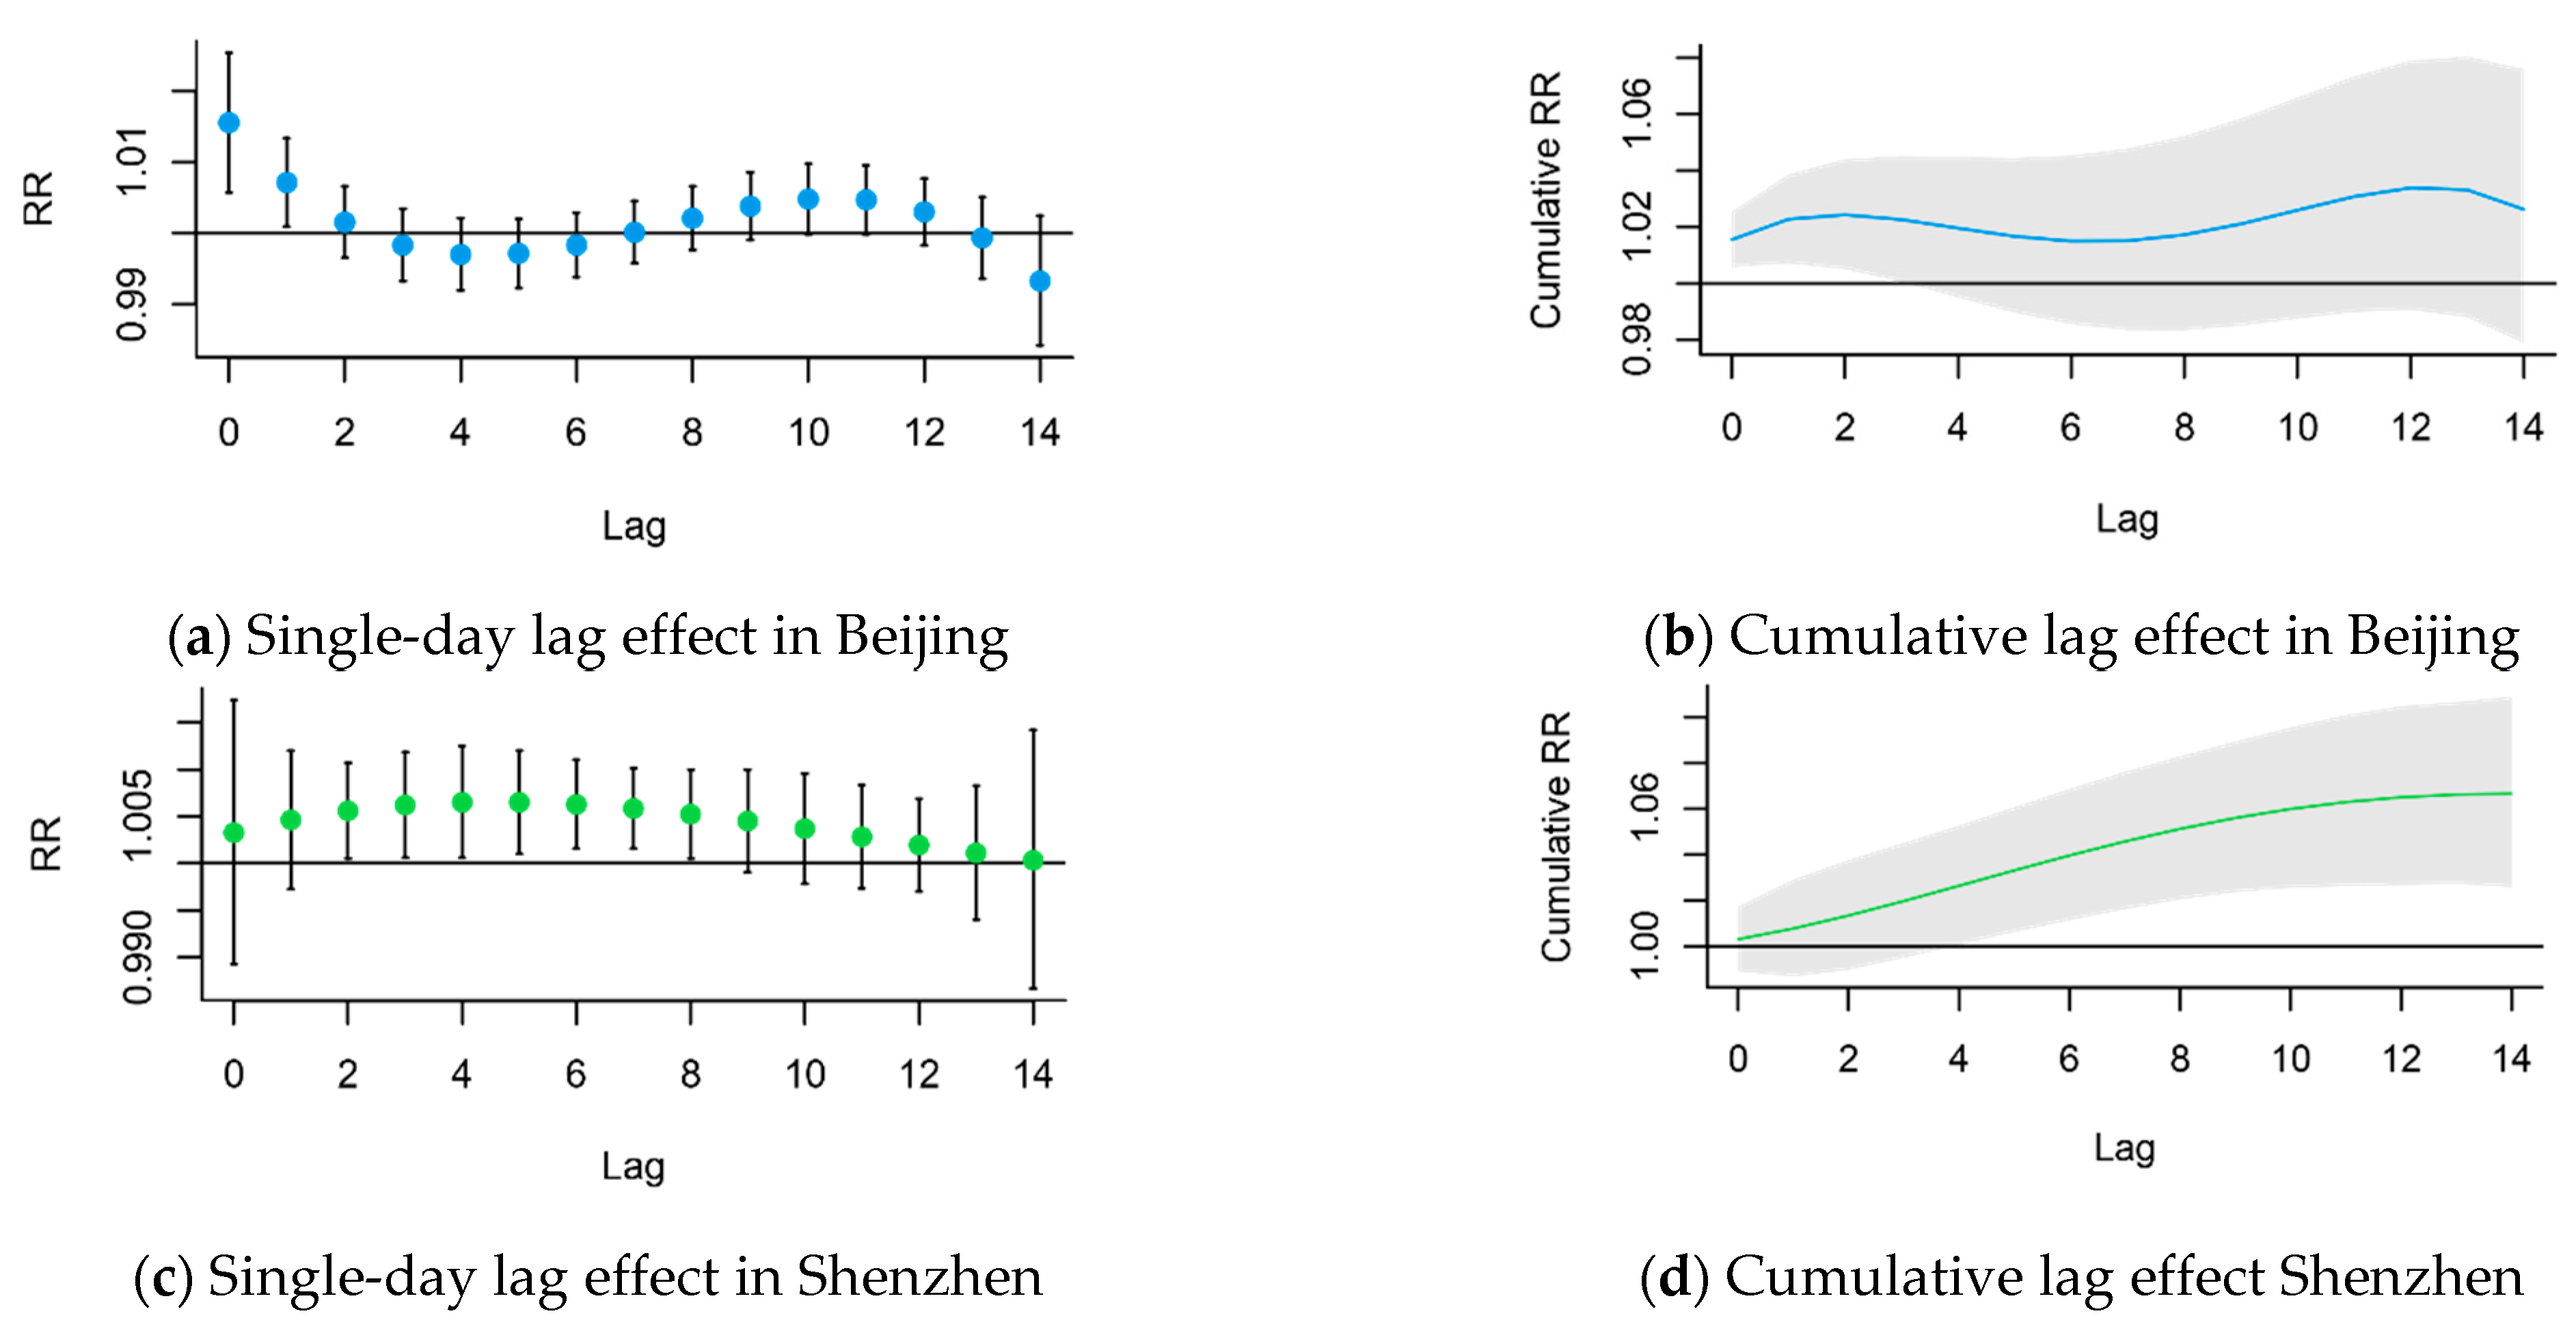
3.2. The Lag Effect of PM2.5 on AECOPD

The lagged health effect on AECOPD associated with short-term exposure to PM2.5 was analyzed using the GAM model introduced in Section 2.3.1. The lag period was set to range from 0 to 14 days (denoted as Lag0, Lag1 … Lag14) in both two study areas. In the model, effects of PM2.5 on AECOPD was considered as a linear correlation relationship. The RR for AECOPD was calculated as variation in counts of daily cases associated with 10 μg/m3 increase of PM2.5 concentration. The exposure-response graphs for single-day lag effect and cumulative lag effect are shown in Figure 3, in which the 95% CIs are represented as black bars and gray areas. The cumulative lag effect was computed by applying a polynomial curve fitting on single day lag effect at a degree of 3 in both study areas.
Results in Table 2 and Table 3 show the specific RR values for AECOPD associated with a 10 μg/m3 increase in PM2.5 in terms of single-day lag effect and cumulative lag effect, together with the 95% CIs in the two study areas. For Beijing urban area, significant single-day lag effects are only observed at Lag0 (the same day) and Lag1, with a maximum RR of 1.0155 (95% CI, 1.0058–1.0253) at Lag0; and significant cumulative lag effects are observed from Lag0 to Lag3, with a maximum cumulative RR of 1.0243 (95%, 1.0050–1.0439) at Lag2. For Shenzhen city, significant single-day lag effect appears from Lag2 to Lag8, with a maximum RR of 1.0065 (95% CI, 1.0010–1.0120) at Lag5; and significant cumulative lag effect appears from Lag4 and remains significant until Lag14, with a maximum cumulative RR of 1.0665 (95% CI, 1.0260–1.1087) at Lag14.
Though significant lag effects on AECOPD associated with increase in PM2.5 concentration are detected in both two study areas, the lag patterns are quite different. The response time of the lag effect in Beijing is shorter than that in Shenzhen, which occurs on the same day of exposure and lasts for a small period (3 days in cumulative mode). In contrast, the lag effect in Shenzhen does not emerge until two days after the exposure and the cumulative lag effect could last for at least 10 days. Judging by the value of single-day RR, the same amount of increase in PM2.5 concentration has slightly greater effect on AECOPD in Beijing urban area than in Shenzhen. However, for the cumulative lag effect, the same amount of increase in PM2.5 concentration is associated with much more responses on AECOPD in Shenzhen than in Beijing urban area.
To sum up, PM2.5 exposure was proved to have non-negligible lag effect on AECOPD in both two study areas, regardless of the level of PM2.5 concentration. The regression model-based method applied in this section reveals the correlational relationship between the two variables. However, correlation does not mean causality [39] and the causal connection between AECOPD and PM2.5 exposure still remained unconfirmed. In the following section, we will discuss the causative impact of PM2.5 on AECOPD based on the results from a model-free analysis by using CCM method.

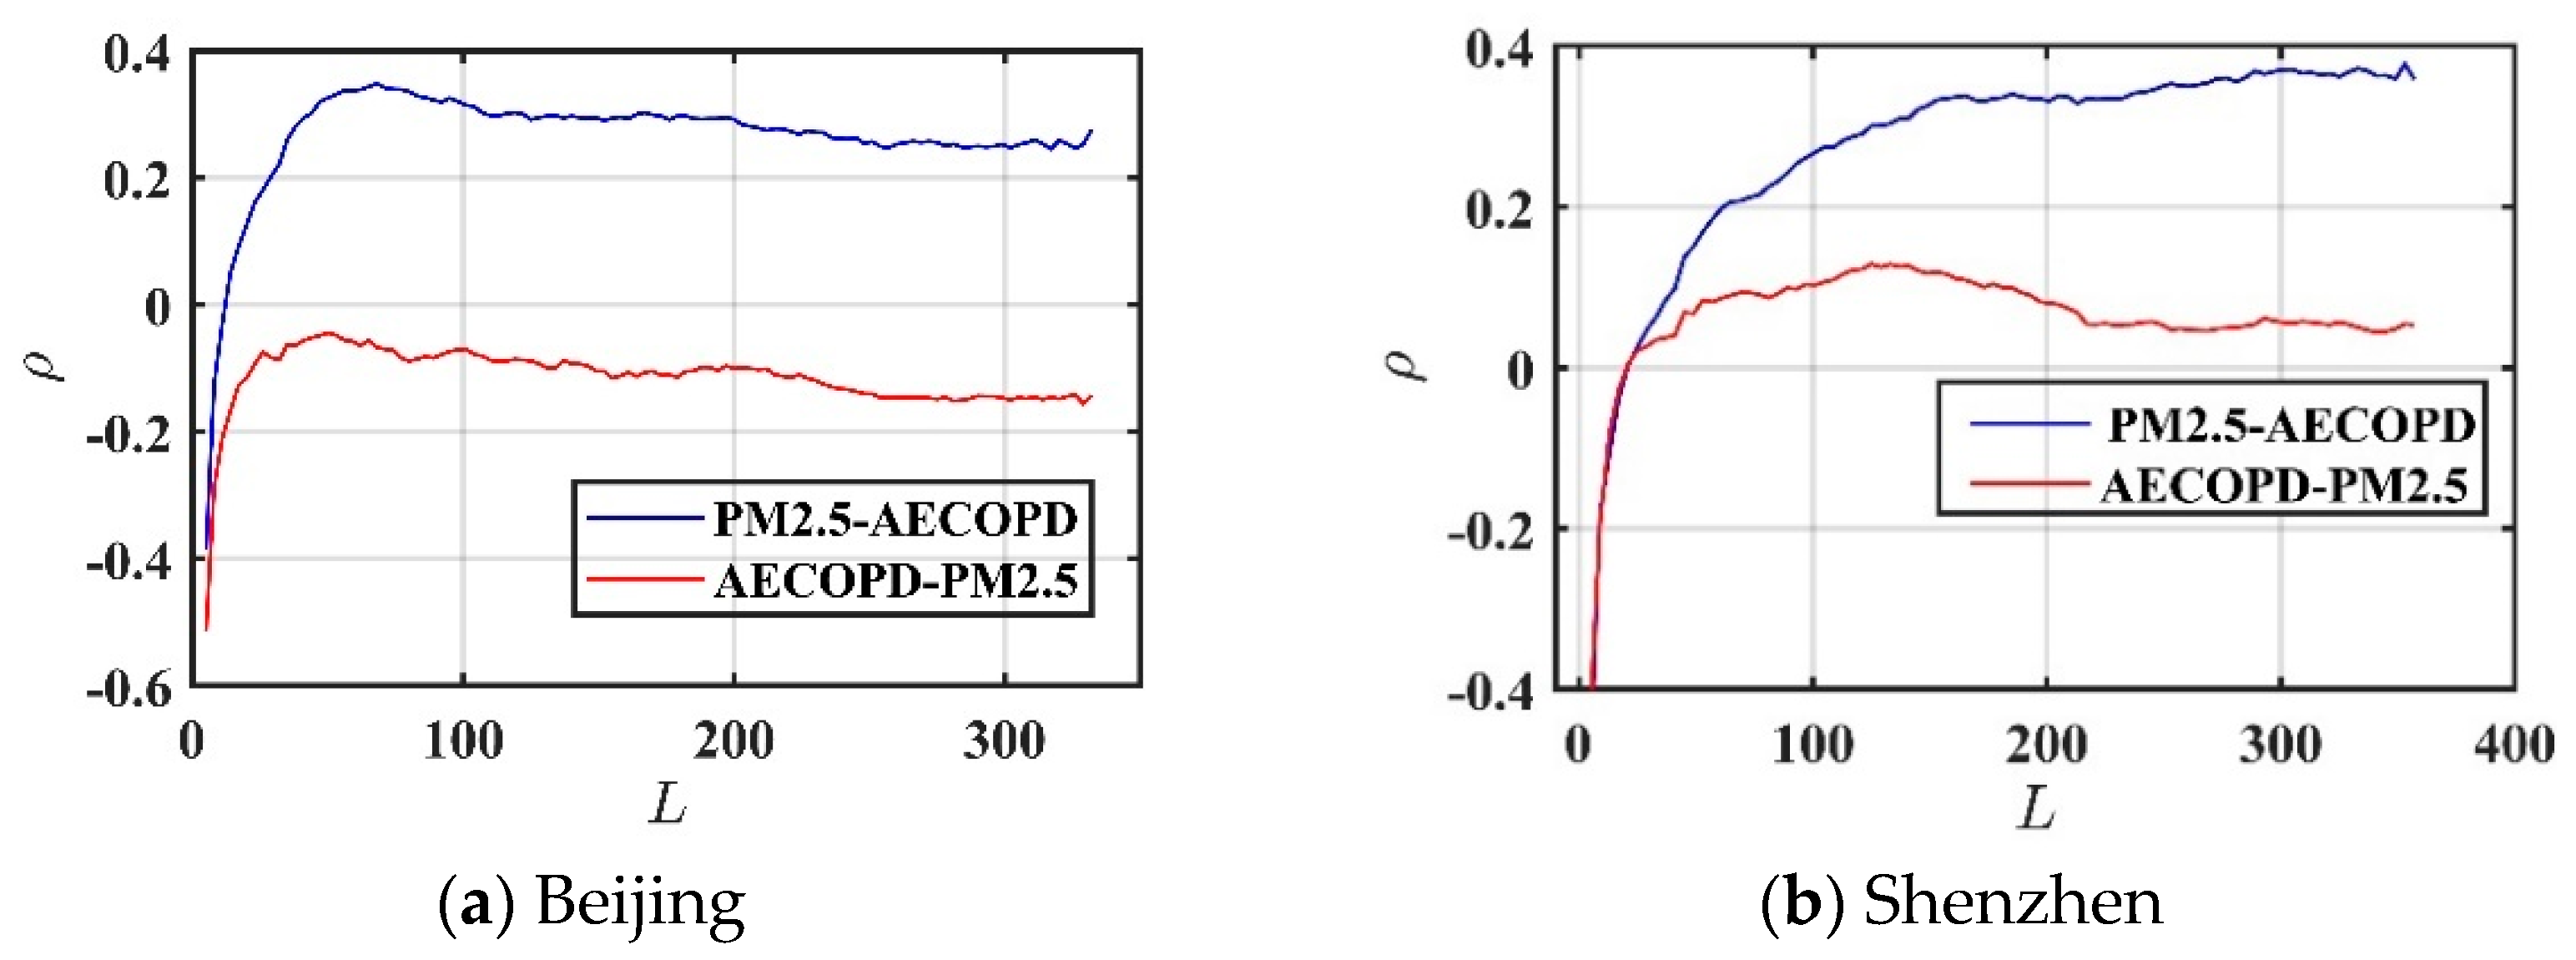
3.3. The Causative Impact of PM2.5 on AECOPD

To confirm the causality using CCM method, two conditions are required: (1) the convergence result of the CCM correlation coefficient ( ρ ) is significantly larger than 0; (2) the pattern of CCM curve shows an obvious increasing and convergence trend with the growth of the time series length (L). The convergent cross maps of Beijing urban area and Shenzhen City are shown in Figure 4, in which red lines represent causative impact of AECOPD count on PM2.5 concentration while the blue lines represent the opposite.
As shown in Figure 4, the blue lines in the two graphs meet the required conditions of CCM, indicating that PM2.5 concentration has causative impacts on the counts of AECOPD in both Beijing urban area and Shenzhen City. Regarding the red lines in two graphs, the required conditions are not fulfilled, implying that count of AECOPD has no causal impact on PM2.5 concentration. Numerical results of causality ( ρ value) in Table 4 illustrate the strength of the causative impact and similar causality strength is observed for both study areas.
In general, significant causative impact of PM2.5 exposure on AECOPD has been confirmed in both two study areas, regardless of the level of PM2.5 concentration. Different from the common cognition that exposure to higher level of PM2.5 may have greater effect on human health, this study finds that the effect of PM2.5 on human body has little to do with the concentration level. In most cases, people are likely to underestimate the adverse health effect of PM2.5 when the exposure level is low. However, this study provides a persuasive evidence to show that health effect in area with relative low pollution level also need to be taken seriously, especially for people with chronic respiratory disease.

4. Conclusions

In this study, a comparison analysis of health effect associated with PM2.5 is conducted in two typical cities with different levels of PM2.5 concentration. Both correlational relationship and causal connection between PM2.5 exposure and AECOPD are investigated by adopting a time series analysis based on GAM and CCM. Results from the two methods agree that PM2.5 exposure has non-negligible health effect on AECOPD in both two study areas, implying that air pollution cause adverse consequences at much lower levels than common cognition. In conclusion, our study highlights the adverse health effects of PM2.5 pollution on people with chronic respiratory disease in cities with both high and low levels of PM2.5 in China and emphasizes adverse effect in area with relative low pollution level cannot be overlooked. Governments in both high-pollution and low-pollution cities should attach importance to the adverse effects of PM2.5 on human body and take corresponding measures to control and reduce the related losses.

Author Contributions

Conceptualization, X.X. and L.Y.; methodology, X.X. and L.Y.; software, J.L.; validation, X.X., Y.L. (Yangxiaoyue Liu) and W.J.; formal analysis, L.Y.; writing—original draft preparation, X.X.; writing—review and editing, L.Y.; visualization, X.X.; supervision, W.J. and Y.L. (Yong Li); project administration, Y.L. (Yangxiaoyue Liu); funding acquisition, L.Y., X.X., Y.L. (Yangxiaoyue Liu). All authors have read and agreed to the published version of the manuscript.

Funding

This research was funded by National Natural Science Foundation of China (Grant number 41771380), Key Special Project for Introduced Talents Team of Southern Marine Science and Engineering Guangdong Laboratory (No. GML2019ZD0301), the GDAS’ Project of Science and Technology Development (No. 2020GDASYL-20200103003, 2020GDASYL-20200103006, 2020GDASYL-20200104003), the China Postdoctoral Science Foundation (NO. 2020M682628), a grant from State Key Laboratory of Resources and Environmental Information System, the National Postdoctoral Program for Innovative Talents (BX20200100), China and the Open Research Fund of National Earth Observation Data Center (No. NODAOP2020002).

Institutional Review Board Statement

Not applicable.

Informed Consent Statement

Not applicable.

Data Availability Statement

All data generated or analyzed during this study in this article are available from the corresponding author on reasonable request.

Conflicts of Interest

The authors declare no conflict of interest.

References

  1. Bazargani, Y.T.; de Boer, A.; Leufkens, H.G.; Mantel-Teeuwisse, A.K. Essential medicines for COPD and asthma in low and middle income countries. Thorax 2014, 69, 1149–1151. [Google Scholar] [CrossRef] [Green Version]
  2. Lopez-Campos, J.L.; Tan, W.; Soriano, J.B. Global burden of COPD. Respirology 2016, 21, 14–23. [Google Scholar] [CrossRef] [PubMed]
  3. Ryu, J.Y.; Sunwoo, Y.E.; Lee, S.Y.; Lee, C.K.; Kim, J.H.; Lee, J.T.; Kim, D.H. Chronic obstructive pulmonary disease (COPD) and vapors, gases, dusts, or fumes (VGDF): A meta-analysis. Int. J. Chronic Obstr. Pulm. Dis. 2015, 12, 374–380. [Google Scholar] [CrossRef]
  4. Badyda, A.; Dąbrowiecki, P.; Czechowski, P.; Majewski, G. Risk of bronchi obstruction among non-smokers—Review of environmental factors affecting bronchoconstriction. Respir. Physiol. Neurobiol. 2015, 209, 39–46. [Google Scholar] [CrossRef] [PubMed]
  5. Cohen, A.J.; Brauer, M.; Burnett, R.; Anderson, H.R.; Frostad, J.; Estep, K.; Balakrishnan, K.; Brunekreef, B.; Dandona, L.; Dandona, R.; et al. Estimates and 25-year trends of the global burden of disease attributable to ambient air pollution: An analysis of data from the Global Burden of Diseases Study. Lancet 2017, 389, 1907–1918. [Google Scholar] [CrossRef] [Green Version]
  6. Feng, S.; Gao, D.; Liao, F.; Zhou, F.; Wang, X. The health effects of ambient PM2.5 and potential mechanisms. Ecotoxicol. Environ. Saf. 2016, 128, 67–74. [Google Scholar] [CrossRef]
  7. Han, C.; Oh, J.; Lim, Y.H.; Kim, S.; Hong, Y.C. Long-term exposure to fine particulate matter and development of chronic obstructive pulmonary disease in the elderly. Environ. Int. 2020, 143, 105895. [Google Scholar] [CrossRef]
  8. Guan, W.J.; Zheng, X.Y.; Chung, K.F.; Zhong, N.S. Impact of air pollution on the burden of chronic respiratory diseases in China: Time for urgent action. Lancet 2016, 388, 1939–1951. [Google Scholar] [CrossRef]
  9. Badyda, A.; Grellier, J.; Dąbrowiecki, P. Ambient PM2.5 exposure and mortality due to lung cancer and cardiopulmonary diseases in polish cities. Adv. Exp. Med. Biol. 2017, 944, 9–17. [Google Scholar]
  10. Schikowski, T.; Adam, M.; Marcon, A.; Cai, Y.; Vierkötter, A.; Carsin, A.E.; Jacquemin, B.; Al Kanani, Z.; Beelen, R.; Birk, M.; et al. Association of ambient air pollution with the prevalence and incidence of COPD. Eur. Respir. J. 2014, 44, 614–626. [Google Scholar] [CrossRef] [Green Version]
  11. Li, J.H.; Sun, S.Z.; Tang, R.; Qiu, H.; Huang, Q.; Mason, T.; Tian, L. Major air pollutants and risk of COPD exacerbations: A systematic review and meta-analysis. Int. J. Chronic Obstr. Pulm. Dis. 2016, 11, 3079–3091. [Google Scholar] [CrossRef] [Green Version]
  12. Bloemsma, L.D.; Hoek, G.; Smit, L. Panel studies of air pollution in patients with COPD: Systematic review and meta-analysis. Environ. Res. 2016, 151, 458–468. [Google Scholar] [CrossRef]
  13. Heinrich, J.; Schikowski, T. COPD patients as vulnerable subpopulation for exposure to ambient air pollution. Curr. Environ. Health Rep. 2018, 5, 70–76. [Google Scholar] [CrossRef]
  14. Wu, S.W.; Ni, Y.; Li, H.Y.; Pan, L.; Yang, D.; Baccarelli, A.A.; Deng, F.; Chen, Y.; Shima, M.; Guo, X. Short-term exposure to high ambient air pollution increases airway inflammation and respiratory symptoms in chronic obstructive pulmonary disease patients in Beijing, China. Environ. Int. 2016, 94, 76–82. [Google Scholar] [CrossRef] [PubMed]
  15. Yao, Y.; Chen, X.; Chen, W.; Wang, Q.; Fan, Y.; Han, Y.; Wang, T.; Wang, J.; Qiu, X.; Zheng, M.; et al. Susceptibility of individuals with chronic obstructive pulmonary disease to respiratory inflammation associated with short-term exposure to ambient air pollution: A panel study in Beijing. Sci. Total Environ. 2020, 766, 142639. [Google Scholar] [CrossRef]
  16. Teramoto, S.; Yamamoto, H.; Yamaguchi, Y.; Matsuse, T.; Ouchi, Y. Global burden of COPD in Japan and Asia. Lancet 2003, 362, 1764–1765. [Google Scholar] [CrossRef]
  17. Teo, W.S.; Tan, W.S.; Chong, W.F.; Abisheganaden, J.; Lew, Y.J.; Lim, T.K.; Heng, B.H. Economic burden of chronic obstructive pulmonary disease. Respirology 2012, 17, 120–126. [Google Scholar] [CrossRef]
  18. Wang, C.; Xu, J.; Yang, L.; Xu, Y.; Zhang, X.; Bai, C.; Kang, J.; Ran, P.; Shen, H.; Wen, F.; et al. Prevalence and risk factors of chronic obstructive pulmonary disease in China (the China Pulmonary Health [CPH] Study): A national cross-section study. Lancet 2018, 391, 1706–1717. [Google Scholar] [CrossRef]
  19. Czechowski, P.O.; Dąbrowiecki, P.; Oniszczuk-Jastrząbek, A.; Bielawska, M.; Czermański, E.; Owczarek, T.; Rogula-Kopiec, P.; Badyda, A. A preliminary attempt at the identification and financial estimation of the negative health effects of urban and industrial air pollution based on the agglomeration of Gdańsk. Sustainability 2020, 12, 42. [Google Scholar] [CrossRef] [Green Version]
  20. National Heart Lung Blood Institute. NHLBI, Morbidity and Mortality: 2009 Chart Book on Cardiovascular, Lung, and Blood Diseases; National Heart Lung Blood Institute: Bethesda, MD, USA, 2009.
  21. Shin, S.; Bai, L.; Burnett, R.T.; Kwong, J.C.; Hystad, P.; van Donkelaar, A.; Lavigne, E.; Weichenthal, S.; Copes, R.; Martin, R.V.; et al. Air Pollution as a Risk Factor for Incident COPD and Asthma: 15-Year Population-Based Cohort Study. Am. J. Respir. Crit. Care Med. 2020. [Google Scholar] [CrossRef]
  22. Ko, F.W.S.; Tam, W.; Wong, T.W.; Chan, D.P.S.; Tung, A.H.; Lai, C.K.W.; Hui, D.S.C. Temporal relationship between air pollutants and hospital admissions for chronic obstructive pulmonary disease in Hong Kong. Thorax 2007, 62, 780–785. [Google Scholar] [CrossRef] [Green Version]
  23. Bao, H.; Dong, J.; Liu, X.; Tan, E.; Shu, J.; Li, S. Association between ambient particulate matter and hospital outpatient visits for chronic obstructive pulmonary disease in Lanzhou, China. Environ. Sci. Pollut. Res. 2020, 27, 22843–22854. [Google Scholar] [CrossRef]
  24. Huang, Y.T.; Chen, C.C.; Ho, Y.N.; Tsai, M.T.; Tsai, C.M.; Chuang, P.C.; Cheng, F.J. Short-Term Effects of Particulate Matter and Its Constituents on Emergency Room Visits for Chronic Obstructive Pulmonary Disease: A Time-Stratified Case-Crossover Study in an Urban Area. Int. J. Environ. Res. Public Health 2021, 18, 4400. [Google Scholar] [CrossRef]
  25. Dominici, F.; Mittleman, M.A. China’s air quality dilemma: Reconciling economic growth with environmental protection. JAMA 2012, 307, 2100–2102. [Google Scholar] [CrossRef]
  26. Xia, X.; Zhang, A.; Liang, S.; Qi, Q.; Jiang, L.; Ye, Y. The association between air pollution and population health risk for respiratory infection: A case study of Shenzhen, China. Int. J. Environ. Res. Public Health 2017, 14, 950. [Google Scholar] [CrossRef] [Green Version]
  27. Xia, X.; Yao, L. Spatio-temporal differences in health effect of ambient PM2.5 pollution on acute respiratory infection between children and adults. IEEE Access 2019, 7, 25718–25726. [Google Scholar] [CrossRef]
  28. Yao, L.; Lu, N. Spatiotemporal distribution and short-term trends of particulate matter concentration over China, 2006–2010. Environ. Sci. Pollut. Res. 2014, 21, 9665–9675. [Google Scholar] [CrossRef]
  29. Xu, Q.; Li, X.; Wang, S.; Wang, C.; Huang, F.; Gao, Q.; Wu, L.; Tao, L.; Guo, J.; Wang, W.; et al. Fine particulate air pollution and hospital emergency room visits for respiratory disease in urban areas in Beijing, China, in 2013. PLoS ONE 2016, 11, e0153099. [Google Scholar] [CrossRef] [PubMed]
  30. Ministry of Environmental Protection of the People’s Republic of China (MEP). Ambient Air Quality Standards (On Trial). In National Environmental Protection Standards of the People’s Republic of China; GB3095; Ministry of Environmental Protection of the People’s Republic of China (MEP): Beijing, China, 2012. [Google Scholar]
  31. Gasparrini, A.; Armstrong, B.; Kenward, M.G. Distributed lag non-linear models. Stat. Med. 2010, 29, 2224–2234. [Google Scholar] [CrossRef] [Green Version]
  32. Gasparrini, A. Modeling exposure-lag-response associations with distributed lag non-linear models. Stat. Med. 2014, 33, 881–899. [Google Scholar] [CrossRef] [Green Version]
  33. Atkinson, R.W.; Anderson, H.R.; Sunyer, J.; Ayres, J.; Baccini, M.; Vonk, J.M.; Boumghar, A.; Forastiere, F.; Forsberg, B.; Touloumi, G.; et al. Acute effects of particulate air pollution on respiratory admissions: Results from APHEA 2 project. Air pollution and health: A european approach. Am. J. Respir. Crit. Care Med. 2001, 164 Pt 1, 1860–1866. [Google Scholar] [CrossRef]
  34. Francesca, D.; Roger, D.; Michelle, L.; Luu, P.; Aidan, M.; Scott, L.; Jonathan, M. Fine Particulate Air Pollution and Hospital Admission for Cardiovascular and respiratory diseases. NIH Public Access. 2006, 295, 1127–1134. [Google Scholar]
  35. Sugihara, G.; May, R.M. Nonlinear forecasting as a way of distinguishing chaos from measurement error in time series. Nature 1990, 344, 734–741. [Google Scholar] [CrossRef]
  36. Maher, M.C.; Hernandez, R.D. CauseMap: Fast inference of causality from complex time series. PeerJ 2015, 3, e824. [Google Scholar] [CrossRef] [Green Version]
  37. Deyle, E.R.; Sugihara, G. Generalized theorems for nonlinear state space reconstruction. PLoS ONE 2011, 6, e18295. [Google Scholar] [CrossRef]
  38. Granger, C.W.J. Testing for causality: A personal viewpoint. J. Econ. Dyn. Control 1980, 2, 329–352. [Google Scholar] [CrossRef]
  39. Sugihara, G.; May, R.; Ye, H.; Hsieh, C.; Deyle, E.; Fogarty, M.; Munch, S. Detecting Causality in Complex Ecosystems. Science 2012, 338, 496–500. [Google Scholar] [CrossRef]
  40. Dan, M.; Fusaroli, R.; Tylén, K.; Roepstorff, A.; Sherson, J.F. Causal inference from noisy time-series data—testing the convergent cross-mapping algorithm in the presence of noise and external influence. Future Gener. Comput. Syst. 2017, 73, 52–62. [Google Scholar]
  41. Chen, Z.; Cai, J.; Gao, B.; Xu, B.; Dai, S.; He, B.; Xie, X. Detecting the causality influence of individual meteorological factors on local PM2.5 concentration in the Jing-Jin-Ji region. Sci. Rep. 2017, 7, 40735. [Google Scholar] [CrossRef] [PubMed] [Green Version]
  42. Xia, X.; Qi, Q.; Liang, H.; Zhang, A.; Jiang, L.; Ye, Y.; Liu, C.; Huang, Y. Pattern of spatial distribution and temporal variation of atmospheric pollutants during 2013 in Shenzhen, China. ISPRS Int. J. Geo-Inf. 2017, 6, 2. [Google Scholar] [CrossRef]
Figure 1. Distributions of selected hospitals and monitoring sites in Beijing urban areas and Shenzhen City.
Atmosphere 12 00970 g001
Figure 2. Time series graph of AECOPD (count of daily cases) and daily PM2.5 concentrations in (a) Beijing and (b) Shenzhen in 2013.
Atmosphere 12 00970 g002
Figure 3. Exposure-response relationship between PM2.5 and RR of AECOPD in (a) single-day lag effect in Beijing, (b) cumulative lag effect in Beijing, (c) single-day lag effect in Shenzhen and (d) cumulative lag effect in Shenzhen.
Atmosphere 12 00970 g003
Figure 4. Convergent cross maps demonstrating the causality between PM2.5 concentration and AECOPD in (a) Beijing and (b) Shenzhen in 2013.
Atmosphere 12 00970 g004
Table 1. The statistical characteristics of AECOPD, PM2.5 concentration and meteorological factors in Beijing and Shenzhen in 2013.
Variable Study Area Mean ± SDMin P(25) P(50) P(75) Max
AECOPD Beijing2 ± 101237
Shenzhen10 ± 417101223
PM2.5 (μg/m³)Beijing102 ± 73.66.753.182.4129.5508.5
Shenzhen37 ± 23.77.920.834.761.2129.8
Temperature (°C)Beijing11.3 ± 11.6−12.61.211.022.229.0
Shenzhen23.2 ± 5.24.418.825.627.335
Relative humidity (%)Beijing58.7 ± 17.318.946.759.073.393.3
Shenzhen73 ± 12.822597793100
Table 2. Relative risk (RR) values for AECOPD in single-day lag mode in associations with 10 μg/m3 increase in PM2.5 concentrations in 2013. (Value with * is significant at the 0.05 level).
LagRR (95% CI)
(Beijing)
RR (95% CI)
(Shenzhen)
Lag01.0155 (1.0058, 1.0253) *1.0033 (0.9893, 1.0174)
Lag11.0071 (1.0009, 1.0133) *1.0046 (0.9973, 1.0120
Lag21.0015 (0.9965, 1.0066)1.0056 (1.0005, 1.0107) *
Lag30.9983 (0.9933, 1.0034)1.0062 (1.0006, 1.0118) *
Lag40.9970 (0.9919, 1.0021)1.0065 (1.0006, 1.0125) *
Lag50.9971 (0.9923, 1.0020)1.0065 (1.0010, 1.0120) *
Lag60.9983 (0.9938, 1.0029)1.0063 (1.0016, 1.0110) *
Lag71.0001 (0.9958, 1.0045)1.0058 (1.0016, 1.0101) *
Lag81.0021 (0.9976, 1.0065)1.0052 (1.0006, 1.0099) *
Lag91.0038 (0.9990, 1.0085)1.0045 (0.9991, 1.0100)
Lag101.0048 (0.9999, 1.0097)1.0037 (0.9978, 1.0096)
Lag111.0047 (0.9998, 1.0095)1.0028 (0.9973, 1.0084)
Lag121.0030 (0.9983, 1.0077)1.0020 (0.9970, 1.0069)
Lag130.9993 (0.9936, 1.0051)1.0011 (0.9940, 1.0083)
Lag140.9933 (0.9842, 1.0025)1.0003 (0.9867, 1.0142)
Table 3. Relative risk (RR) values for AECOPD in cumulative lag mode in associations with 10 μg/m3 increase in PM2.5 concentrations in 2013. (Value with * is significant at the 0.05 level).
LagCumulative RR (95% CI)
(Beijing)
Cumulative RR (95% CI)
(Shenzhen)
Lag011.0227 (1.0071, 1.0386) * 1.0079 (0.9871, 1.0291)
Lag021.0243 (1.0050, 1.0439) * 1.0136 (0.9900, 1.0377)
Lag031.0226 (1.0005, 1.0451) * 1.0199 (0.9953, 1.0451)
Lag041.0195 (0.9950, 1.0447) 1.0265 (1.0010, 1.0527) *
Lag051.0166 (0.9896, 1.0444) 1.0332 (1.0065, 1.0606) *
Lag061.0150 (0.9855, 1.0453)1.0397 (1.0116, 1.0686) *
Lag071.0151 (0.9834, 1.0478) 1.0458 (1.0164, 1.0760) *
Lag081.0172 (0.9833, 1.0522)1.0512 (1.0206, 1.0828) *
Lag091.0210 (0.9850, 1.0584) 1.0560 (1.0238, 1.0892) *
Lag101.0260 (0.9875, 1.0659)1.0599 (1.0257, 1.0953) *
Lag111.0307 (0.9898, 1.0734) 1.0629 (1.0264, 1.1007) *
Lag121.0338 (0.9906, 1.0789)1.0650 (1.0268, 1.1045) *
Lag131.0332 (0.9880, 1.0804) 1.0662 (1.0275, 1.1063) *
Lag141.0262 (0.9788, 1.0759)1.0665 (1.0260, 1.1087) *
Table 4. Numerical result of causality ( ρ value) between PM2.5 and AECOPD in Beijing urban areas and Shenzhen City. (Value with * is significant at the 0.05 level).
CombinationCausative Impact ( ρ Value)
PM2.5-AECOPD in Beijing0.369 *
AECOPD-PM2.5 in Beijing−0.173
PM2.5-AECOPD in Shenzhen0.382 *
AECOPD-PM2.5 in Shenzhen0.047
Publisher’s Note: MDPI stays neutral with regard to jurisdictional claims in published maps and institutional affiliations.

