Article

Analysis of the Precipitable Water Vapor Observation in Yunnan–Guizhou Plateau during the Convective Weather System in Summer

1
Meteorological Observation Center, China Meteorological Administration, Beijing 100081, China
2
Laboratory of Navigation and Communication Fusion Technology, Ministry of Industry and Information Technology, Beihang University, Beijing 100191, China
3
National Meteorological Center, China Meteorological Administration, Beijing 100081, China
*
Author to whom correspondence should be addressed.
Atmosphere 2021, 12(8), 1085; https://doi.org/10.3390/atmos12081085
Submission received: 31 July 2021 / Revised: 18 August 2021 / Accepted: 20 August 2021 / Published: 23 August 2021

Abstract

:
The ERA5 reanalysis dataset of the European Center for Medium-Range Weather Forecasts (ECMWF) in the summers from 2015 to 2020 was used to compare and analyze the features of the precipitable water vapor (PWV) observed by six ground-based Global Navigation Satellite System (GNSS) meteorology (GNSS/MET) stations in the Yunnan–Guizhou Plateau. The correlation coefficients of the two datasets ranged between 0.804 and 0.878, the standard deviations ranged between 4.686 and 7.338 mm, and the monthly average deviations ranged between −4.153 and 9.459 mm, which increased with the altitude of the station. Matching the quality-controlled ground precipitation data with the PWV in time and space revealed that most precipitation occurred when the PWV was between 30 and 65 mm and roughly met the normal distribution. We used the vertical integral of divergence of moisture flux (∇p) and S-band Doppler radar networking products combined with the PWV to study the convergence and divergence process and the water vapor delivery conditions during the deep convective weather process from August 24 to 26, 2020, which can be used to analyze the real-time observation capability and continuity of PWV in small-scale and mesoscale weather processes. Furthermore, the 1 h precipitation and the cloud top temperature (ctt) data at the same site were used to demonstrate the effect of PWV on the transit of convective weather systems from different time–space scales.

1. Introduction

Water vapor is an important part of the atmosphere and is one of the main factors affecting the atmospheric greenhouse effect [1,2,3]. Changes in water vapor not only strongly affect the water cycle, aerosol composition, and cloud formation [4,5,6], but also drive weather and climate change [2,4,7]. Water vapor accounts for 4% of the total volume of the atmosphere, which has a significant impact on the radial radiation energy balance of the earth–atmosphere system [8], the vertical stability of the atmosphere, the formation of clouds [9], and the formation and evolution of heavy rain [10]. Therefore, changes in atmospheric water vapor have long been an area of focus in climatology. At present, the observation of water vapor in the atmosphere mainly includes radiosondes [11,12], ground-based microwave radiometers [13], space-borne radiometers [14], GNSS radio occultation [15,16], and GNSS meteorology (GNSS/MET) [17,18,19], which have their own advantages and disadvantages. Because of the long time series of historical records, radiosondes are the most widely used data sources for studying atmospheric water vapor. However, owing to the replacement of sensors used by stations and changes in data processing strategies, the radiosonde record has an inhomogeneity issue [19,20]. In addition, radiosonde observations are usually taken twice a day, so cannot fully reflect the diurnal characteristics of water vapor [21], and observations of catastrophic weather, such as the rapid occurrence, development, and disappearance of heavy rain, are insufficient [12,22]. Although ground-based microwave radiometers can obtain relatively continuous observations with high time resolution and are not affected by cloud cover [23], the equipment is relatively expensive and the number of ground stations is limited, which makes it difficult to effectively monitor water vapor over a large area [23]. Satellite radiometers mainly include infrared radiometers and passive microwave radiometers, and infrared radiometers were used as early as 1979. However, their observation accuracy is relatively poor and is subject to cloud cover [24]. When severe weather, such as heavy rain, occurs, the data obtained are usually unusable. Satellite-mounted microwave radiometer observations are not affected by cloud cover, but the measurement of water vapor based on the microwave radiometer requires the presupposition of the surface radiation coefficient, so the measurement accuracy will be greatly compromised owing to the complex changes in the surface radiation coefficient over the land [25]. In addition, satellite-borne radio occultation observation technology uses the bending angle of the ranging signal between the low-orbit satellite and the GNSS satellite to retrieve atmospheric parameters, which has the advantages of working under all-weather conditions and being independent to the surface radiation coefficient [26]. Occultation observation technology can retrieve the middle and upper atmospheric parameters with high precision, but the accuracy of the retrieval at the bottom of the troposphere is relatively poor owing to the problem of signal strength [27,28]. Therefore, GNSS radio occultation observation technology currently does not meet the demand for accurately determining water vapor content in the lower atmosphere.
Ground-based GNSS water vapor retrieval technology has been proposed since the 1990s and has been proven to be an effective method for measuring water vapor [29]. GNSS/MET has the advantages of all-weather, high precision, low cost, and high time resolution [30], and their observations have good consistency on the time scale of hours or even minutes, which can obtain an PWV observation accuracy equivalent to those of radiosondes and ground-based microwave radiometers [31,32]. Reanalysis data are multidimensional and spatially complete, and continuous global atmospheric cycle data are obtained by assimilating a variety of meteorological observation data [33]. In contrast to the meteorological analysis of the existing operational forecasting systems, the reanalyzed data adopt a unified meteorological model to avoid the inconsistency caused by model changes, making it more suitable for long-term climate research [19]. As water vapor plays an important role in the atmosphere, there have been a large number of relevant studies, mainly focusing on key issues such as the accuracy evaluation and comparison verification of different observation data [33,34], the study of water vapor distribution changes and mechanisms, and the monitoring and modeling of water vapor and its meteorological applications [35,36,37,38]. While the studies have achieved considerable results, there are still many questions that need to be answered and solved. The Qinghai–Tibet Plateau, known as the “water vapor transportation transfer station,” is the top of the “big triangle fan” [39,40], the key area of South Asian monsoon water vapor transportation. The Yunnan–Guizhou Plateau is located upstream of this area [41]. Therefore, the observations of water vapor transportation and the changes and mechanisms in this region are important for revealing the formation mechanism of precipitation changes and flood disasters in the middle and lower reaches of the Yangtze River in China [42,43,44]. In addition, they are also useful for studying climate anomalies and disaster prevention and mitigation in Southwest China [41]. There are problems in observing water vapor transportation such as difficulty in station construction and high operation and maintenance costs due to the location of the plateau, and there is a lack of long-term continuous high-resolution water vapor observation data [45]. However, the use of GNSS/MET observation data can make up for such problems.
This study used ECMWF’s ERA5 reanalysis dataset to analyze the features of GNSS/MET station observation data in the Yunnan–Guizhou Plateau. Matching the quality-controlled ground precipitation data with the PWV in time and space to analyze the relationship between precipitation and water vapor change and distribution, we used the vertical integral of the divergence of moisture flux [41] and S-band Doppler radar networking products [46] combined with PWV data to study the convergence and divergence process and the water vapor delivery conditions during the deep convective weather process from 24–26 August 2020, which can analyze the real-time observation capability and continuity of the PWV in the small- and medium-scale weather processes. Furthermore, 1 h precipitation and cloud top temperature (ctt) data [47,48,49] at the same site were used to reveal the effect of PWV on the transit of convective weather systems from different time–space scales. This study provides a reference for the positive contribution of the PWV in the prediction of the occurrence time and path of the small-scale and mesoscale convective weather system in the Yunnan–Guizhou Plateau.

2. Materials and Methods

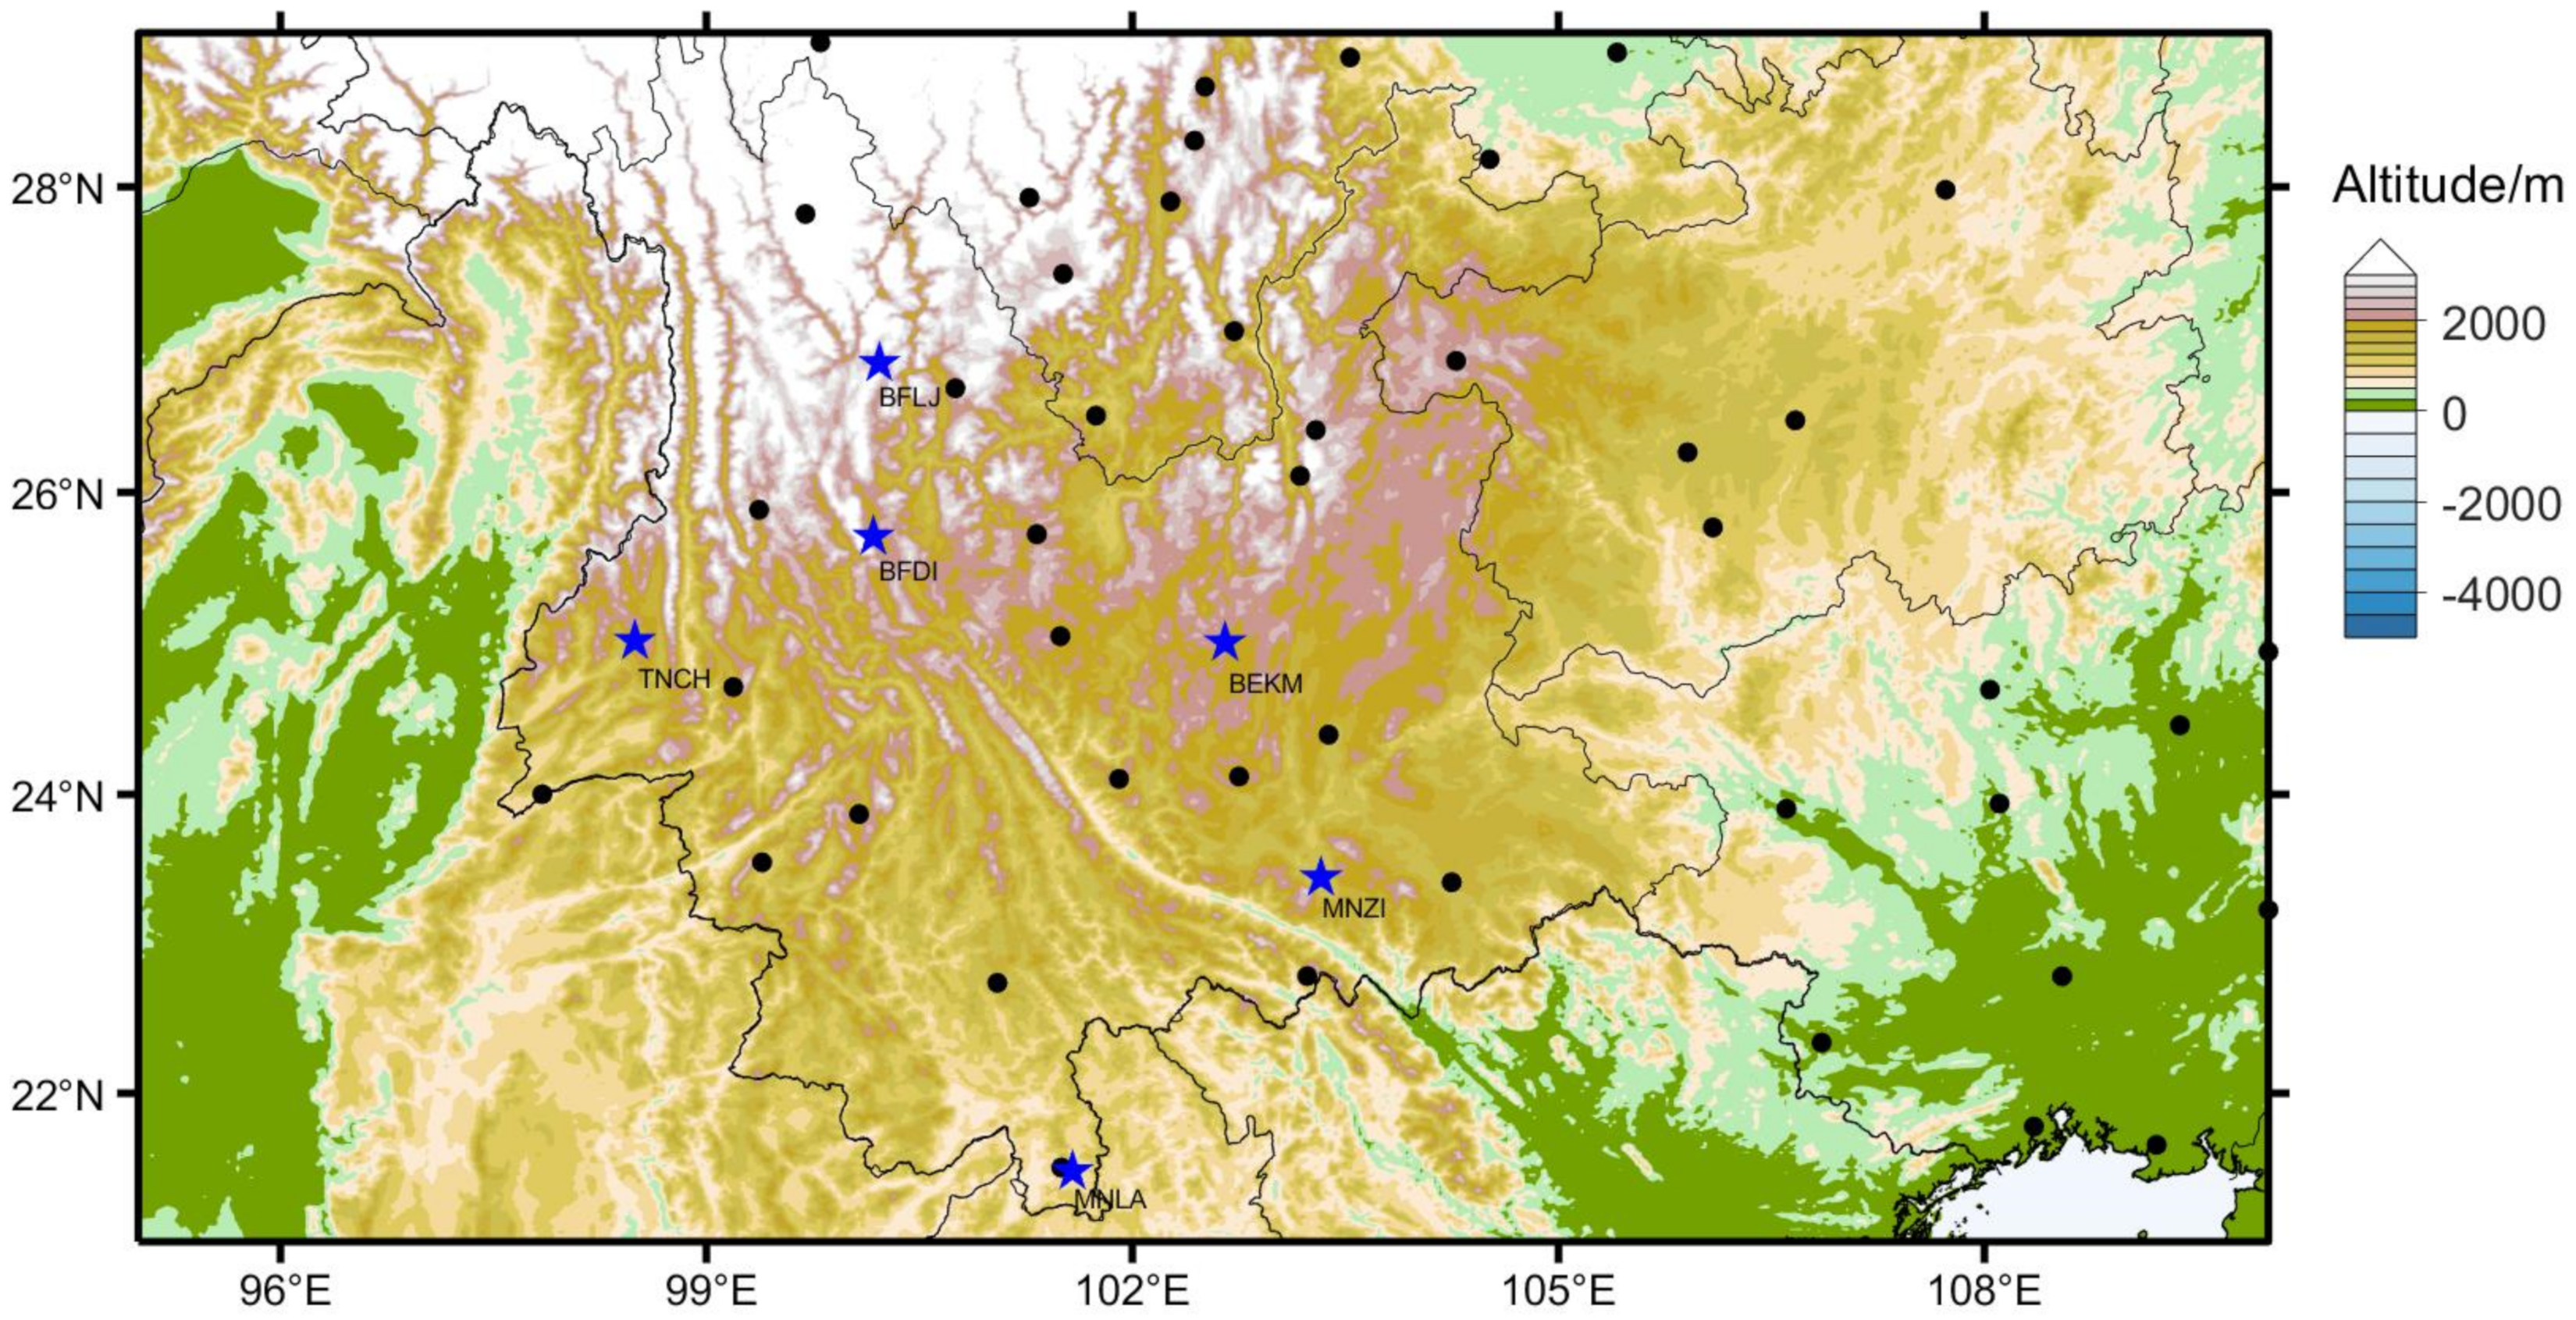
2.1. Data Introduction

In this study, 67 GNSS/MET sites were selected as the observation data source in the Yunnan–Guizhou Plateau (21° N–29° N, 97° E–110 °E), six of which with better time continuity were selected for the feature analysis. The observation period was June, July, August, and September from 2015 to 2020; the site distribution is shown as black dots in Figure 1. The ERA5 reanalysis data, the precipitation data, and the ctt were matched in time and space for six stations (MNLA, MNZI, TNCH, BEKM, BFDI, and BFLJ), which are evenly distributed in Yunnan Province, and the locations of the stations are marked with blue stars in Figure 1. The altitudes of the stations show a trend of increasing gradually from south to north, which is useful for analyzing the influence of altitude on the deviation between the PWV and the reanalysis. The receiver models of these six stations are all TRIMBLE NETRS, and the antenna models are all TRM41249.00. Other specific site information is summarized in Table 1.
The ERA5 dataset in the ECMWF global reanalysis data was used to analyze the features of the PWV. The dataset used was “ERA5 hourly data on single levels from 1979 to present”, which contains the total atmospheric water vapor product (total column water vapor: TCWV) with a grid accuracy of 0.25° × 0.25° [50]. The vertical integral of the divergence of the moisture flux product in the same dataset was combined with the U/V wind field component of the 850 hPa pressure layer to analyze the water vapor transportation. The wind field dataset used was “ERA5 hourly data on pressure levels from 1979 to the present” [51].
Precipitation over the past 1 h was observed by six-element monitoring stations on the ground in the Yunnan–Guizhou Plateau. The real-time product (Chinese region/nominal) of the ctt retrieved by the multi-channel scanning imaging radiometer (AGRI), which is carried by the FY-4A satellite, was used to study the trigger time of the deep convective process on a small time scale. Its observation frequency is 15 min, and the spatial resolution is 4 km [52].

2.2. Data Processing

The GNSS signal travels along a curve in the atmosphere because its transmission is refracted by the atmospheric medium, such as water vapor and electric ions. Accordingly, its propagation speed has a delay effect compared with the speed in vacuum [53]. The total delay distance ΔL is related to the refractive index of the atmosphere [17],
Δ L = s N d s ,
where N is the atmospheric refractivity expressed in terms of the atmospheric properties as follows [54],
N = 4.03 × 10 6 n e f + 77.6 P d T + 70.4 P v T + 3.739 P v T 2 ,
where n e is the electron density in the atmosphere, P d is the pressure of the dry air, P v is the pressure of the humid air, f is the frequency of the electromagnetic wave, and T is the atmospheric temperature. Zenith Total Delay (ZTD) can be acquired by the above formula, which is the sum of the zenith hydrostatic delay ( ZHD ) and Zenith Wet Delay ( ZWD ). The ZHD can be received accurately based on the Saastamoinen empirical formulas [55]. Then, ZWD can be obtained by subtracting ZHD from the ZTD . It has been proved that the ZWD is related to PWV as follows [17],
PWV =   × ZWD ,
Π is a mapping function that can be calculated as follows [17],
  = 10 6 ρ R v k 3 T m + k 2 ω k 1 .
where ρ represents the water vapor density, R v is the atmospheric constant of water vapor, k 1 , k 2 , k 3 , and ω are physical constants, and T m is the average temperature of the atmosphere, which can be expressed by the surface air temperature as T m = 70.2 + 0.72   T s . The surface temperature ( T s ) observed by the radiosonde can be used for regression analysis to establish coefficient values in accordance with the characteristics of the area [56,57,58].

3. Results and Discussion

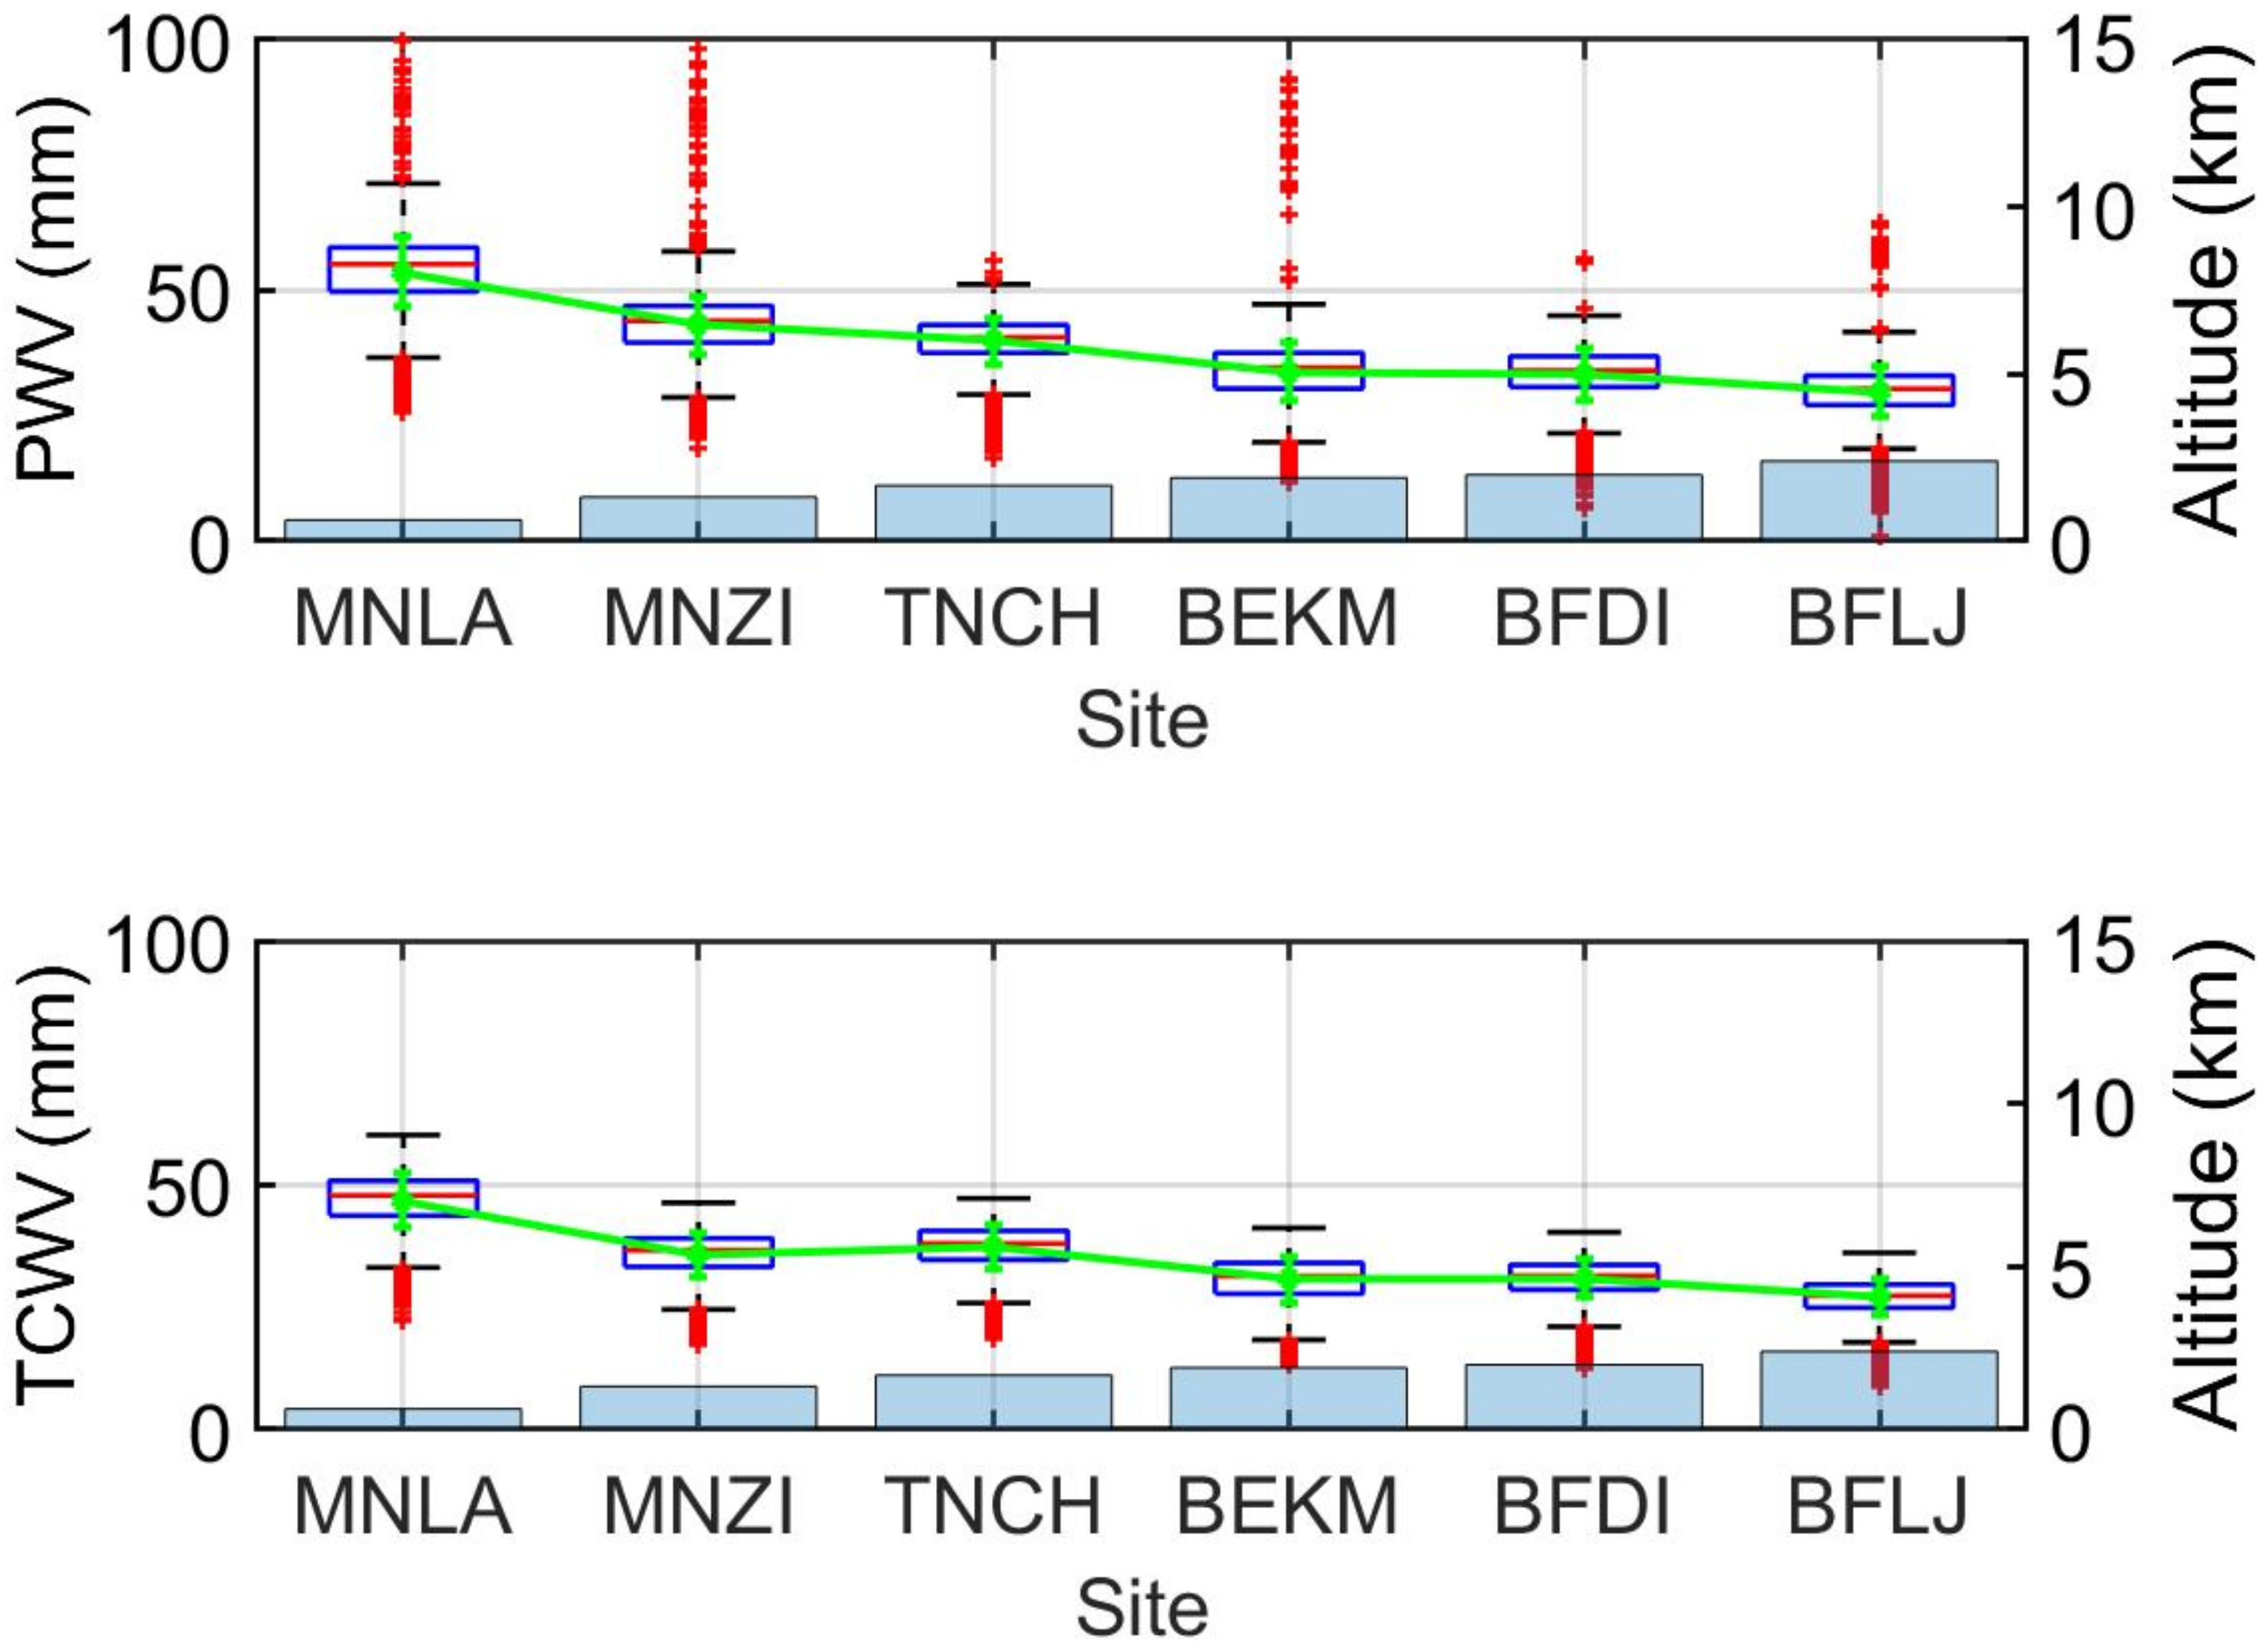
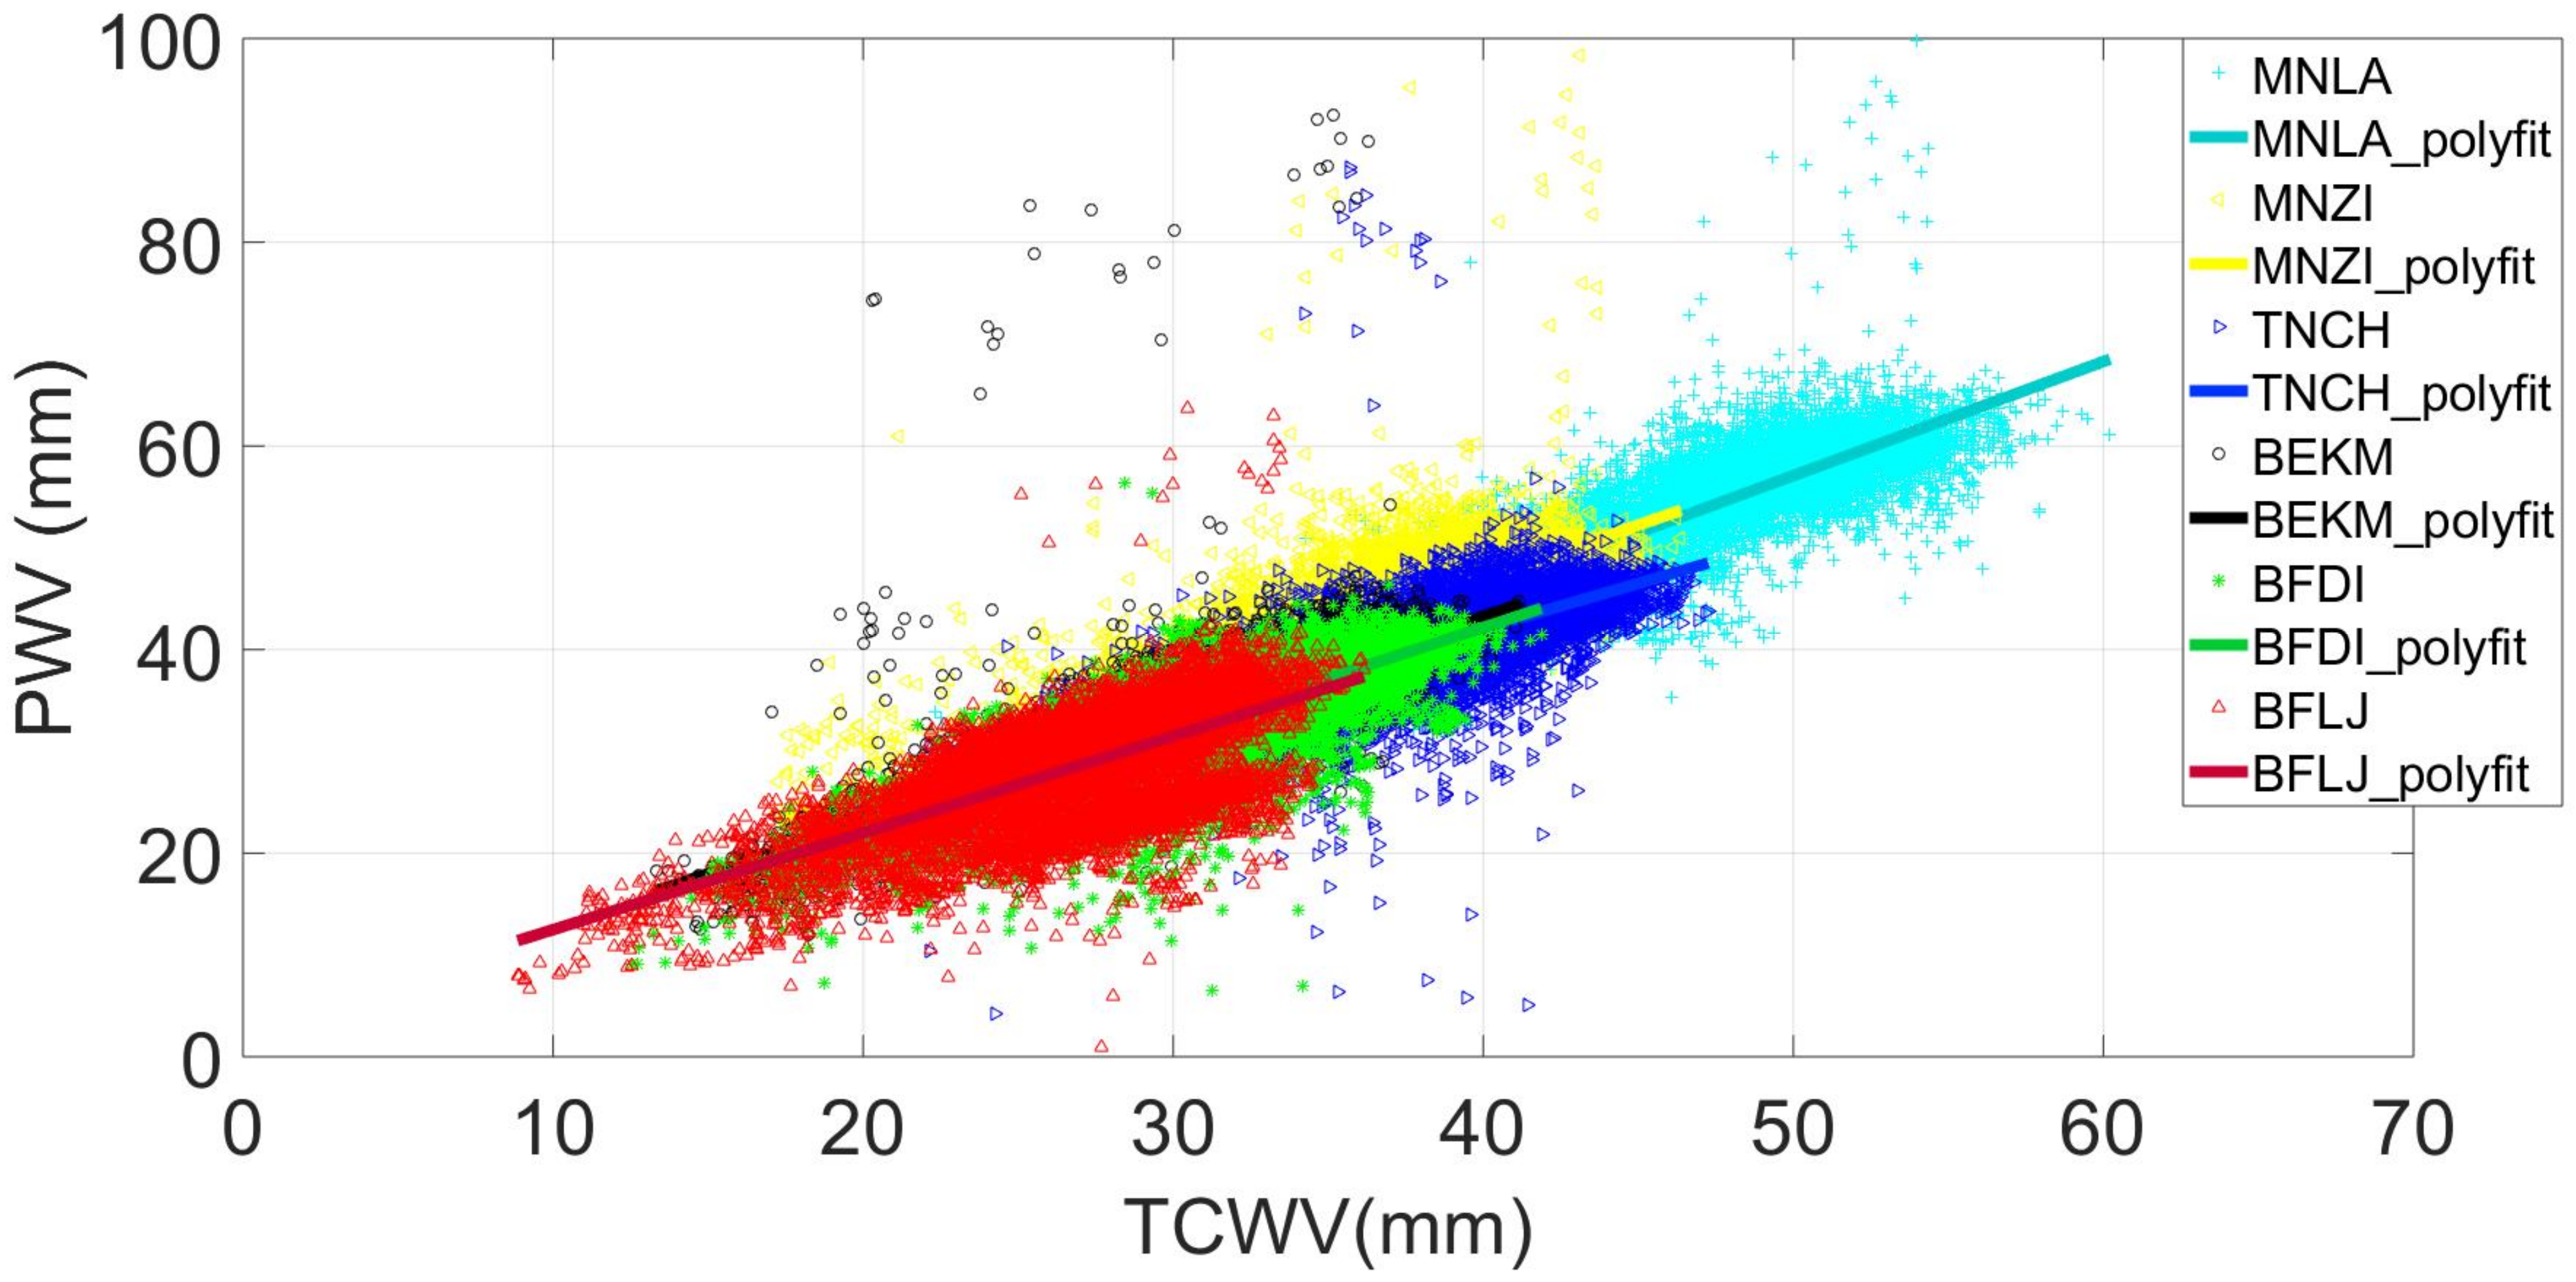
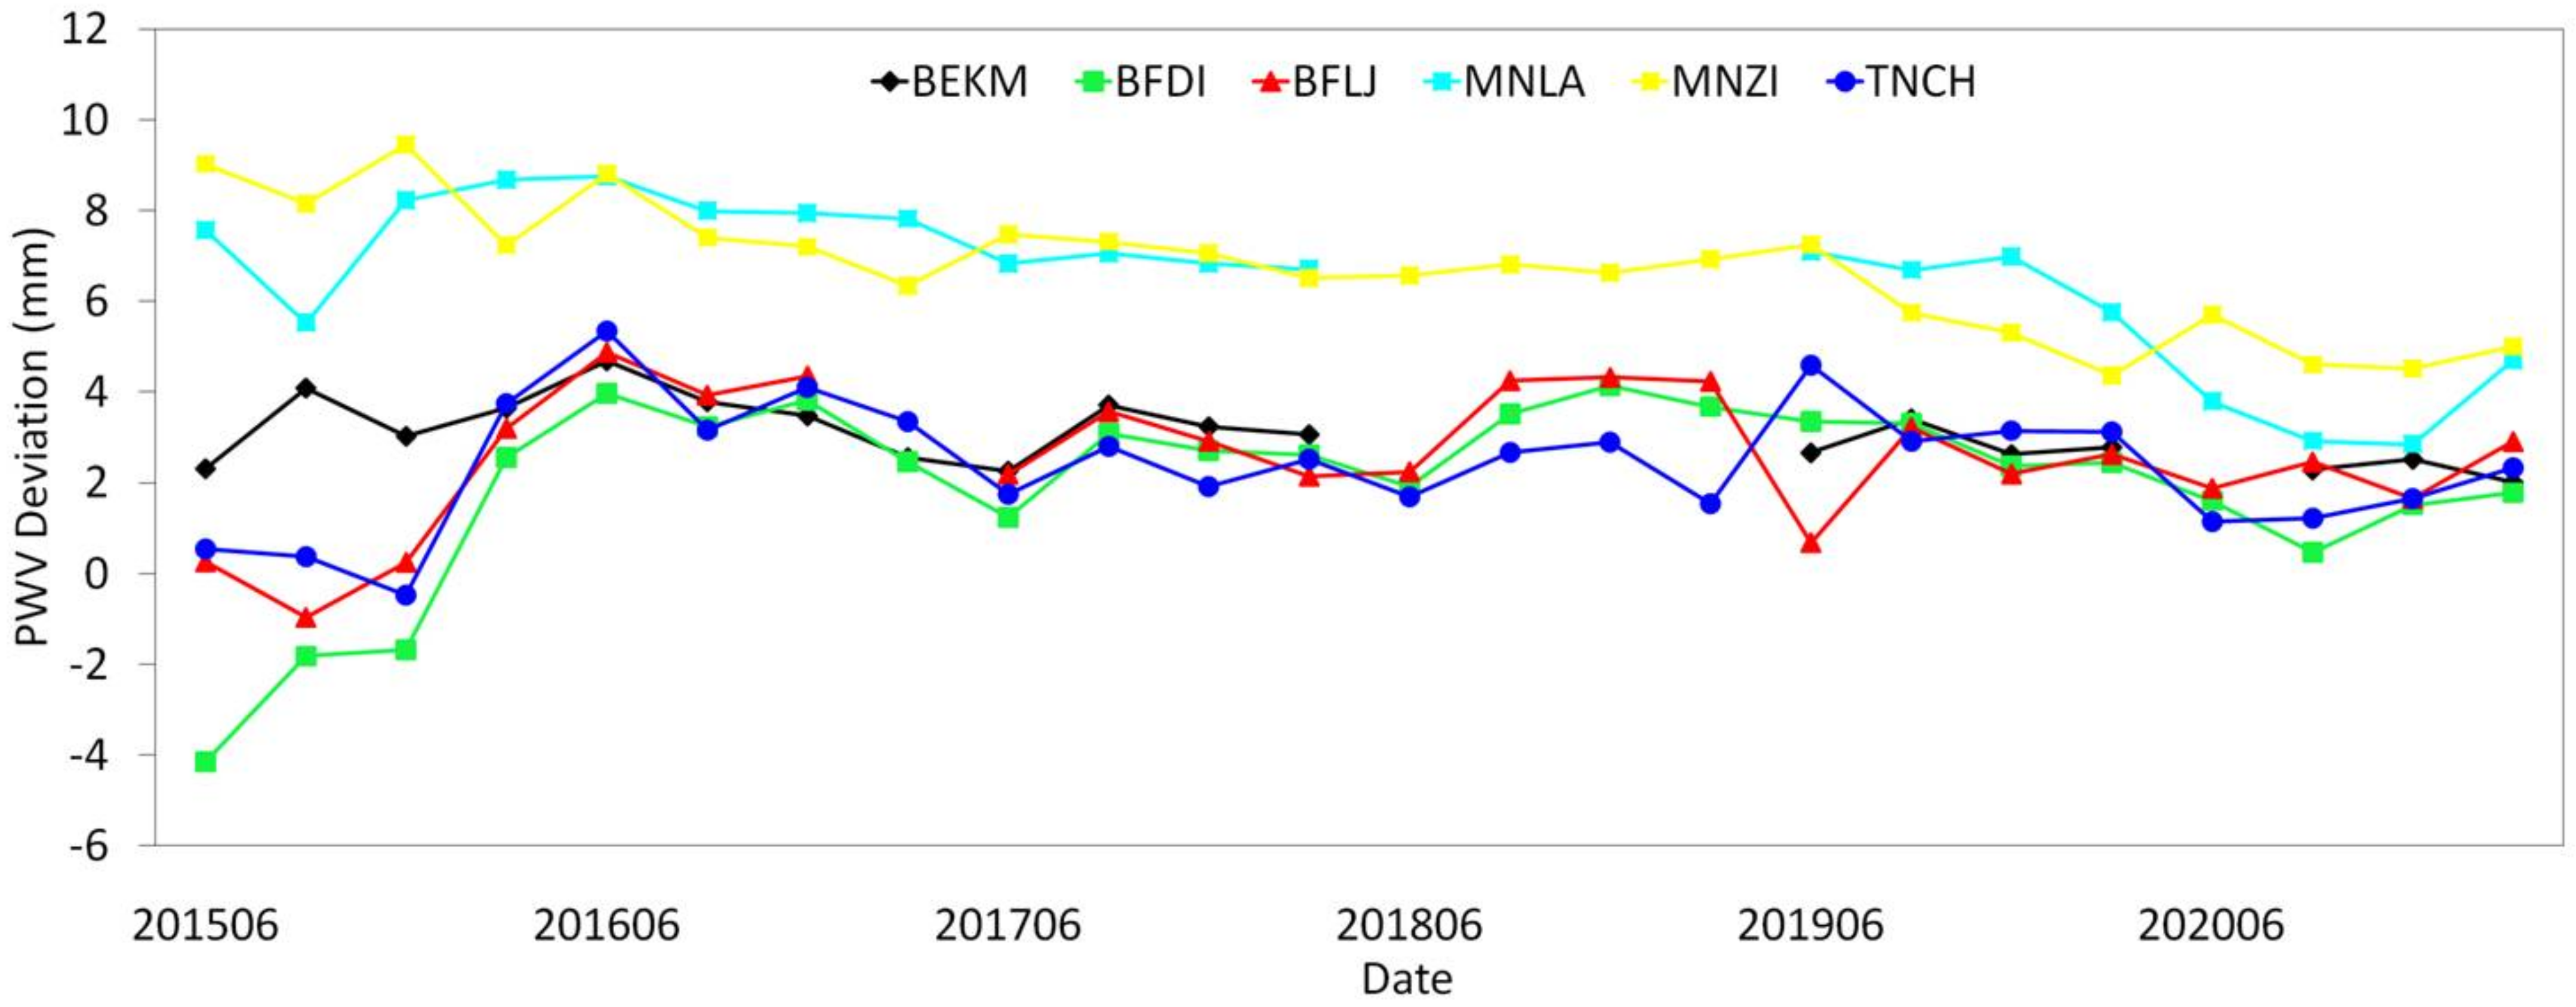
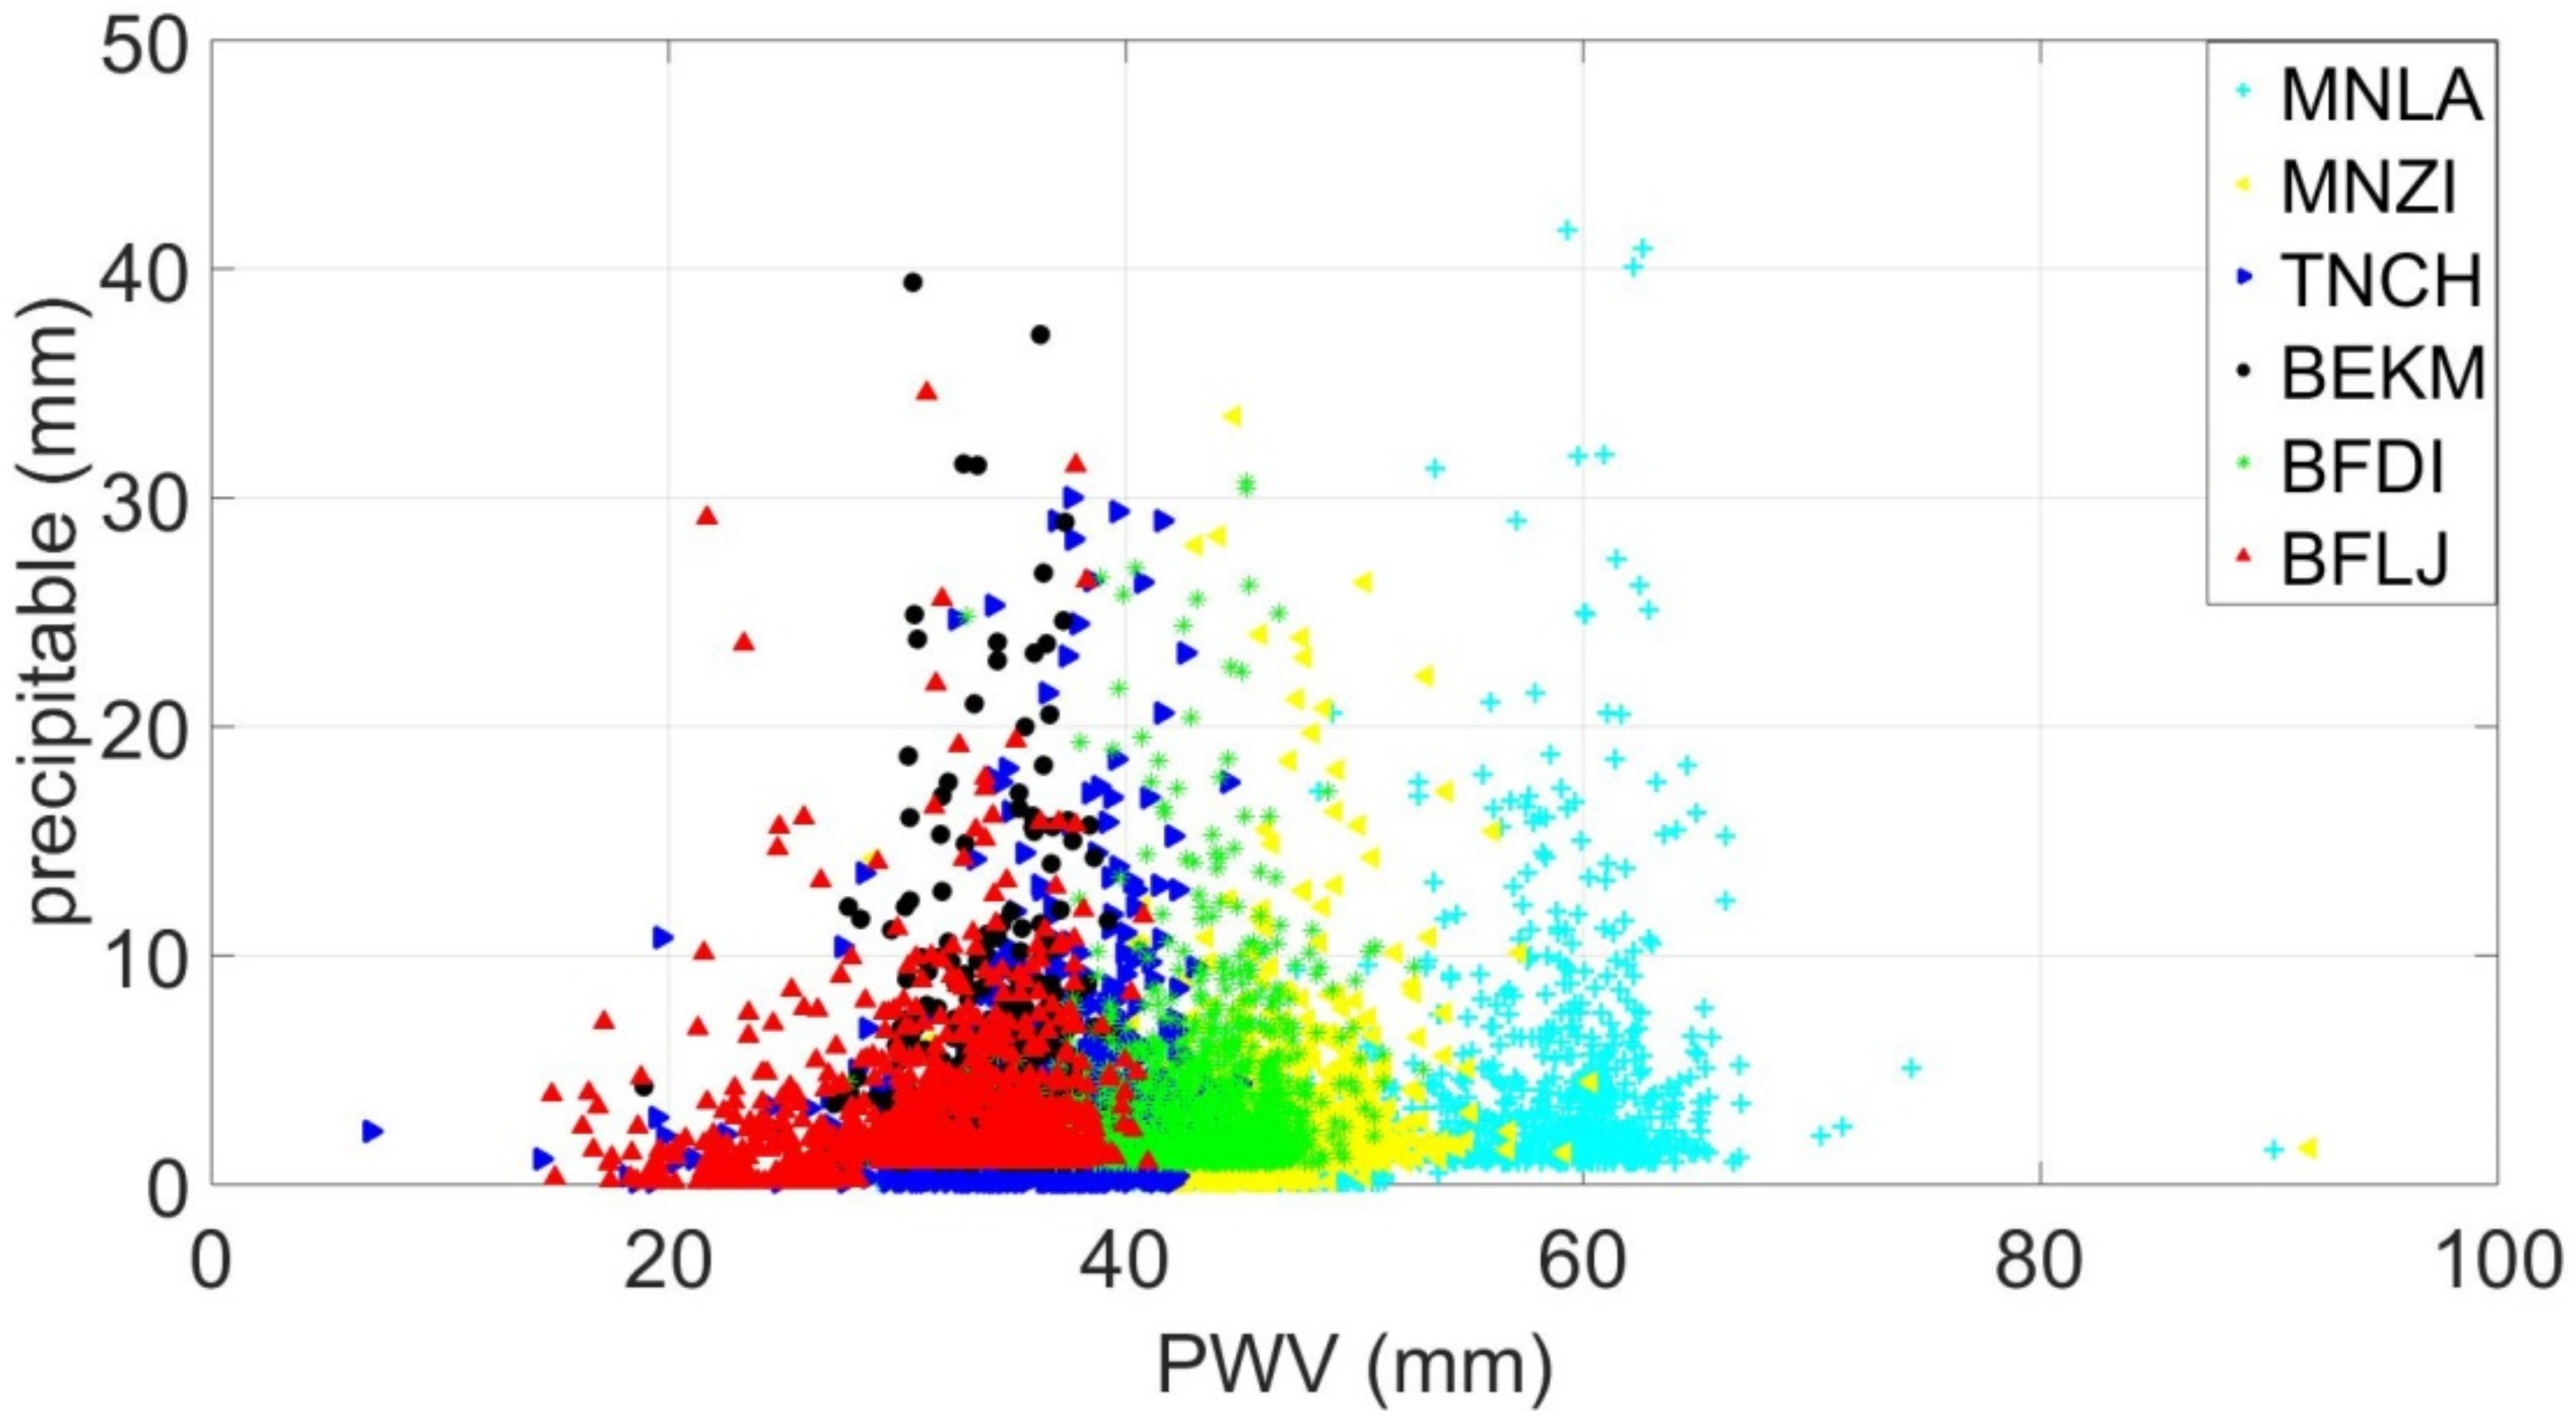
3.1. PWV Feature Analysis

First, we analyzed the features of the PWV of the six stations with complete multi-source data matching. Figure 2 shows the box plot of the TCWV and PWV data. The light blue column represents the altitude of the station. Both data have a positive correlation with altitude, which may be related to the low altitude and longer observation path. Moreover, the atmospheric water vapor is mainly distributed below the altitude of 3 km, so the fluctuation in the water vapor content with the altitude change is even more obvious. In addition, the two types of data at high-altitude stations are evenly distributed, while the PWV of the low-altitude stations is relatively scattered. The outliers of PWV at MNLA, MNZI, and BEKM are scattered outside the upper and lower limits, while the PWVs of other stations are mainly distributed below the lower limit, as well as all the outliers of TCWV, which demonstrates that PWV in these periods changed significantly. Furthermore, the median line of PWV at the MNLA station exceeded 50 mm, which is significantly higher than that at the same station. The green curve and error bars represent the mean and standard deviation of the PWV and the TCWV, respectively, which shows a consistent trend of change, and the error bars indicate that the standard deviation of low-altitude stations is large.
The PWV and TCWV of the six stations were matched in time and space. The time resolution of both data was 1 h and the location of the TCWV grid point was selected to be closest to the GNSS/MET station. The data volume after matching was completed is shown in Table 2. Accordingly, the PWV of the TNCH station is relatively complete, while the other stations have different degrees missing observations. Specifically, the lack of data at the MNLA station is more serious because of data transmission problems. This study did not perform quality control in the analysis process, because the threshold value (0–100 mm) was set when calculating the GNSS/MET observation data. The scattered point distribution of the stations in Figure 3 shows that the PWV of the six stations has neither long-term continuous loss nor a systematic deviation between PWV and TCWV. In view of the advantages of the stability and continuity of the reanalyzed data, we believe that PWV also has these features. However, the PWV has some abnormal values, so we studied the causes of these outliers in the further PWV accuracy analysis. The correlation coefficient, standard deviation, and average deviation between the two datasets were calculated to clarify that the correlation between the TCWV and the PWV of the six stations exceeded 80%, and the correlation coefficient decreased as the altitude of the station increased. The standard deviation was distributed between 4.686 and 7.338 mm, and the average deviation was between 2.213 and 6.748 mm, both of which approximately positively correlated with the altitude of the station; the reason for this feature needs further study.
Figure 4 shows the deviation in the monthly averages of TCWV and PWV at the six stations. Most of the deviations from 2015 to 2020 were greater than zero, which indicates that the PWV observations were wetter. However, previous studies have shown that ERA5 significantly underestimates the moisture content in the upper part of the atmosphere, at the layers of 3.5 and 5 km [59]. Moreover, the deviation from June 2015 to September 2015 was smaller than those of other time periods, demonstrating that the results of PWV and TCWV in 2015 are relatively close. The low value of the deviation in June 2020 is related to the improvement of our PWV calculation algorithm at that time. The deviations in the BFLJ and FFDI stations are less than zero at certain times, which reveals that the PWV observations during this time period are relatively dry, which is the opposite of the results in other periods. In addition, the deviations in the MNLA and MNZI stations are larger than those of the other stations, most of which are more than 5 mm. Therefore, this result is also consistent with the results in Table 2, which is related to the solution strategy and requires further research and analysis.
In summary, the feature analysis of the PWV data shows that the observation of the atmospheric water vapor content retrieved from the GNSS/MET stations has a relatively good stability and time continuity, which can be used for the research and analysis of water vapor distribution and variation [8] in the Yunnan–Guizhou Plateau.
The scattered point distribution of the 1 h ground precipitation and PWV after matching in time and space is shown in Figure 5. The precipitation shows a normal distribution with the PWV of the stations, which is mostly below 20 mm and is mainly concentrated below 10 mm; thus, there is no obvious difference in precipitation at a single station, and the precipitation of each station is distributed in different water vapor content intervals; for example, the precipitation at MNLA station mainly occurs when the PWV is between 50 and 65 mm, while the maximum precipitation occurs when the PWV is approximately 60 mm. However, precipitation at the other five stations mainly occurs when the PWV is between 30 and 50 mm.

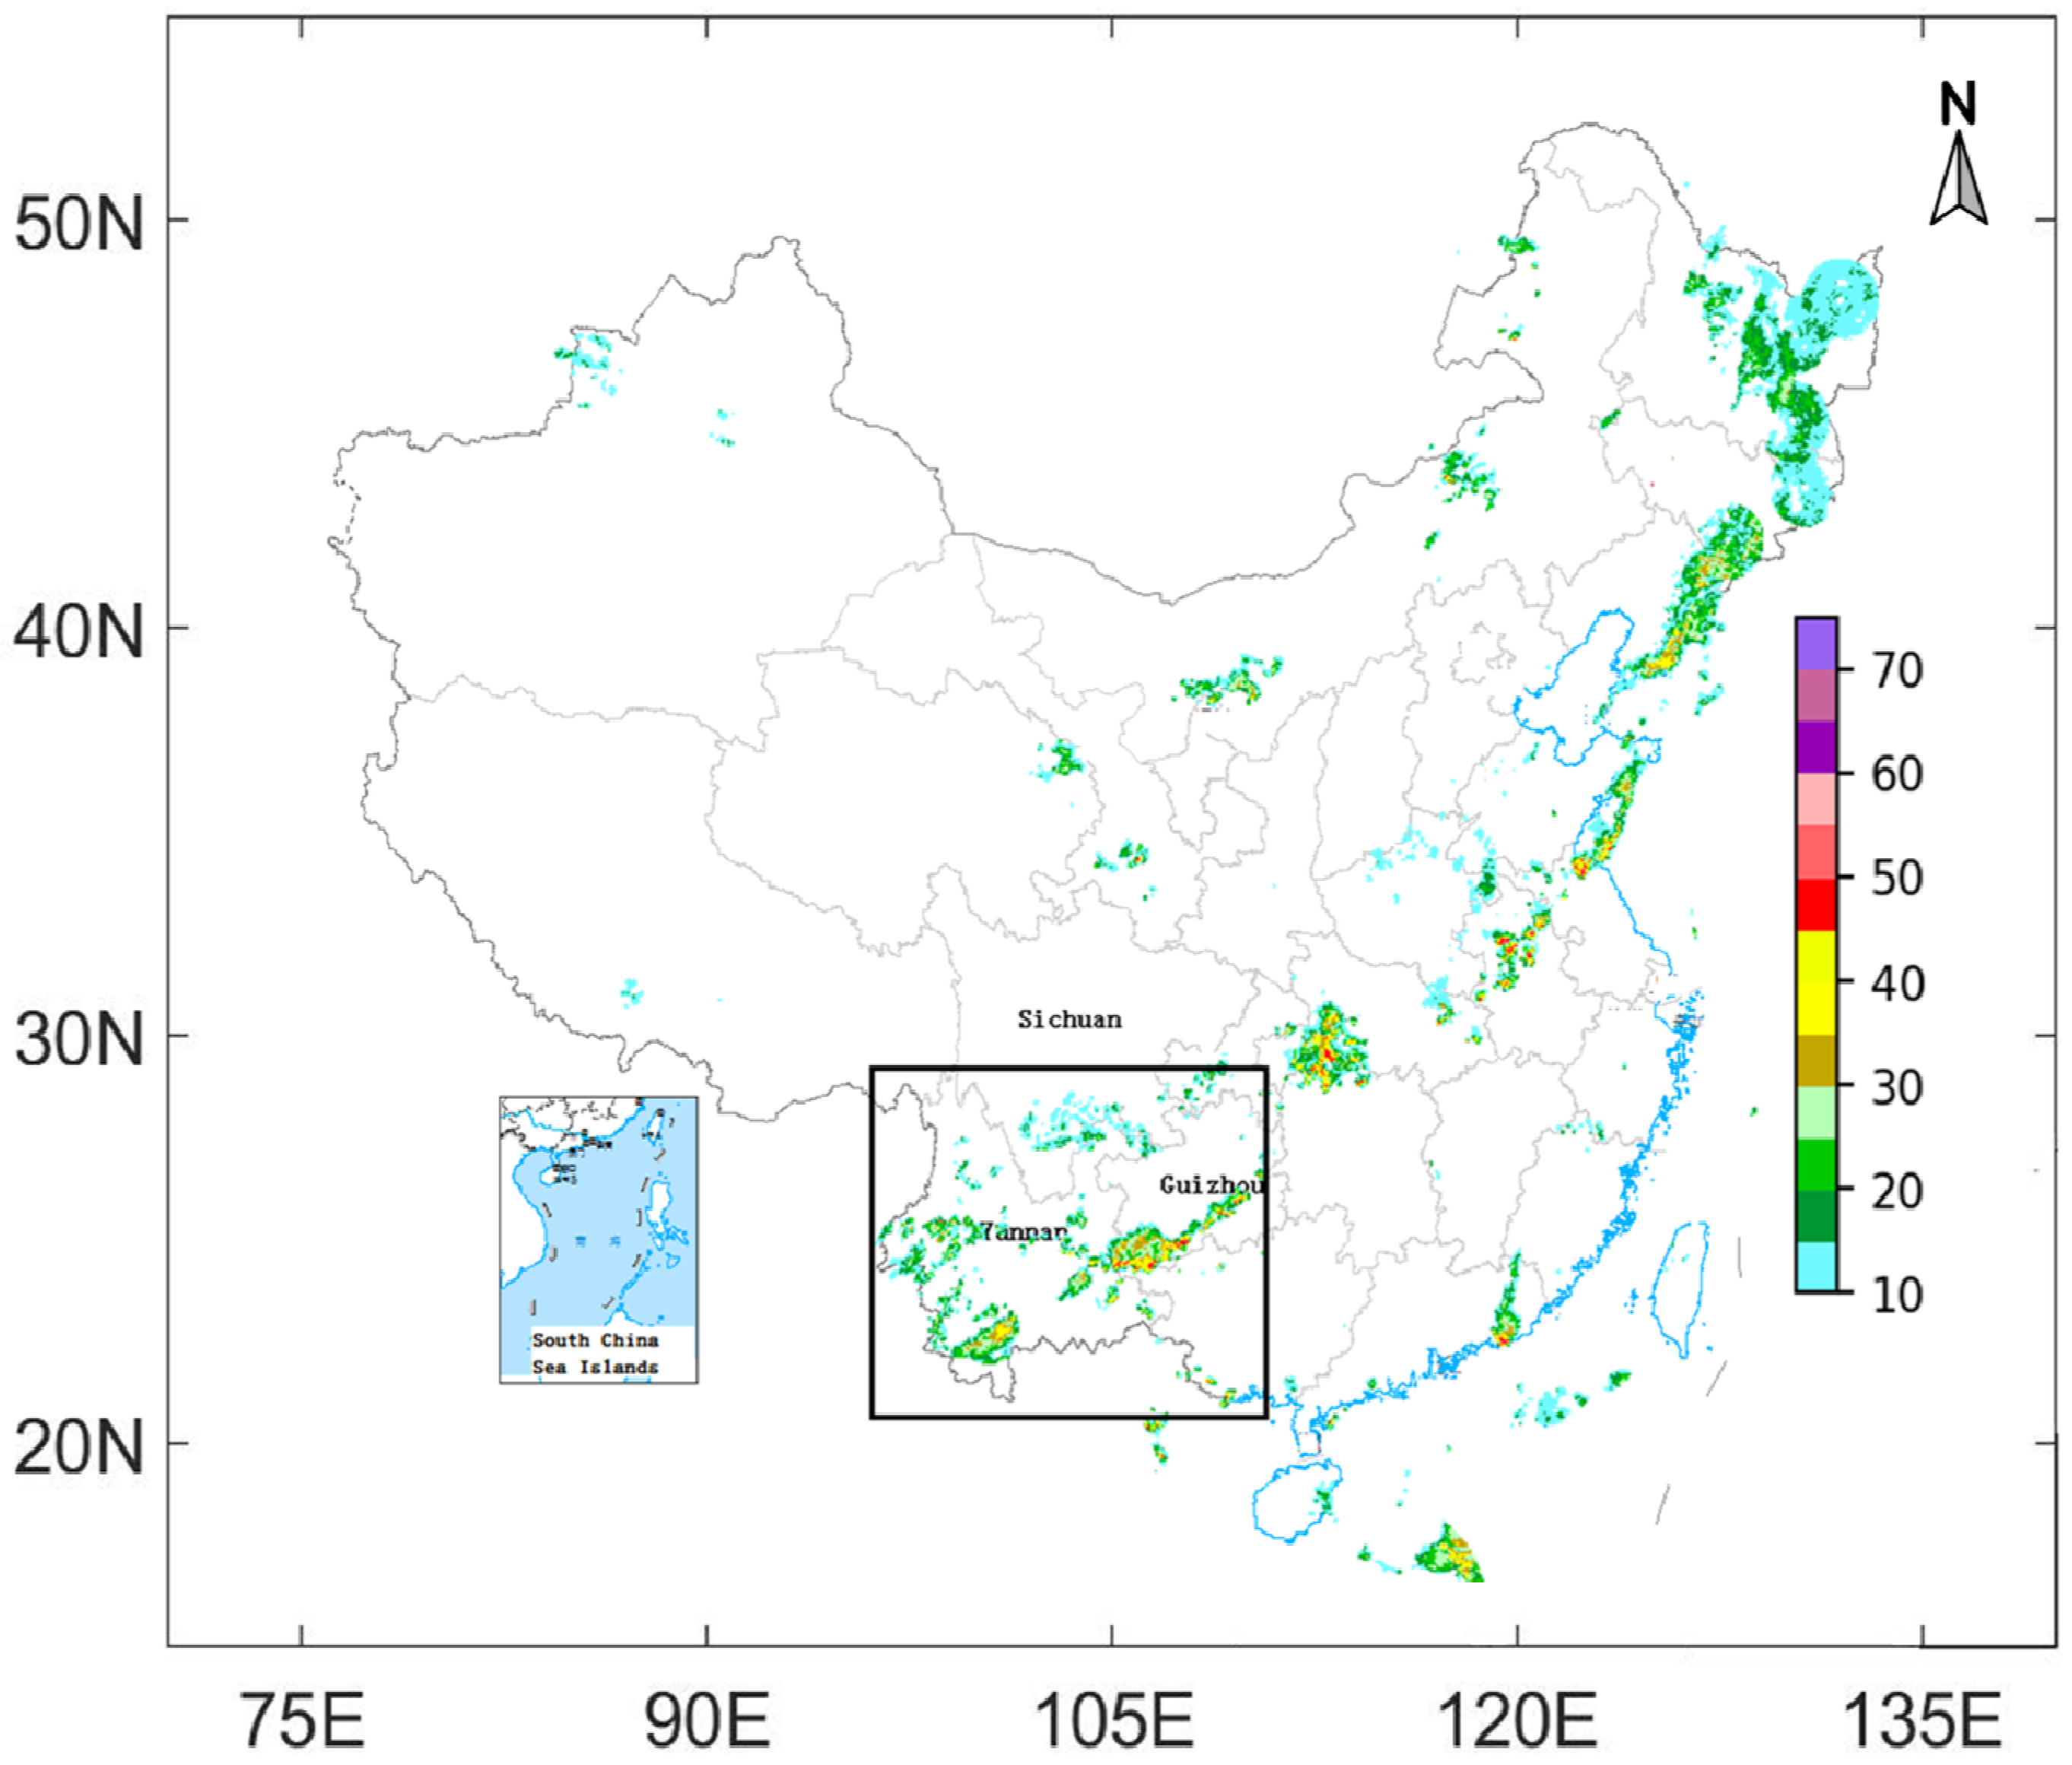
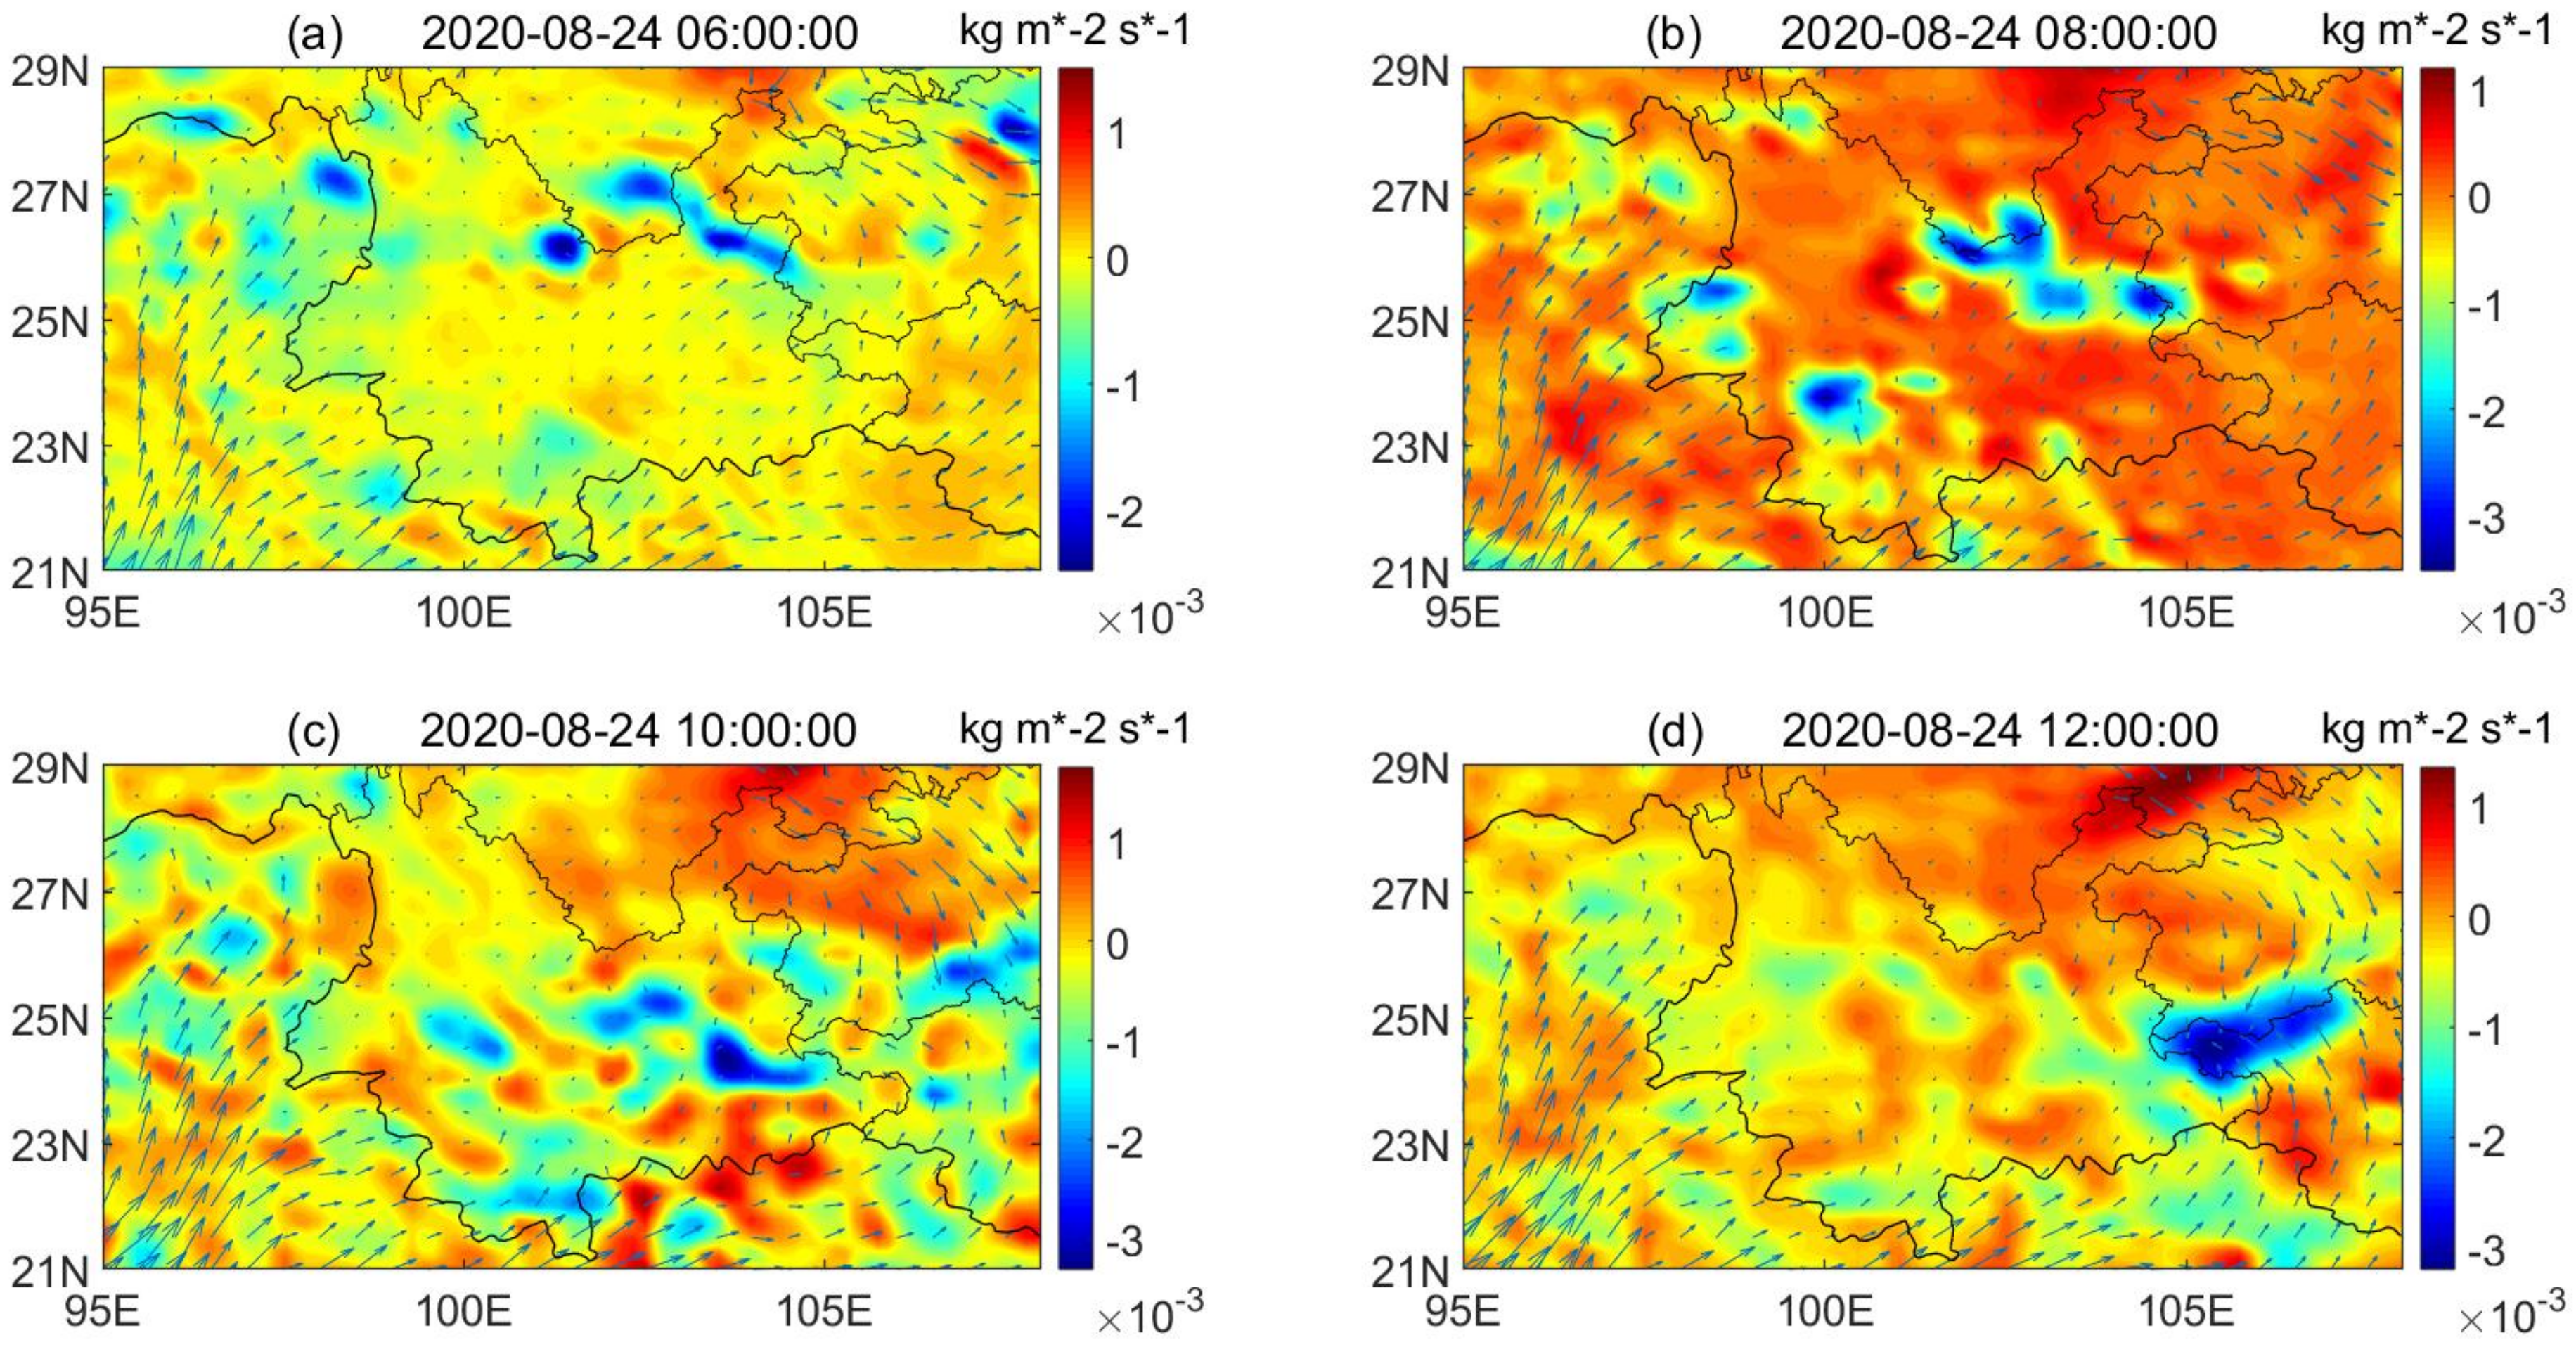
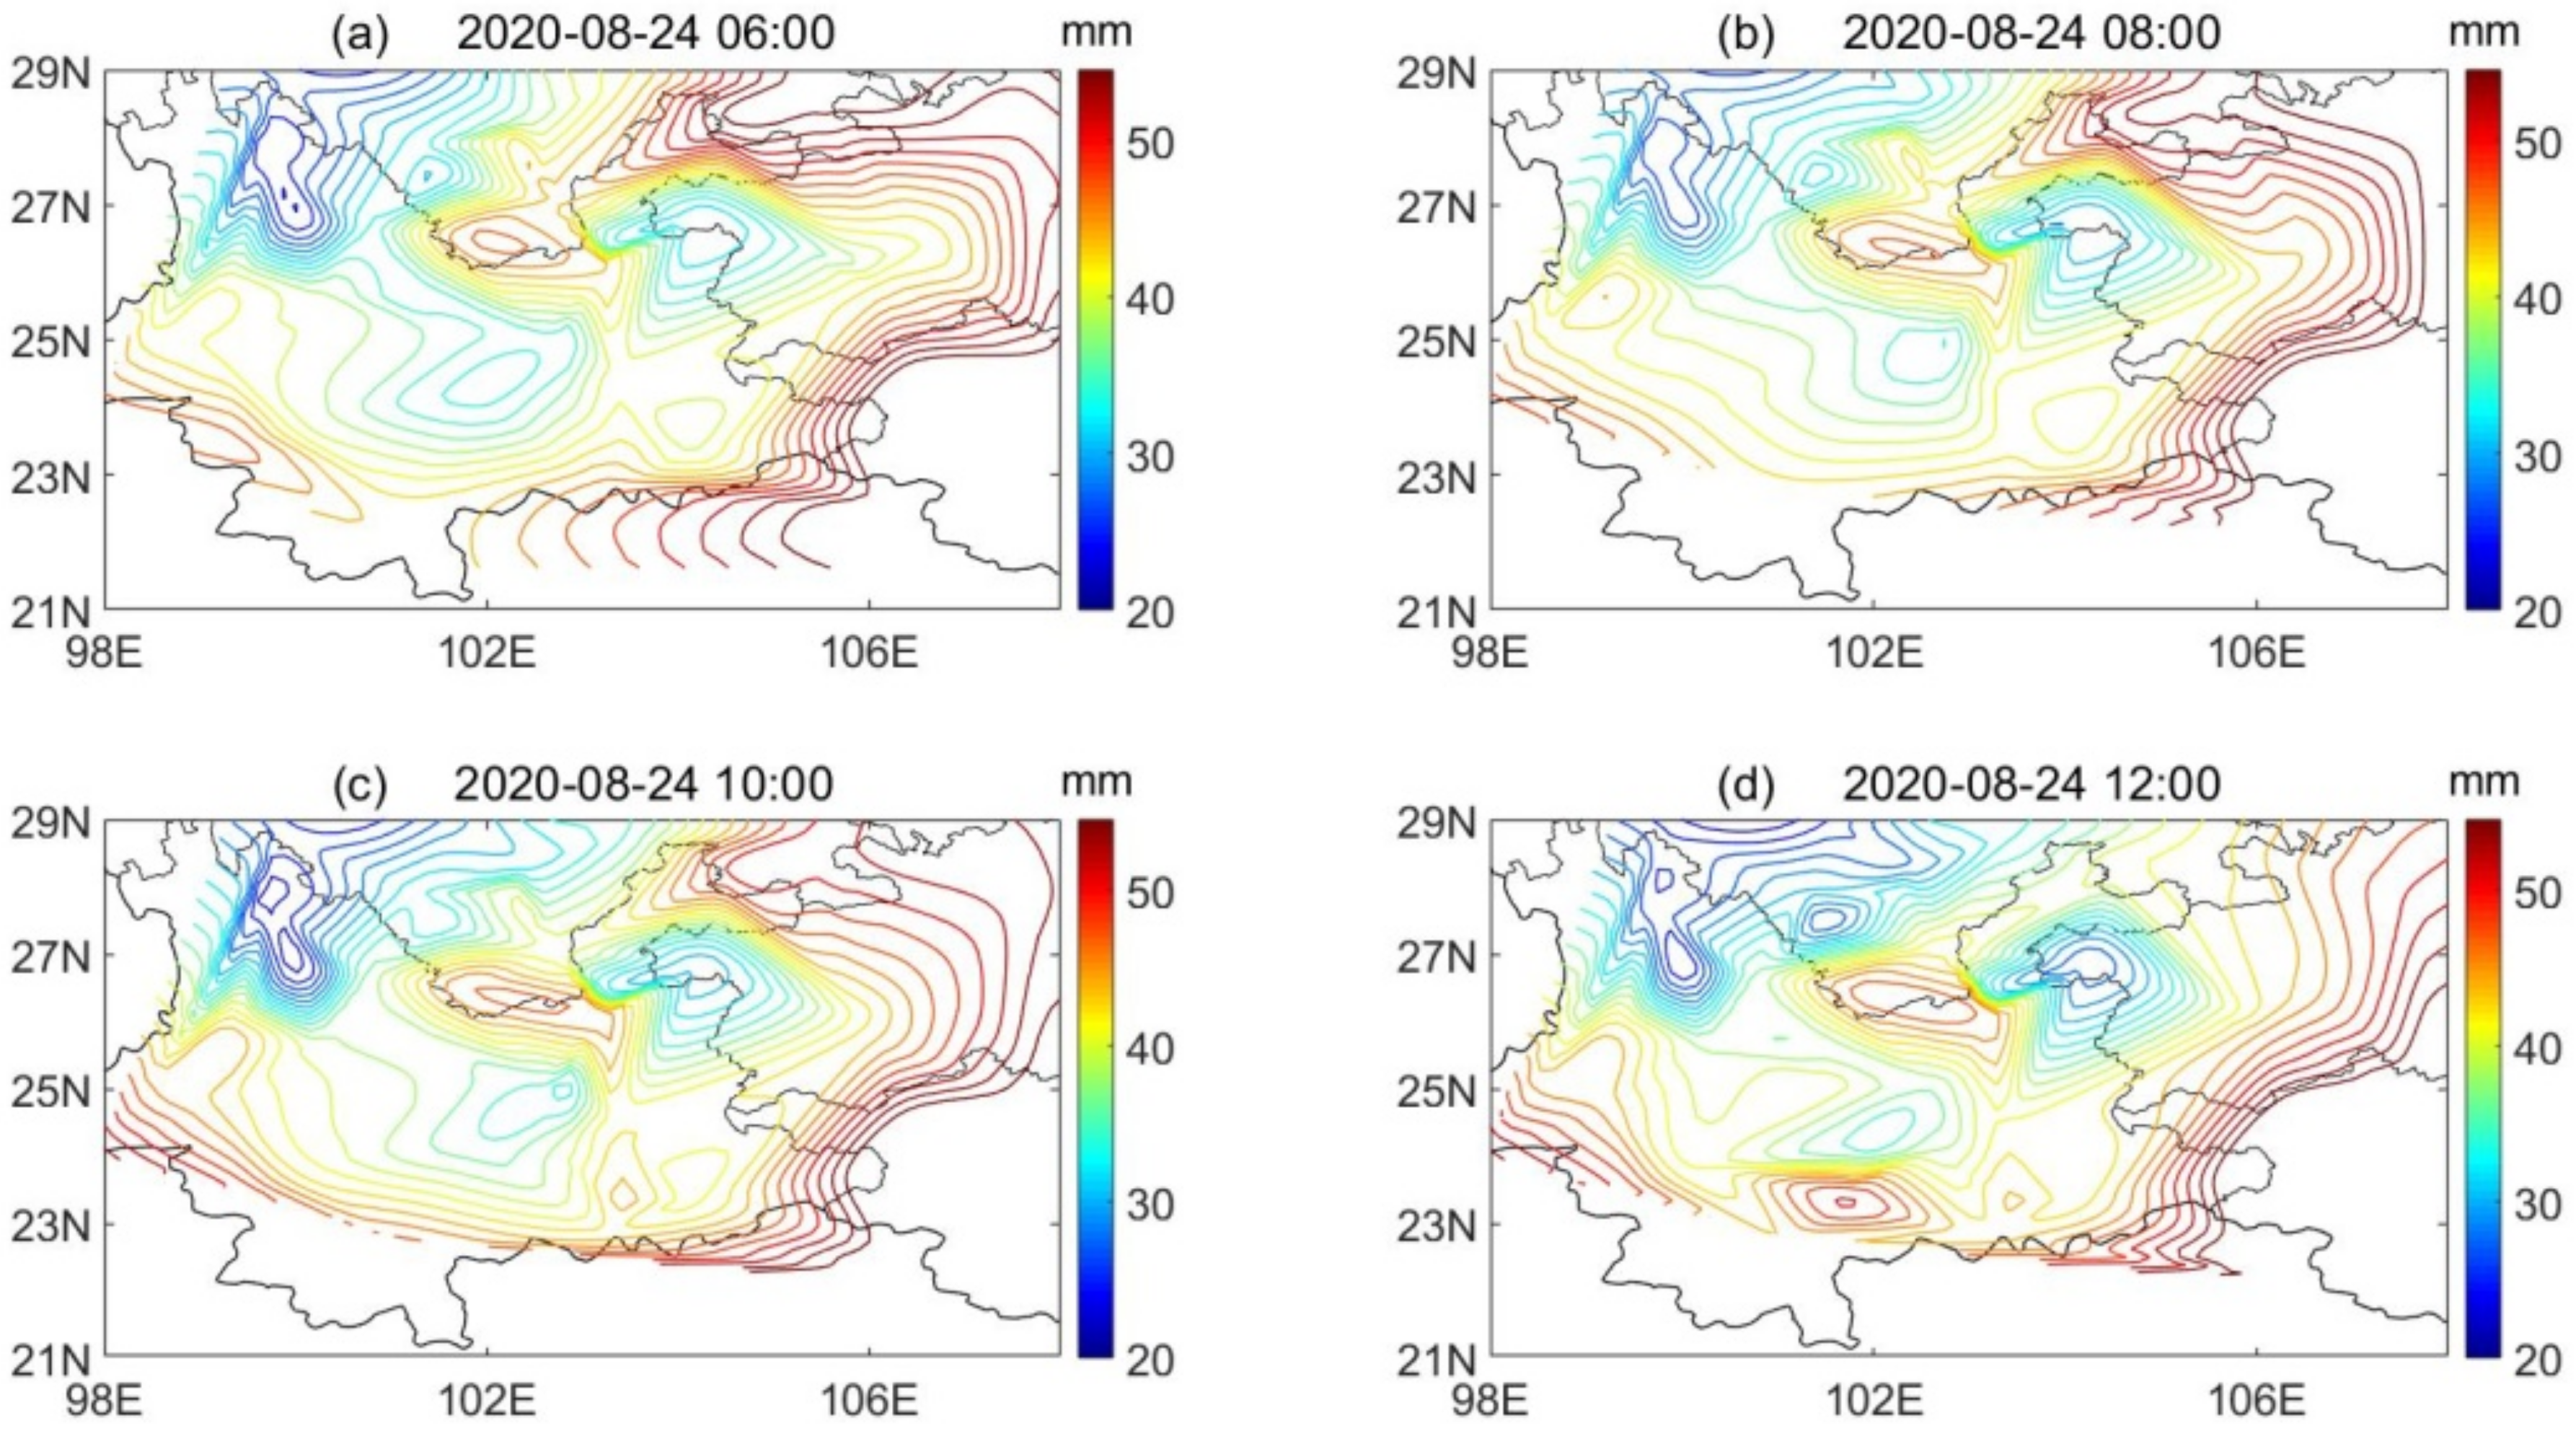
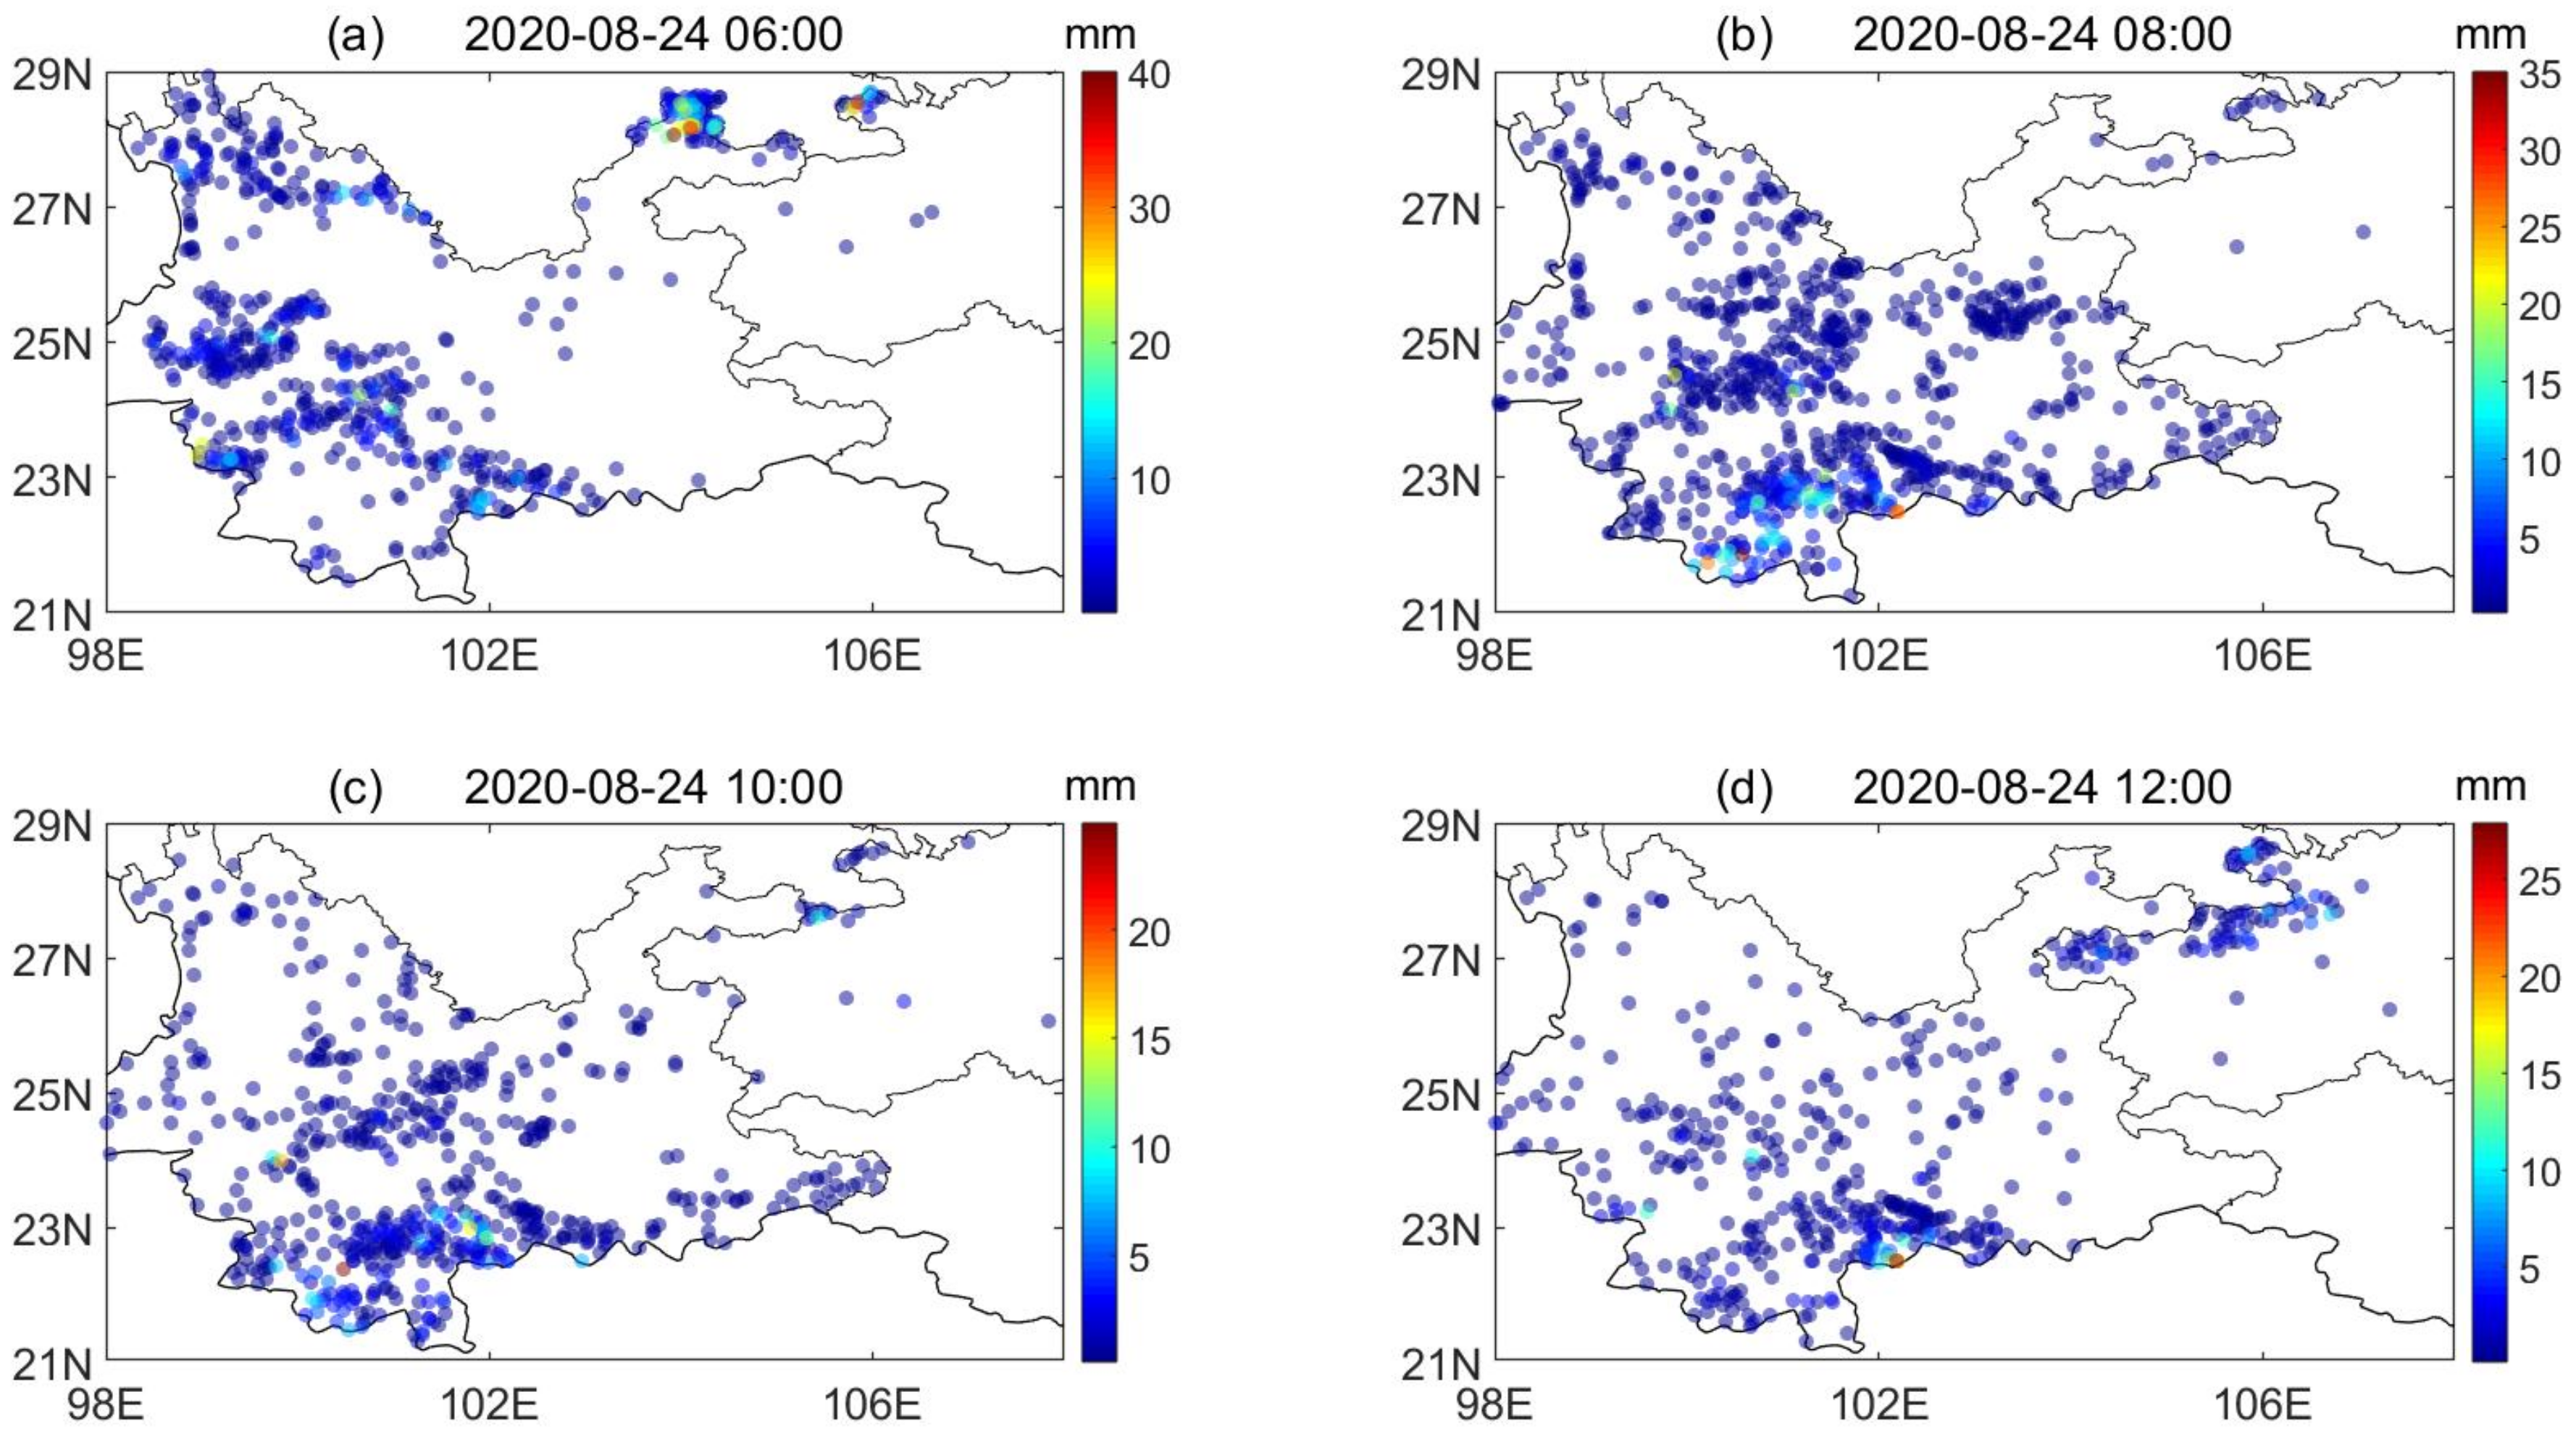
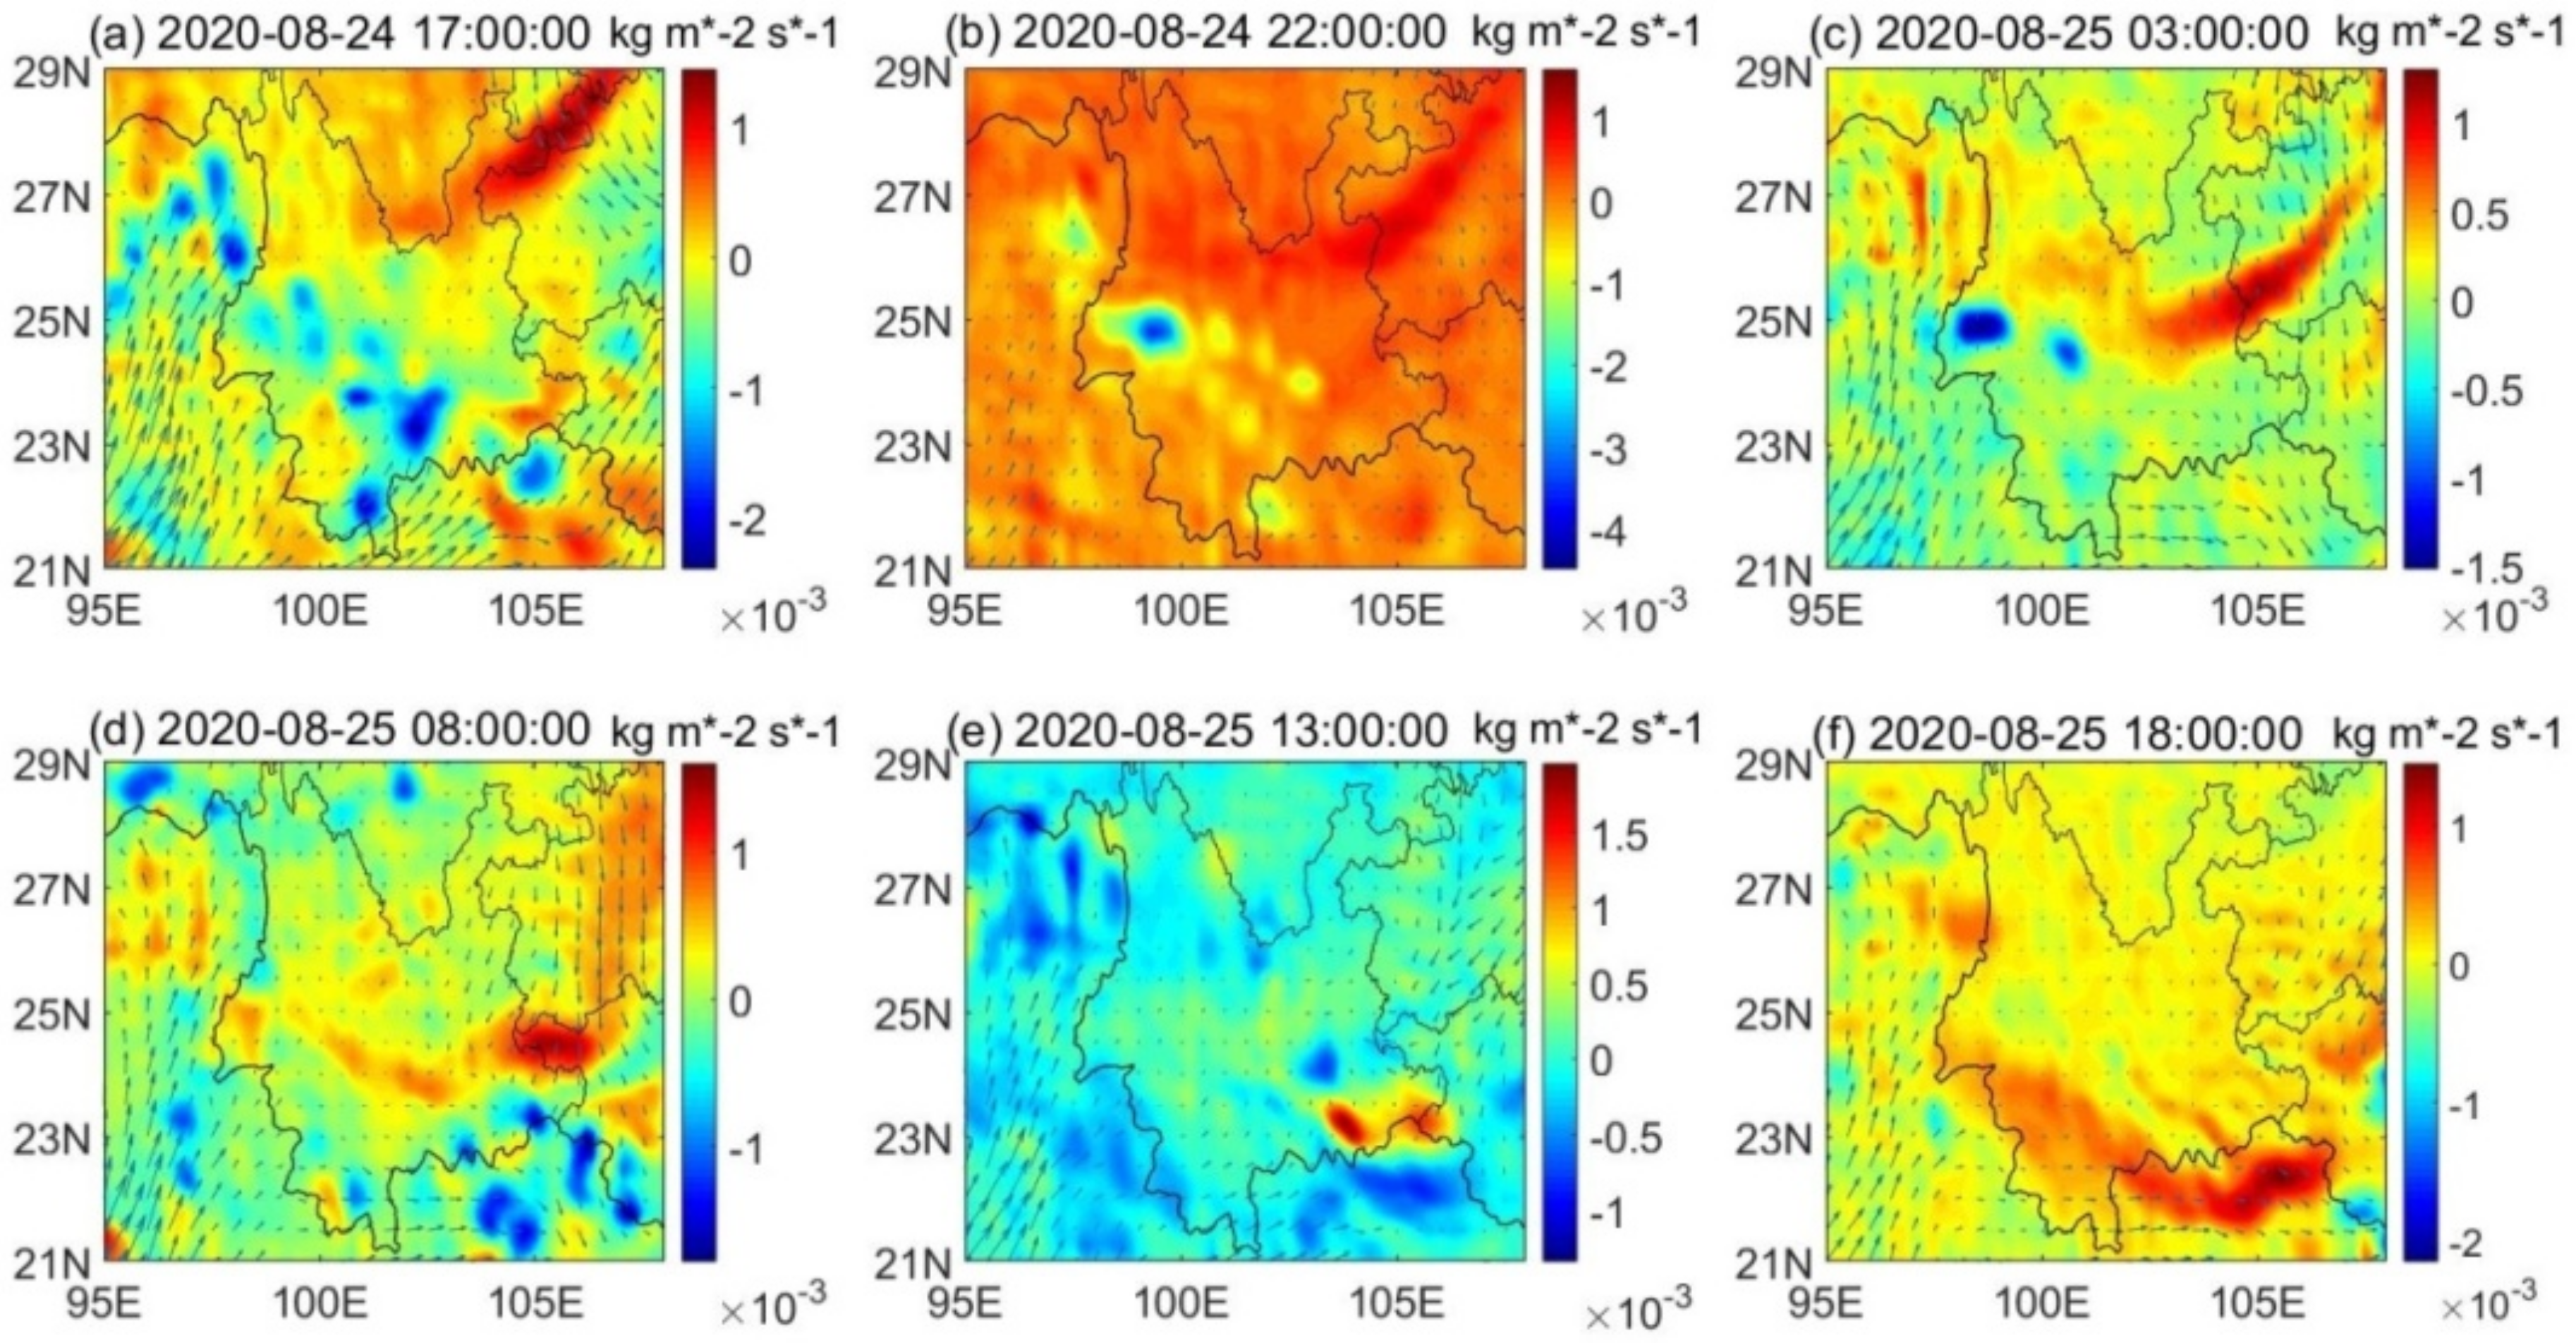
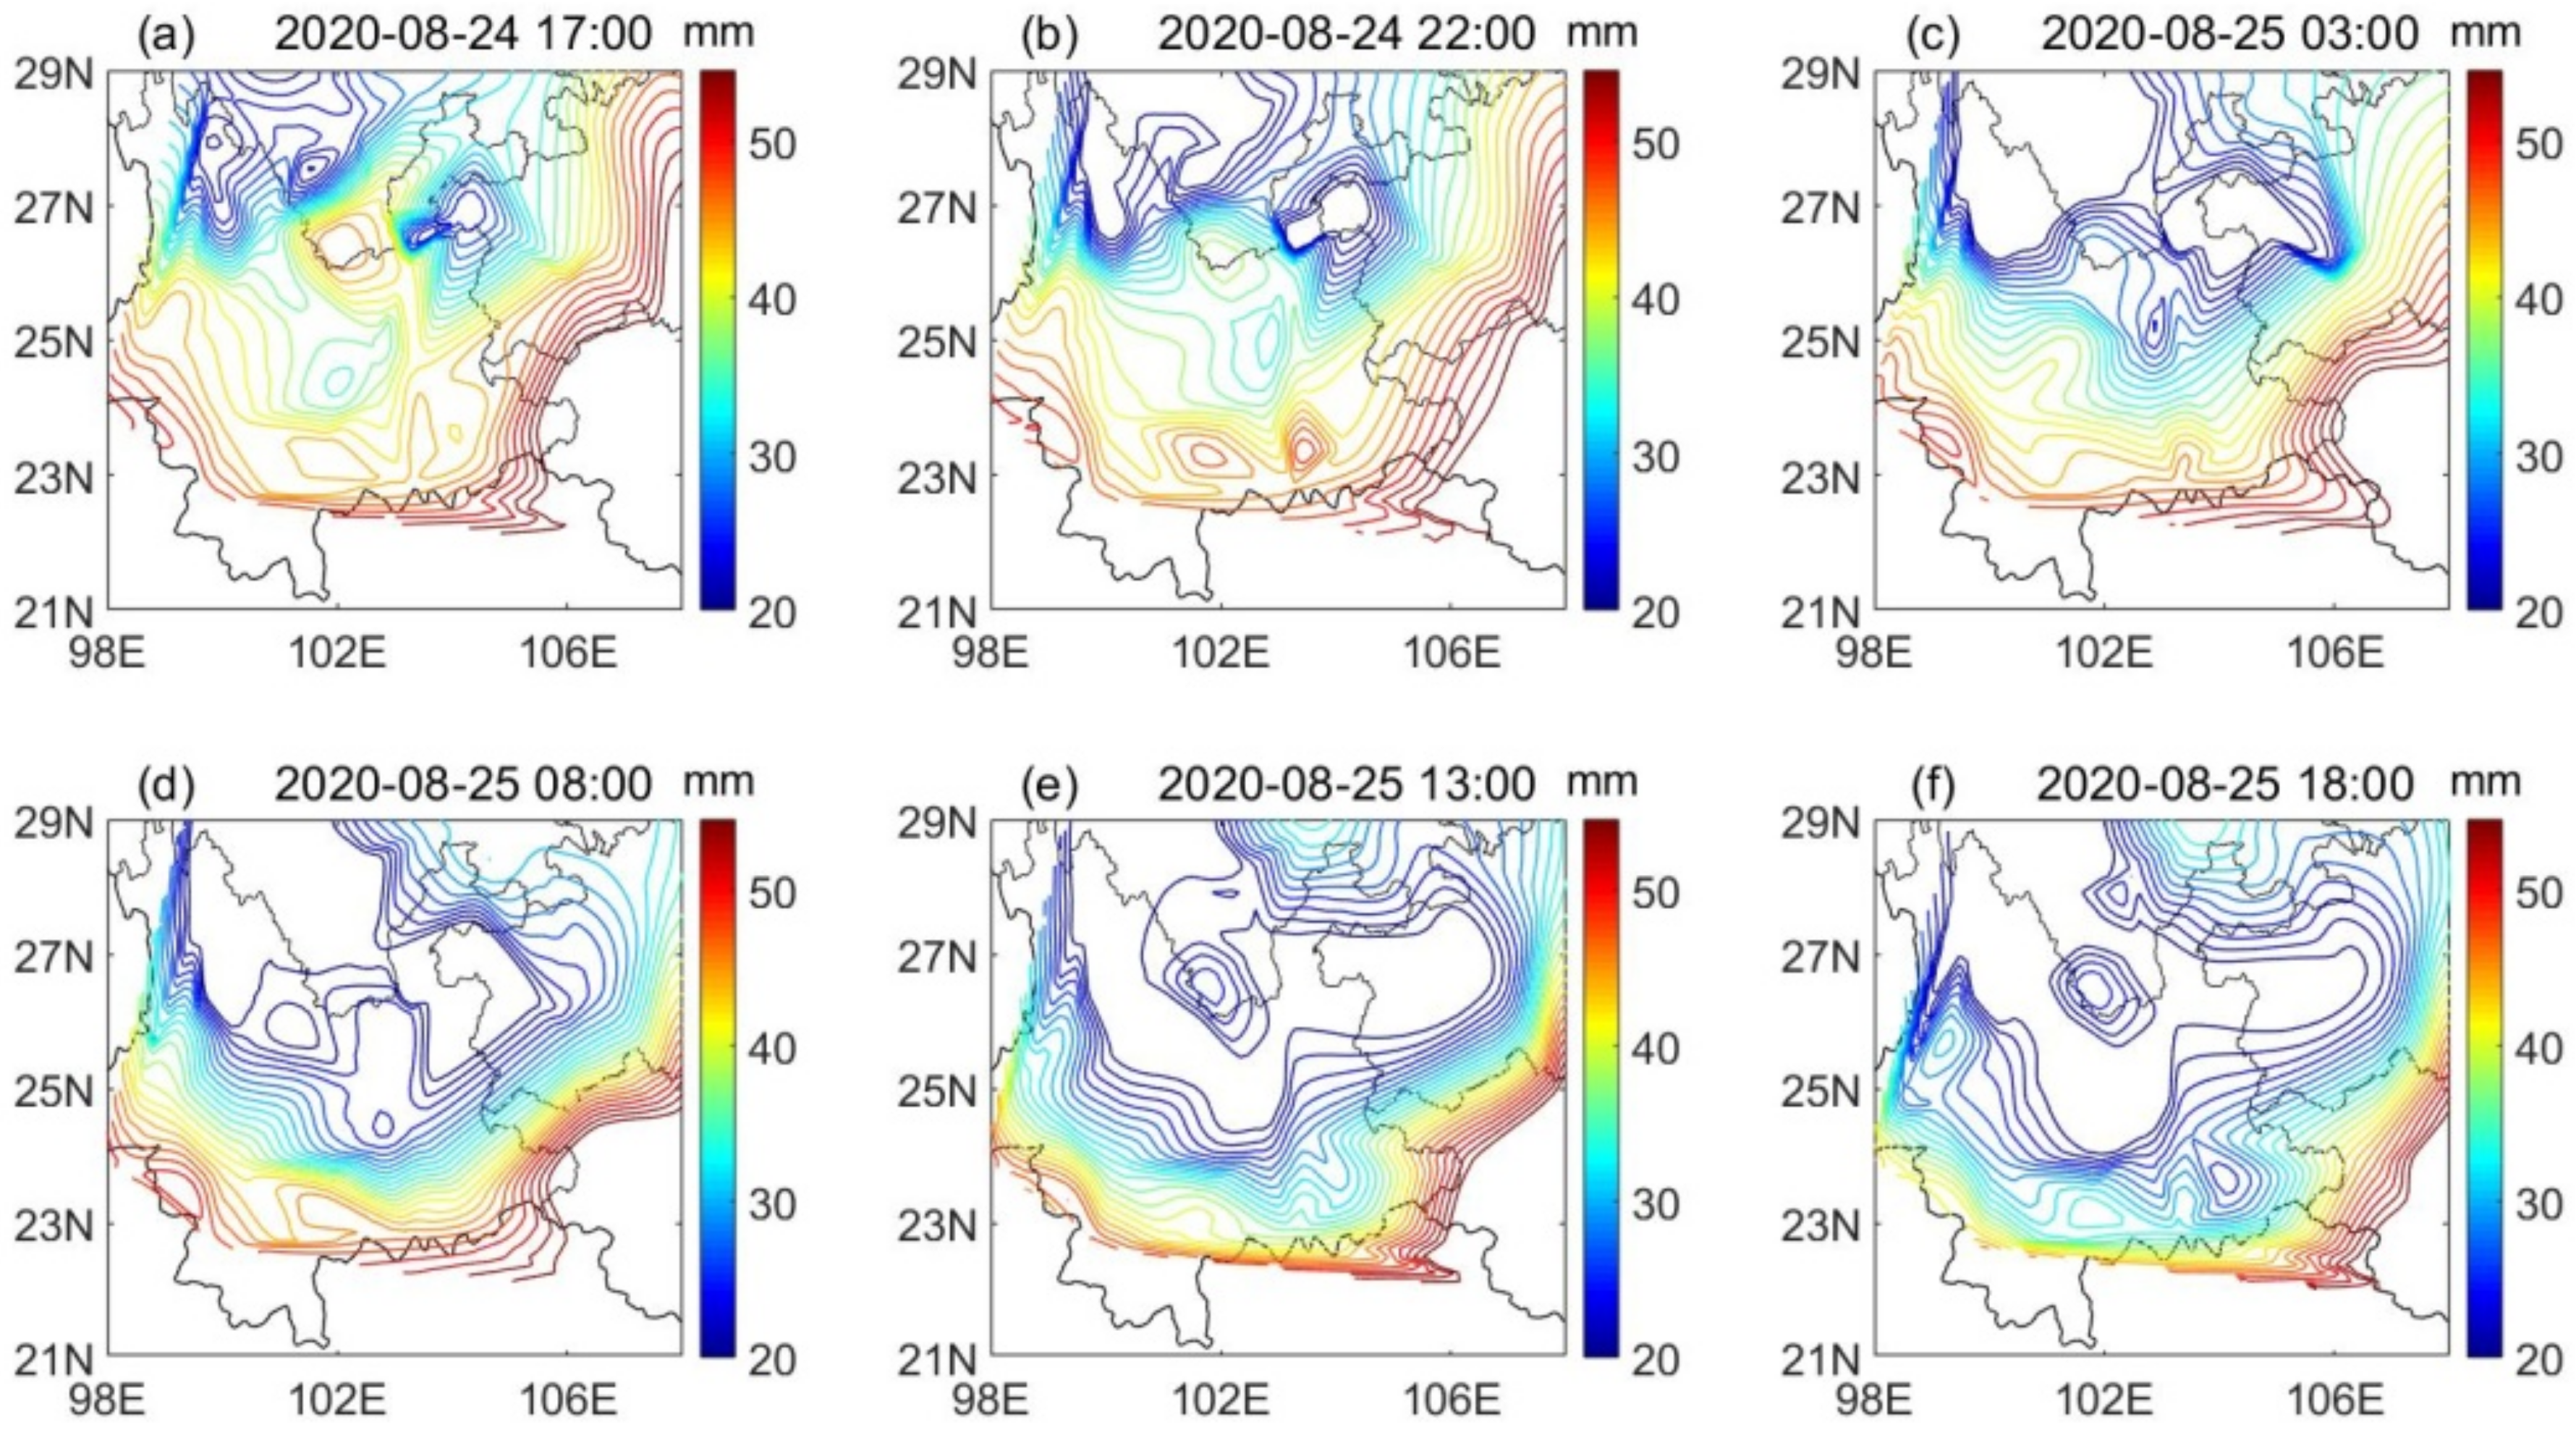
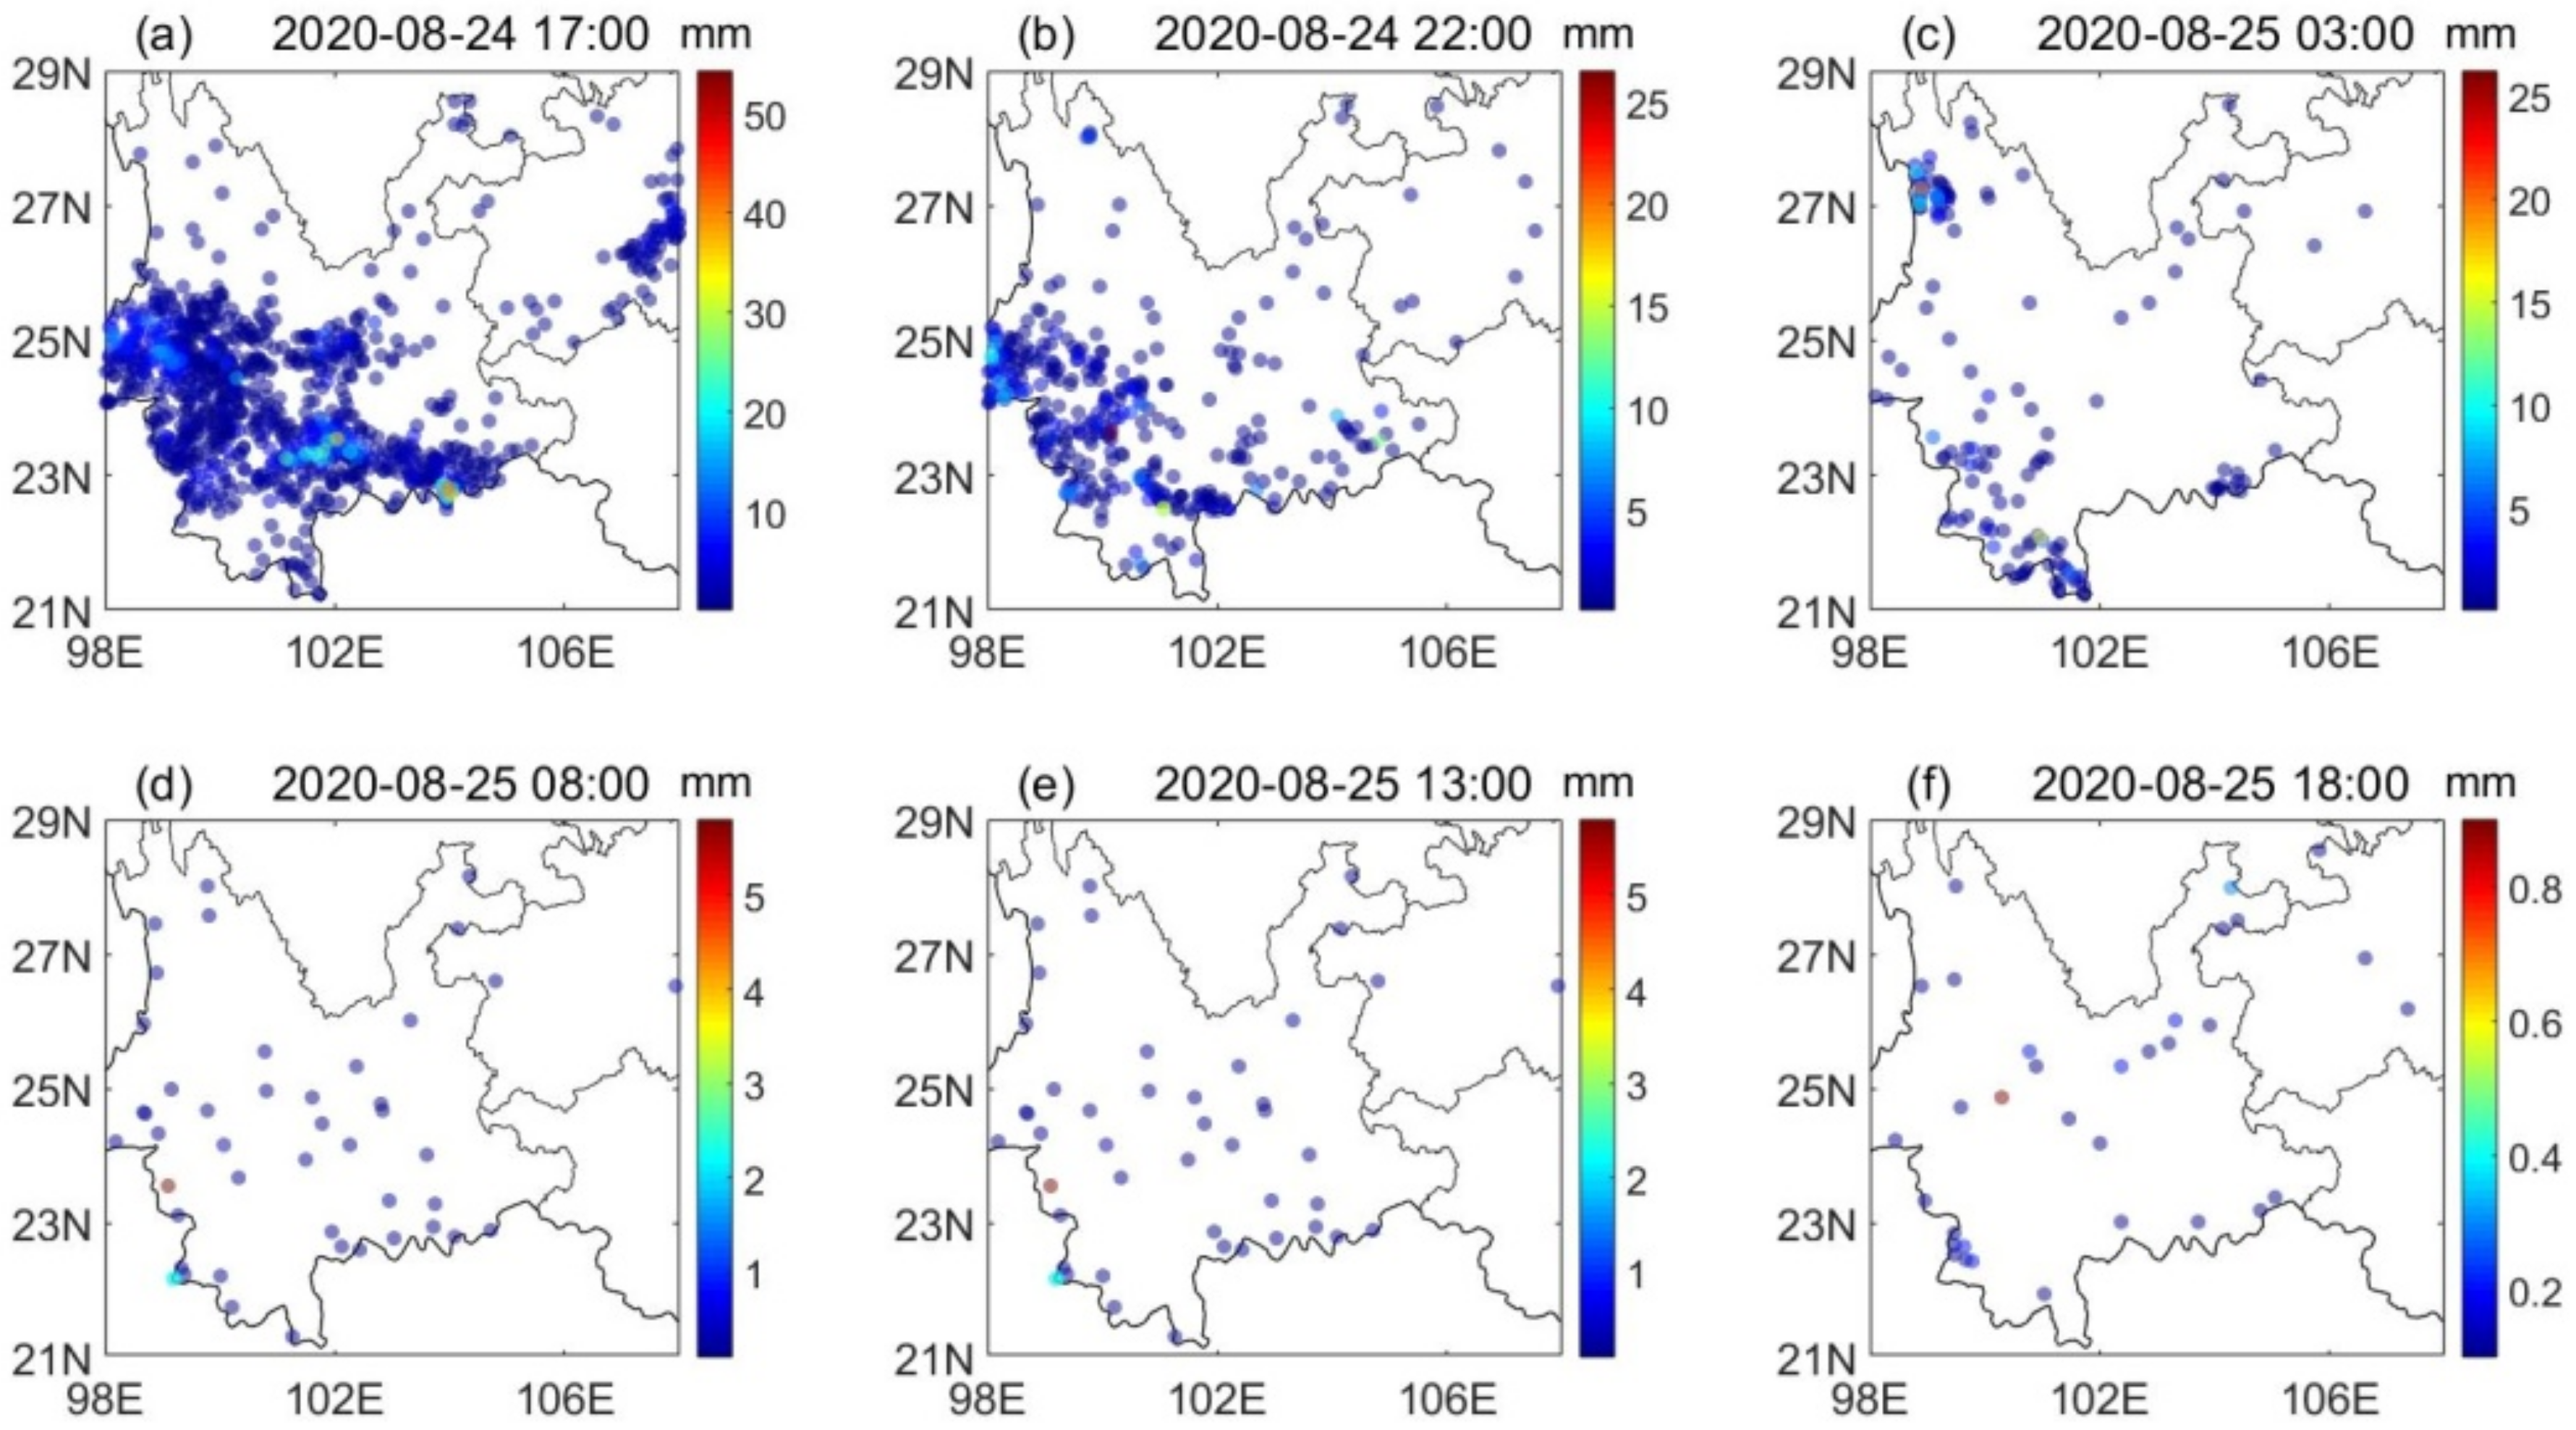
3.2. Analysis of Deep Convection Process

The analysis of PWV features and the correlation between precipitation and PWV suggests that PWV data have good stability and time continuity. We select the convective weather process transits in the Yunnan–Guizhou Plateau from 24 August 2020 to 25 August 2020 as a case study, using multi-source data such as PWV, p , and 1 h precipitation to analyze the variation in water vapor during the process of convergence and divergence in the plateau exploringly. Figure 6 shows that the radar reflectivity factor value in the Yunnan–Guizhou Plateau is high at 12:00 UTC on 24 August 2020, which implies that there are raindrop particles in this area, mainly concentrated in the western and eastern border areas of Yunnan Province. The combined map of p and wind field in the ECMWF reanalysis data at that time is displayed in Figure 7d. The distribution of convergence and divergence processes in the Yunnan–Guizhou Plateau is more complicated, but a large convergence area is formed in the eastern border area of Yunnan Province. At the same time, the direction of the wind field also verifies the formation of a local low-pressure area.
The time was advanced to 06:00 (UTC) on 24 August 2020, and further investigation was conducted every two hours thereafter, which shows that the low pressure in the eastern part of Yunnan Province formed from the northeast direction and gradually moved toward the eastern part of Yunnan Province at 12:00. Convergence has always existed in the western part of Guizhou Province, while the southwestern part of Yunnan Province has converged with increasing intensity over time. The areas at the junction of the three provinces of Yunnan, Guizhou, and Sichuan, and the central part of Yunnan Province have been in a state of divergence, and the intensity has not changed significantly.
Analysis of the PWV from the same period as showing in Figure 8 reveals that the PWV at the junction of western Guizhou and eastern Yunnan was maintained at a high level, with some stations exceeding 50 mm, while in southwestern Yunnan Province, the PWV increased, reaching more than 50 mm at 12:00. According to the distribution of p in Figure 7, these areas are in a state of convergence; consequently, the water vapor transport characteristics of the two datasets are relatively consistent. In addition, a low PWV value of 35 mm or less appeared in the areas at the junction of Yunnan, Guizhou, and Sichuan provinces and the central part of Yunnan Province, indicating that these areas are in a divergent state, which is consistent with the analysis of p in Figure 7.
The precipitation of the stations in the same time period showing in Figure 9 reveals that precipitation at the largest number of stations occurred at 08:00 on August 24, which is associated with the large-scale divergence process that appeared in the region at the corresponding time in Figure 7. Moreover, the eastern part of Yunnan Province and the western part of Guizhou Province had less precipitation, as there was an obvious convergence process in these areas. In addition, precipitation in the northwest corner of Guizhou Province increased significantly at 06:00 and 12:00 on August 24. p suggested that these two times have been in a convergence process, which is also reflected in Figure 8. The PWV in this area has been maintained at a high level above 50 mm, indicating that the PWV has good real-time observation capability and continuity, and there is a positive correlation between precipitation and p .
From 17:00 on 24 August to 18:00 on 25 August 2020, five-hour interval p analysis showed that the convective weather system moved southward along the eastern part of Yunnan Province and the western part of Guizhou Province. Figure 10 illustrates that the more obvious divergence process followed the system sweeping through the Yunnan–Guizhou region, while the intensity of the divergence process was approximately 1 kgm 2 s 1 . Furthermore, in the southwestern direction of the divergence process, some convergent systems appeared, and the intensity ranged from −1 to −1.51 kgm 2 s 1 . The wind field at 850 hPa shows that these low-pressure areas followed convective systems to move south.
The PWV distribution at the same time interval is displayed in Figure 11, which demonstrates that the PWV in the Yunnan–Guizhou Plateau has a strong downward trend from northwest to southeast. Meanwhile, the PWV distribution has always maintained the characteristics of higher in the southern border area and lower in the northern central area. At 17:00 and 22:00, the PWV in the southwestern part of Yunnan Province is high, which is related to the convergence process in this area, as shown in Figure 10. After 08:00 on the 25th, the convergence process in this region gradually turned into a divergent process, and the PWV decreased significantly to >15 mm; therefore, we conclude that this divergence process dissipates most of the PWV in the area through precipitation or drives southward.
The precipitation at stations from 17:00 on 24 August to 18:00 on 25 August 2020 showing in Figure 12 indicates that the number of stations with precipitation during this period gradually decreased. Moreover, there were more stations with precipitation in southwestern Yunnan and western Guizhou compared with other times at 17:00 on the 24th. Figure 10 suggests that these two regions were in a convergence process, while the distribution of PWV reveals that these two regions are wetter than other regions. At 22:00, the convergence process in the area became less accompanied by a decline in PWV, the number of precipitation stations was reduced simultaneously, and the entire Yunnan–Guizhou Plateau was immersed in the process of divergence. At the same time, the PWV dropped to 30 mm and was consistent with the reduction in precipitation. Hereafter, p in the entire region was positive at 18:00 on the 25th and the PWV in the area continued to decline as expected, followed by a minimum number of precipitation stations.
The four stations with good continuity of precipitation and PWV from 22 August to 28 August 2020 are shown in Figure 13. The blue curve represents the variation in the PWV, which reported that the PWV of the four stations increased from the 23rd to the 24th, especially BFDI, where the change exceeded 10 mm; subsequently, the PWV of the four stations all fell drastically, with the lowest value appearing on August 26. In addition, the PWV of BFDI, BFLJ, and MNZI dropped below 20 mm; specifically, the decreases at BFDI and MNLA exceeded 20 mm. Moreover, the precipitation at all four stations appeared on August 24. The maximum precipitation value appeared near the highest PWV after time consistency matching, indicating that the locations of these stations are near the end of the convergence process. Thus, the PWV in this area gathered to a certain level and started a large amount of precipitation. The obvious decline in the PWV emerged along with the continuity of precipitation, where the precipitation had a significant decline.
Refining the time scale from day to hour, we found that concentrated precipitation occurred from 07:00 to 13:00 on 24 August 2020. When the cloud top temperature over the station dropped by more than 50 k, reaching as low as approximately 240 k within 2 h, the increase in PWV at the same site indicated that a deep convective system appeared in the area [49]. Figure 14 shows the changes in ctt and PWV at the four stations. As the resolution of PWV was 1 h, the amount of data were relatively small and could only be used to study the general trend of change; the ctt at BFDI and BFLJ had the lowest values at approximately 09:00, which declined by more than 50 k before that. Moreover, the lowest value at BFDI was approximately 240 k; likewise, the lowest value at BFLJ was less than 230 k. At the same time, the PWV of the two stations displayed an upward trend in the low-ctt area. These indicators reveal that the deep convection process started at approximately 09:00 in these two areas. The lowest ctt values at MNLA and MNZI were later than those at the other stations, appearing between 11:00 and 12:00, and the PWV rose simultaneously, indicating that deep convection arose later at the two stations. After preliminary analysis, we found that the MNLA and MNZI stations are located in the southernmost part of Yunnan Province, and the convective system runs from north to south, which is in line with the time sequence of system development.
The analysis of the multi-source data of the deep convective process during the transit in the Yunnan–Guizhou Plateau from 24–25 August 2020 revealed that PWV data have strong real-time observation capability and continuity for small-scale and mesoscale weather processes. In addition, combining p can clearly demonstrate variation and the transportation of water vapor in the process, which is beneficial for the numerical weather forecast to accurately determine the occurrence of precipitation. The PWV showed a very good correlation with the 1 h precipitation data if the spatial scale was reduced to a single station. Furthermore, the precipitation fell in the high value area of PWV or in the decline stage after it. However, in order to determine the threshold of PWV when precipitation appears, more factors such as seasons, dynamic and heat conditions [8], and long time series data should be considered in future studies.
The combination of ctt and PWV can better report the occurrence time of deep convection if the time scale is reduced to hours. Because the time resolution of the PWV data used in this study is 1 h, it can only be used to analyze the approximate change trend of PWV. Thus, if the calculation interval is adjusted to a minute, combined with ctt, it will more clearly reflect the initiation and transit time of deep convection.

4. Conclusions

The PWV data were consistent with ERA5 data of the Yunnan–Guizhou Plateau in June, July, August, and September from 2015 to 2020, while the deviation of the two datasets increased with the altitude of the station. In the summer of 2020, the deviation between the PWV and the TCWV in this area significantly decreased compared to previous years, which is related to the improvement of the calculation algorithm during this period. In addition, the precipitation after time–space matching mainly appeared in the PWV between 30 and 65 mm and displayed normal distribution characteristics, whereas the precipitation did not differ significantly with station altitude or spatial location.
During the development of the deep convective system in the Yunnan–Guizhou Plateau from north to south between 24–25 August 2020, the PWV exhibited strong real-time observation capability and continuity. In addition, the PWV displayed a certain indicating effect in the process of mesoscale convective weather when combined with the analysis of multi-source data, such as p and Doppler radar reflectivity factor products, which is a meaningful reference for precipitation prediction in numerical weather forecasting. Precipitation and PWV showed a strong correlation if the spatial scale was reduced to a single station. Moreover, precipitation emerged in the high value area of the PWV or the decline stage after the high value. In addition, using minute-level ctt data, the variation in PWV could accurately match the time and location of the deep convective process, which also reveals that PWV had a positive effect on the study of tropospheric weather processes at different temporal and spatial scales. Therefore, minute-level PWV data will provide a more accurate analysis and indication of rapidly developing convective weather process [49], which will be studied in future work.

Author Contributions

Conceptualization, H.H., Y.C. and C.S.; methodology, H.H. and Y.L.; software, H.H.; investigation, H.H. and H.L.; data curation, H.H., H.W. (Hao Wen) and X.W.; writing—original draft preparation, H.H.; writing—review and editing, H.H. and M.T.; visualization, H.H.; project administration, H.W. (Haishen Wang), J.L. and P.Z.; funding acquisition, Y.C. and C.S. All authors have read and agreed to the published version of the manuscript.

Funding

This research was funded by The National Natural Science Foundation of China (Inter-organizational cooperative research NSFC-TRF project) (Grant No. 41961144015), and the Observation Experiment Project of Meteorological Observation Center of China Meteorological Administration (Grant No. RWS-SY2021030).

Institutional Review Board Statement

Not applicable.

Informed Consent Statement

Not applicable.

Data Availability Statement

The total atmospheric water vapor product: https://cds.climate.copernicus.eu/cdsapp#!/dataset/reanalysis-era5-single-levels?tab=form (accessed on 15 April 2021). The vertical integral of the divergence of the moisture flux product and the U/V wind field component of the 850 hPa pressure layer: https://cds.climate.copernicus.eu/cdsapp#!/dataset/reanalysis-era5-pressure-levels?tab=form (accessed on 20 April 2021). The cloud top temperature: http://satellite.nsmc.org.cn/PortalSite/Data/Satellite.aspx (accessed on 20 May 2021).

Acknowledgments

The authors would like to acknowledge the National Satellite Meteorological Center for providing cloud top temperature data and ECMWF for providing meteorological reanalysis data, and to thank the editors and the anonymous reviewers for their invaluable time and great efforts toward our manuscript.

Conflicts of Interest

The authors declare no conflict of interest.

References

  1. Kiehl, J.T.; Trenberth, K.E. Earth’s Annual Global Mean Energy Budget. Bull Am. Meteorol. Soc. 1997, 109, 197–208. [Google Scholar] [CrossRef] [Green Version]
  2. Held, I.M.; Soden, B.J. Water vapor feedback and global warming. Annu. Rev. Energy Environ. 2000, 25, 441–475. [Google Scholar] [CrossRef] [Green Version]
  3. Anand, K.; Inamdar, V.; Ramanathan, N.; Loeb, G. Satellite observations of the water vapor greenhouse effect and column longwave cooling rates: Relative roles of the continuum and vibration-rotation to pure rotation bands. J. Geophys. Res. Atmos. 2004, 109, 1–9. [Google Scholar]
  4. Trenberth, K.E.; Dai, A. Effects of Mount Pinatubo volcanic eruption on the hydrological cycle as an analog of geoengineering. Geophys. Res. Lett. 2007, 34, 1–5. [Google Scholar] [CrossRef] [Green Version]
  5. Trenberth, K.E.; Fasullo, J.T.; Kiehl, J. Earth’s Global Energy Budget. Bull. Am. Meteorol. Soc. 2009, 90, 311–323. [Google Scholar] [CrossRef]
  6. Gui, K.; Che, H.; Chen, Q.; Zeng, Z.; Liu, H.; Wang, Y.; Zheng, Y.; Sun, T.; Liao, T.; Wang, H.; et al. Evaluation of radiosonde, MODIS-NIR-clear, and AERONET precipitable water vapor using IGS ground-based GPS measurements over China. Atmos. Res. 2017, 197, 461–473. [Google Scholar] [CrossRef]
  7. Allen, M.R.; Ingram, W.J. Constraints on future changes in climate and the hydrologic cycle. Nature 2002, 419, 228–232. [Google Scholar] [CrossRef]
  8. Rong, W. Prccipitable Water Vapor Retrieval Technology Research andAppliactions of Ground Based GPS Observation. Ph.D. Thesis, Nanjing University of Information Science and Technology, Nanjing, China, 2012; pp. 1–137. [Google Scholar]
  9. Zhou, R.R.; Wang, G.L.; Zhaxi, S.L. Cloud vertical structure measurements from a ground-based cloud radar over the southeastern Tibetan Plateau. Atmos. Res. 2021, 258, 105629. [Google Scholar] [CrossRef]
  10. Zhan, W.; Heki, K.; Arief, S.; Yoshida, M. Topographic Amplification of Crustal Subsidence by the Rainwater Load of the 2019 Typhoon Hagibis in Japan. J. Geophys. Res.-Solid Earth 2021, 126, e2021JB021845. [Google Scholar] [CrossRef]
  11. Zhao, T.B.; Dai, A.G.; Wang, J.H. Trends in Tropospheric Humidity from 1970 to 2008 over China from a Homogenized Radiosonde Dataset. J. Clim. 2012, 25, 4549–4567. [Google Scholar] [CrossRef] [Green Version]
  12. Wang, J.H.; Zhang, L.Y.; Dai, A.G.; Immler, F.; Sommer, M.; Vomel, H. Radiation Dry Bias Correction of Vaisala RS92 Humidity Data and Its Impacts on Historical Radiosonde Data. J. Atmos. Ocean. Technol. 2013, 30, 197–214. [Google Scholar] [CrossRef]
  13. Jin, S.K.; Ma, Y.Y.; Gong, W.; Liu, B.M.; Lei, L.F.; Fan, R.N. Characteristics of vertical atmosphere based on five-year microwave remote sensing data over Wuhan region. Atmos. Res. 2021, 260, 105710. [Google Scholar] [CrossRef]
  14. Urban, J.; Baron, P.; Lautie, N.; Schneider, N.; Dassas, K.; Ricaud, P.; De La Noe, J. Moliere (v5): A versatile forward- and inversion model for the millimeter and sub-millimeter wavelength range. J. Quant. Spectrosc. Radiat. Transf. 2004, 83, 529–554. [Google Scholar] [CrossRef]
  15. Vespe, F.; Persia, T. Derivation of the water vapor content from the GNSS radio occultations observations. J. Atmos. Ocean. Technol. 2006, 23, 936–943. [Google Scholar] [CrossRef]
  16. Srivastava, A.; Kumar, A. Retrieval of total columnar precipitable water vapour using radio occultation technique over the Indian region. J. Atmos. Sol.-Terr. Phys. 2021, 219, 105652. [Google Scholar] [CrossRef]
  17. Bevis, M.; Businger, S.; Herring, T.A.; Rocken, C.; Anthes, R.A.; Ware, R.H. GPS Meteorology: Remote sensing of atmospheric water vapor using the Global Position System. J. Geophys. Res. 1992, 97, 15787–15801. [Google Scholar] [CrossRef]
  18. Braun, J.; Rocken, C.; Ware, R. Validation of line-of-sight water vapor measurements with GPS. Radio Sci. 2001, 36, 459–472. [Google Scholar] [CrossRef] [Green Version]
  19. Zhang, W.X. Water Vapor Retrieval, Variation Analysis and Applications over China using Ground-based GNSS and Multiple Data. Ph.D. Thesis, Wuhan University, Wuhan, China, 2016; pp. 1–128. [Google Scholar]
  20. Garand, L.; Grassotti, C.; Halle, J.; Klein, G.L. On differences in radiosonde humidity-reporting practices and their implications for numerical weather prediction and remote sensing. Bull. Am. Meteorol. Soc. 1992, 73, 1417–1423. [Google Scholar] [CrossRef] [Green Version]
  21. António, P.; Ferreira, R.N.; Gimeno, L. Completeness of radiosonde humidity observations based on the Integrated Global Radiosonde Archive. Earth Syst. Sci. Data 2019, 11, 603–627. [Google Scholar]
  22. Song, S.L. Sensing Three Dimensional Water Vapor Structure with Ground-Based GPS Network and the Application in Meteorology. Ph.D. Thesis, Shanghai Astronomical Observatory, Chinese Academy of Sciences, Shanghai, China, 2004; pp. 1–122. [Google Scholar]
  23. Haefele, A.; De Wachter, E.; Hocke, K.; Kampfer, N.; Nedoluha, G.E.; Gomez, R.M.; Eriksson, P.; Forkman, P.; Lambert, A.; Schwartz, M.J. Validation of ground-based microwave radiometers at 22 GHz for stratospheric and mesospheric water vapor. J. Geophys. Res. Space Phys. 2009, 114, 23305. [Google Scholar] [CrossRef] [Green Version]
  24. Divakala, M.G.; Barnet, C.D.; Goldberg, M.D.; McMillin, L.M.; Wolf, W.; Zhou, L.; Liu, X. Validation of Atmospheric Infrared Sounder temperature and water vapor retrievals with matched radiosonde measurements and forecasts. J. Geophys. Res. 2006, 111, D09S15. [Google Scholar]
  25. Deeter, M.N. A new satellite retrieval method for precipitable water vapor land and ocean. Geophys. Res. Lett. 2007, 34, L02815. [Google Scholar] [CrossRef]
  26. Bauer, P.; Radnoti, G.; Healy, S.; Cardinali, C. GNSS Radio Occultation Constellation Observing System Experiments. Mon. Weather. Rev. 2014, 142, 555–572. [Google Scholar] [CrossRef]
  27. Hajj, G.A.; Ao, C.O.; Iijima, B.A.; Kuang, D.; Kursinski, E.R.; Mannucci, A.J.; Meehan, T.K.; Romans, L.J.; Juarez, M.D.; Yunck, T.P. CHAMP and SAC-C atmospheric occultation results and intercomparisons. J. Geophys. Res.-Atmos. 2004, 109, D06109. [Google Scholar] [CrossRef]
  28. Larsen, G.B.; Lauritsen, K.B.; Rubek, F. Processing of CHAMP Radio Occultation Data Using GRAS SAF Software. Earth Observation with Champ: Results from Three Years Orbit; Springer: Berlin/Heidelberg, Germany, 2005; pp. 543–548. [Google Scholar]
  29. Bevis, M.; Businger, S.; Chiswell, S.; Herring, T.; Anthes, R.; Rocken, C.; Ware, R. GPS Meteorology: Mapping Zenith Wet Delays onto Precipitable Water. J. Appl. Meteorol. 1994, 33, 379–386. [Google Scholar] [CrossRef]
  30. Wang, J.H.; Dai, A.G.; Mear, C. Global Water Vapor Trend from 1988 to 2011 and Its Diurnal Asymmetry Based on GPS, Radiosonde, and Microwave Satellite Measurements. J. Clim. 2016, 29, 5205–5222. [Google Scholar] [CrossRef]
  31. Elgered, G.; Johansson, J.; Rönnäng, B.O.; Davis, J.L. Measuring regional atmospheric water vapor using the Swedish Permanent GPS Network. Geophys. Res. Lett. 1997, 24, 2663–2666. [Google Scholar] [CrossRef] [Green Version]
  32. Haase, J.; Ge, M.R.; Vedel, H.; Calais, E. Accuracy and variability of GPS tropospheric delay measurements of water vapor in the western Mediterranean. J. Appl. Meteorol. 2003, 42, 1547–1568. [Google Scholar] [CrossRef]
  33. Zhao, T.; Wang, J.; Dai, A. Evaluation of atmospheric precipitable water from reanalysis products using homogenized radiosonde observation over China. J. Geophys. Res. Atmos. 2015, 120, 10703–10727. [Google Scholar] [CrossRef]
  34. Wang, J.H.; Zhang, L. Systematic errors in global radiosonde precipitable water data from comparisons with groundbased GPS measurements. J. Clim. 2008, 21, 2218–2238. [Google Scholar] [CrossRef]
  35. Kuo, Y.H.; Zou, X.; Guo, Y.R. Variational Assimilation of Precipitable Water Using a Nonhydrostatic Mesoscale Adjoint Model. Part I: Moisture Retrieval and Sensitivity Experiments. Mon. Weather Rev. 1996, 124, 122–147. [Google Scholar] [CrossRef] [Green Version]
  36. Gutman, S.I.; Holub, K.L.; Sahm, S.R.; Stewart, J.Q.; Smith, T.L.; Benjamin, S.G.; Schwartz, B.E. Rapid retrieval and assimilation of ground based GPS-Met Observations at NOAA Forecast System Laboratory: Impact on Weather Forecasts. J. Meteorol. Soc. Jpn. 2004, 8, 51–360. [Google Scholar]
  37. Xie, Y.; Wei, F.; Chen, G.; Zhang, T.; Hu, L. Analysis of the 2008 heavy snowfall over South China using GPS PWV measurements from the Tibetan Plateau. Ann. Geophys. 2010, 28, 1369–1376. [Google Scholar] [CrossRef]
  38. Radhakrishna, B.; Fabry, F.; Braun, J.J.; Van Hove, T. Precipitable water from GPS over the continental United States: Diurnal cycle, intercomparisons with NARR, and link with convective initiation. J. Clim. 2015, 28, 2584–2599. [Google Scholar] [CrossRef]
  39. Xiangde, X.; Shiyan, T.; Jizhi, W.; Lianshou, C.; Li, Z.; Xiurong, W. The relationship between Water Vapor Transport Features of Tibetan Plateau-Monsoon “Large Triangle” Affecting Region and Drought-flood Abnormality of China. Acta Meteorol. Sin. 2002, 60, 257–266. [Google Scholar]
  40. Xu, X.; Dong, L.; Zhao, Y.; Wang, Y. Effect of the Asian Water Tower over the Qinghai-Tibet Plateau and the characteristics of atmospheric water circulation. Sci. China Press 2019, 64, 2830–2841. [Google Scholar]
  41. Xinzhu, Z. Analysis on the Feature of Moisture Flux over Southwest China. Ph.D. Thesis, Hunan Normal University, Hunan, China, 2011; pp. 1–145. [Google Scholar]
  42. Xiangde, X.; Lianshou, C.; Xiurong, W.; Qiuju, M.; Shiyan, T. The structure of the source and sink of water vapor transportation in the Meiyu belt of the Yangtze River Basin. Sci. China Press 2003, 48, 2288–2294. [Google Scholar]
  43. Xingwen, J.; Yueqing, L.; Xin, W. Water vapor transport over China and its relationship with drought and flood in Yangtze River Basin. J. Geogr. Sci. 2009, 19, 153–163. [Google Scholar]
  44. Xiaoying, S.; Xiangde, X.; Hao, W.; Dayong, Q. Characteristics of moisture transport in middle and lower reaches of Yangtze River and its variation trend. J. Hydraul. Eng. 2008, 39, 596–603. [Google Scholar]
  45. Weijia, W.; Xinjia, Z. Retrieve the precipitable water vapor of the atmospheric in Southwestern China from the COSMIC data. In Proceedings of the 29th Annual Meeting of the Chinese Meteorological Society, Shenyang, China, 12 September 2012. [Google Scholar]
  46. Wang, J.; Han, S.; Bian, H.; Liu, X.; Sun, D.; Zhao, C. Characteristics of Three-Dimensional GPS tomography water vapor field during the rainstorm. Acta Sci. Nat. Univ. Pekin. 2014, 50, 1053–1064. [Google Scholar]
  47. Adams, D.K.; Fernandes, R.M.; Maia, J.M. GNSS Precipitable Water Vapor from an Amazonian Rain Forest Flux Tower. J. Atmos. Ocean. Technol. 2011, 28, 1192–1198. [Google Scholar] [CrossRef]
  48. Adams, D.K.; Fernandes, R.M.; Kursinski, E.R.; Maia, J.M.; Sapucci, L.F.; Machado, L.A.; Vitorello, I.; Monico, J.F.G.; Holub, K.L.; Gutman, S.I.; et al. A dense GNSS meteorological network for observing deep convection in the Amazon. Atmos. Sci. Lett. 2015, 12, 207–212. [Google Scholar] [CrossRef] [Green Version]
  49. Adams, D.K.; Fernandes, R.M.; Holub, K.L.; Gutman, S.I.; Barbosa, H.M.; Machado, L.A.; Calheiros, A.J.; Bennett, R.A.; Kursinski, E.R.; Sapucci, L.F.; et al. The Amazon Dense GNSS Meteorological Network: A New Approach for Examining Water Vapor and Deep Convection Interactions in the Tropics. Bull. Am. Meteorol. Soc. 2017, 96, 12. [Google Scholar] [CrossRef]
  50. The Copernicus Climate Change Service. Available online: https://cds.climate.copernicus.eu/cdsapp#!/dataset/reanalysis-era5-single-levels?tab=form (accessed on 15 April 2021).
  51. The Copernicus Climate Change Service. Available online: https://cds.climate.copernicus.eu/cdsapp#!/dataset/reanalysis-era5-pressure-levels?tab=form (accessed on 20 April 2021).
  52. Fengyun Satellite Remote Sensing Data Service Network. Available online: http://satellite.nsmc.org.cn/PortalSite/Data/Satellite.aspx (accessed on 20 May 2021).
  53. Niell, A.E. Global mapping functions for the atmosphere delay at radio wavelength. J. Geophys. Res. 1996, 101, 3227–3246. [Google Scholar] [CrossRef]
  54. Thayer, D. An improved equation for the radio refractive index of air. Radio Sci. 1974, 9, 803–807. [Google Scholar] [CrossRef]
  55. Saastamoinen, J. Contributions to theory of atmospheric refraction. J. Geod. 1972, 105, 279–298. [Google Scholar] [CrossRef]
  56. Liou, Y.A.; Teng, Y.T.; Van Hove, T.; Liljegren, J.C. Comparison of Precipitable Water Observations in the Near Tropics by GPS, Microwave Radiometer, and Radiosondes. J. Appl. Meteorol. Climatol. 2001, 40, 5–15. [Google Scholar] [CrossRef]
  57. Liu, J.; Sun, Z.; Liang, H.; Xu, X.; Wu, P. Precipitable water vapor on the Tibetan Plateau estimated by GPS, water vapor radiometer, radiosonde, and numerical weather prediction analysis and its impact on the radiation budget. J. Geophys. Res. 2005, 110, D17106. [Google Scholar] [CrossRef]
  58. Esteban Vázquez, G.; Dorota, B.; Grejner-Brzezinska, A. GPS-PWV estimation and validation with radiosonde data and numerical weather prediction model in Antarctic. GPS Solut. 2013, 17, 29–39. [Google Scholar] [CrossRef]
  59. Bock, O.; Bosser, P.; Flamant, C.; Doerflinger, E.; Jansen, F.; Fages, R.; Bony, S.; Schnitt, S. Integrated water vapour observations in the Caribbean arc from a network of ground-based GNSS receivers during EUREC(4)A. Earth Syst. Sci. Data 2021, 13, 2407–2436. [Google Scholar] [CrossRef]
Figure 1. Distribution of GNSS/MET stations in Yunnan–Guizhou Plateau (black dots: GNSS/MET stations; blue star: GNSS/MET stations matching the ERA5, the precipitation, and the CTT).
Atmosphere 12 01085 g001
Figure 2. PWV, TCWV, and altitude of 6 stations (box plot: PWV and TCWV; histogram: station altitude; green line: mean value; error bars: standard deviation).
Atmosphere 12 01085 g002
Figure 3. Scattered distributions and linear fitting results of TCWV and PWV of 6 stations (color scatter: scatter distribution of two kinds of data at each station; colored straight line: linear fitting of PWV (cyan: MNLA; yellow: MNZI; blue: TNCH; black: BEKM; green: BFDI; red: BFLJ).
Atmosphere 12 01085 g003
Figure 4. Monthly mean deviation of TCWV and PWV for 6 stations (cyan: MNLA; yellow: MNZI; blue: TNCH; black: BEKM; green: BFDI; red: BFLJ).
Atmosphere 12 01085 g004
Figure 5. Scattered distribution of the PWV and 1 h precipitation of 6 stations (cyan: MNLA; yellow: MNZI; blue: TNCH; black: BEKM; green: BFDI; red: BFLJ).
Atmosphere 12 01085 g005
Figure 6. Doppler radar network diagram in China at 12:00 on 24 August 2020 (UTC) (color scale represents reflectance factor, unit: dBz; black box: Yunnan–Guizhou Plateau).
Atmosphere 12 01085 g006
Figure 7. The combination of p and 850 hPa wind field in Yunnan–Guizhou Plateau from 06:00 (UTC) to 12:00 on 24 August 2020 (the isosurface represents the p , unit: kg m−2 s−1. The direction of the arrow represents the wind direction, and the length represents the wind speed. (ad) represent the results of 2 h interval).
Atmosphere 12 01085 g007
Figure 8. The distribution of PWV from 06:00 (UTC) to 12:00 on 24 August 2020 in Yunnan–Guizhou Plateau (the color scale of the contour represents the PWV, unit: mm. (ad) represent the results of 2 h interval).
Atmosphere 12 01085 g008
Figure 9. Precipitation at stations in Yunnan–Guizhou Plateau from 06:00 (UTC) to 12:00 on 24 August 2020 (scattered points represent stations with precipitation greater than, and color scales represent the amount of precipitation. (ad) represent the results of 2 h interval).
Atmosphere 12 01085 g009
Figure 10. The combination of ∇p and 850 hPa wind field in Yunnan–Guizhou Plateau from 17:00 on 24 August 2020 (UTC) to 18:00 on 25 August 2020 (isosurface represents ∇p, unit: kg m−2 s−1; the direction of the arrow represents the wind direction, and the length represents the wind speed. (af) represent the results of 5 h interval).
Atmosphere 12 01085 g010
Figure 11. Distribution of PWV in Yunnan–Guizhou Plateau from 17:00 on 24 August (UTC) to 18:00 on 25 August 2020 (the contour color scale represents the PWV, unit: mm. (af) represent the results of 5 h interval).
Atmosphere 12 01085 g011
Figure 12. Precipitation at stations in Yunnan–Guizhou Plateau from 17:00 on 24 August (UTC) to 18:00 on 25 August 2020 (scattered points represent stations with precipitation greater than, and color scales represent the amount of precipitation. (af) represent the results of 5 h interval).
Atmosphere 12 01085 g012
Figure 13. The precipitation and the PWV at stations from 22 August to 28 August 2020 (blue curve: the PWV, unit: mm; green column: the precipitation, unit mm. (a) BFDI, (b) BFLJ, (c) MNLA, (d) MNZI).
Atmosphere 12 01085 g013
Figure 14. The ctt and the PWV of stations from 07:00 to 13:00 on 24 August 2020 (blue curve: the ctt, unit: k; red scattered points: the PWV, unit mm. (a) BFDI, (b) BFLJ, (c) MNLA, (d) MNZI).
Atmosphere 12 01085 g014
Table 1. Site coordinate information of GNSS/MET stations.
StationLatitudeLongitudeAltitude(m)
MNLA101.5821.47631.39
MNZI103.3323.441320.47
TNCH98.5025.021665.99
BEKM102.6525.011896.61
BFDI100.1825.711986.25
BFLJ100.2226.852395.95
Table 2. Comparative analysis of PWV and TCWV.
StationData VolumeCorrelation CoefficientStandard Deviation (mm)Mean Deviation (mm)
MNLA11,8950.8787.3386.647
MNZI13,3930.8246.4066.748
TNCH14,0020.8284.7302.360
BEKM10,9640.8175.4703.170
BFDI14,0290.8054.7902.213
BFLJ13,4960.8044.6862.775
Publisher’s Note: MDPI stays neutral with regard to jurisdictional claims in published maps and institutional affiliations.

