
Microbiological Contamination Assessment in Higher Education Institutes

 ,
,  , , , and
Abstract
:1. Introduction
2. Materials and Methods
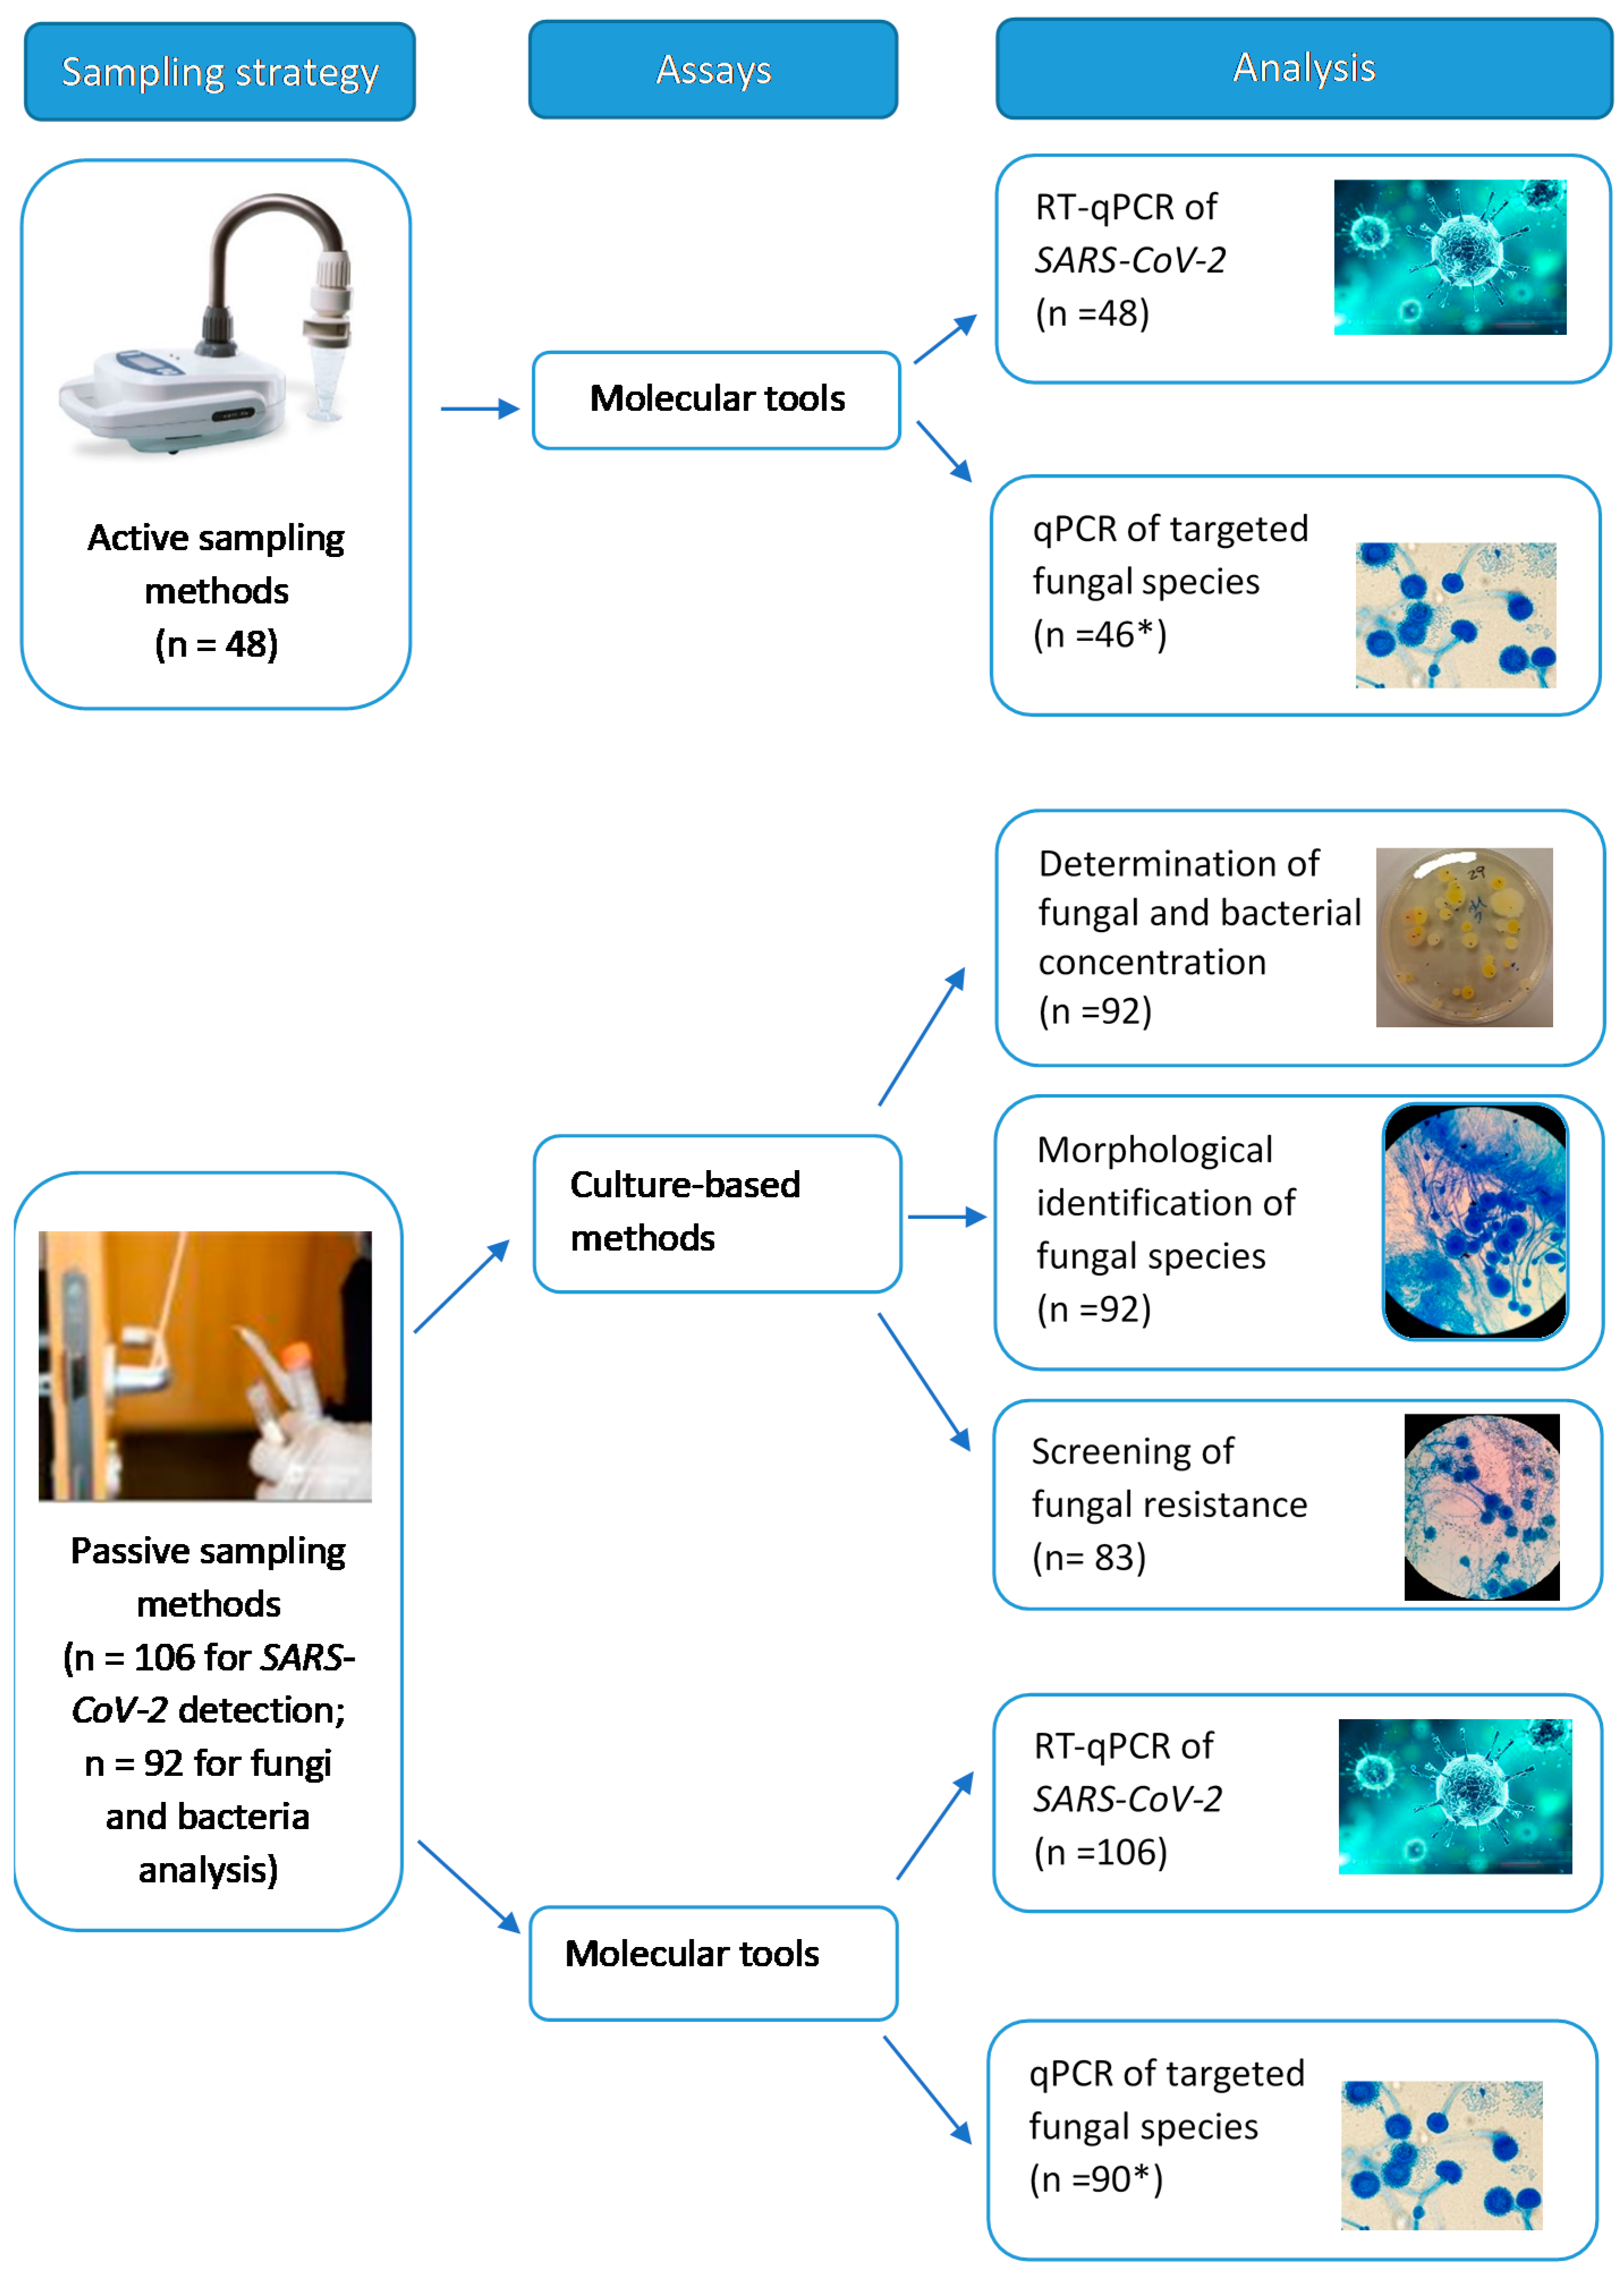
2.1. Facilities Assessed and Sampling Sites
2.2. Samples Collected and Assays Performed
2.3. Statistical Analysis
3. Results
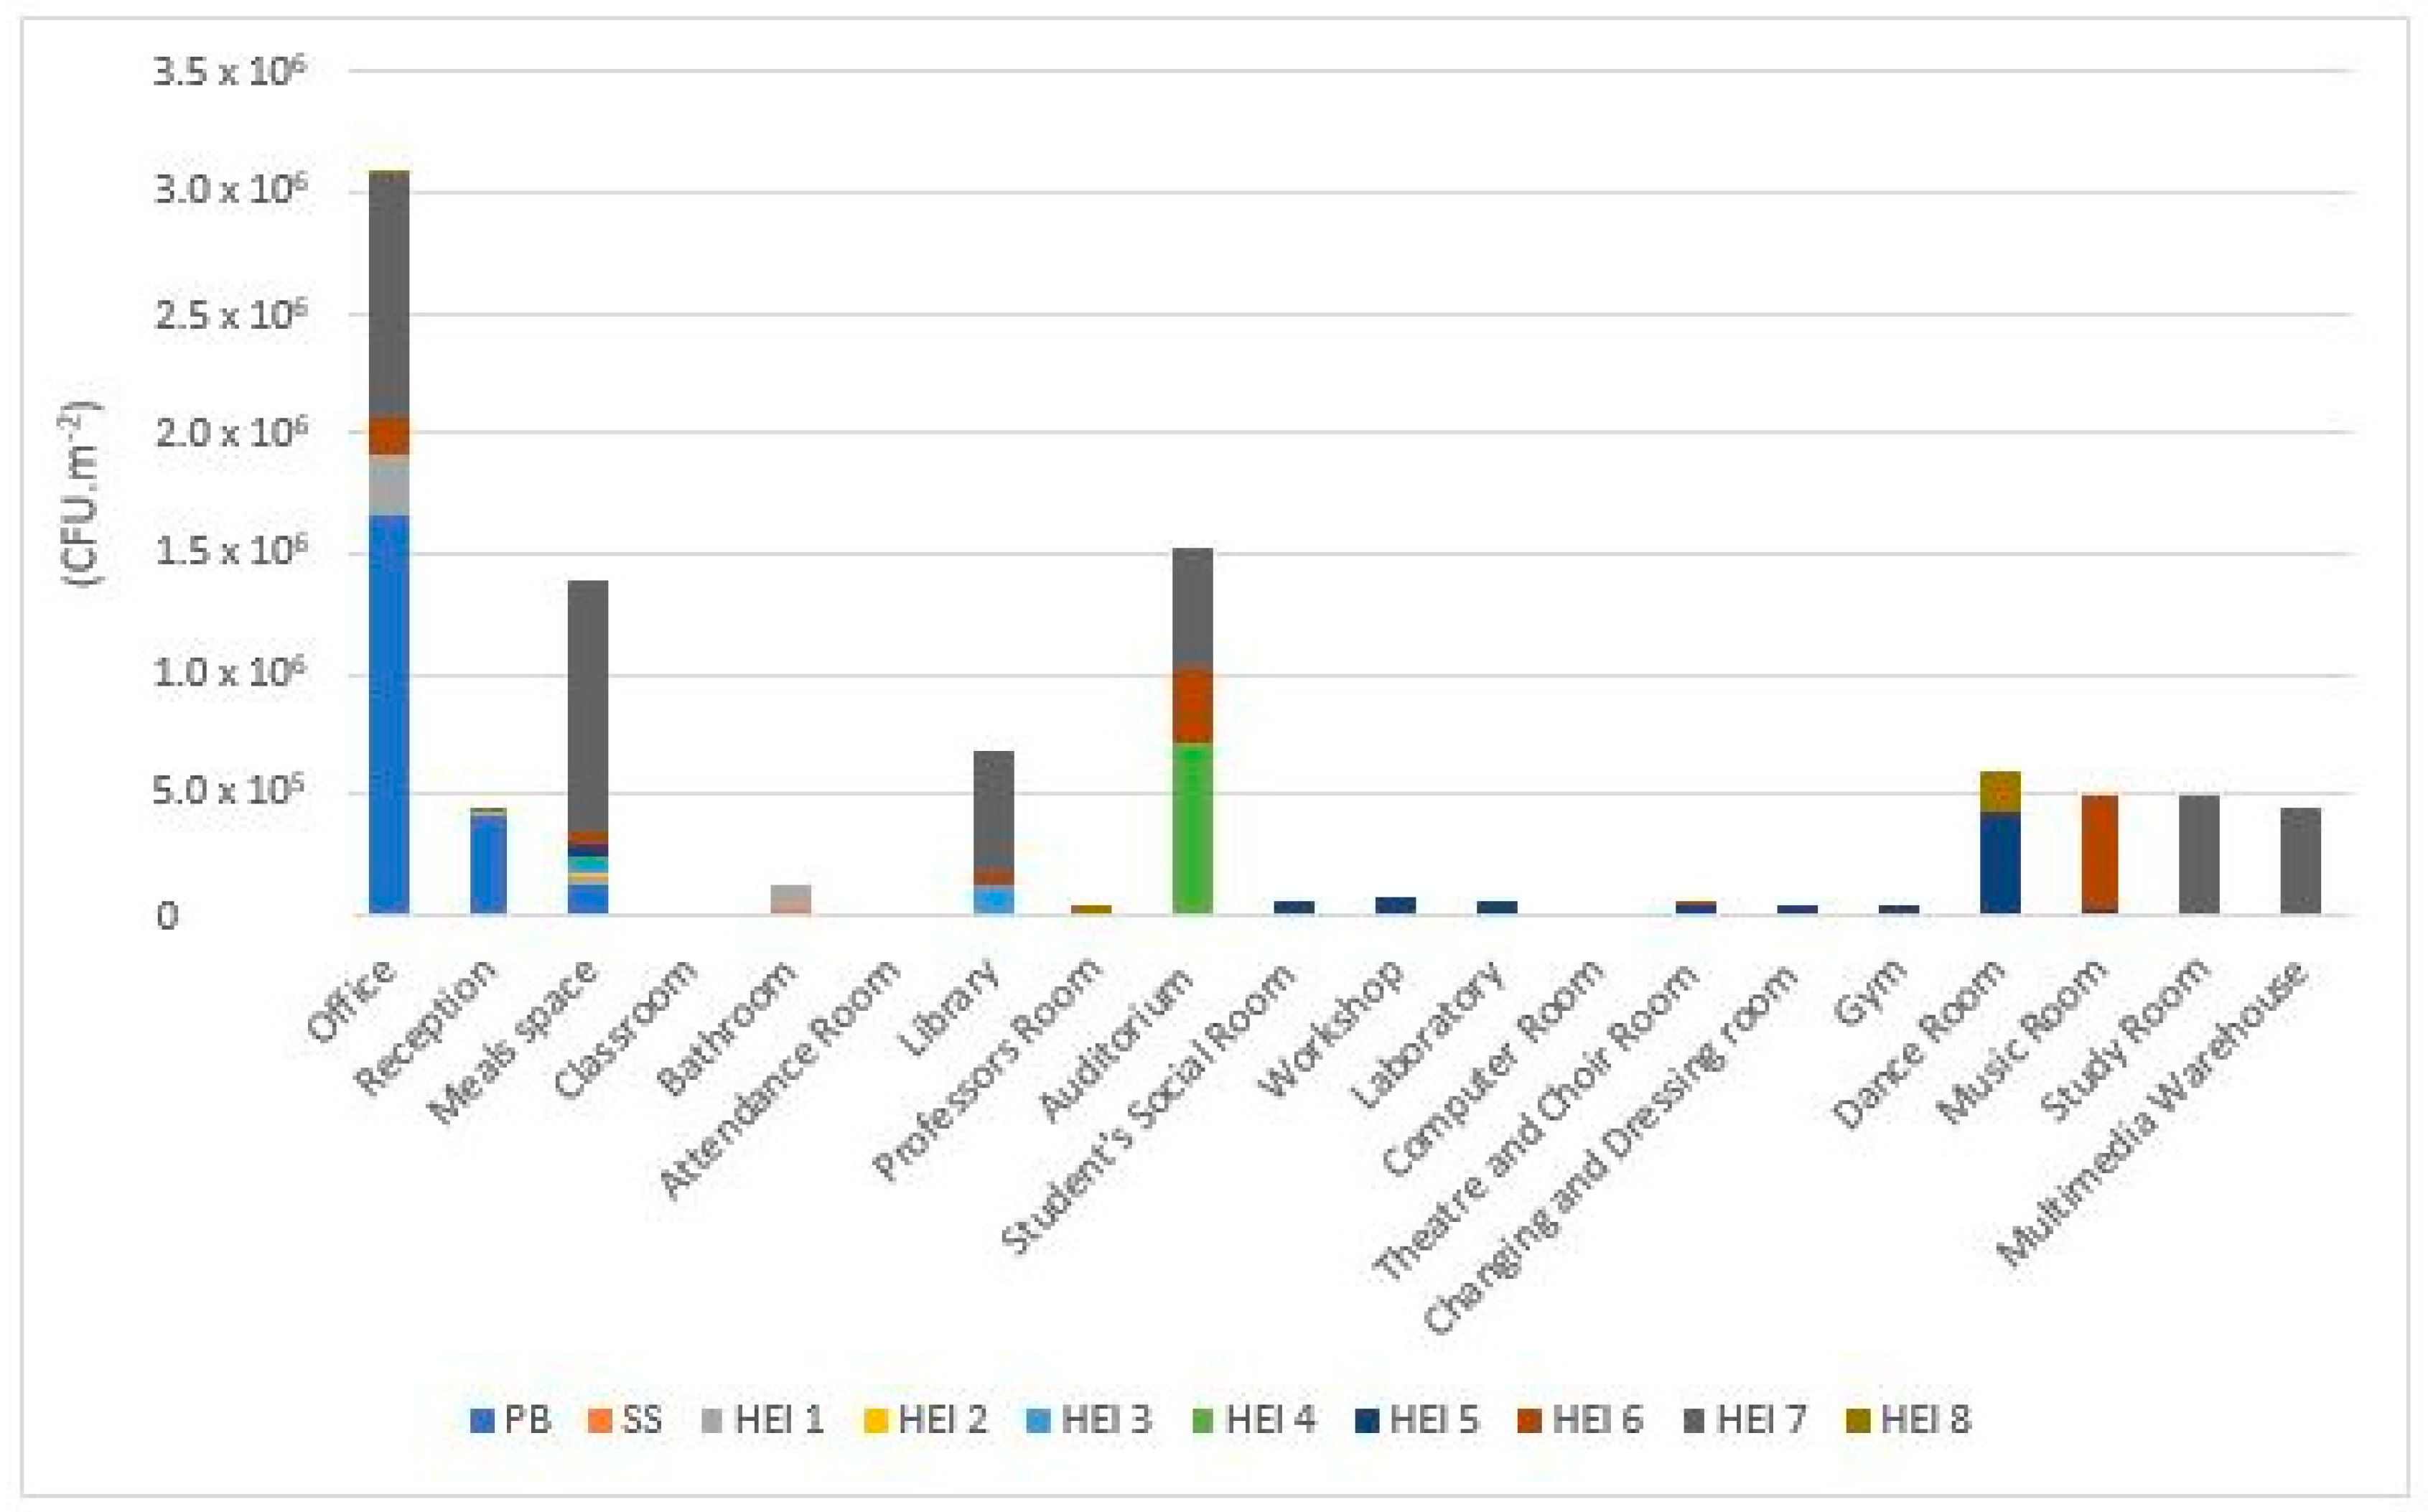
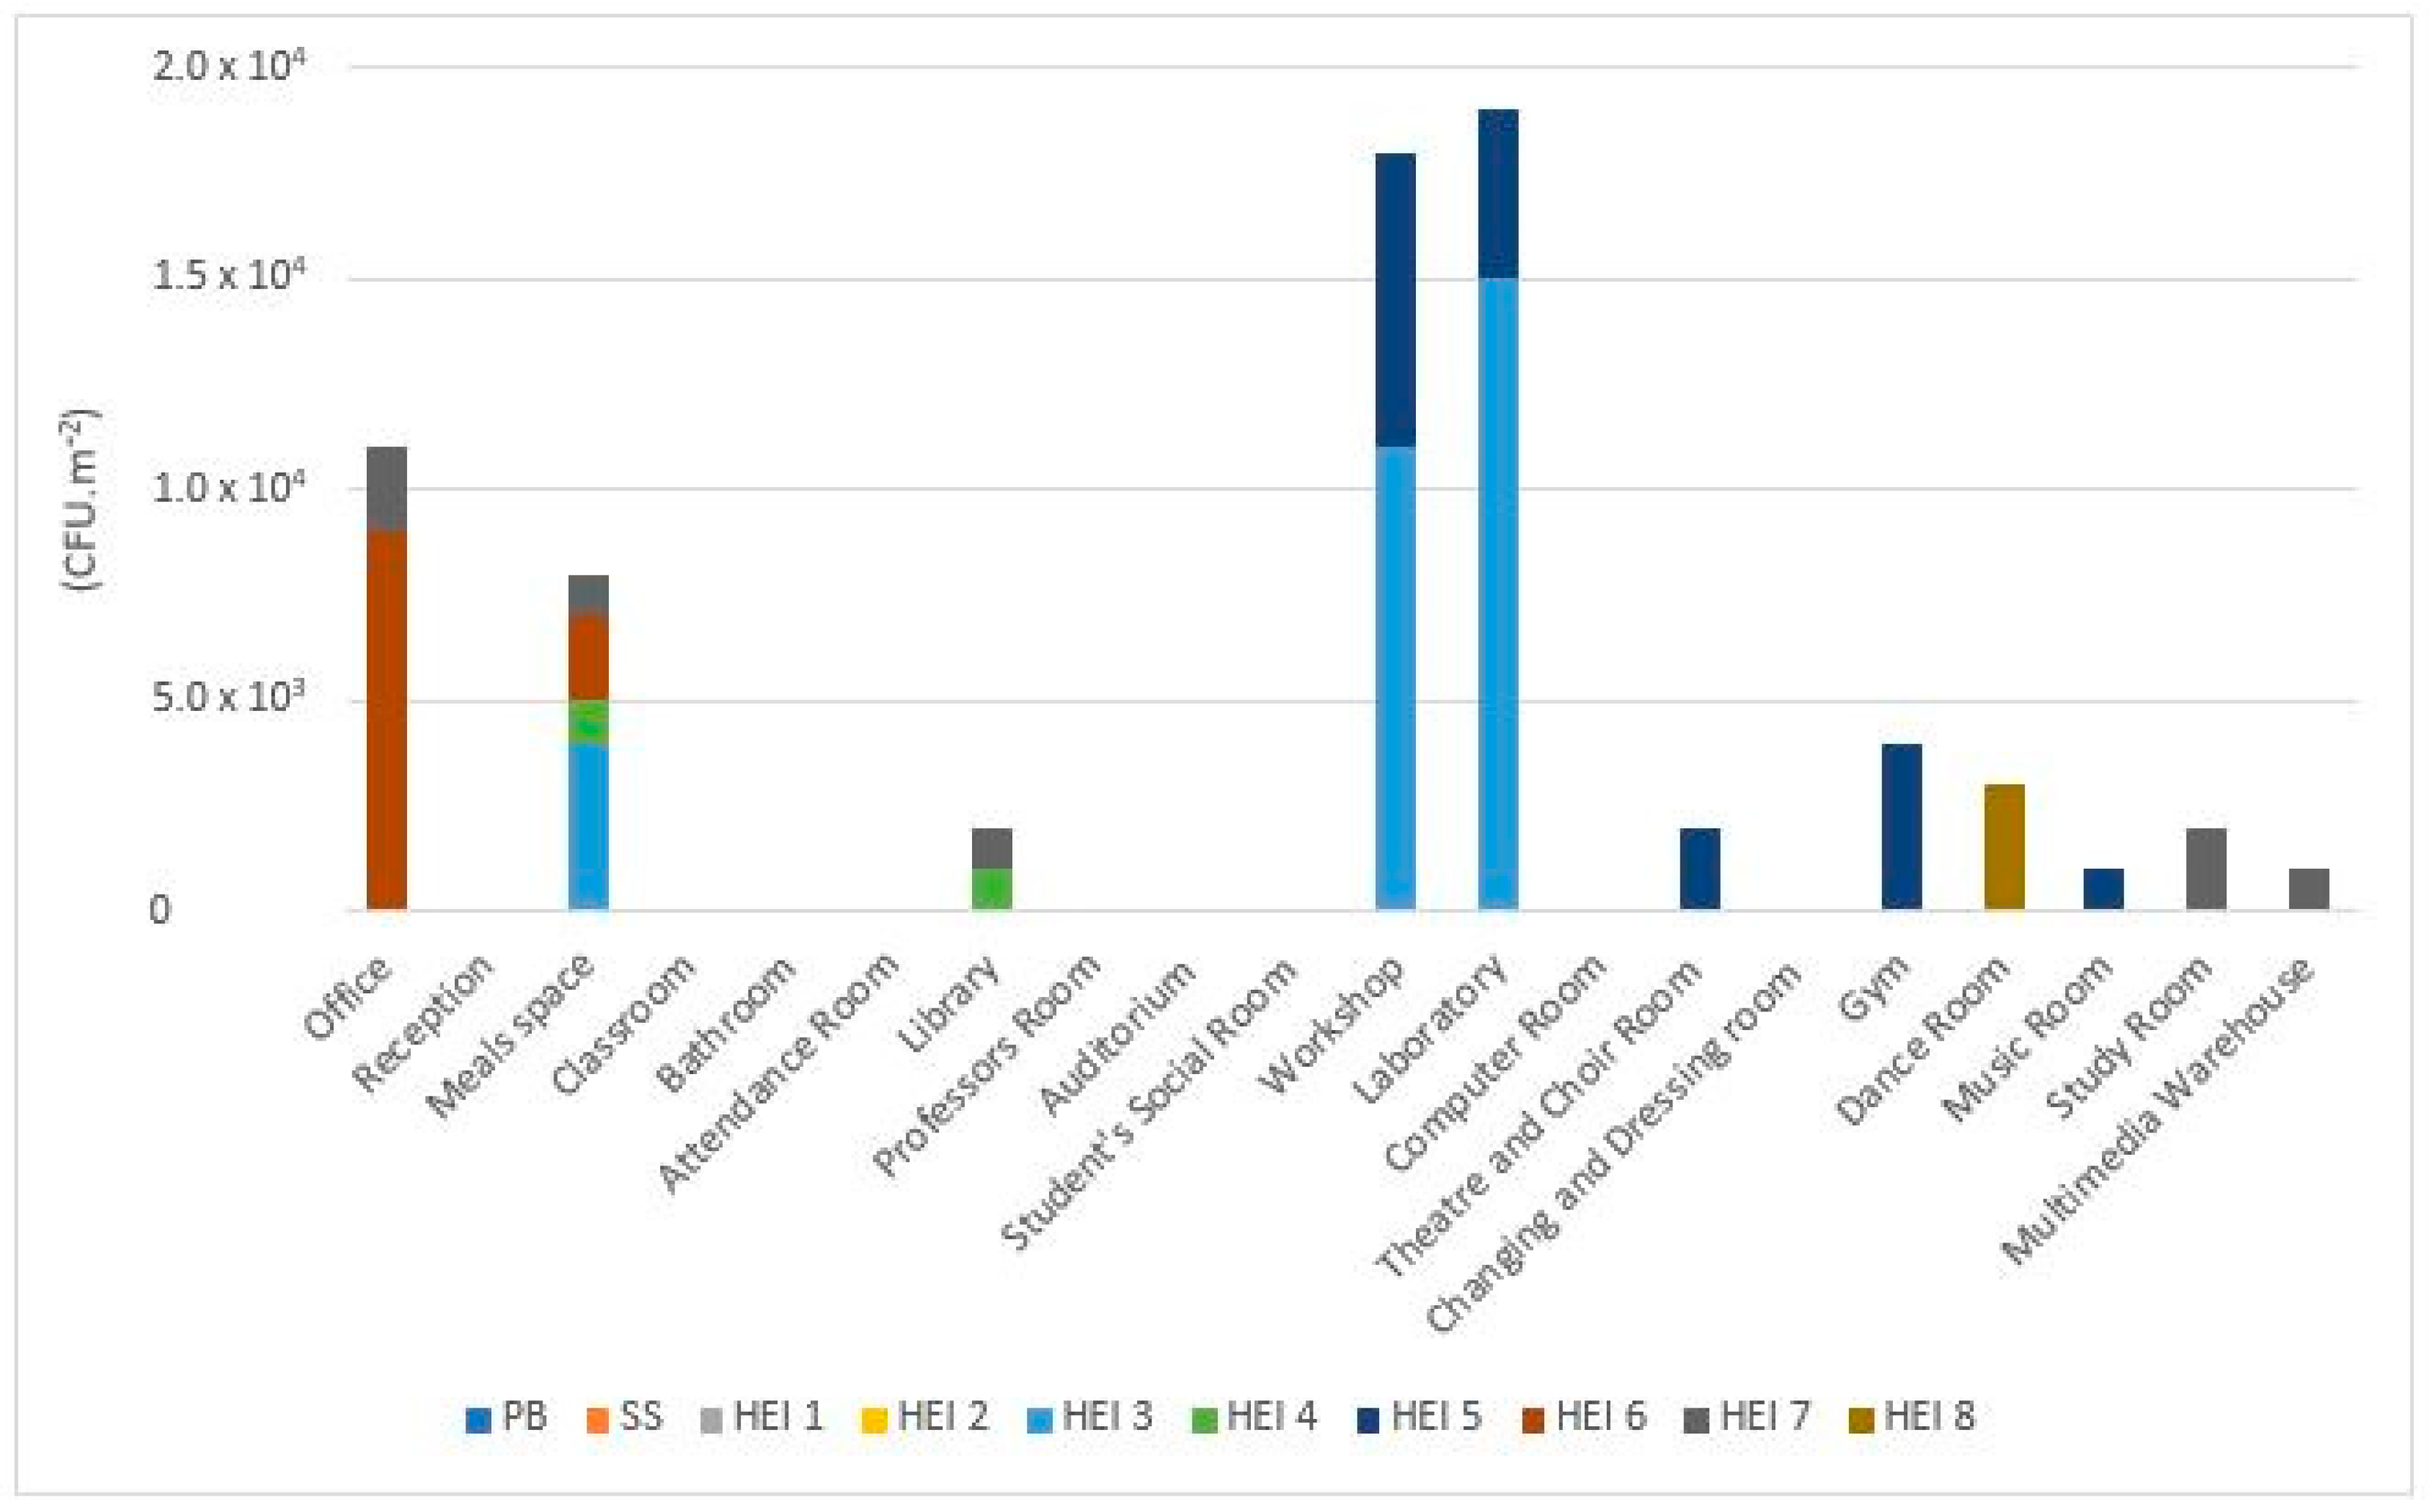
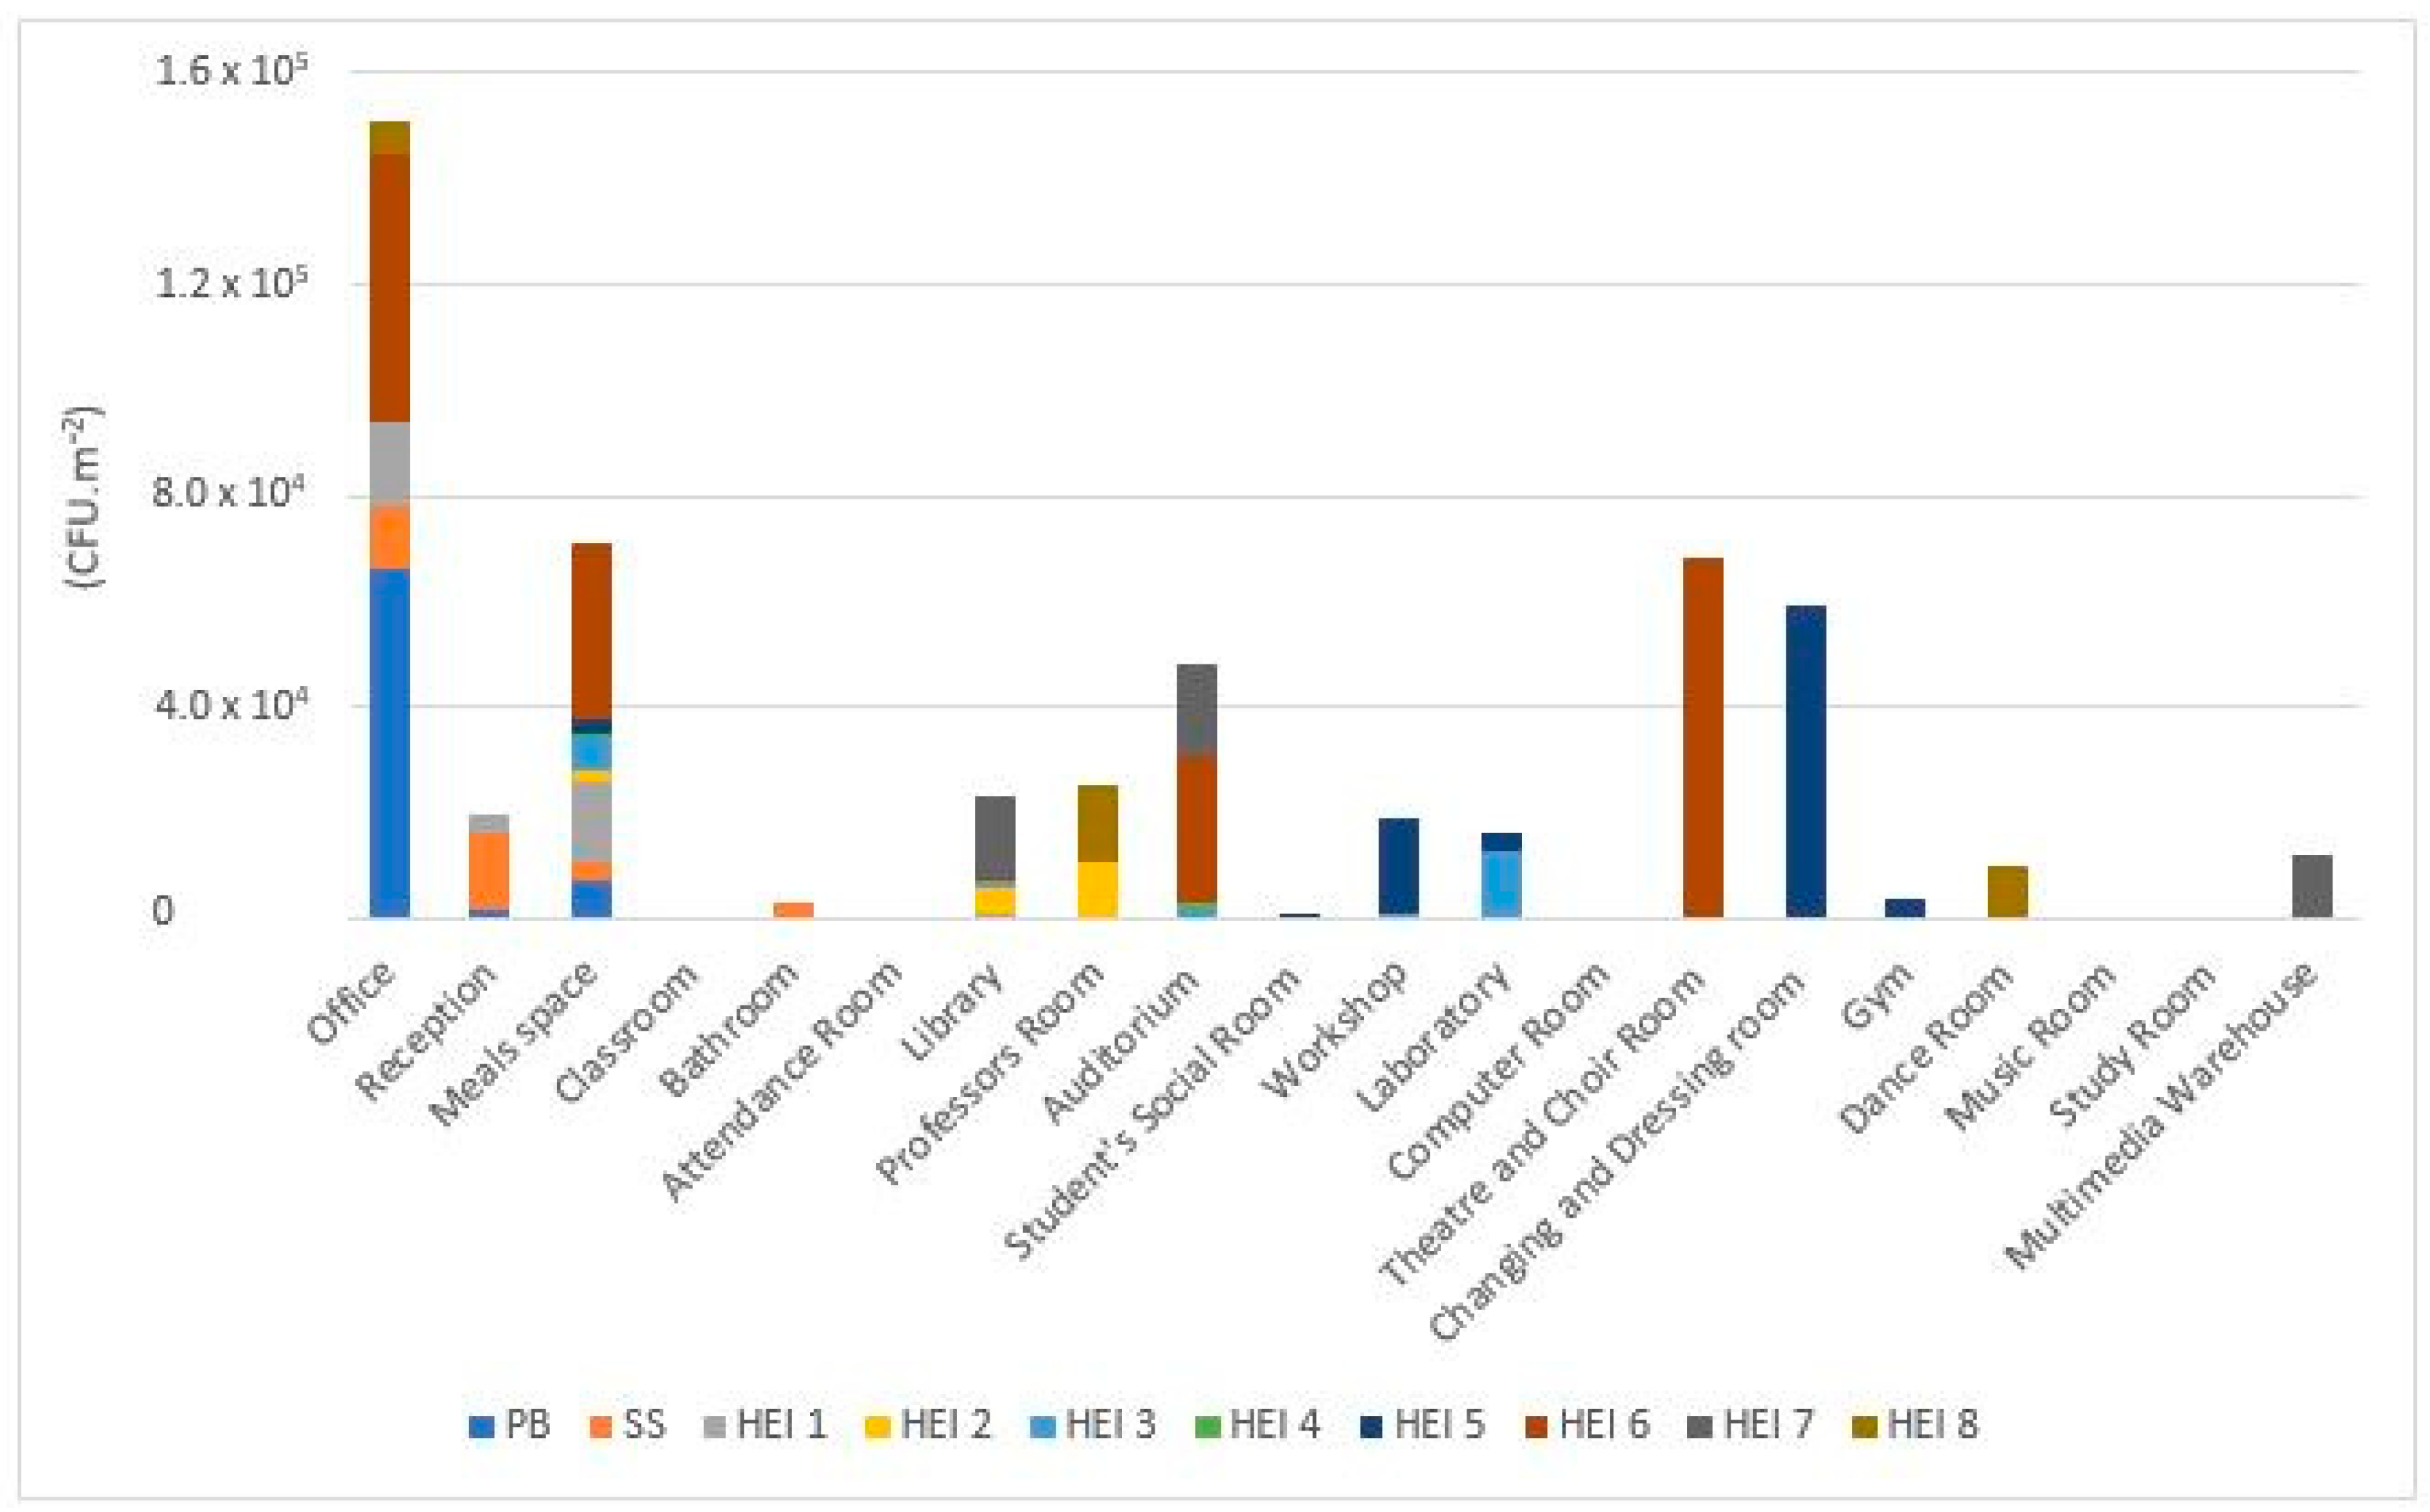
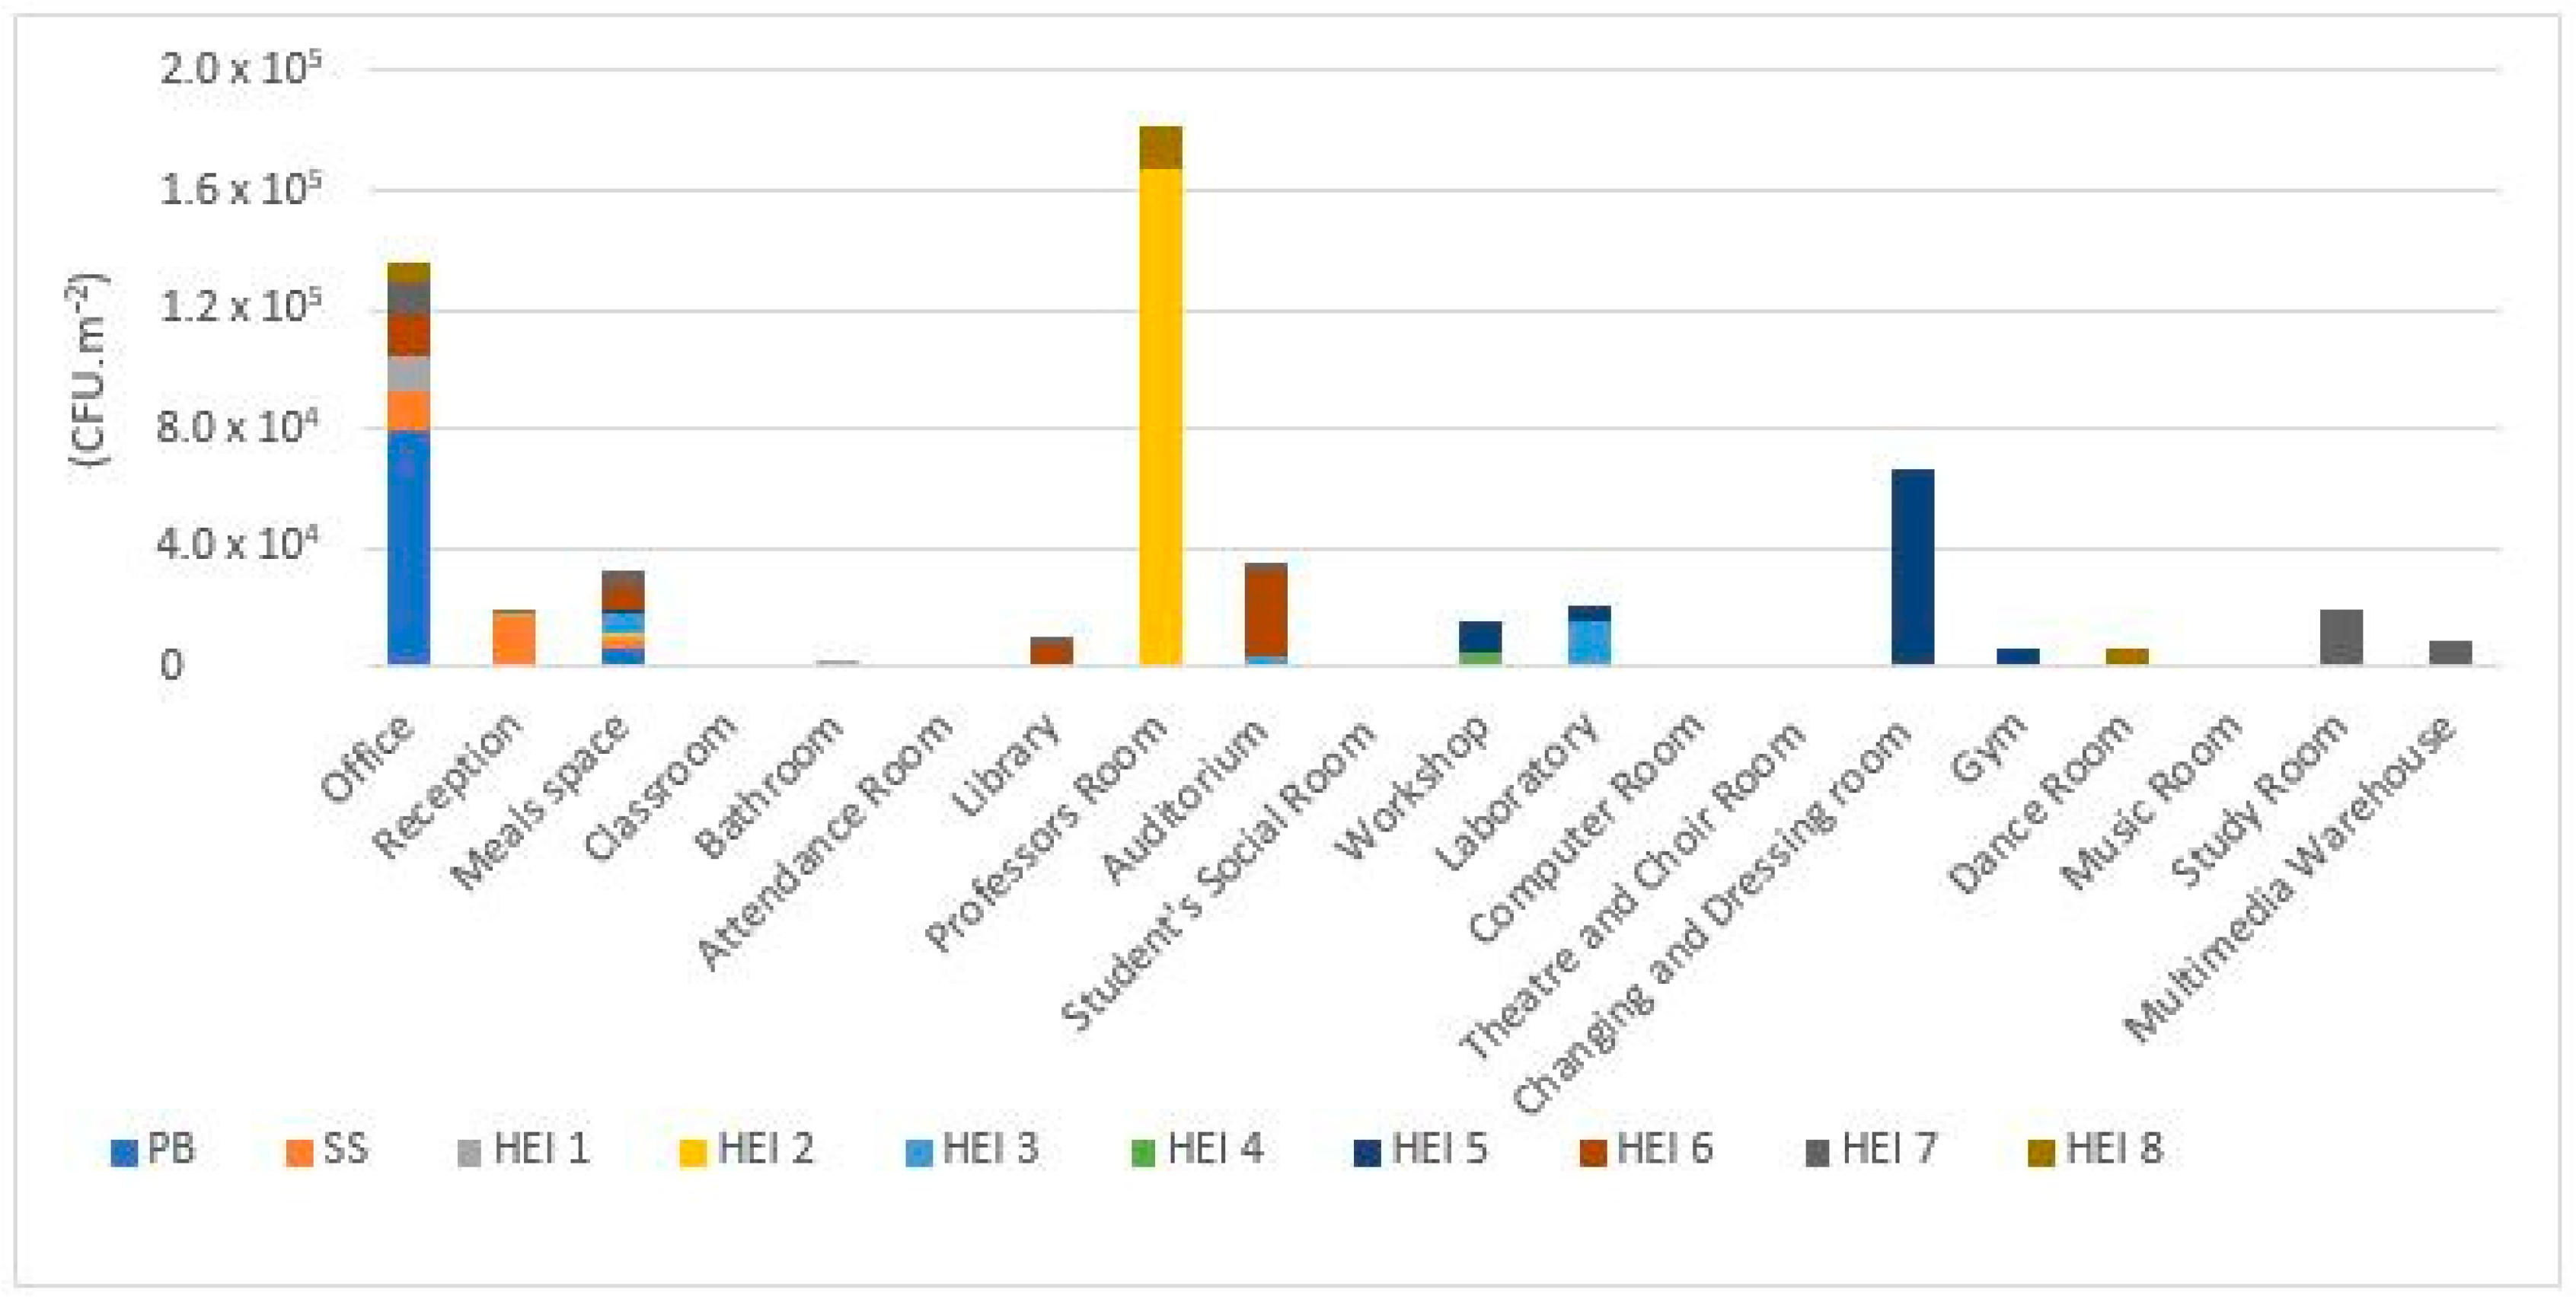
3.1. Viable Microbial Contamination
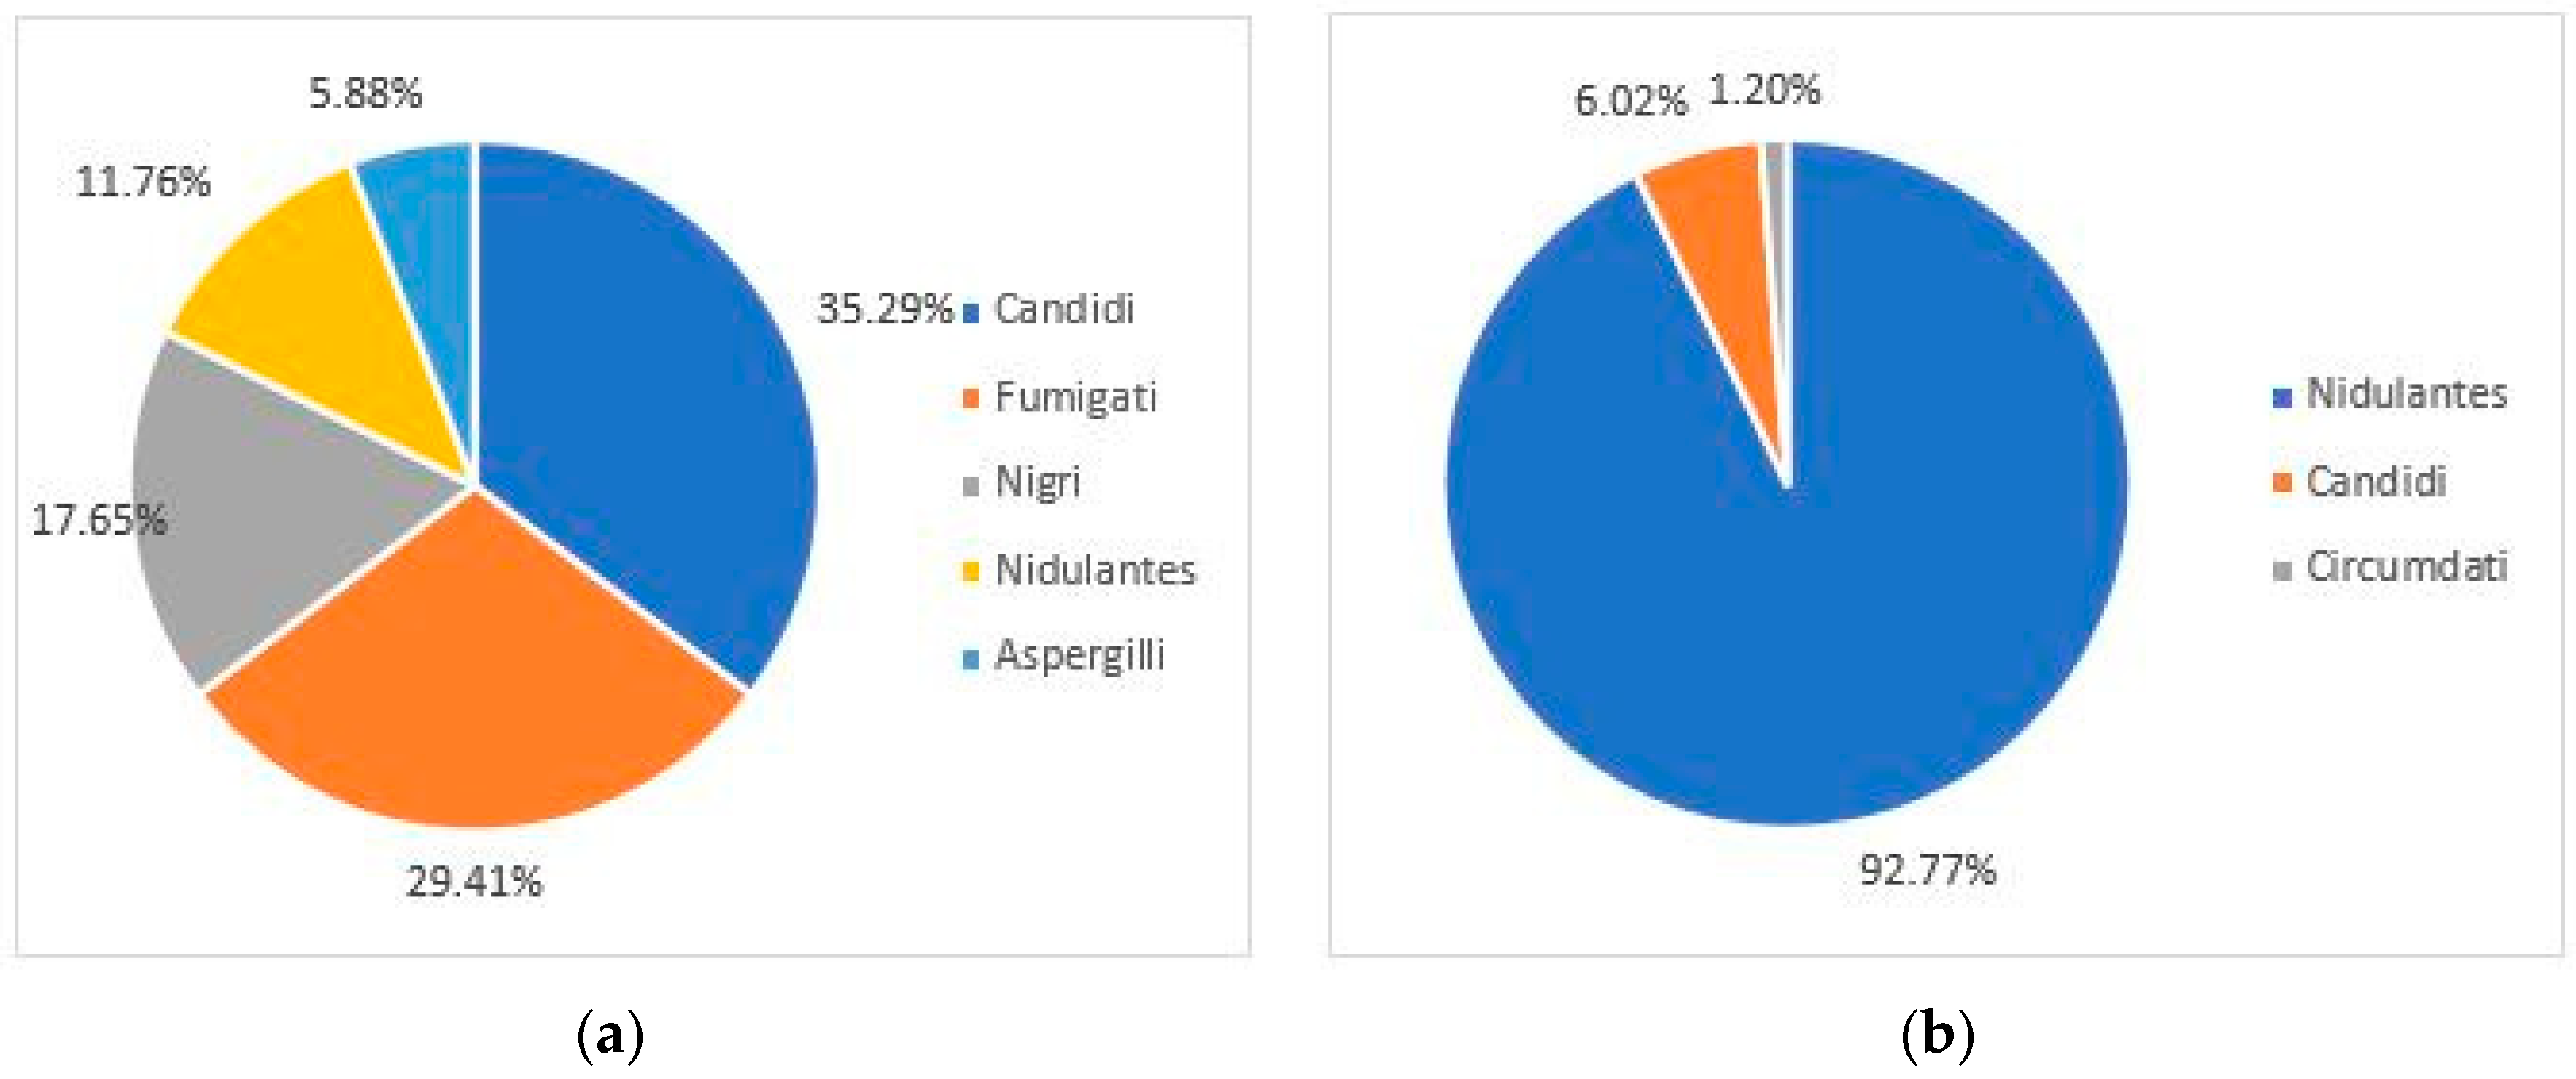
3.2. Azole Resistance Screening
3.3. Molecular Detection
3.4. Correlation Analysis
4. Discussion
5. Conclusions
Author Contributions
Funding
Institutional Review Board Statement
Informed Consent Statement
Conflicts of Interest
References
- Zhang, S.; Zheng, J.; Wu, Y. Field study of air environment perceptions and influencing factors in waiting spaces of general hospitals in winter cities. Build. Environ. 2020, 183, 107203. [Google Scholar] [CrossRef]
- Śmiełowska, M.; Marć, M.; Zabiegała, B. Indoor air quality in public utility environments—A review. Environ. Sci. Pollut. Res. 2017, 24, 11166–11176. [Google Scholar] [CrossRef] [Green Version]
- Yin, H.; Liu, C.; Zhang, L.; Li, A.; Ma, Z. Measurement and evaluation of indoor air quality in naturally ventilated residential buildings. Indoor Built Environ. 2019, 28, 1307–1323. [Google Scholar] [CrossRef]
- Hwang, S.H.; Roh, J.; Park, W.M. Evaluation of PM10, CO2, airborne bacteria, TVOCs, and formaldehyde in facilities for susceptible populations in South Korea. Environ. Pollut. 2018, 242, 700–708. [Google Scholar] [CrossRef]
- Brągoszewska, E.; Biedroń, I.; Kozielska, B.; Pastuszka, J.S. Microbiological indoor air quality in an office building in Gliwice, Poland: Analysis of the case study. Air Qual. Atmos. Health 2018, 11, 729–740. [Google Scholar] [CrossRef] [Green Version]
- Guo, H.; Lee, S.C.; Chan, L.Y. Indoor air quality investigation at air-conditioned and non-air-conditioned markets in Hong Kong. Sci. Total Environ. 2004, 323, 87–98. [Google Scholar] [CrossRef]
- Majd, E.; McCormack, M.; Davis, M.; Curriero, F.; Berman, J.; Connolly, F.; Leaf, P.; Rule, A.; Green, T.; Clemons-Erby, D.; et al. Indoor air quality in inner-city schools and its associations with building characteristics and environmental factors. Environ. Res. 2019, 170, 83–91. [Google Scholar] [CrossRef]
- Van Tran, V.; Park, D.; Lee, Y.C. Indoor Air Pollution, Related Human Diseases, and Recent Trends in the Control and Improvement of Indoor Air Quality. Int. J. Environ. Res. Public Health 2020, 17, 2927. [Google Scholar] [CrossRef] [Green Version]
- Cincinelli, A.; Martellini, T. Indoor air quality and health. Int. J. Environ. Res. Public Health 2017, 14, 1286. [Google Scholar] [CrossRef] [PubMed] [Green Version]
- USEPA. Introduction to Indoor Air Quality. Available online: https://www.epa.gov/indoor-air-quality-iaq/introduction-indoor-air-quality (accessed on 21 January 2021).
- Matos, J.; Brantes, J.; Cunha, A.M. Qualidade do Ar em Espaços Interiores Um Guia Técnico 2010; Agência Port. do Ambient: Lisbon, Portugal, 2010. [Google Scholar]
- Duarte, N.; Roa, S.; Francy, M.-C. Microbiological Air Quality in an Optical Clinic. Ciencia y Tecnología para la Salud Visual y Ocular 2019, 17, 19–28. [Google Scholar] [CrossRef] [Green Version]
- Douwes, J.; Thorne, P.; Pearce, N.; Heederik, D. Bioaerosol health effects and exposure assessment: Progress and prospects. Ann. Occup. Hyg. 2003, 47, 187–200. [Google Scholar] [CrossRef] [PubMed] [Green Version]
- Moelling, K.; Broecker, F. Air Microbiome and Pollution: Composition and Potential Effects on Human Health, including SARS Coronavirus Infection. J. Environ. Public Health 2020, 2020, 1646943. [Google Scholar] [CrossRef]
- Ijaz, M.K.; Zargar, B.; Wright, K.E.; Rubino, J.R.; Sattar, S.A. Generic aspects of the airborne spread of human pathogens indoors and emerging air decontamination technologies. Am. J. Infect. Control 2016, 44, S109–S120. [Google Scholar] [CrossRef]
- Walsh, T.J.; Anaissie, E.J.; Denning, D.W.; Herbrecht, R.; Kontoyiannis, D.P.; Marr, K.A.; Morrison, V.A.; Segal, B.H.; Steinbach, W.J.; Stevens, D.A.; et al. Treatment of aspergillosis: Clinical practice guidelines of the infectious diseases society of America. Clin. Infect. Dis. 2008, 46, 327–360. [Google Scholar] [CrossRef]
- Sabino, R. Exposure to Fungi in Health Care Facilities. Encycl. Mycol. 2021, 2, 1–10. [Google Scholar] [CrossRef]
- WHO. Antimicrobial Resistance. Available online: https://www.who.int/en/news-room/fact-sheets/detail/antimicrobial-resistance (accessed on 5 February 2021).
- Stop neglecting fungi. Nat. Microbiol. 2017, 2, 17120. [CrossRef] [PubMed] [Green Version]
- Azuma, K.; Yanagi, U.; Kagi, N.; Kim, H.; Ogata, M.; Hayashi, M. Environmental factors involved in SARS-CoV-2 transmission: Effect and role of indoor environmental quality in the strategy for COVID-19 infection control. Environ. Health Prev. Med. 2020, 25, 1–17. [Google Scholar] [CrossRef]
- Di Giulio, M.; Grande, R.; Di Campli, E.; Di Bartolomeo, S.; Cellini, L. Indoor air quality in university environments. Environ. Monit. Assess. 2010, 170, 509–517. [Google Scholar] [CrossRef] [PubMed]
- Erlandson, G.; Magzamen, S.; Carter, E.; Sharp, J.L.; Reynolds, S.J.; Schaeffer, J.W. Characterization of indoor air quality on a college campus: A pilot study. Int. J. Environ. Res. Public Health 2019, 16, 2721. [Google Scholar] [CrossRef] [PubMed] [Green Version]
- Haleem, A.M.; Hassan, D.M.A.; Al-hiyaly, S.A.K. Comparative Assessment of Microbial Contamination from Swabs collected within University Facilities. J. Health Sci. 2013, 3, 25–28. [Google Scholar] [CrossRef]
- Ross, A.A.; Neufeld, J.D. Microbial biogeography of a university campus. Microbiome 2015, 3, 66. [Google Scholar] [CrossRef]
- Lou, X.; Fang, Z.; Gong, C. Assessment of culturable airborne fungi in a university campus in Hangzhou, southeast China. Afr. J. Microbiol. Res. 2012, 6, 1197–1205. [Google Scholar] [CrossRef] [Green Version]
- McEwen, S.A.; Collignon, P.J. Antimicrobial Resistance: A One Health Perspective. Antimicrob. Resist. Bact. Livest. Companion Anim. 2018, 6, 521–547. [Google Scholar] [CrossRef] [Green Version]
- MStryjakowska-Sekulska, A.; Piotraszewska-Pająk, A.; Szyszka, M.N.; Filipiak, M. Microbiological quality of indoor air in University Rooms. Pol. J. Environ. 2007, 16, 623–632. [Google Scholar]
- Onet, A.; Ilies, D.C.; Buhas, S.; Rahota, D.; Ilies, A.; Baias, S.; Marcu, F.; Herman, G.V. Microbial air contamination in indoor environment of university sports hall. J. Environ. Prot. Ecol. 2018, 19, 694–703. [Google Scholar]
- Zulfakar, S.S.; Abu Hassan, M.F.; Abu Bakar, N.F. Microbiological Assessment of Selected Laboratories at a Local University in Malaysia. J. Sains Kesihat. Malays. 2019, 17, 119–126. [Google Scholar] [CrossRef]
- Kic, P.; Růžek, L. The microbiological environment in specific rooms of a university campus. Agron. Res. 2014, 12, 837–842. [Google Scholar]
- Hayleeyesus, S.F.; Manaye, A.M. Microbiological quality of indoor air in University libraries. Asian Pac. J. Trop. Biomed. 2014, 4, S312–S317. [Google Scholar] [CrossRef] [PubMed] [Green Version]
- Asif, A.; Zeeshan, M.; Jahanzaib, M. Assessment of indoor and outdoor microbial air quality of cafeterias of an educational institute. Atmos. Pollut. Res. 2019, 10, 531–536. [Google Scholar] [CrossRef]
- Jurado, S.R.; Bankoff, A.D.P.; Sanchez, A. Indoor air quality in Brazilian universities. Int. J. Environ. Res. Public Health 2014, 11, 7081–7093. [Google Scholar] [CrossRef] [Green Version]
- Amira Idris, S.; Hanafiah, M.M.; Ismail, M.; Abdullah, S.; Khan, M.F. Laboratory air quality and microbiological contamination in a university building. Arab. J. Geosci. 2020, 13, 580. [Google Scholar] [CrossRef]
- Li, Y.; Ge, Y.; Wu, C.; Guan, D.; Liu, J.; Wang, F. Assessment of culturable airborne bacteria of indoor environments in classrooms, dormitories and dining hall at university: A case study in China. Aerobiologia 2020, 36, 313–324. [Google Scholar] [CrossRef]
- Crowe, J.; Schnaubelt, A.T.; Scott, S.-B.; Kathleen, A.; Bai, J.; Eske, T.; Molly, N.; Catherine, P.; White, B.; Crotts-Hannibal, B.; et al. Pilot Program for Test-Based SARS-CoV-2 Screening and Environmental Monitoring in an Urban Public School District. medRxiv 2021. [Google Scholar] [CrossRef]
- Viegas, C.; Dias, M.; Gomes, B.; Pimenta, R.; Oliveira, K.; Delgadinho, M.; Ginete, C.; Abreu, R.; Almeida-Silva, M.; Almeida, A.; et al. Towards and integrated approach on Occupational Health to tackle COVID19 pandemic. 2021, submitted for publication.
- United States Environmental Protection Agency. EPA Observational Economy Series Volume 1: Composite Sampling; EPA: Washington, DC, USA, 1995; Volume 1.
- EUCAST (European Committee on Antimicrobial Susceptibility Testing). Available online: https://www.eucast.org (accessed on 21 January 2021).
- De Hoog, C.; Guarro, J.; Gene, G.; Figueras, M. Atlas of Clinical Fungi—The Ultimate Benchtool for Diagnosis, version 4.1.4; Centraalbureau voor Schimmelcultures: Utrecht, The Netherlands, 2016. [Google Scholar]
- Viegas, C.; Sousa, P.; Dias, M.; Caetano, L.A.; Ribeiro, E.; Carolino, E.; Twarużek, M.; Kosicki, R.; Viegas, S. Bioburden contamination and Staphylococcus aureus colonization associated with firefighter’s ambulances. Environ. Res. 2021, 197, 111125. [Google Scholar] [CrossRef] [PubMed]
- Viegas, C.; Coggins, A.M.; Faria, T.; Caetano, L.A.; Gomes, A.Q.; Sabino, R.; Verissimo, C.; Roberts, N.; Watterson, D.; MacGilchrist, C.; et al. Fungal burden exposure assessment in podiatry clinics from Ireland. Int. J. Environ. Health Res. 2018, 28, 167–177. [Google Scholar] [CrossRef] [PubMed]
- World Health Organisation. WHO Guidelines for Indoor Air Quality: Dampness and Mould; WHO Regional Office for Europe: Copenhagen, Denmark, 2009; ISBN 978 92 890 4168 3. [Google Scholar]
- Viegas, C.; Caetano, L.A.; Viegas, S. Occupational exposure to Aspergillus section Fumigati: Tackling the knowledge gap in Portugal. Environ. Res. 2021, 194, 110674. [Google Scholar] [CrossRef] [PubMed]
- Viegas, C. Sampling Methods for an Accurate Mycobiota Occupational Exposure Assessment—Overview of Several Ongoing Projects; CRC Press: London, UK, 2018; ISBN 9781138542037. [Google Scholar]
- Viegas, C.; Almeida, B.; Monteiro, A.; Paciência, I.; Rufo, J.; Aguiar, L.; Lage, B.; Diogo Gonçalves, L.M.; Caetano, L.A.; Carolino, E.; et al. Exposure assessment in one central hospital: A multi-approach protocol to achieve an accurate risk characterization. Environ. Res. 2020, 181, 108947. [Google Scholar] [CrossRef]
- Viegas, C.; Dias, M.; Carolino, E.; Sabino, R. Culture media and sampling collection method for aspergillus spp. Assessment: Tackling the gap between recommendations and the scientific evidence. Atmosphere 2021, 12, 23. [Google Scholar] [CrossRef]
- Viegas, C.; Almeida, B.; Monteiro, A.; Paciência, I.; Rufo, J.C.; Carolino, E.; Quintal-Gomes, A.; Twarużek, M.; Kosicki, R.; Marchand, G.; et al. Settled dust assessment in clinical environment: Useful for the evaluation of a wider bioburden spectrum. Int. J. Environ. Health Res. 2021, 31, 160–178. [Google Scholar] [CrossRef]
- Viegas, C.; Ramalho, I.; Alves, M.; Faria, T.; Caetano, L.A.; Viegas, S. Electrostatic dust cloth: A new sampling method for occupational exposure to bioaerosols. Review of literature. In Proceedings of the SHO-2017—International Symposium on Occupational Safety and Hygiene, Guimarães, Portugal, 10–11 April 2017; pp. 39–41. [Google Scholar]
- Lednicky, J.A.; Lauzard, M.; Fan, Z.H.; Jutla, A.; Tilly, T.B.; Gangwar, M.; Usmani, M.; Shankar, S.N.; Mohamed, K.; Eiguren-Fernandez, A.; et al. Viable SARS-CoV-2 in the air of a hospital room with COVID-19 patients. Int. J. Infect. Dis. 2020, 100, 476–482. [Google Scholar] [CrossRef] [PubMed]
- Monteiro, A.; Almeida, B.; Paciência, I.; Rufo, J.C.; Ribeiro, E.; Carolino, E.; Viegas, C.; Uva, A.S.; Verde, S.C. Bacterial contamination in health care centers: Differences between urban and rural settings. Atmosphere 2021, 12, 450. [Google Scholar] [CrossRef]
- Viegas, C.; Almeida-Silva, M.; Gomes, A.Q.; Wolterbeek, H.T.; Almeida, S.M. Fungal contamination assessment in portuguese elderly care centers. J. Toxicol. Environ. Health Part A Curr. Issues 2014, 77, 14–23. [Google Scholar] [CrossRef]
- Pinheiro, A.C.; Viegas, C.; Viegas, S.; Veríssimo, C.; Brandão, J.; MacEdo, M.F. Indoor air quality in portuguese archives: A snapshot on exposure levels. J. Toxicol. Environ. Health Part A Curr. Issues 2012, 75, 1359–1370. [Google Scholar] [CrossRef] [Green Version]
- Viegas, C.; Dias, M.; Monteiro, A.; Faria, T.; Lage, J.; Carolino, E.; Caetano, L.A.; Gomes, A.Q.; Almeida, S.M.; Verde, S.C.; et al. Bioburden in sleeping environments from Portuguese dwellings. Environ. Pollut. 2021, 273, 116417. [Google Scholar] [CrossRef]
- Canha, N.; Alves, A.C.; Marta, C.S.; Lage, J.; Belo, J.; Faria, T.; Cabo Verde, S.; Viegas, C.; Alves, C.; Almeida, S.M. Compliance of indoor air quality during sleep with legislation and guidelines—A case study of Lisbon dwellings. Environ. Pollut. 2020, 264, 114619. [Google Scholar] [CrossRef] [PubMed]
- Viegas, C.; Twaruzek, M.; Lourenço, R.; Dias, M.; Almeida, B.; Caetano, L.A.; Carolino, E.; Gomes, A.Q.; Kosicki, R.; Soszczyńska, E.; et al. Bioburden assessment by passive methods on a clinical pathology service in one central hospital from lisbon: What can it tell us regarding patients and staff exposure? Atmosphere 2020, 11, 351. [Google Scholar] [CrossRef] [Green Version]
- Viegas, C.; Almeida, B.; Monteiro, A.; Caetano, L.A.; Carolino, E.; Gomes, A.Q.; Twarużek, M.; Kosicki, R.; Marchand, G.; Viegas, S. Bioburden in health care centers: Is the compliance with Portuguese legislation enough to prevent and control infection? Build. Environ. 2019, 160, 106226. [Google Scholar] [CrossRef]
- Viegas, C.; Faria, T.; Pacífico, C.; Dos Santos, M.; Monteiro, A.; Lança, C.; Carolino, E.; Viegas, S.; Cabo Verde, S. Microbiota and Particulate Matter Assessment in Portuguese Optical Shops Providing Contact Lens Services. Healthcare 2017, 5, 24. [Google Scholar] [CrossRef] [Green Version]
- Ramos, C.A.; Viegas, C.; Verde, S.C.; Wolterbeek, H.T.; Almeida, S.M. Characterizing the fungal and bacterial microflora and concentrations in fitness centres. Indoor Built Environ. 2016, 25, 872–882. [Google Scholar] [CrossRef]
- Almeida-Silva, M.; Almeida, S.M.; Pegas, P.N.; Nunes, T.; Alves, C.A.; Wolterbeek, H.T. Exposure and dose assessment to particle components among an elderly population. Atmos. Environ. 2015, 102, 156–166. [Google Scholar] [CrossRef]
- Cabo Verde, S.; Almeida, S.M.; Matos, J.; Guerreiro, D.; Meneses, M.; Faria, T.; Botelho, D.; Santos, M.; Viegas, C. Microbiological assessment of indoor air quality at different hospital sites. Res. Microbiol. 2015, 166, 557–563. [Google Scholar] [CrossRef]
- Wolny-Koładka, K.; Malinowski, M.; Pieklik, A.; Kurpaska, S. Microbiological air contamination in university premises and the evaluation of drug resistance of staphylococci occurring in the form of a bioaerosol. Indoor Built Environ. 2019, 28, 235–246. [Google Scholar] [CrossRef]
- Grisoli, P.; Rodolfi, M.; Chiara, T.; Zonta, L.A.; Dacarro, C. Evaluation of microbiological air quality and of microclimate in university classrooms. Environ. Monit. Assess. 2012, 184, 4171–4180. [Google Scholar] [CrossRef] [PubMed]
- Viegas, C.; Faria, T.; Meneses, M.; Carolino, E.; Viegas, S.; Gomes, A.Q.; Sabino, R. Analysis of surfaces for characterization of fungal burden—Does it matter? Int. J. Occup. Med. Environ. Health 2016, 29, 623–632. [Google Scholar] [CrossRef] [PubMed] [Green Version]
- Srikanth, P.; Sudharsanam, S.; Steinberg, R. Bio-Aerosols in Indoor Environment: Composition, Health Effects and Analysis. Indian J. Med. Microbiol. 2008, 26, 302–312. [Google Scholar] [CrossRef]
- Kim, K.H.; Kabir, E.; Jahan, S.A. Airborne bioaerosols and their impact on human health. J. Environ. Sci. 2018, 67, 23–35. [Google Scholar] [CrossRef] [PubMed]
- Nazaroff, W.W. Indoor bioaerosol dynamics. Indoor Air 2016, 26, 61–78. [Google Scholar] [CrossRef] [PubMed]
- Moldoveanu, A.M. Biological Contamination of Air in Indoor Spaces. In Current Air Quality Issues; Farhad, N., Ed.; INTECHoPE: London, UK, 2015; ISBN 978-953-51-2180-0. [Google Scholar]
- Liofilchem Dichloran Glycerol (DG18) Agar Base. Available online: http://www.liofilchem.net/login/pd/ts/620238_TS.pdf (accessed on 16 April 2021).
- Viegas, C.; Alves, C.; Carolino, E.; Pinheiro, C.; Rosado, L.; Silva-Santos, C. Assessment of fungal contamination in a group of Lisbon’s gymnasiums with a swimming pool. Ital. J. Occup. Environ. Hyg. 2011, 2, 15–20. [Google Scholar]
- Viegas, C.; Faria, T.; Monteiro, A.; Caetano, L.A.; Carolino, E.; Gomes, A.Q.; Viegas, S. A novel multi-approach protocol for the characterization of occupational exposure to organic dust-Swine production case study. Toxics 2018, 6, 5. [Google Scholar] [CrossRef] [Green Version]
- Reboux, G.; Bellanger, A.P.; Roussel, S.; Grenouillet, F.; Sornin, S.; Piarroux, R.; Dalphin, J.C.; Millon, L. Indoor mold concentration in Eastern France. Indoor Air 2009, 19, 446–453. [Google Scholar] [CrossRef]
- Adams, R.I.; Miletto, M.; Taylor, J.W.; Bruns, T.D. The diversity and distribution of fungi on residential surfaces. PLoS ONE 2013, 8, e78866. [Google Scholar] [CrossRef] [PubMed]
- Nevalainen, A.; Täubel, M.; Hyvärinen, A. Indoor fungi: Companions and contaminants. Indoor Air 2015, 25, 125–156. [Google Scholar] [CrossRef] [PubMed]
- WHO. Development of WHO Guidelines for Indoor Air Quality—Report on a Working Group Meeting; World Health Organization Regional Office for Europe: Copenhagen, Denmark, 2006; pp. 1–27. [Google Scholar]
- Varga, J.; Baranyi, N.; Chandrasekaran, M.; Vágvölgyi, C.; Kocsubé, S. Mycotoxin producers in the Aspergillus genus: An update. Acta Biol. Szeged. 2015, 59, 151–167. [Google Scholar]
- Sabino, R.; Veríssimo, C.; Viegas, C.; Viegas, S.; Brandão, J.; Alves-Correia, M.; Borrego, L.M.; Clemons, K.V.; Stevens, D.A.; Richardson, M. The role of occupational Aspergillus exposure in the development of diseases. Med. Mycol. 2019, 57, S196–S205. [Google Scholar] [CrossRef] [PubMed]
- Viegas, C.; Faria, T.; Caetano, L.A.; Carolino, E.; Gomes, A.Q.; Viegas, S. Aspergillus spp. prevalence in different Portuguese occupational environments: What is the real scenario in high load settings? J. Occup. Environ. Hyg. 2017, 14, 771–785. [Google Scholar] [CrossRef] [PubMed]
- Viegas, C.; Santos, P.; Almeida, B.; Monteiro, A.; Carolino, E.; Gomes, A.Q.; Viegas, S. Electrostatic dust collector: A passive screening method to assess occupational exposure to organic dust in primary health care centers. Air Qual. Atmos. Health 2019, 12, 573–583. [Google Scholar] [CrossRef]
- Perlin, D.S.; Rautemaa-Richardson, R.; Alastruey-Izquierdo, A. The global problem of antifungal resistance: Prevalence, mechanisms, and management. Lancet Infect. Dis. 2017, 17, e383–e392. [Google Scholar] [CrossRef]
- Fisher, M.C.; Hawkins, N.J.; Sanglard, D.; Gurr, S.J. Worldwide emergence of resistance to antifungal drugs challenges human health and food security. Science 2018, 360, 739–742. [Google Scholar] [CrossRef] [Green Version]
- Viegas, C.; Twarużek, M.; Dias, M.; Almeida, B.; Carolino, E.; Kosicki, R.; Soszczyńska, E.; Grajewski, J.; Caetano, L.A.; Viegas, S. Assessment of the microbial contamination of mechanical protection gloves used on waste sorting industry: A contribution for the risk characterization. Environ. Res. 2020, 189, 109881. [Google Scholar] [CrossRef]
- Viegas, C.; Dias, M.; Almeida, B.; Aranha Caetano, L.; Carolino, E.; Quintal Gomes, A.; Twarużek, M.; Kosicki, R.; Grajewski, J.; Marchand, G.; et al. Are workers from waste sorting industry really protected by wearing Filtering Respiratory Protective Devices? The gap between the myth and reality. Waste Manag. 2020, 102, 856–867. [Google Scholar] [CrossRef]
- EUCAST. Overview of Antifungal ECOFFs and Clinical Breakpoints for Yeasts, Moulds and Dermatophytes Using the EUCAST E.Def 7.3, E.Def 9.3 and E.Def 11.0 Procedures. Version 2. Available online: https://www.eucast.org (accessed on 21 January 2021).
- CDC. Antifungal Resistance. Available online: https://www.cdc.gov/fungal/antifungal-resistance.html (accessed on 20 June 2021).
- MacNeil, L.; Kauri, T.; Robertson, W. Molecular techniques and their potential application in monitoring the microbiological quality of indoor air. Can. J. Microbiol. 1995, 41, 657–665. [Google Scholar] [CrossRef] [PubMed]
- Madsen, A.M.; Frederiksen, M.W.; Jacobsen, M.H.; Tendal, K. Towards a risk evaluation of workers’ exposure to handborne and airborne microbial species as exemplified with waste collection workers. Environ. Res. 2020, 183, 109177. [Google Scholar] [CrossRef] [PubMed]
- Pena, P.; Morais, J.; Quintal Gomes, A.; Viegas, C. Sampling methods and assays applied in SARS-CoV-2 exposure assessment. Sci. Total Environ. 2021, 775, 145903. [Google Scholar] [CrossRef]
- Moreno, T.; Pintó, R.M.; Bosch, A.; Moreno, N.; Alastuey, A.; Minguillón, M.C.; Anfruns-Estrada, E.; Guix, S.; Fuentes, C.; Buonanno, G.; et al. Tracing surface and airborne SARS-CoV-2 RNA inside public buses and subway trains. Environ. Int. 2021, 147, 106326. [Google Scholar] [CrossRef] [PubMed]
- Bertin Instruments. Air Monitoring—Coriolis Air Samplers Collect Biological Particles in the Air Which Offer New Perspectives for the Control of Airborne Contamination Thanks to Its Liquid Sample. 2020. Available online: https://www.bertininstruments.com/products-range/air-samplers/ (accessed on 21 January 2021).
- Robotto, A.; Civra, A.; Quaglino, P.; Polato, D.; Brizio, E.; Lembo, D. SARS-CoV-2 airborne transmission: A validated sampling and analytical method. Environ. Res. 2021, 200, 111783. [Google Scholar] [CrossRef] [PubMed]


| Study Site | Develped Activities/Graduation Courses Held | Assessed Areas | Surface Swabs (for SARS-CoV-2) | Surface Swabs (for Fungi and Bacteria) | Air Samples |
|---|---|---|---|---|---|
| PB | Presidency services that support the HEI in the activities common to the institution | Communication Office (Doorknob) | 1 | 1 | 0 |
| Communication Office (Ventilation grids) | 1 | 1 | |||
| Drivers Reception (Counter) | 1 | 1 | |||
| Entrance (Touch screen and money) | 1 | 1 | |||
| Entrance (Buttons) | 1 | ||||
| Lunchroom (Microwave and Coffee machine) | 1 | 0 | |||
| Lunchroom (Refrigerator) | 1 | 0 | |||
| Lunchroom (Ventilation grids) | 1 | 1 | |||
| Human Resources (Coffee machines) | 1 | 0 | |||
| Human Resources (Access card) | 1 | 0 | |||
| Human Resources (Staplers and stamps) | 1 | 0 | |||
| Human Resources (Ventilation grids) | 1 | 1 | |||
| Financial Resources (Staplers and stamps) | 1 | 1 | |||
| Human and Financial Resources (Windows) | 1 | 0 | |||
| Human and Financial Resources (Doorknob) | 1 | 0 | |||
| Financial Resources (Ventilation grids in operation) | 1 | 1 | |||
| Reception 1 (Printer) | 1 | 0 | |||
| Reception 2 (Table) | 1 | 0 | |||
| Acquisition Department (1st floor) (Windows) | 1 | 0 | |||
| Acquisition Department (1st floor) (Keys and card) | 1 | 0 | |||
| Acquisition Department (1st floor) (Ventilation grids in operation) | 1 | 1 | |||
| Male Bathroom (1st floor) (Doorknob and Faucets) | 1 | 0 | |||
| Female Bathroom (1st floor) (Doorknob and Faucets) | 1 | 0 | |||
| Corridor (1st floor) (Printer) | 1 | 0 | |||
| Academics, Quality and Planning Department (Mobile air conditioning equipment) | 1 | 0 | |||
| SS | Social services that implement the school social action policy and the provision of support and benefits to students who attend the institution | Lunchroom (Table) | 0 | 1 | 1 |
| Lunchroom (Microwave, Refrigerator) | 1 | 1 | |||
| Lunchroom (Door) | 1 | 1 | |||
| Waiting Room/Classroom (Coffee Machine) | 1 | 0 | 1 | ||
| Waiting Room/Classroom (Coffee Machine, PC and eraser) | 0 | 1 | |||
| Waiting Room/Classroom (Table) | 1 | 1 | |||
| Reception (Counter) | 1 | 1 | 1 | ||
| Reception (Door and Water Machine) | 1 | 1 | |||
| Bathroom (Doors and Faucets) | 1 | 1 | 1 | ||
| Bathroom (Floor) | 0 | 1 | |||
| Attendance Room (Table and Acrylic Protection) | 1 | 1 | 1 | ||
| Accounting (Printer) | 1 | 1 | 1 | ||
| Accounting (Doors) | 1 | 0 | |||
| Accounting (Floor) | 0 | 1 | |||
| HEI 1 | Health sciences and technologies for the exercise of skills in the field of disease prevention and health promotion, diagnosis and therapeutic intervention and rehabilitation | Logistics (Door and Window) | 1 | 1 | 1 |
| Accounting/Provisioning (Printer, Door and Stapler) | 1 | 1 | 1 | ||
| Academic Services (Printer SA and Printer corridor) | 1 | 1 | 1 | ||
| Reception (Door, Handrail and Balcony) | 1 | 1 | 0 | ||
| Bar (Chairs and Door) | 1 | 1 | 1 | ||
| Library (Printer and Computer) | 1 | 1 | 1 | ||
| Lunchroom (1st floor) (Fridge and microwave) | 1 | 1 | 1 | ||
| Lunchroom (2nd floor) (Fridge and microwave) | 1 | 1 | 1 | ||
| Corridor (1st floor) (Printer) | 1 | 1 | 0 | ||
| Bathroom (1st floor) (Doorknobs, Door and Flush toilet) | 1 | 1 | 0 | ||
| Office (Mouse, Keyboard, Light switch, Door and Doorknob) | 1 | 1 | 0 | ||
| Corridor (2nd floor) (Printer) | 1 | 1 | 0 | ||
| Bathroom (2nd floor) (Doorknobs, Door and Flush toilet) | 1 | 1 | 0 | ||
| HEI 2 | Accounting and business technicians to perform administrative and financial accounting activities of national organizations | Financial Services (Printers and Stapler) | 1 | 1 | 1 |
| Professors Room 1 (Printers and Computers) | 1 | 1 | 1 | ||
| Professors Room 2 (Printers, Computers and TV control) | 1 | 1 | 1 | ||
| Cafeteria/Bar (Counter and Tables) | 1 | 1 | 1 | ||
| Auditorium (Handrail, Light switch and Door) | 1 | 1 | 1 | ||
| Student’s Social Room (Door, Fridge, Microwave, Faucet, Coffee and Machine) | 1 | 1 | 1 | ||
| Library (Printer and Computers) | 1 | 1 | 1 | ||
| Human Resources (Printer, Door, Acrylics, Counter and Light switch) | 1 | 1 | 1 | ||
| HEI 3 | Classic engineering areas and in the area of renewable energies, acoustics, environment, hygiene and safety, urban rehabilitation, biomedical engineering and management | Library (Computer, Printer and Doorknob) | 1 | 1 | 1 |
| Lunchroom 1 (Faucet, Doorknob, Chair, Table, Microwave, Coffee machine and Faucet) | 1 | 1 | 1 | ||
| Lunchroom 2 (Microwave, Toaster, Kettle, Doorknob, Door, Table and Chair) | 1 | 1 | 1 | ||
| Bar 1 (Microwave, Refrigerator, Handles, Cash register and ATM) | 1 | 1 | 1 | ||
| Workshop (Machine, Doorknob and Door) | 1 | 1 | 1 | ||
| Bar 2 (Cash register, Control, Fridge and Microwave) | 1 | 1 | 1 | ||
| Organic Chemistry Lab 1 (Scale and Faucets) | 1 | 1 | 1 | ||
| Organic Chemistry Lab 2 (Equipments, Door and Doorknob) | 1 | 1 | 1 | ||
| Inorganic Chemistry Lab (Computer, Doorknobs, Equipments, Micropipettes and Refrigerator) | 1 | 1 | 1 | ||
| Canteen (Faucets, Counter, Acrylic and Cash Register) | 1 | 1 | 1 | ||
| Auditorium (Doorknobs, Door, Table, Chair and Eraser) | 1 | 1 | 1 | ||
| HEI 4 | Theater and cinema, including conducting research activities, experimentation and artistic production | Library (PC, Windows and Tables) | 1 | 1 | 1 |
| Canteen (Chairs, Table, PC and Doorknob) | 1 | 1 | 1 | ||
| Bar (Counter, Napkin Holder, PC, Coffee Machine and Table) | 1 | 1 | 1 | ||
| Grand Auditorium (Doorknob, PC and Chairs) | 1 | 1 | 1 | ||
| Small Auditorium (Scenic Interpretation Studio) (Door, Table, Doorknob and Chairs) | 1 | 1 | 1 | ||
| Computer Room (Switch, Mouse, PC, Keyboard, Door and Doorknob) | 1 | 1 | 1 | ||
| Workshop (Doorknob, Tables, Lockers and Equipment) | 1 | 1 | 1 | ||
| HEI 5 | Teachers, and other educational agents with a high level of cultural, scientific, technical, and professional preparation | Bar/Cafeteria (Cash Register and Counters) | 1 | 1 | 1 |
| Science Laboratory (Physic-Chemical) (Chairs, Scales, Faucets and Handle) | 1 | 1 | 1 | ||
| Student’s Social Room (Microwave, Faucet, Windows and Chairs) | 1 | 1 | 1 | ||
| Theatre and Choir Room (Switch, Door, Doorknob, Windows, Tables and Chairs) | 1 | 1 | 1 | ||
| Changing room/Dressing room (Doors, Doorknobs, Faucets) | 1 | 1 | 1 | ||
| Gym (Doors, Doorknobs, Table, Chair, Equipment) | 1 | 1 | 1 | ||
| Ceramic Workshop (Tables, Chairs, Faucets, Eraser, Doorknob, Door) | 1 | 1 | 1 | ||
| Dance Room (Doorknobs, Doors, Eraser) | 1 | 1 | 1 | ||
| Music Room (Switch, Piano, Doorknob, Window and Chairs) | 1 | 1 | 1 | ||
| HEI 6 | Artistic, technical, technological, and scientific training for music professionals | Grand Auditorium (Chairs, Tables, Piano and Tripods) | 1 | 1 | 0 |
| Small Auditorium (Chairs, Tables, Piano and Tripods) | 1 | 1 | |||
| Library (Computers and Tables) | 1 | 1 | |||
| Academic Services (Printer, Doorknob and Cabinets) | 1 | 1 | |||
| Corridor (Printer) | 1 | 1 | |||
| Academic Services (Customer Service) (Acrylic, Pens, Coffee Machine and Tables) | 1 | 1 | |||
| Lunchroom (Microwave, Tables, Chairs, Refrigerator, Doorknobs and Switch) | 1 | 1 | |||
| Choir Room (Chairs, Tables, Piano, Eraser, Switch, Door and Doorknobs) | 1 | 1 | |||
| Music Room (Eraser, Tripods, Acrylic, Door, Doorknob, Switch and Piano) | 1 | 1 | |||
| HEI 7 | Social communication, including the areas of audiovisual and multimedia, journalism, advertising and marketing, and public relations and business communication | Bar (Chairs, Tables, Cash Register, Acrylic, Counter and Calculator) | 1 | 1 | 0 |
| Study Room (Food and coffee machines, Chairs and Tables) | 1 | 1 | |||
| Corridor (Printer) | 1 | 1 | |||
| “Home Food” Space (Microwave, Water machine, Tables and Chairs) | 1 | 1 | |||
| Auditorium (Door, Doorknob and Chairs) | 1 | 1 | |||
| Academic Services (Tables, Switch, Chairs, Acrylic, Printer, Stapler, Hole Puncher, Door and Doorknob) | 1 | 1 | |||
| Library (Tables, Chairs and Acrylic) | 1 | 1 | |||
| Multimedia Warehouse (Printer, Computers, Keyboards, Mouse, Barcode reader, Microwave, TV and Chairs) | 1 | 1 | |||
| HEI 8 | Dance | Academic Services (Printer, Doorknob, Acrylic and Table) | 1 | 1 | 0 |
| Dance Reception (Doorknob, Computer, Telephone and Keys) | 1 | 1 | |||
| Professors Room (Doorknob, Printer, Switch, Flush toilet, Table and Chairs) | 1 | 1 | |||
| Atrium Dance Studio (Bar and Sound System) | 1 | 1 | |||
| Dance Studio 1 (Bar and Sound System) | 1 | 1 | |||
| Dance Studio 2 (Bar and Sound System) | 1 | 1 | |||
| Total | 106 | 92 | 48 |
| MEA | DG18 | ||
|---|---|---|---|
| Fungi | n (CFU·m−2); % | Fungi | n (CFU·m−2); % |
| Cladosporium sp. | 2.51 × 10⁵; 47.36 | Cladosporium sp. | 1.83 × 10⁵; 32.33 |
| Penicillium sp. | 2.17 × 10⁵; 40.94 | Aureobasidium sp. | 1.64 × 10⁵; 28.98 |
| Aspergillus sp. | 1.70 × 10⁴; 3.21 | Penicillium sp. | 1.17 × 10⁵; 20.67 |
| Rhizopus sp. | 1.40 × 10⁴; 2.64 | Aspergillus sp. | 8.30 × 10⁴; 14.66 |
| Aureobasidium sp. | 1.20 × 10⁴; 2.26 | Chrysosporium sp. | 1.10 × 10⁴; 1.94 |
| Alternaria sp. | 8.00 × 10³; 1.51 | Fusarium sp. | 3.00 × 10³; 0.53 |
| Chrysosporium sp. | 5.00 × 10³; 0.94 | Chrysonilia sp. | 2.00 × 10³; 0.35 |
| Phoma sp. | 3.00 × 10³; 0.57 | Mucor sp. | 2.00 × 10³; 0.35 |
| Acremonium sp. | 2.00 × 10³; 0.38 | Acremonium sp. | 1.00 × 10³; 0.18 |
| Chrysonilia sitophila | 1.00 × 10³; 0.19 | ||
| Total | 5.30 × 10⁵; 100 | 5.66 × 10⁵; 100 | |
| SAB | ITR | VOR | POS | |
|---|---|---|---|---|
| Fungi | n (CFU·m−2); % | n (CFU·m−2); % | n (CFU·m−2); % | n (CFU·m−2); % |
| Acremonium sp. | 1.10 × 10⁴; 3.44 | 0.00 | 1.00 × 10³; 0.70 | 0.00 |
| Alternaria sp. | 1.00 × 10³; 0.31 | 2.00 × 10³; 3.92 | 1.00 × 10³; 0.70 | 0.00 |
| Aspergillus section Candidi | 2.00 × 10³; 0.63 | 0.00 | 0.00 | 0.00 |
| Aspergillus section Fumigati | 3.00 × 10³; 0.94 | 0.00 | 0.00 | 0.00 |
| Aspergillus section Nidulantes | 5.00 × 10³; 1.56 | 0.00 | 0.00 | 0.00 |
| Aspergillus section Nigri | 8.00 × 10³; 2.50 | 0.00 | 1.00 × 10³; 0.70 | 0.00 |
| Bipolaris sp. | 3.00 × 10³; 0.94 | 0.00 | 0.00 | 0.00 |
| Aspergillus section Circumdati | 1.00 × 10³; 0.31 | 0.00 | 0.00 | 0.00 |
| Aureobasidium sp. | 9.00 × 10³; 2.81 | 0.00 | 6.00 × 10³; 4.23 | 0.00 |
| Chrysonilia sitophila | 1.00 × 10³; 0.31 | 3.00 × 10³; 5.88 | 4.00 × 10³; 2.82 | 1.00 × 10³; 2.22 |
| Chrysosporium sp. | 2.20 × 10⁴; 6.88 | 9.00 × 10³; 17.65 | 1.30 × 10⁴; 9.15 | 8.00 × 10³; 17.78 |
| Cladosporium sp. | 1.93 × 10⁵; 60.31 | 3.30 × 10⁴; 64.71 | 9.30 × 10⁴; 65.49 | 2.40 × 10⁴; 53.33 |
| Mucor sp. | 1.30 × 10⁴; 4.06 | 2.00 × 10³; 3.92 | 2.00 × 10³; 1.41 | 1.00 × 10³; 2.22 |
| Penicillium sp. | 4.40 × 10⁴; 13.75 | 2.00 × 10³; 3.92 | 2.10 × 10⁴; 14.79 | 1.00 × 10⁴; 22.22 |
| Rhizopus sp. | 3.00 × 10³; 0.94 | 0.00 | 0.00 | 1.00 × 10³; 2.22 |
| Ulocladium sp. | 1.00 × 10³; 0.31 | 0.00 | 0.00 | 0.00 |
| Total | 3.20 × 10⁵; 100 | 5.10 × 10⁴; 100 | 1.42 × 10⁵; 100 | 4.50 × 10⁴; 100 |
| Sample Type | CFU·m−2 (in MEA/DG18) | Cq |
|---|---|---|
| Swab | 0/0 | 31.56 |
| 0/0 | 28.32 |
| Bacterial Counts (CFU·m−2) | Fungal Counts (CFU·m−2) | Azole Resistance (CFU·m−2) | Aspergillus sp. | Number of Workers | ||||||||||
|---|---|---|---|---|---|---|---|---|---|---|---|---|---|---|
| Fungi | Azole Resistance | |||||||||||||
| VRBA | MEA | DG18 | SAB | ITR | VOR | POS | MEA | DG18 | SAB | VOR | ||||
| Bacterial counts | TSA | 0.252 * | 0.149 | 0.141 | 0.354 ** | 0.130 | 0.235 * | 0.343 ** | −0.,115 | 0.043 | 0.061 | −0.009 | 0.287 ** | |
| VRBA | −0.008 | 0.235 * | 0.059 | 0.119 | 0.108 | 0.064 | −0.098 | −0.022 | −0.061 | −0.061 | −0.082 | |||
| Fungal counts | MEA | 0.586 ** | 0.494 ** | 0.362 ** | 0.485 ** | 0.123 | 0.265 * | 0.169 | 0.129 | 0.110 | 0.226 * | |||
| DG18 | 0.562 ** | 0.479 ** | 0.572 ** | 0.314 ** | 0.001 | 0.321 ** | 0.140 | 0.002 | 0.084 | |||||
| Azole resistance | SAB | 0.478 ** | 0.638 ** | 0.289 ** | 0.079 | −0.023 | 0.388 ** | 0.070 | 0.182 | |||||
| ITR | 0.472 ** | 0.360 ** | 0.021 | 0.041 | 0.162 | −0.058 | −0.112 | |||||||
| VOR | 0.308 ** | 0.243 * | 0.090 | 0.375 ** | 0.133 | 0.171 | ||||||||
| POS | −0.182 | 0.163 | 0.079 | −0.062 | −0.132 | |||||||||
| Aspergillus sp. | Fungi | MEA | 0.068 | 0.010 | 0.360 ** | 0.189 | ||||||||
| DG18 | −0.083 | −0.025 | −0.027 | |||||||||||
| Azole resistance | SAB | 0.29 4 ** | −0.072 | |||||||||||
| VOR | 0.190 | |||||||||||||
Publisher’s Note: MDPI stays neutral with regard to jurisdictional claims in published maps and institutional affiliations. |
© 2021 by the authors. Licensee MDPI, Basel, Switzerland. This article is an open access article distributed under the terms and conditions of the Creative Commons Attribution (CC BY) license (https://creativecommons.org/licenses/by/4.0/).
Share and Cite
Viegas, C.; Pimenta, R.; Dias, M.; Gomes, B.; Brito, M.; Aranha Caetano, L.; Carolino, E.; Gomes, A.Q. Microbiological Contamination Assessment in Higher Education Institutes. Atmosphere 2021, 12, 1079. https://doi.org/10.3390/atmos12081079
Viegas C, Pimenta R, Dias M, Gomes B, Brito M, Aranha Caetano L, Carolino E, Gomes AQ. Microbiological Contamination Assessment in Higher Education Institutes. Atmosphere. 2021; 12(8):1079. https://doi.org/10.3390/atmos12081079
Chicago/Turabian StyleViegas, Carla, Raquel Pimenta, Marta Dias, Bianca Gomes, Miguel Brito, Liliana Aranha Caetano, Elisabete Carolino, and Anita Quintal Gomes. 2021. "Microbiological Contamination Assessment in Higher Education Institutes" Atmosphere 12, no. 8: 1079. https://doi.org/10.3390/atmos12081079