Article

Computer Simulations of Air Quality and Bio-Climatic Indices for the City of Sofia

National Institute of Geophysics, Geodesy and Geography—Bulgarian Academy of Sciences, Acad. G. Bonchev str., bl. 3 1113 Sofia, Bulgaria
*
Author to whom correspondence should be addressed.
Atmosphere 2021, 12(8), 1078; https://doi.org/10.3390/atmos12081078
Submission received: 15 June 2021 / Revised: 16 August 2021 / Accepted: 19 August 2021 / Published: 22 August 2021
(This article belongs to the Special Issue Urban Climate and Air Quality in Mediterranean Cities)

Abstract

:
Air pollution is responsible for many adverse effects on human beings. Thermal discomfort, on the other hand, is able to overload the human body and eventually provoke health implications due to the heat imbalance. Methods: The aim of the presented work is to study the behavior of two bio-climatic indices and statistical characteristics of the air quality index for Sofia city—the capital of Bulgaria for the period 2008–2014. The study is based on the WRF-CMAQ model system simulations with a spatial resolution of 1 km. The air quality is estimated by the air quality index, taking into account the influence of different pollutants and the thermal conditions by two indices, respectively, for hot and cold weather. It was found that the recurrence of both the heat and cold index categories and of the air quality categories have heterogeneous space distribution and well manifested diurnal and seasonal variability. For all of the situations, only O3 and PM10 are the dominant pollutants—these which determine the AQI category. It was found that AQI1, AQI2, and AQI3, which fall in the “Low” band, have the highest recurrence during the different seasons, up to more than 70% in some places and situations. The recurrence of AQI10 (very high) is rather small—no more than 5% and concentrated in small areas, mostly in the city center. The Heat index of category “Danger” never appears, and the Heat index of category “Extreme caution” appears only in the spring and summer with the highest recurrence of less than 5% in the city center. For the Wind-chill index category, “Very High Risk” never appears, and the category “High Risk” appears with a frequency of about 1–2%. The above leads to the conclusion that both from a point of view of bioclimatic and air quality indices, the human health risks in the city of Sofia are not as high.

1. Introduction

The air is the living environment of human beings, and obviously, a number of atmospheric parameters, have great importance for the quality of life and human health. Some of the most important groups of characteristics of the atmosphere directly affect quality of life and human health.
The air quality (AQ) is a key element for the well-being and quality of life of European citizens. According to the WHO, air pollution severely affects the health of European citizens [1] (between 2.5 and 11% of the total number of annual deaths are due to air pollution [2]). There is considerable concern about impaired and detrimental air quality conditions over many areas in Europe, especially in urbanized areas, in spite of about 30 years of legislation and emission reduction. Current legislation (e.g., ozone daughter directive 2002/3/EC and the recent directive 2008/50/EC for AQ and clean air for Europe [3,4]) requires informing the public on AQ, assessing air pollutant concentrations throughout the whole territory of Member States and indicating an exceedance of limit and target values, forecasting potential exceedance, and assessing possible emergency measures to abate exceedance using modelling tools.
Despite international—including European—agreements and protocols regarding different constituents of air pollutants (sulfur dioxides, nitrogen dioxides, organic compounds, heavy metals, etc.), decreasing pollution and accumulated knowledge have only a partial effect. The situation is especially severe regarding ozone in urban areas. The main reasons for this are the increased emissions of ozone precursors (basically nitrogen dioxide and organic compounds).
Special attention is paid to primary emitted or secondary formed particulate matter. They have the property to adsorb various chemical compounds on their surface, including some toxic substance (heavy metals, black carbon, and organic hydrocarbons), NH3, NOx and VOCs, mutagens, DNA modulators, etc., and interacting with them or catalyzing the processes taking place between these compounds, contribute to the formation of secondary atmospheric pollutants—other aerosol components that are difficult for quantitative determination. The particulate matter classification is based on aerodynamic diameters. Since 1990 began, the separation of particulates in several major fractions: PM10 (Particulate matter with a diameter < 10 μm), PM2.5 (Particulate matter with a diameter < 2.5 μm), and ultrafine particulate matter with a diameter < 0.1 μm (PM01). Particulate matters enter the body by the respiratory system and, depending on their size, are fractionalized in its different sections. The particles with a diameter below 2.5 μm reach pulmonary alveolus, where, along with the adsorbed compounds on their surface, they may fall in pulmonary macrophages, respectively, in the whole body, and generate harmful effects on human health. The established strong association between the increased incidence of respiratory, cardiovascular, and neoplastic diseases, the reduced life expectancy, and air pollution, on the other hand, define the latter as a significant public health issue. [5,6,7,8]. A number of studies conducted in Bulgaria also confirm the link between air pollution and human health, mostly in regions having serious environmental problems [9,10,11,12].
A number of parameters of the near-surface atmosphere (temperature, humidity, radiation, wind speed, pressure) jointly form an important bioclimatic characteristic of the habitable human environment. The condition when there is no strain on the human thermoregulatory system is called thermal comfort. When the air temperatures are high, the person should take additional precautions because of the emergence of dangerous health conditions as hyperthermia, cramps, sunburn, sunstroke, and even death [13]. Higher humidity could decrease or stop perspiration, and it is the main additional factor impeding the human thermoregulatory system from reaching balance. In cold weather, there is a possibility of hypothermia. In that case, the main additional factor for worsening the health conditions is the stronger wind, which increases the convection from the human body, hence its cooling. The temperature of the uncovered parts in particular, and eventually, the body’s core temperature decrease. A number of studies [14,15,16,17] present different methods for the calculation of the discomfort index and evaluating the role of thermal comfort on the quality of life and human health. More extensive reviews of the existing discomfort indices can be found in [18,19,20,21,22,23]
More sophisticated methods for the calculation of Discomfort Indices, taking into account additional factors, such as wind speed and solar radiation, are also available. Predicted Mean Vote—PMV [24] and Physiologic Equivalent Temperature—PET [25] are based on the human heat balance model [26,27,28,29,30]. These methods account for the total heat effect due to all the physical factors that affect the human body’s thermal sensation using the human heat balance equation. This equation uses, as an input, the ambient temperature, wind speed, relative humidity, and mean radiant body temperature under different man actions and clothes. For the purpose of our study, we choose two indexes—heat index [31,32,33] and wind chill index [34,35]. They are relatively simple, and do not require using many meteorological and physiological parameters that could be not readily available, and that add some uncertainty. They are numerical values in several intervals, called categories, each of which correspond to a different degree of deviation from comfort. They are used to study the extreme heat and cold conditions in Bulgaria from observations [36,37,38] and southwestern Europe from model simulations [39]. One of the aims of that research is to study the recurrence of the hot and cold conditions with different degrees of severity in the Sofia city region—the capital of Bulgaria—by two indices—heat index and wind chill.
It has been found that extremely high temperatures cause a bigger morbidity risk and higher mortality. Urban areas are especially at risk because the urban microclimate is relatively warmer than the surrounding non-urban environment, a phenomenon called “Urban heat island”.
The motivation of the present study is that Sofia is the largest city in Bulgaria with a large population and intensive urban transport and a large number of industrial and other sources of pollution; therefore, the study of the influence of atmospheric parameters on the quality of life in the city is of particular importance. Estimates of the AQI have been made before, but never with this resolution and they have never been combined with estimates of bioclimatic indices.
The objectives of the present study are to perform reliable, comprehensive, and detailed studies of the impact of lower atmosphere parameters and characteristics on the quality of life and health risks for the population in the city of Sofia by applying an appropriate and up to date methodology. Thus, the formulated study objectives contain several keywords, which have to be explained.
Methodology: This is the totality of metrics for the evaluation of the atmospheric parameters’ impact on the quality of life and health risks for the population; a set of properly chosen, well verified, and validated models of atmospheric dynamics and chemical composition; databases; and a set of appropriately defined scenarios for extensive computer simulation experiments.
Reliable and comprehensive studies: This means carrying out extensive and appropriately enough defined numerical experiments to form statistically significant ensembles of output data, which reflect the diversity of meteorological conditions with their typical recurrence and that allow reliable conclusions to be made for the atmospheric characteristics’ impact on population quality of life and health risks.
Detailed studies: This means a high enough spatial/temporal resolution of the computer simulations, which reflects the multi-scale nature of the processes. This makes it possible to detect the interactions of different scale phenomena and track the basic mechanisms and pathways through which low atmosphere characteristics are formed, respectively, that impact on population quality of life and health risks.

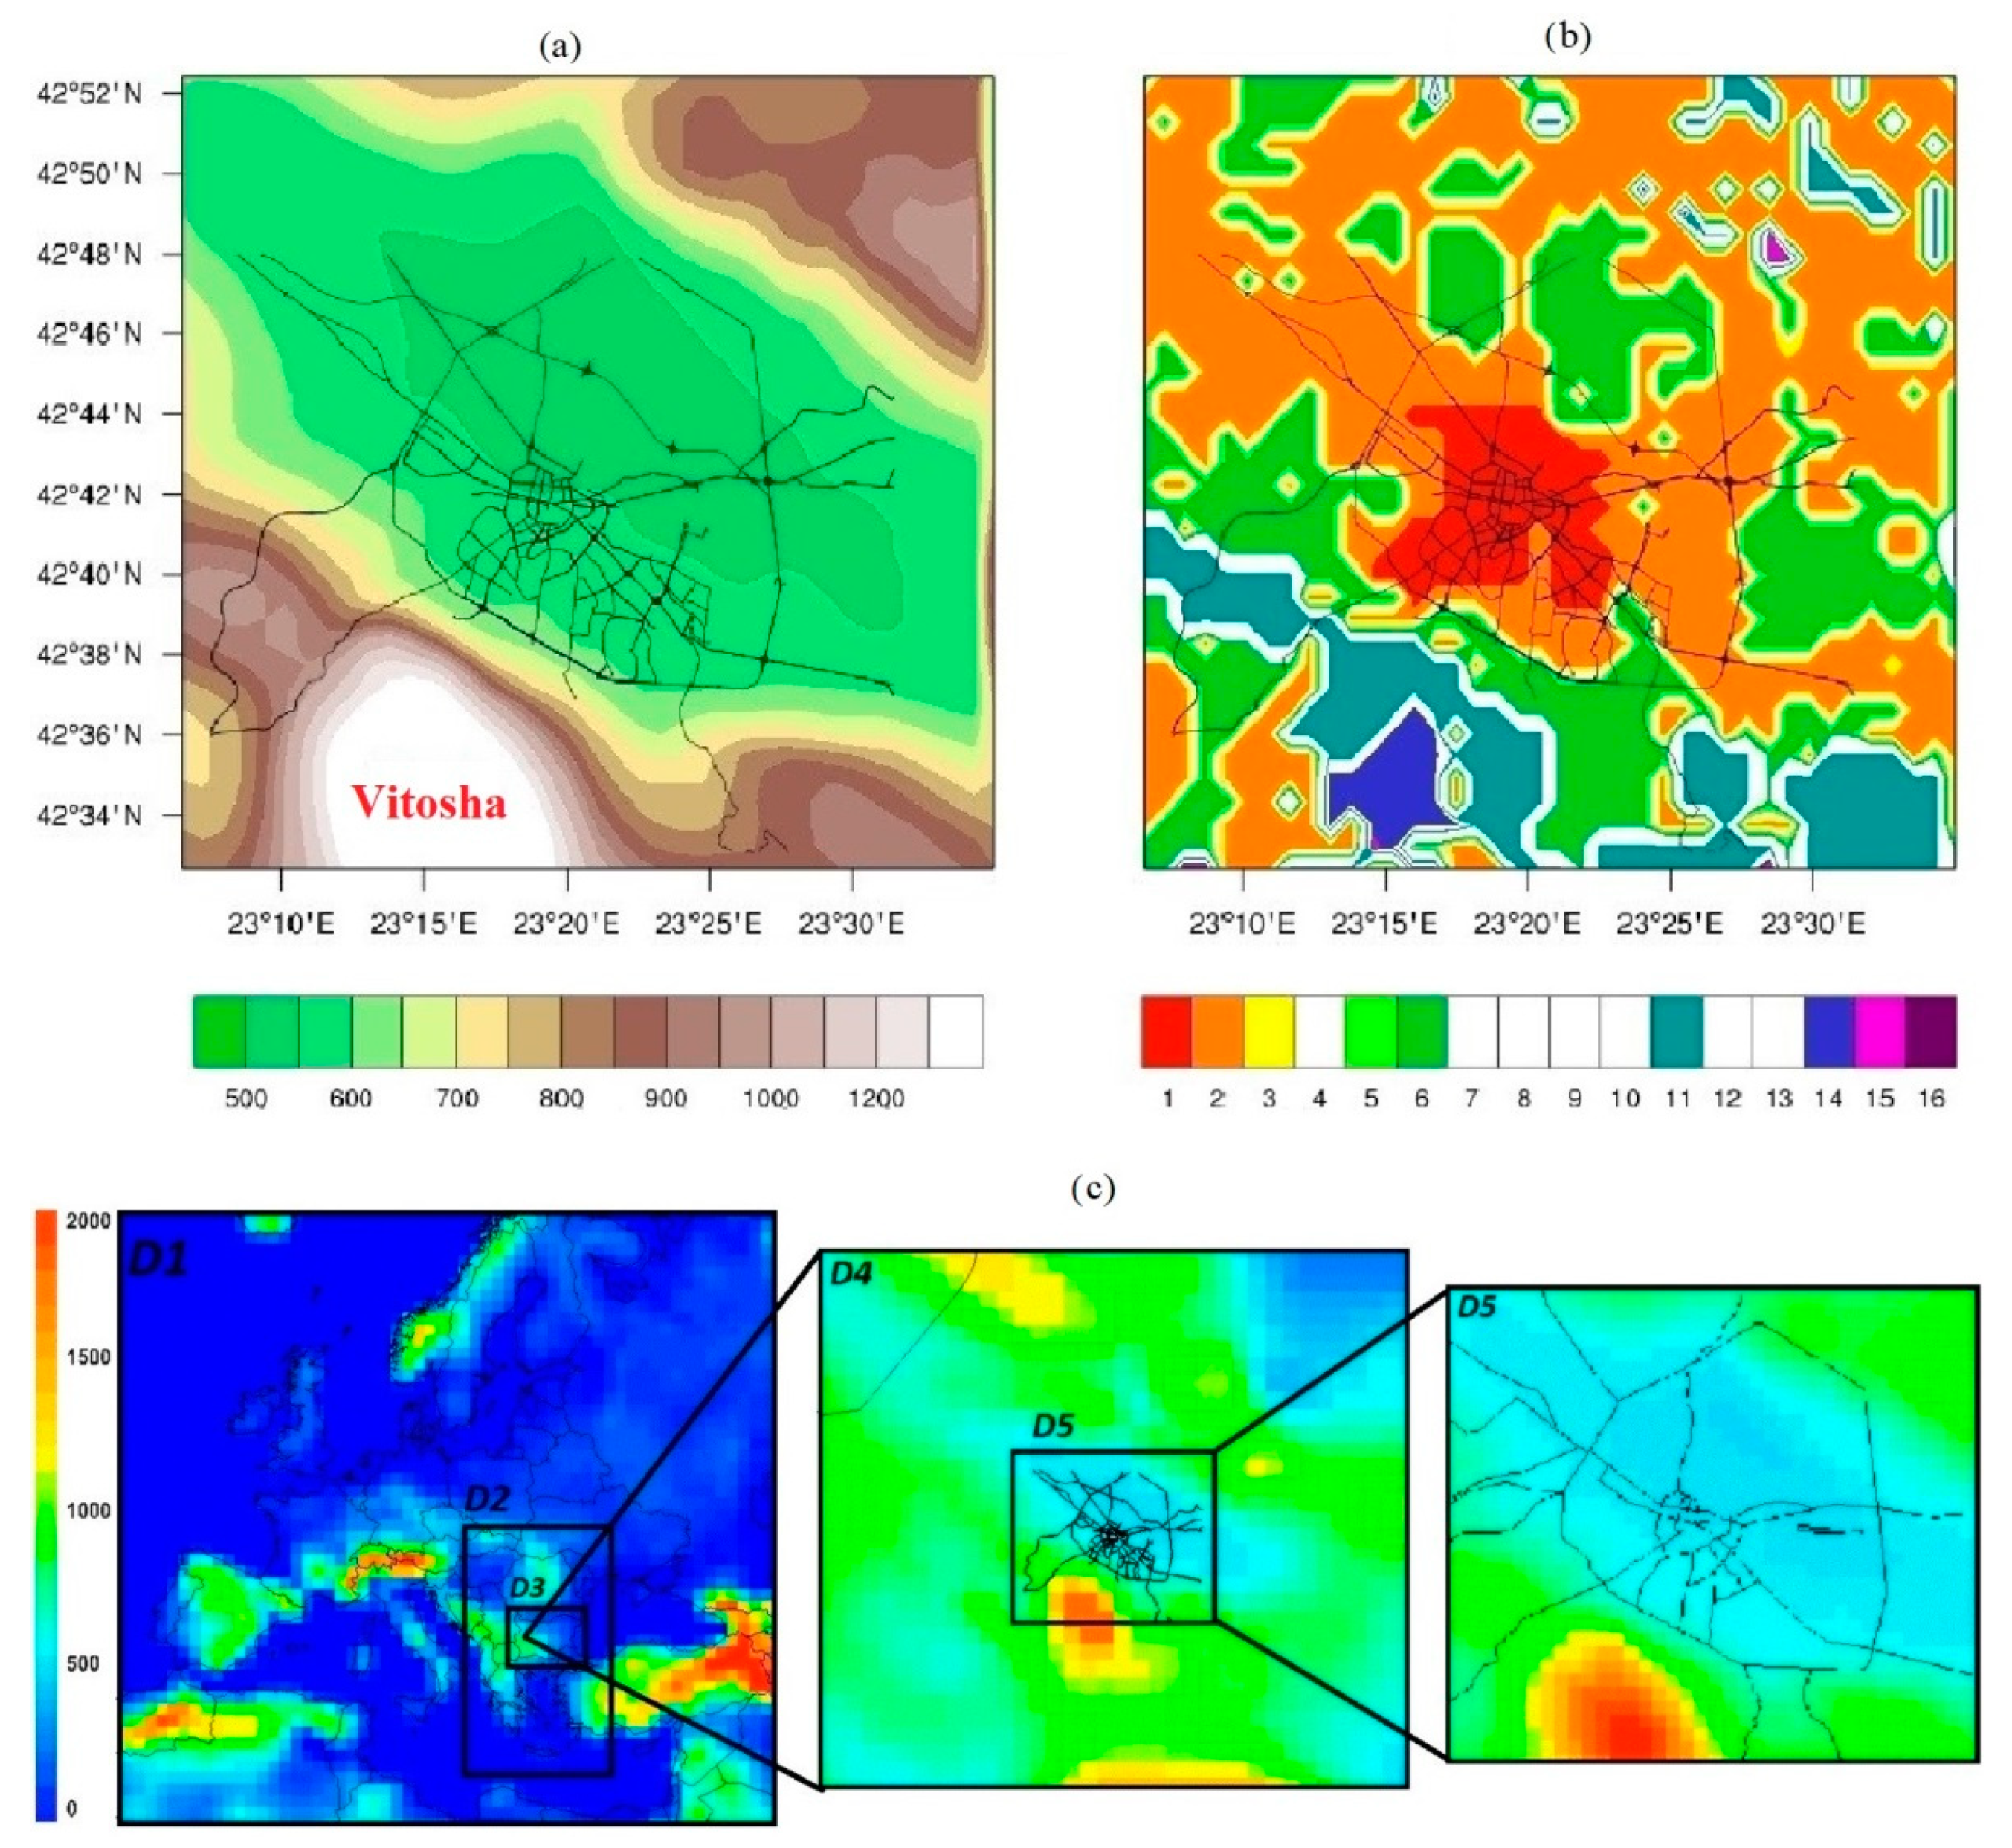
2. Materials and Methods

The AQI evaluations are based on extensive computer simulations of the AQ in Sofia, carried out with good resolution, using up-to-date modeling tools, and detailed and reliable input data [40,41,42,43,44,45,46,47,48,49].
All the simulations are based on the US EPA Model-3 system:
WRF v.3.4.1 [50]—Weather Research and Forecasting Model, used as a meteorological pre-processor. The large scale (background) meteorological data used in the present study are the NCEP global analysis data with 1° × 1° resolution—in Grib2 format every six hours [51]. The configuration set uses the WSM 6-class graupel microphysical parameterization scheme [52], and CAM schemes for parameterization of the longwave and shortwave radiation [53]. The land-surface parameterization scheme is Pleim-Xiu [54]. The planetary boundary layer parameterization scheme is ACM2 (Pleim) [55]. The model uses USGS 24-category land cover (Figure 1b), with one category describing the surface properties of urbanized areas.
CMAQ v.4.6—Community Multi-scale Air Quality model [56,57], the Chemical Transport Model (CTM).
SMOKE—the Sparse Matrix Operator Kernel Emissions Modelling System [58], the emission pre-processor of Models-3 system.
TNO inventory [59] is exploited for the territories outside Bulgaria in the mother CMAQs domain. For the Bulgarian domains, the National inventory, as provided by Bulgarian Executive Environmental Agency, is used.
The simulations are carried out for the following five nested domains: D1 (Europe)—81 × 81 km, D2 (Balkan peninsula)—27 × 27 km, D3 (Bulgaria)—9 × 9 km, D4 (Sofia municipality)—3 × 3 km, and D5 (Sofia city)—1 × 1 km (Figure 1c). WRF nesting capabilities are applied for downscaling the simulations to a 1-kilometer step for the innermost domain (Sofia). The simulations are performed with Two-Way Nesting mode on.
CMAQ meteorological input is created from the WRF output, exploiting the CMAQ meteorology-chemistry interface—MCIP, v3.6. CMAQ simulations were performed in D2, D3, D4, and D5 domains. The CMAQ pre-defined (default) concentration profiles are used as boundary conditions for (the coarsest domain) D2. The boundary conditions for the inner domains are determined through the nesting capabilities of CMAQ.
The validation of WRF model and the Models 3 system was previously performed. The validation of WRF is presented in [60] and the validation of the whole system in [61].
The WRF and CMAQ output are recorded each hour; therefore, all frequencies (recurrences) considered below are calculated on an hourly basis.
For calculation of the bio-climatic indices, we use the air temperature and relative humidity at 2- and 10-meter wind speed from numerical simulations of the bio-meteorological conditions with the WRF-ARW model for the Sofia city for the 2008–2014 period with a spatial resolution of 1000 m.
One of the most commonly used indices is the UK Daily Air Quality Index [62], also used in Bulgaria [40,41,42,63]. According to [63], 4 main pollutants—O3, NO2, SO2, and PM10—are used to calculate the AQI. The further considerations in the paper are made on the basis of long-term AQ simulations, which make it possible to reveal the climate of AQI spatial/temporal distribution and behavior. The AQI is defined in several segments, different for each considered pollutant. Different averaging periods are used for different pollutants. The breakpoints between index values are defined for each pollutant separately (Table 1). For each particular case, the concentration of each pollutant falls into one of the bands shown in Table 1. Thus, the AQI for each pollutant is determined. The overall AQI, which describes the impact of the ambient pollutant mix, is defined as the AQI for the pollutant with maximum value of the index.
Each of the AQI bands comes with advice for at-risk groups and the general population (Table 2). The reference levels and Health Descriptor used are based on health-protection-related limits, targets, or guideline values set by the EU, at a national or local level, or by the WHO [1].
The spatial and temporal behavior of the air quality index for the city of Sofia is defined as all simulations are presented as the sum of each index in each band—Low, Moderate, High, and Very High. The AQI from the “Low” band indicate the cleanest air. Therefore, high values of the recurrence of AQI from the “Low” band mean more hours with clean air. Small values of the recurrence of AQI from the “Low” band, respectively, mean more hours with not so clean air. In the other Moderate, High, and Very High categories, high values indicate more cases with polluted air, and low—more cases with clean air.
The heat index is defined as the temperature a human individual in a real environment would feel in a reference one having certain values of the effective wind speed (2.57 m/s, vapor pressure (1.6 kPa), and barometric pressure (101.3 kPa), as well as zero extra radiation and no clothing [32]. There are other indices such as Universal Thermal Climate Index and Physiological Equivalent Temperature, that allow the solar and terrestrial radiation, and other clothing and physiological parameters to be taken into consideration, but the dependence of the calculation on mean radiant temperature from diffuse radiation, and dependence on other types of parameters such as metabolic rate, bring an additional uncertainty in their calculation. Additionally, the heat index and wind chill index are used in forecasts in many countries including Switzerland, USA, Canada, and Bulgaria, and people became used to them by changing their behavior for adaptation, which, in turn, influences the potential for heat and cold stress. The heat index is composed of a multiple regression formula, valid in air temperatures of at least 26.6 °C and relative humidity above 40%. The results of the heat index (HI) are split for the spring, summer, and autumn, because of the possibility of hot conditions even in the transition seasons. It is in temperature units. It is calculated and presented in categories shown in Table 3. Due to their low recurrence, the Danger and Extreme Danger conditions are combined in one category—Danger. It is calculated according to [31,32,33] with the following regression formula:
HI = − 42.379 + 2.04901523 ∗ T + 10.14333127 ∗ RH − 0.22475541 ∗ T ∗ RH
− 0.00683783 ∗ T2 − 0.05481717 ∗ RH2 + 0.00122874 ∗ T2 ∗ RH
+ 0.00085282 ∗ T ∗ RH2 − 0.00000199 ∗ T2 ∗ RH2
where temperature and heat index are in °F, and the RH is in %. As Fahrenheit scale is not very popular in Bulgaria, all the temperature values are converted to degree C.
If the air temperature is below 26.6 °C and the relative humidity is below 40%, we use the air temperature as a heat index. The wind chill index [34] is studied for winter, spring, and autumn because these are the times when it is possible for these categories to be observed. It is reported in temperature units and is used as a wind chill temperature (WCT) with categories given in Table 4 [35]. The categories Very High Risk, Severe Risk, and Extreme Risk are combined in one category—“Very High Risk”, for the same reasons as in for the Danger and Extreme Danger heat index.
The wind chill index is defined in temperatures lower than or equal to 4.4 °C and wind speeds of at least 1.34 m/s. The wind chill index is calculated with the following formula [34]:
WCT = 13.12 + 0.6215 ∗ Tα − 11.37 ∗ V 0.16 + 0.3965 ∗ Tα ∗ V 0.16
where Ta is the air temperatures in °C, and V is the wind speed in km/h. It is valid for temperatures below 4.4 °C (40 °F) and a wind speed equal to or above 1.34 m/s (3 mph). If the values of the air temperature and wind speed are outside the valid intervals, we accept that the WCT is equal to the air temperature.

3. Results

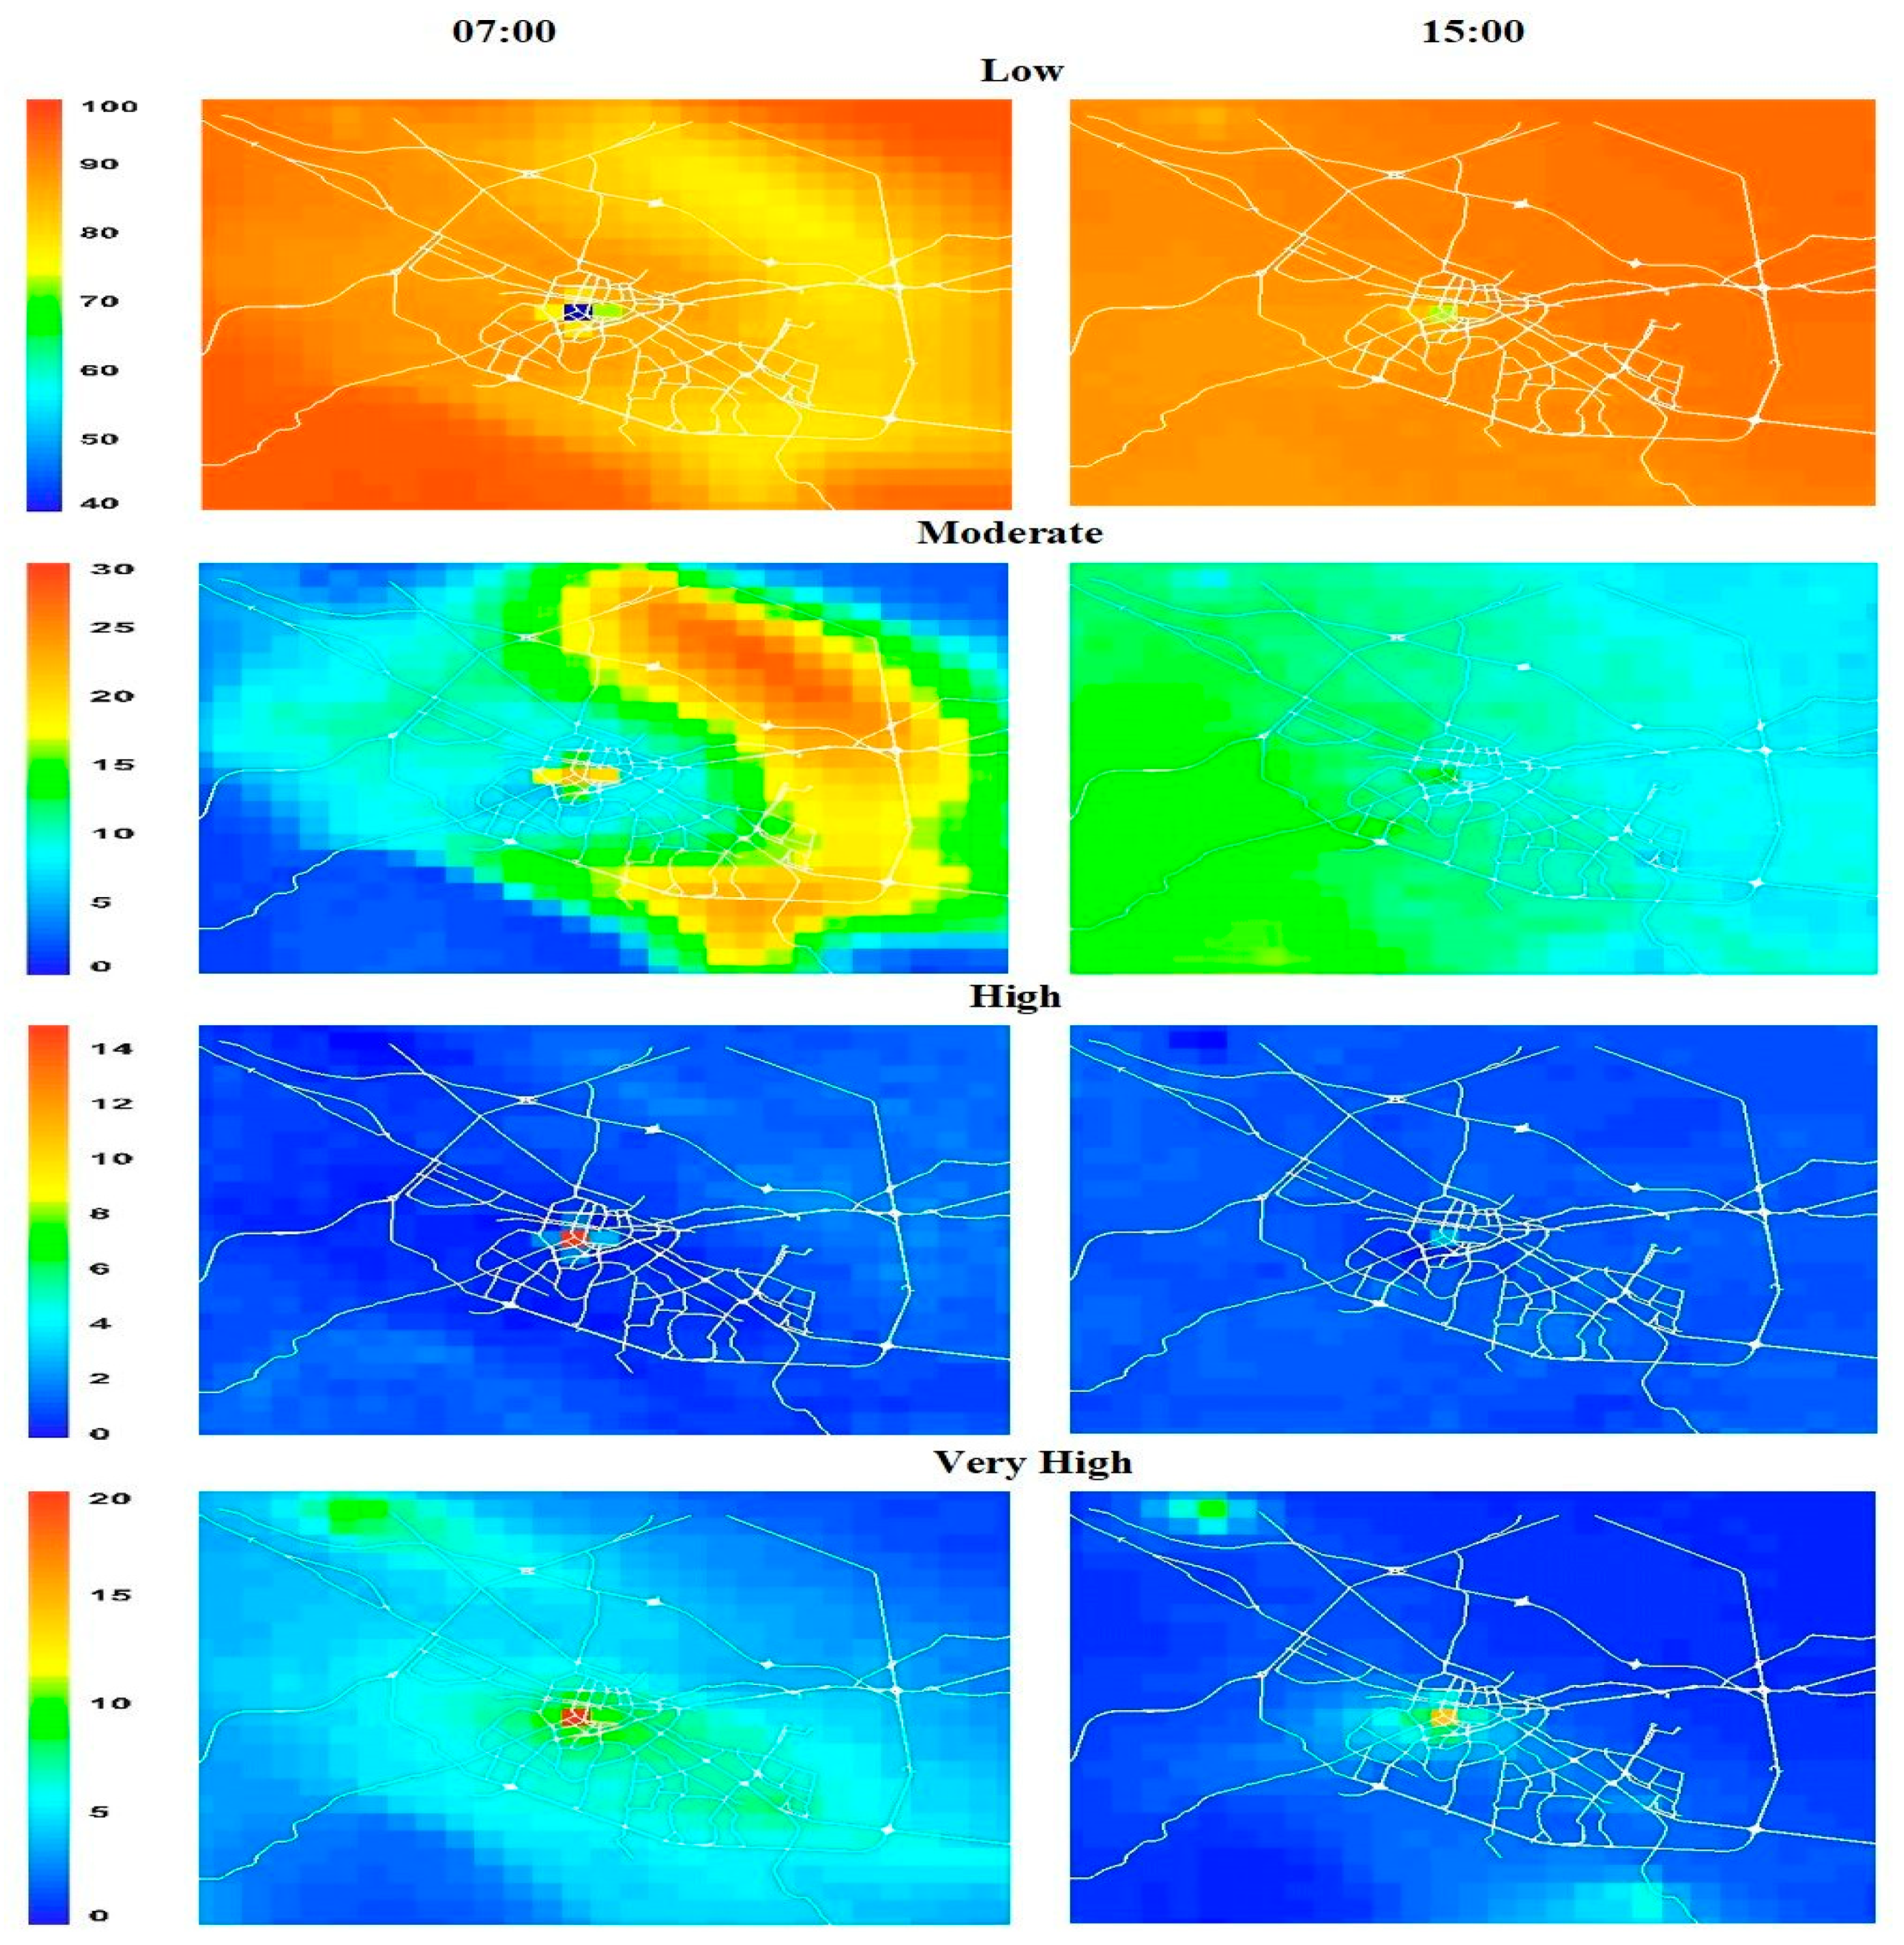
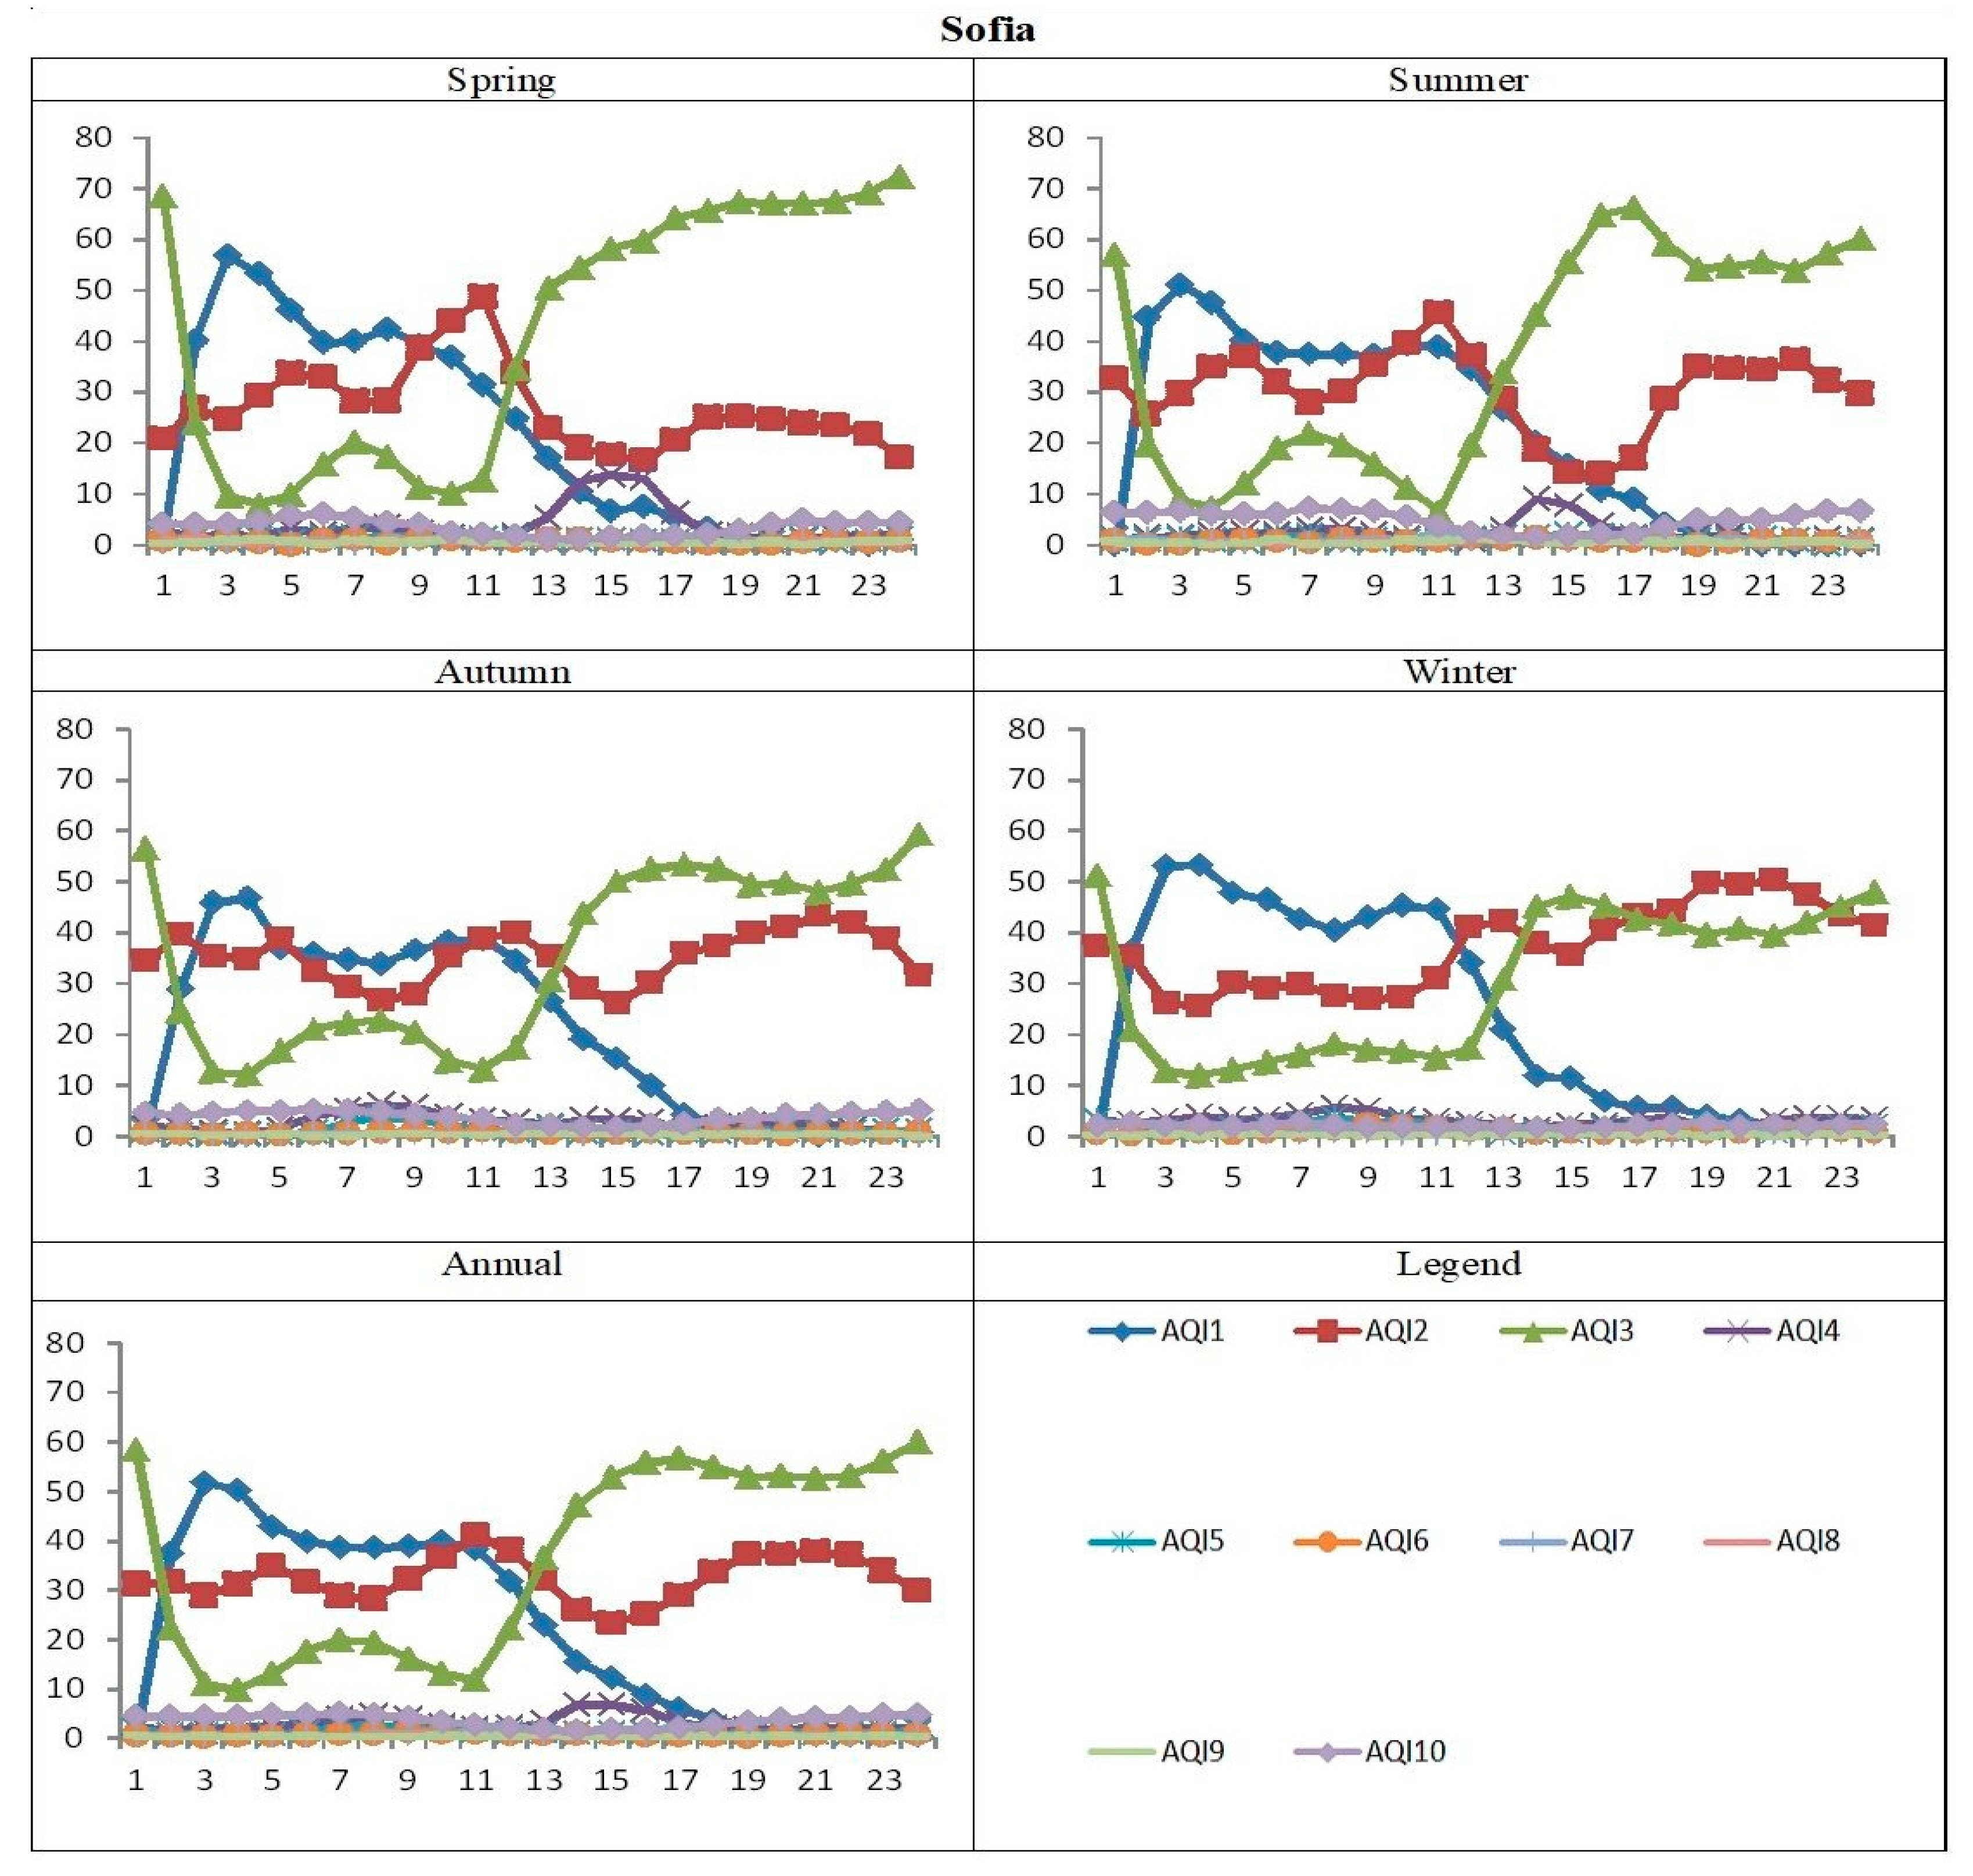
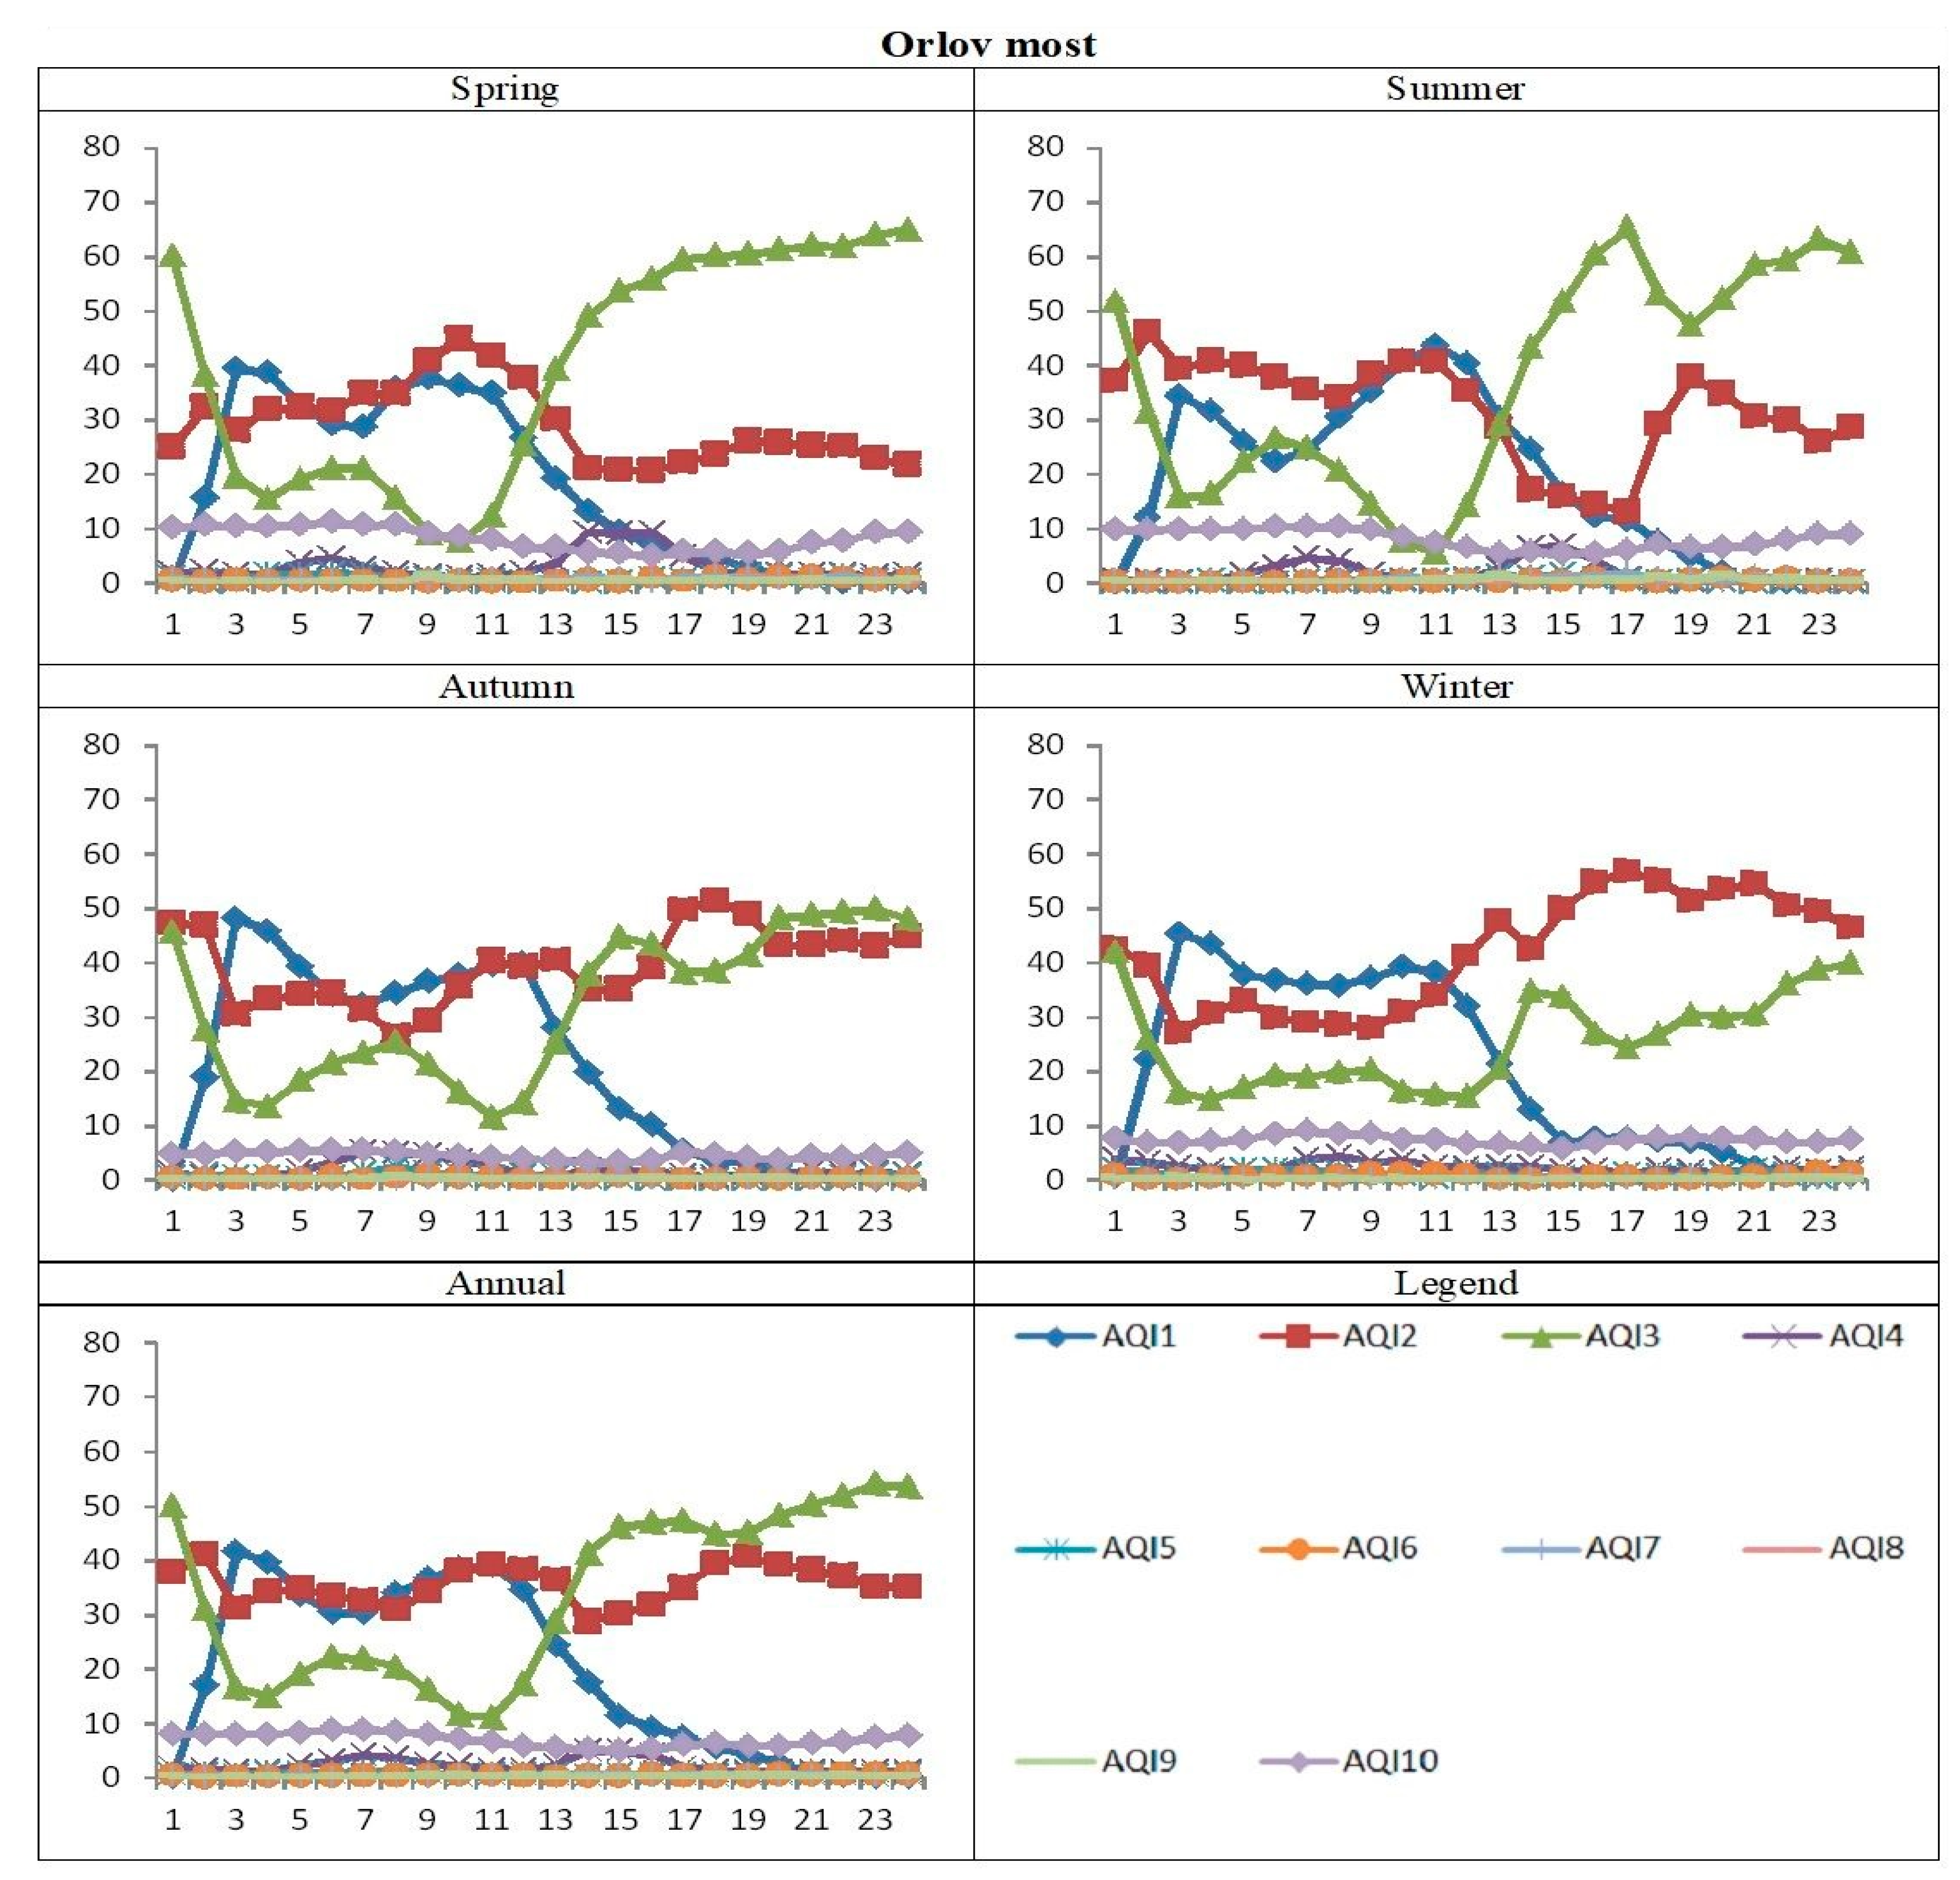
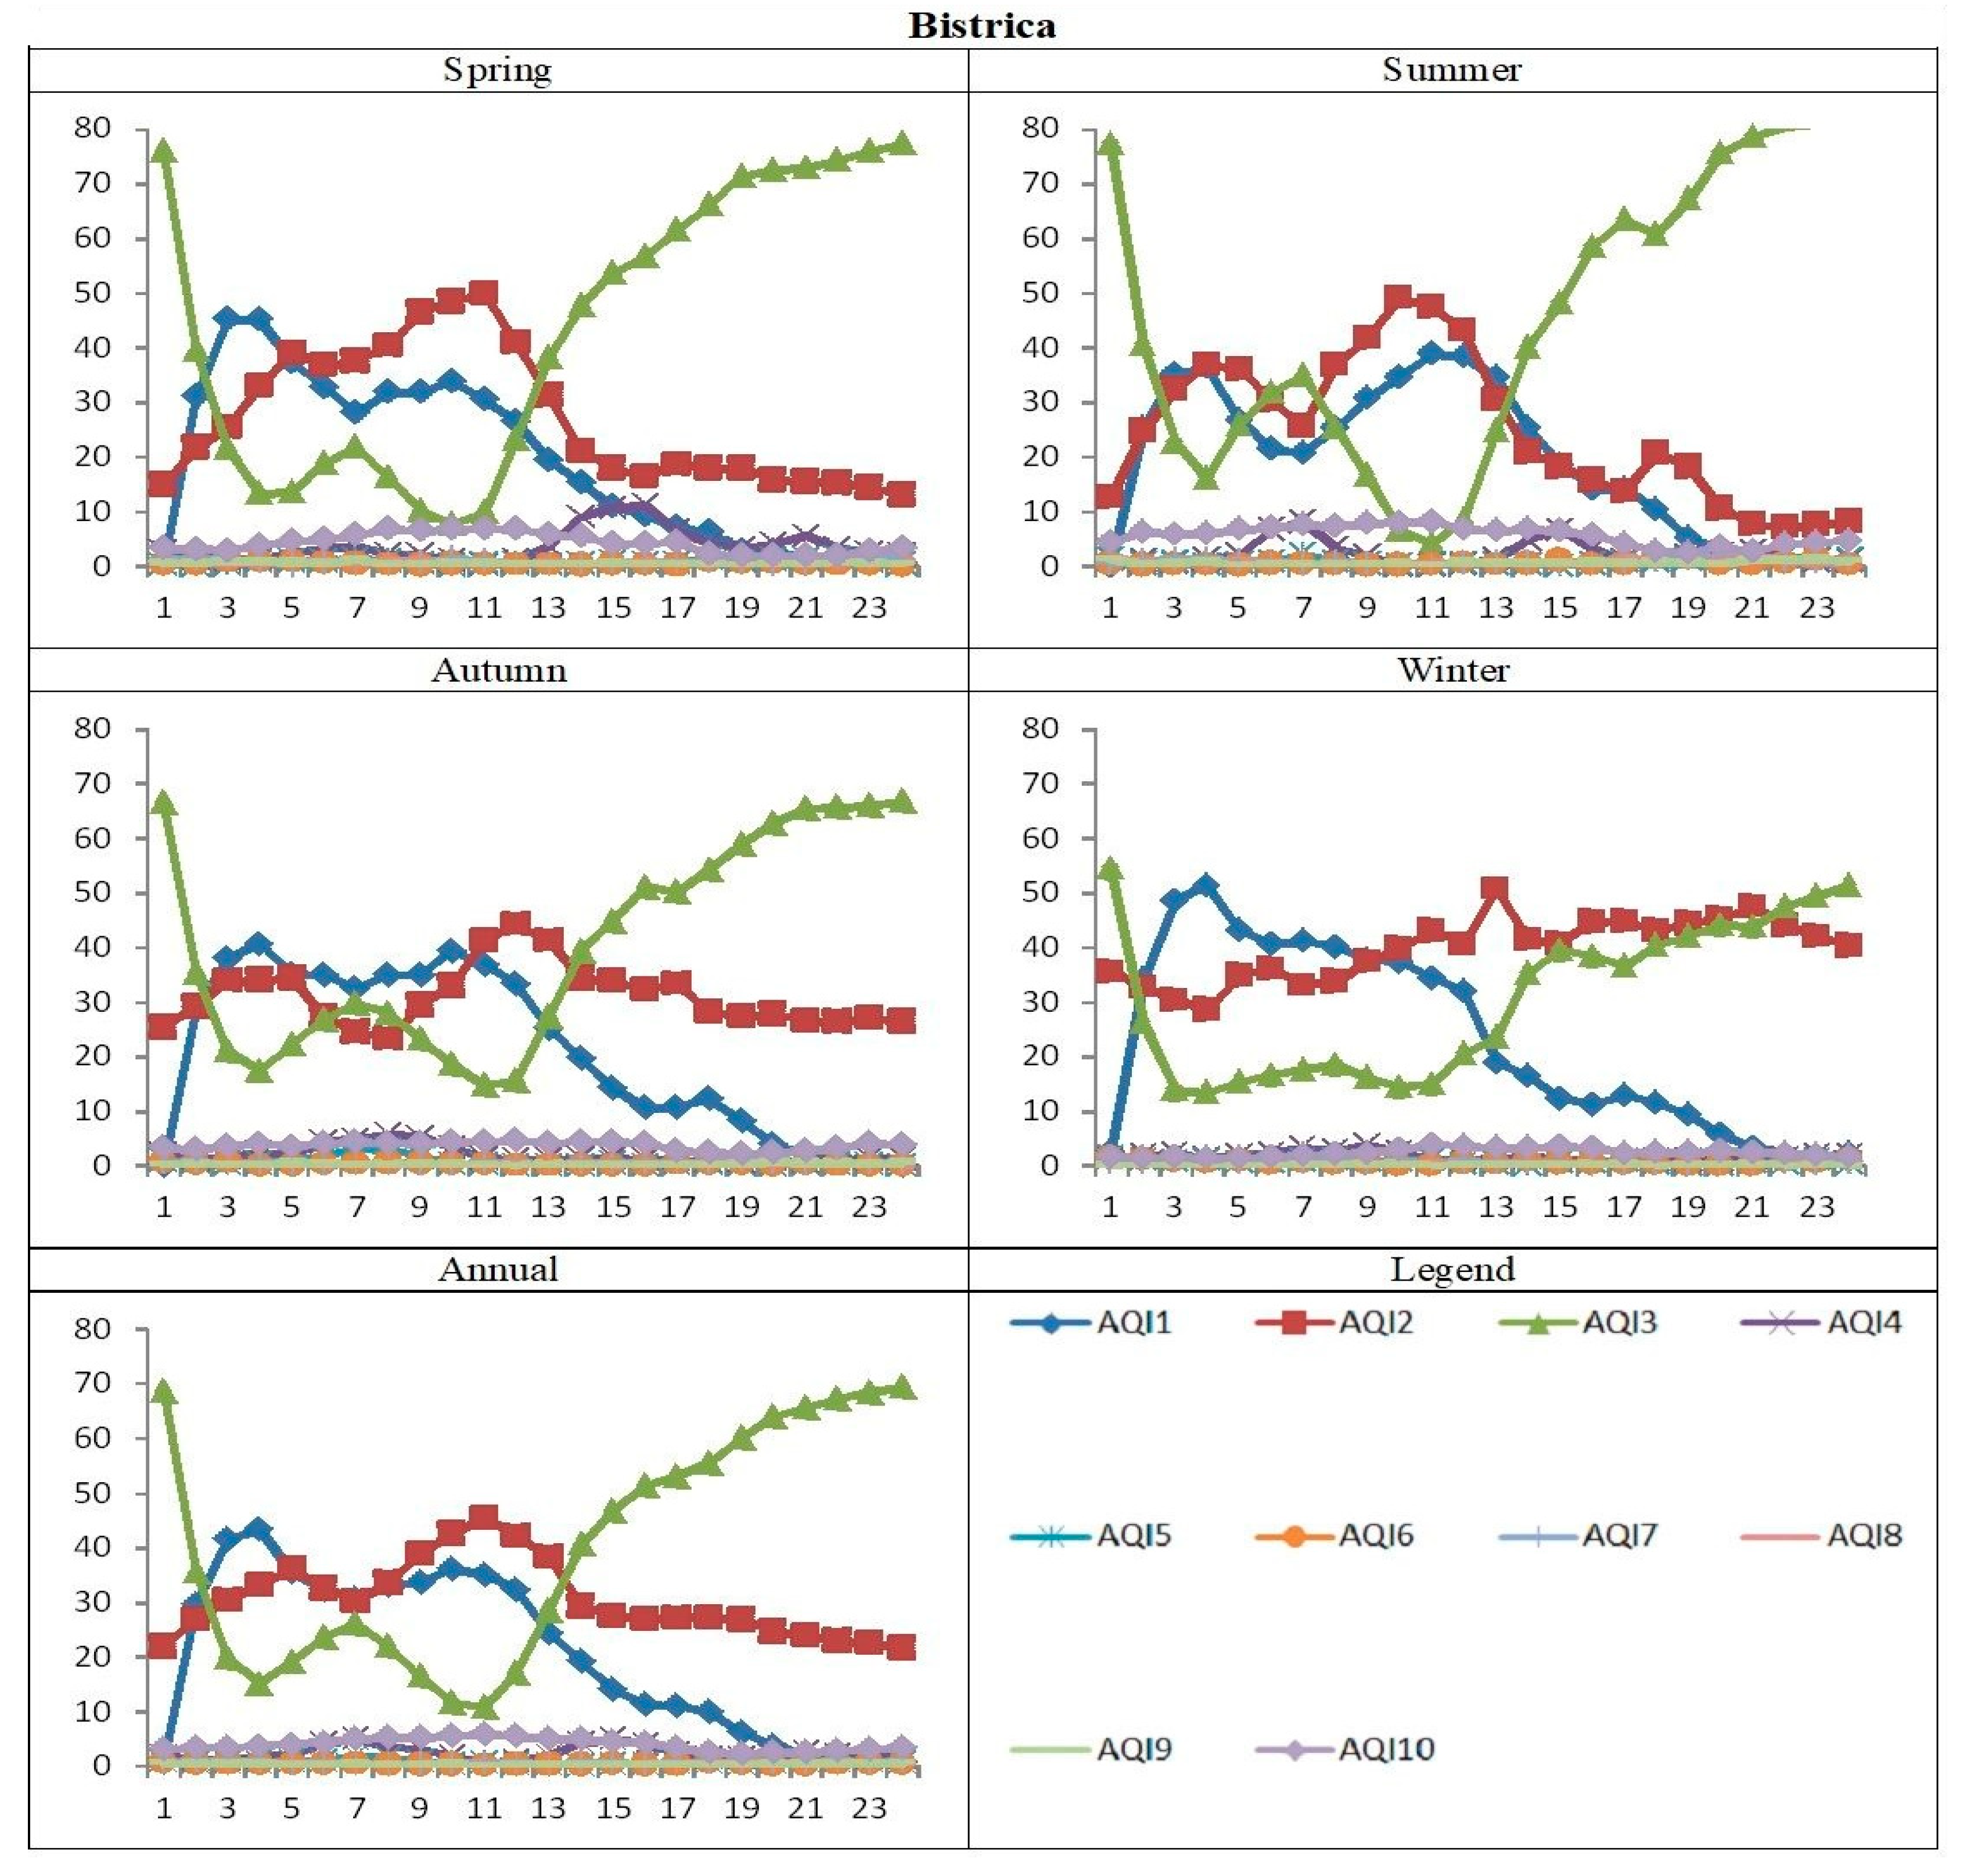
3.1. Air Quality Indices

The annually averaged fields of recurrence of days with a certain air quality index are presented in Figure 2. In the “Low” category, the areas with a low air quality status are mainly the city’s ring road and busier transport routes, as well as the central parts, and they occur most in the morning hours. It is also observed in the “Moderate” band, early in the morning, with about a 20–30% recurrence of days with polluted air. In the afternoon in this category, there is pollution over Vitosha Mountain, which is probably due to the turbulent transport of ozone from higher levels in a turbulent atmosphere. The ozone in Bulgaria is largely due to transport from abroad [64]. This is one of the reasons, together with the ozone photochemistry reactions, why the ozone concentrations early in the morning are smaller than at noon (less intensive transport from higher levels) [40,41,42].
The graphs present the diurnal course and seasonal distribution of the average recurrences (in %) for the different pollution indices (from 1 to 10) for the territory of Sofia (Figure 3), as well as for different selected points of the city—Orlov Most (the city center) and Bistrica (a village in the surroundings of Sofia) (Figure 4 and Figure 5).
Figure 3 shows that the indices AQI1, AQI2, and AQI3, which fall in the “Low” band, have the highest recurrence during the different seasons. The diurnal course of these indices is well defined. In the morning, AQI1 and AQI2 have a recurrence of about 40–50%, and, at that time, AQI3 has a minimum recurrence. In the spring and summer, in the afternoon, AQI4 has a peak with a recurrence of about 10%. In all the seasons, the other indices have an insignificant recurrence with about 5% repeatability.
Figure 4 for the Orlov Most point shows that the indices AQI1, AQI2, and AQI3, which fall in the “Low” interval, have the greatest recurrence during the different seasons. The diurnal course of these indices is well defined. In the morning, AQI1 and AQI2 have a recurrence of about 40%, and in the afternoon, it drops to about 20%. At this time, AQI3 has a minimum recurrence in the morning and a maximum in the afternoon of about 50%. AQI4 has an afternoon maximum of about 10% in the spring and summer. In all the seasons, AQI10 stands out, which corresponds to the “Very High” category and, for this point, has a high repeatability of about 10%.
Figure 5, for the Bistritsa point, shows that the indices AQI1, AQI2, and AQI3, which fall in the “Low” interval, have the greatest recurrence during the different seasons. The diurnal course of these indices is well defined. In the morning, AQI1 and AQI2 have a recurrence of about 40%, and in the afternoon, it drops to about 20% during the warm months and back distribution during the cold months. At this time, AQI3 has a minimum recurrence in the morning and a maximum in the afternoon of about 50%. AQI4 has an afternoon high of about 10% in the spring. In all the seasons, AQI10 stands out, which corresponds to the “Very High” category and, for this point, has a recurrence of about 5% in the morning in all the seasons.
The diurnal and seasonal variability of the AQI is obviously due to both diurnal and seasonal changes of traffic and heating, as well as of the boundary layer dynamics (see for example [65]).

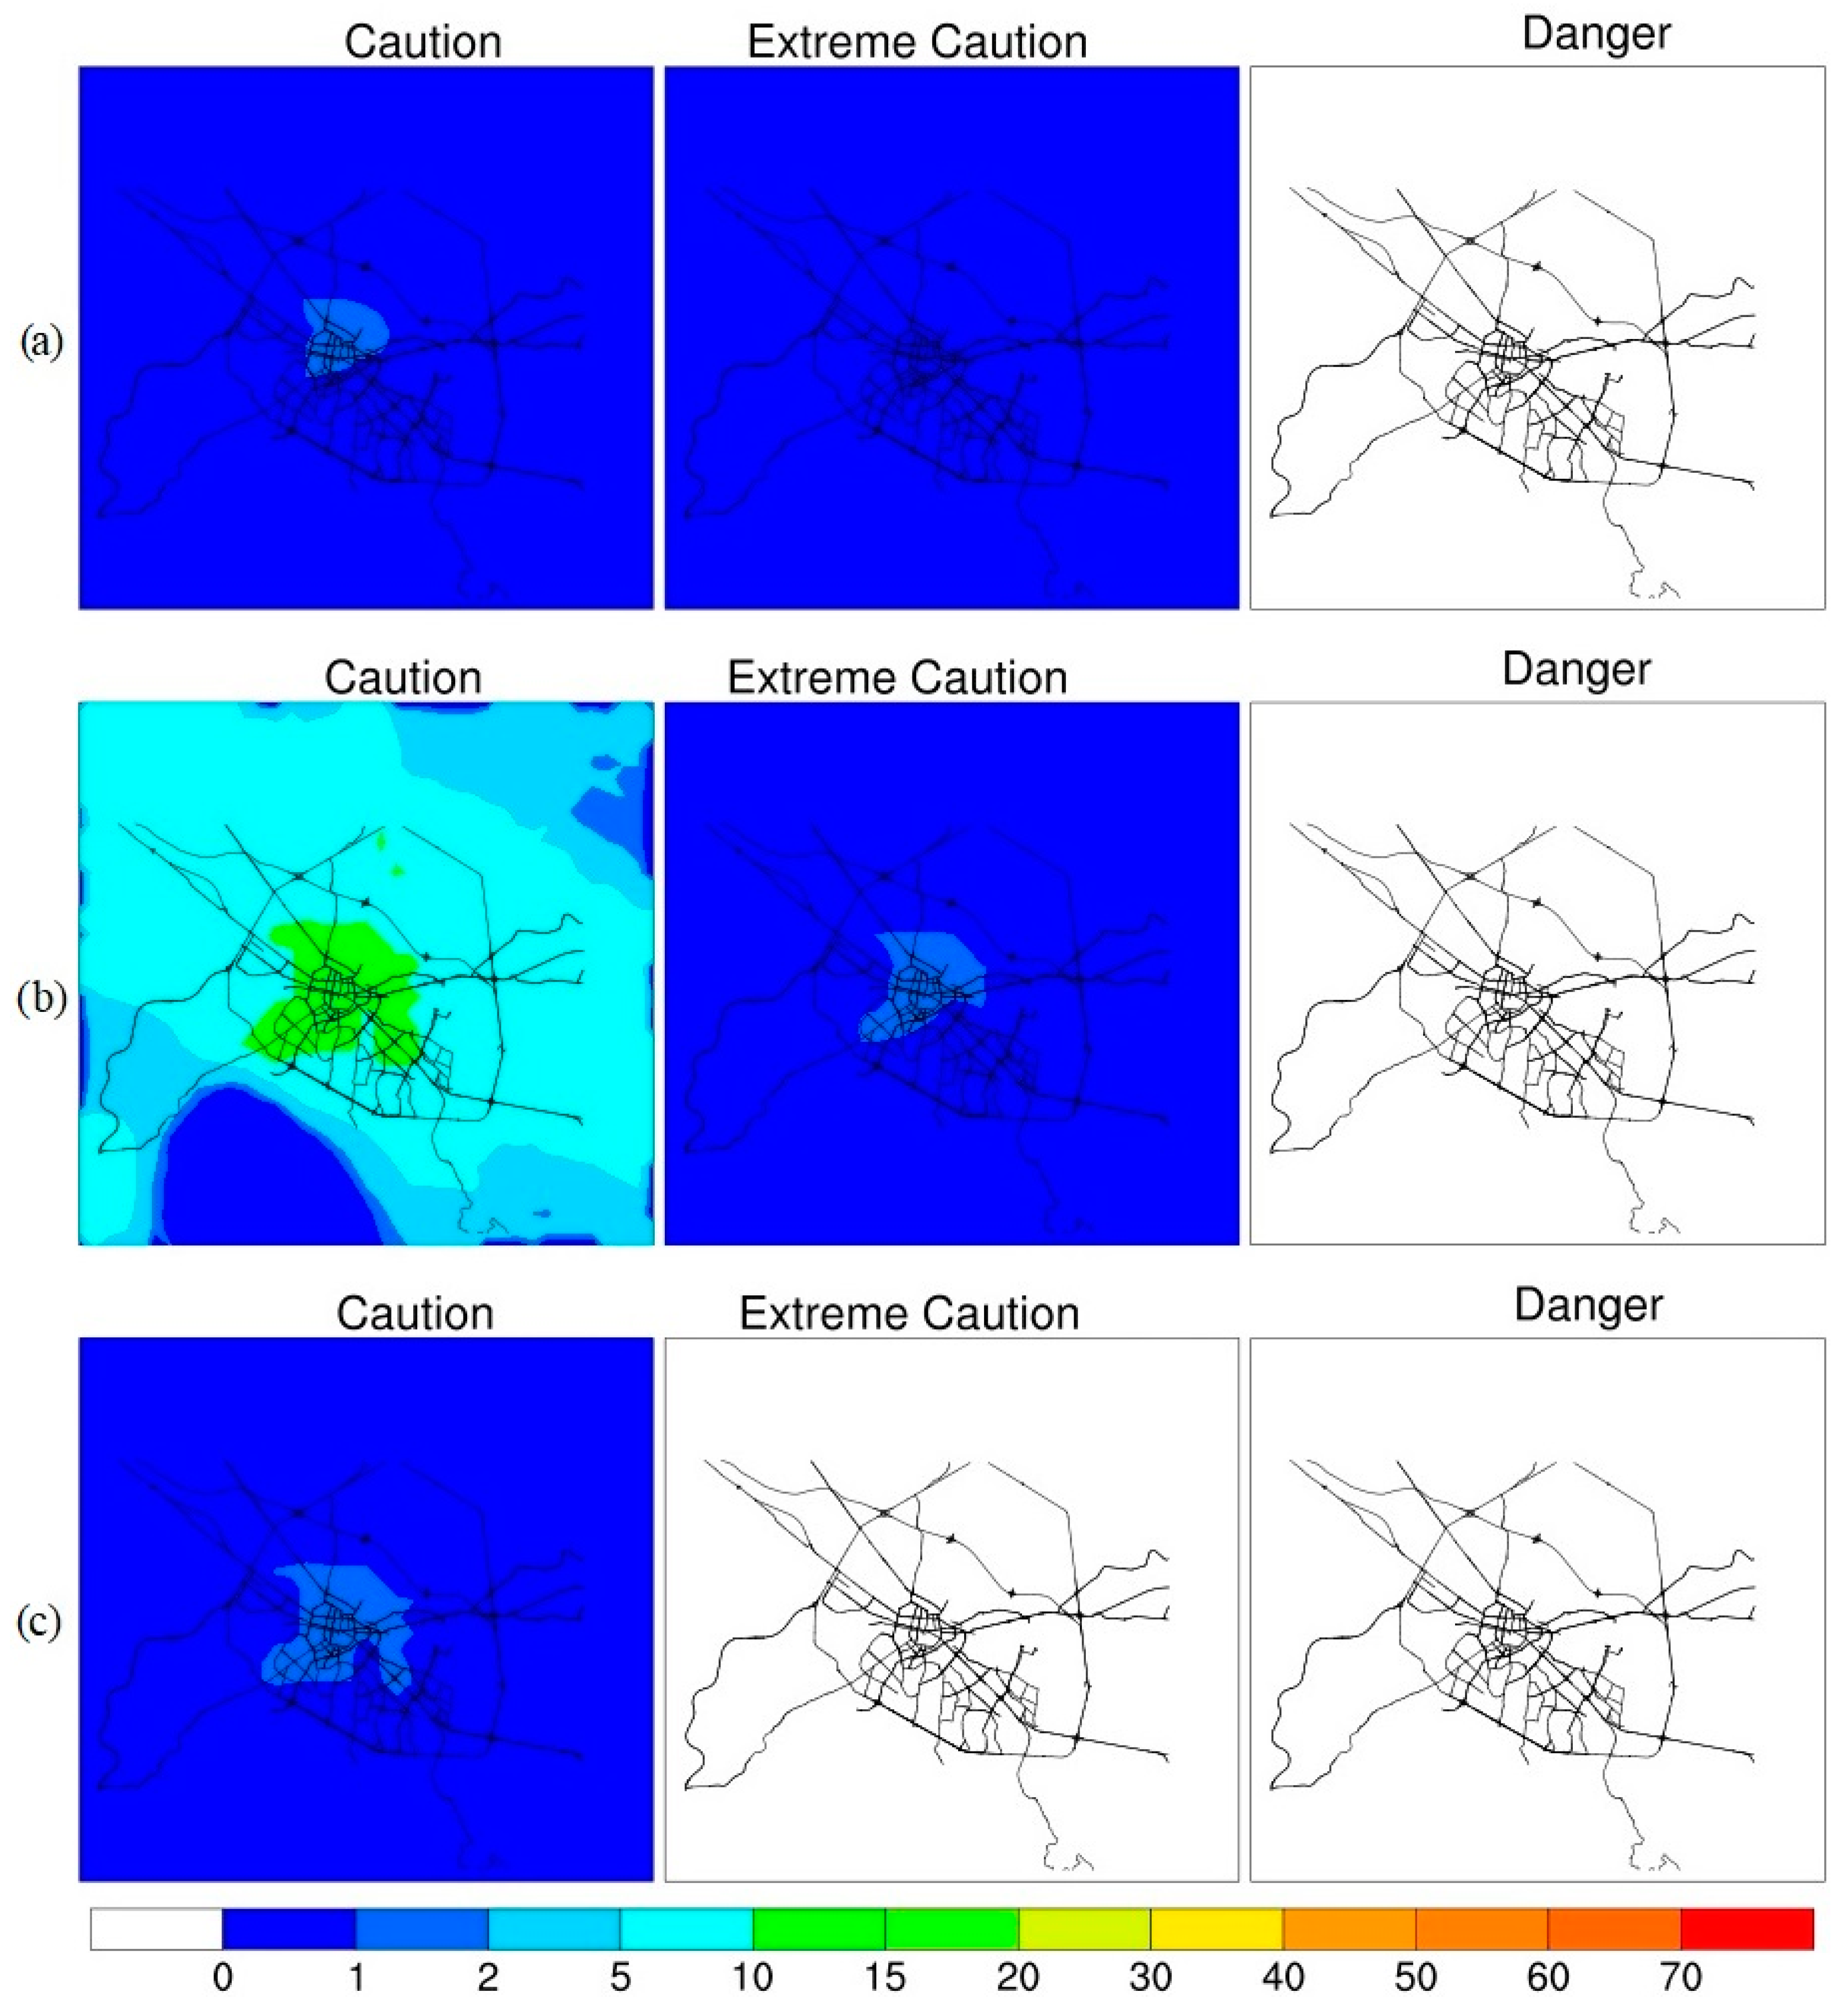
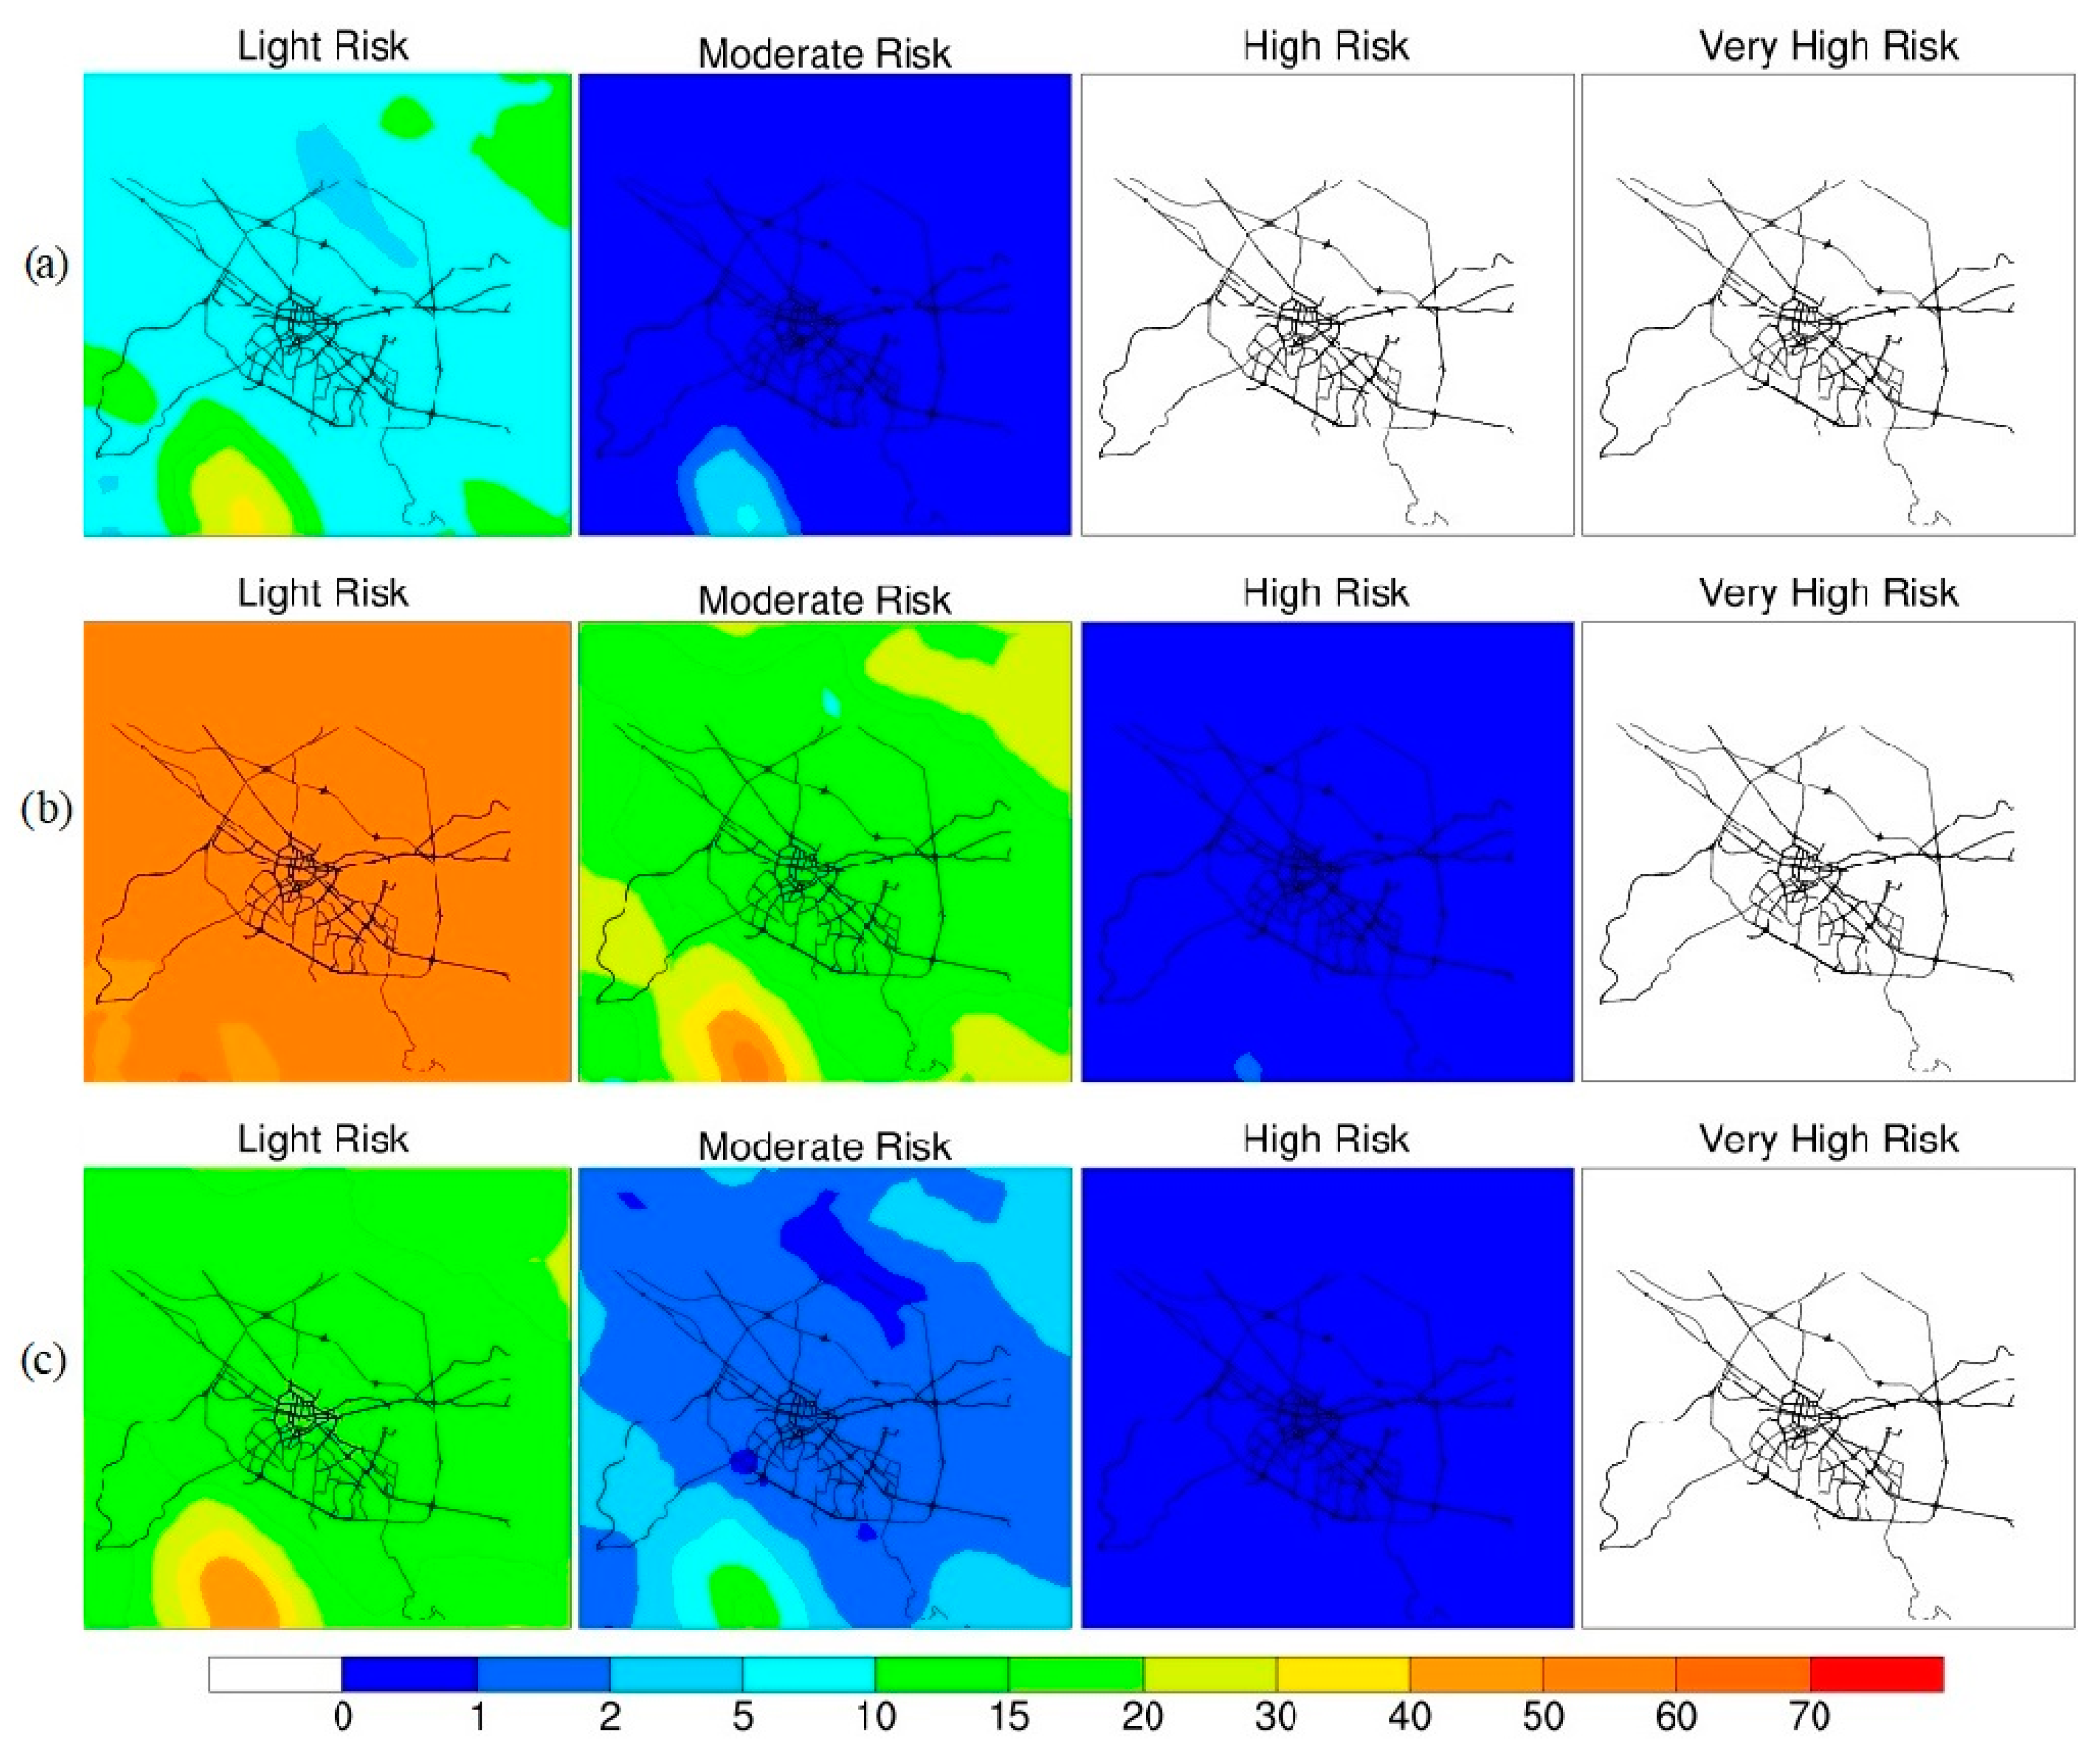
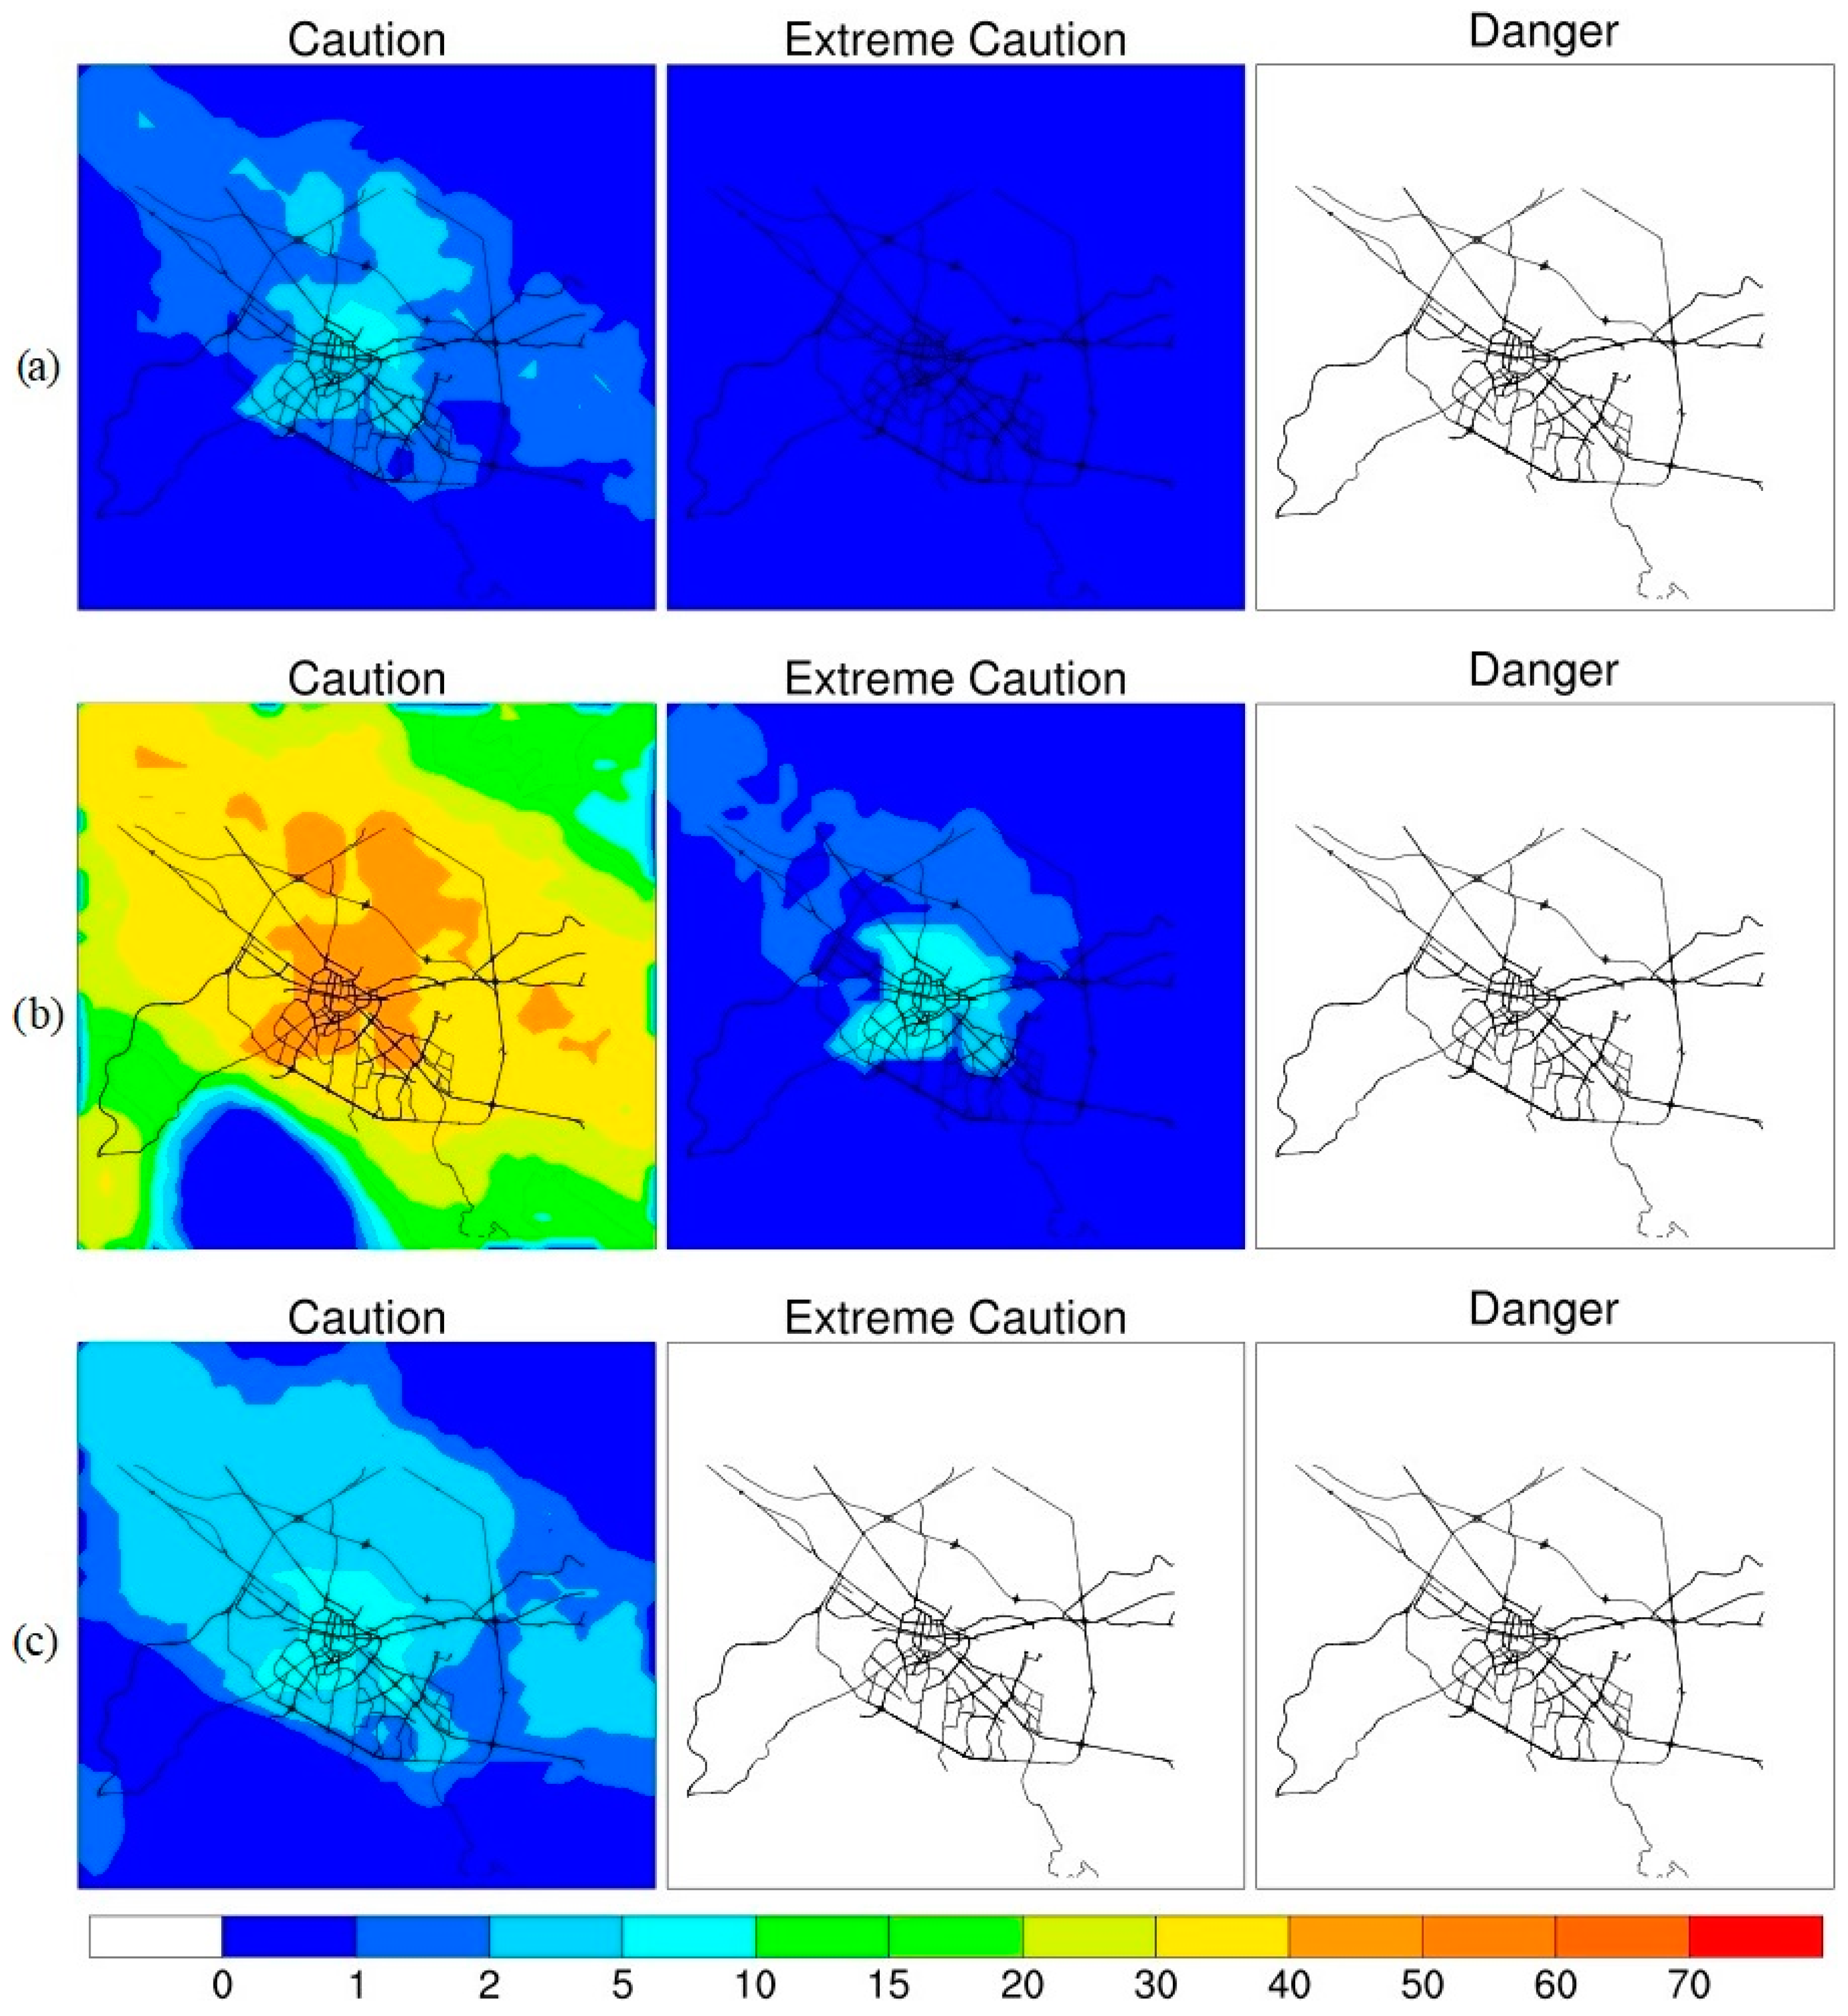
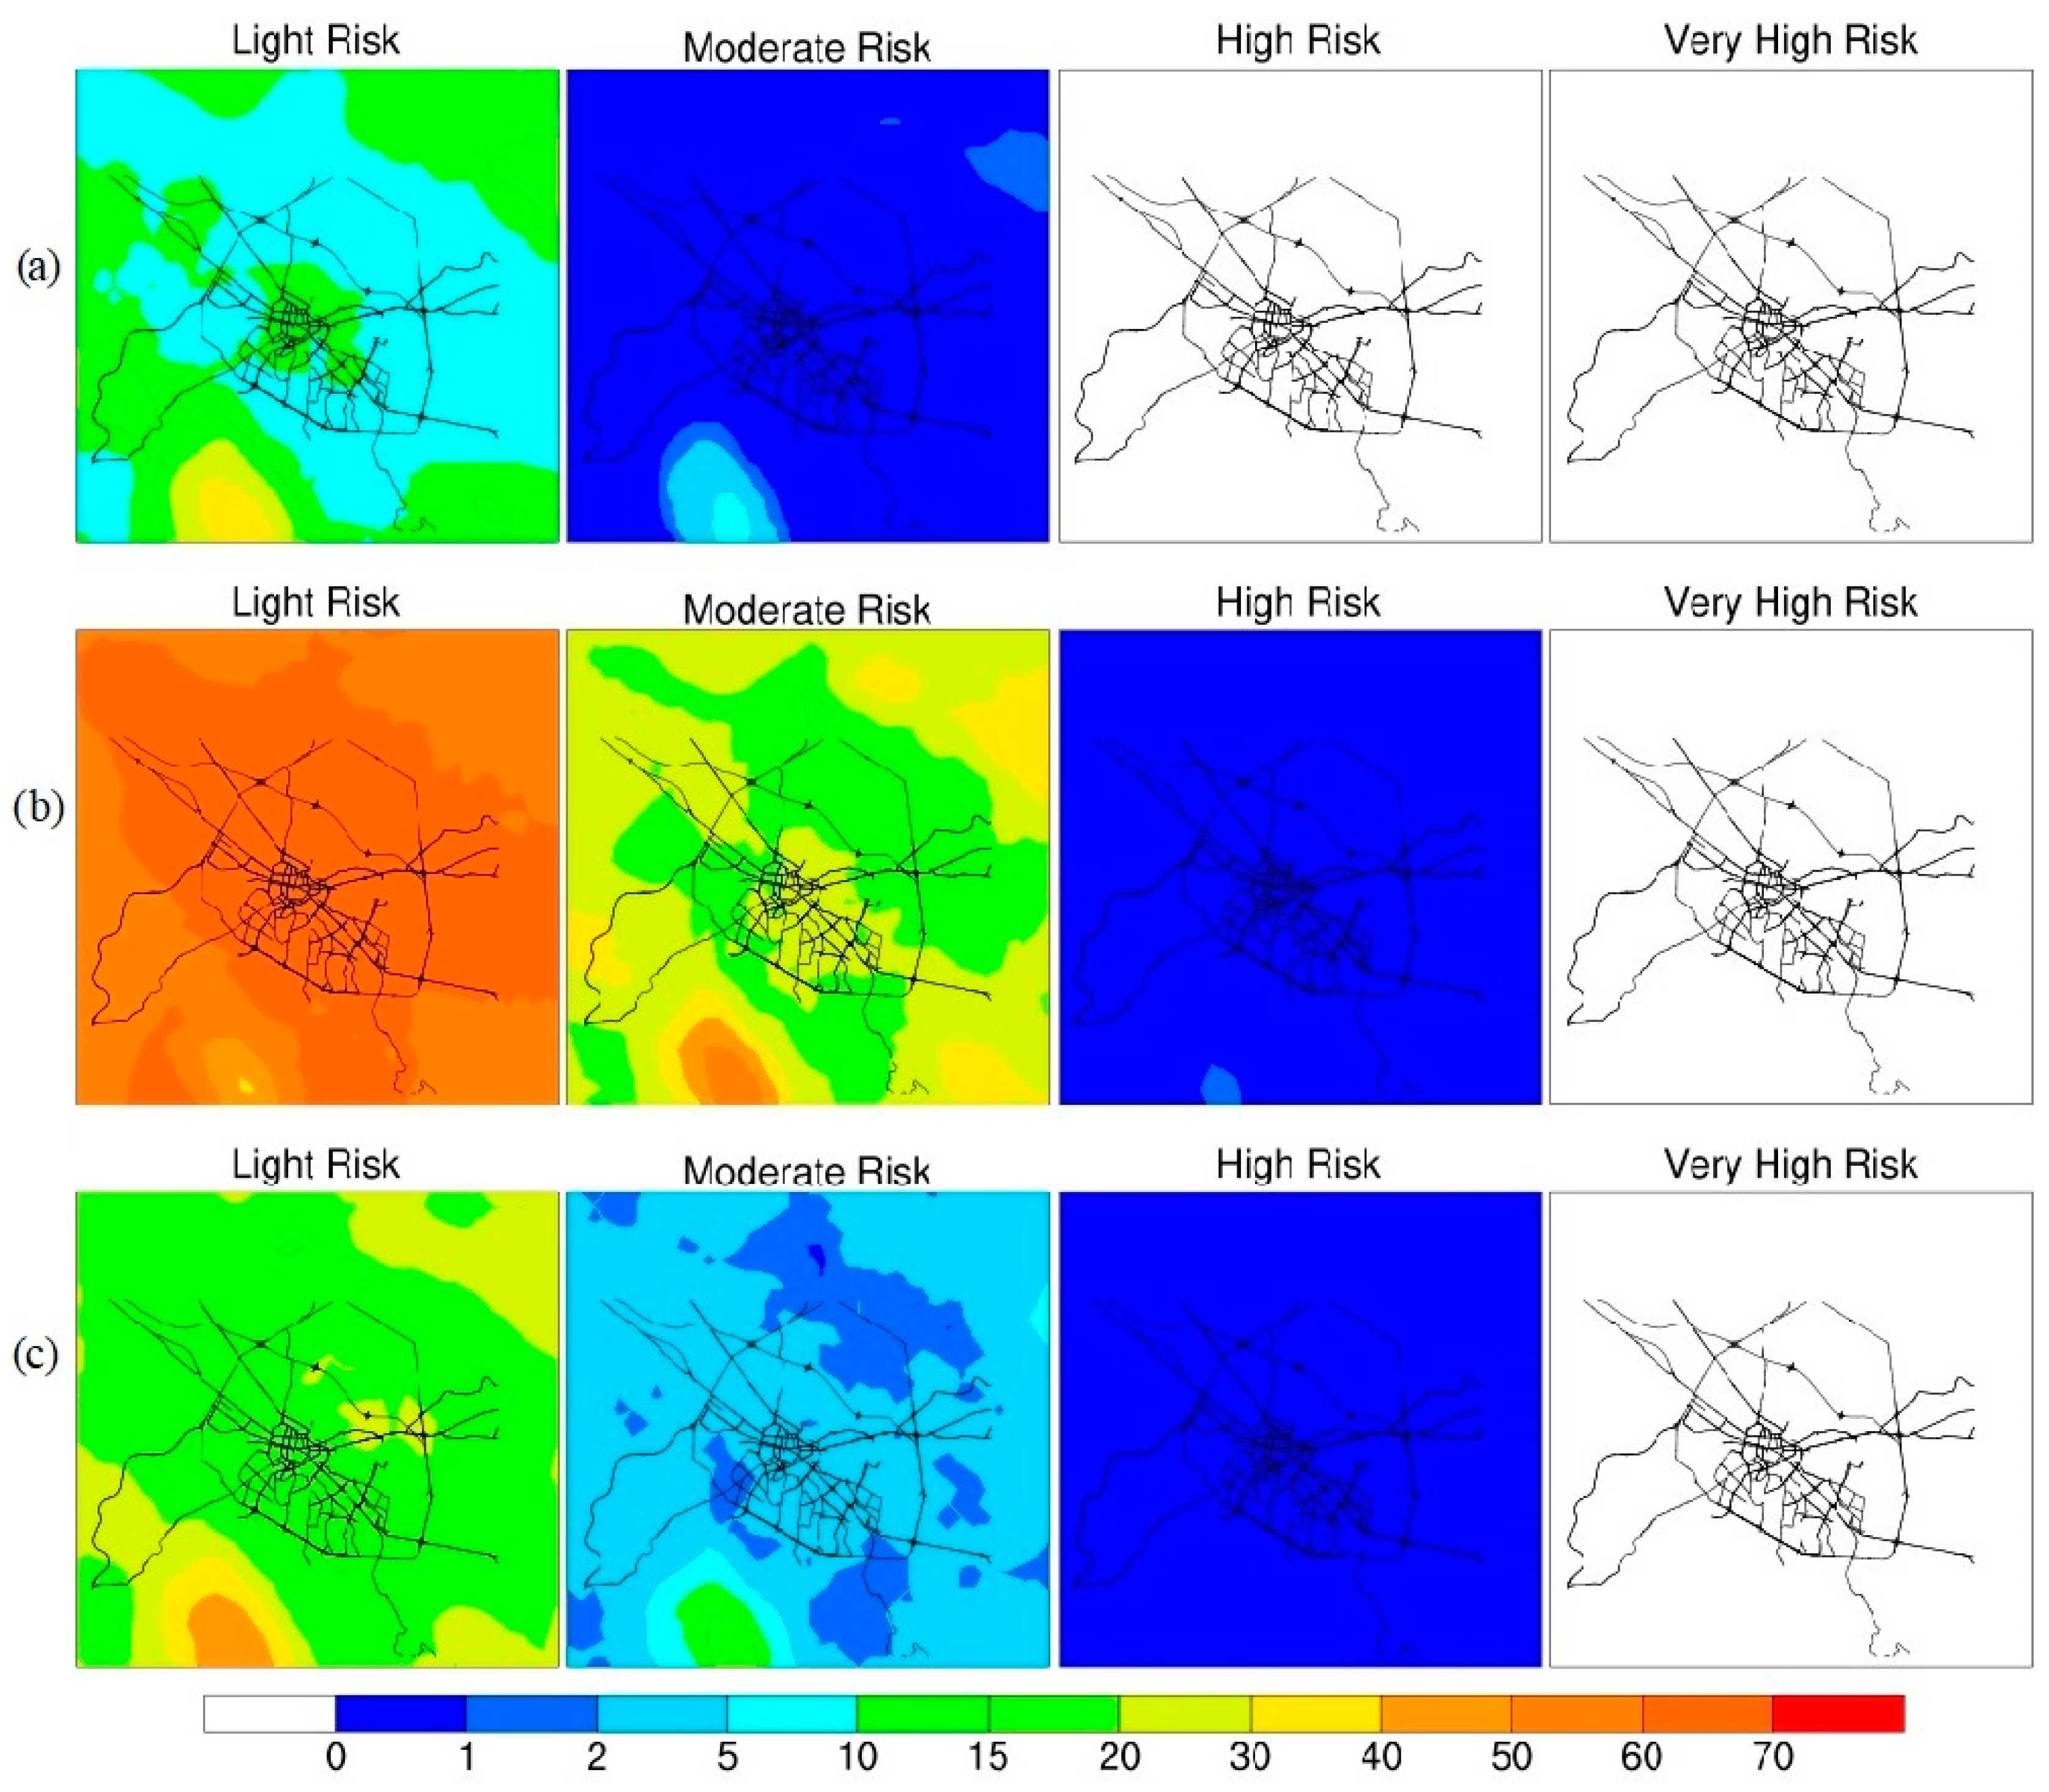
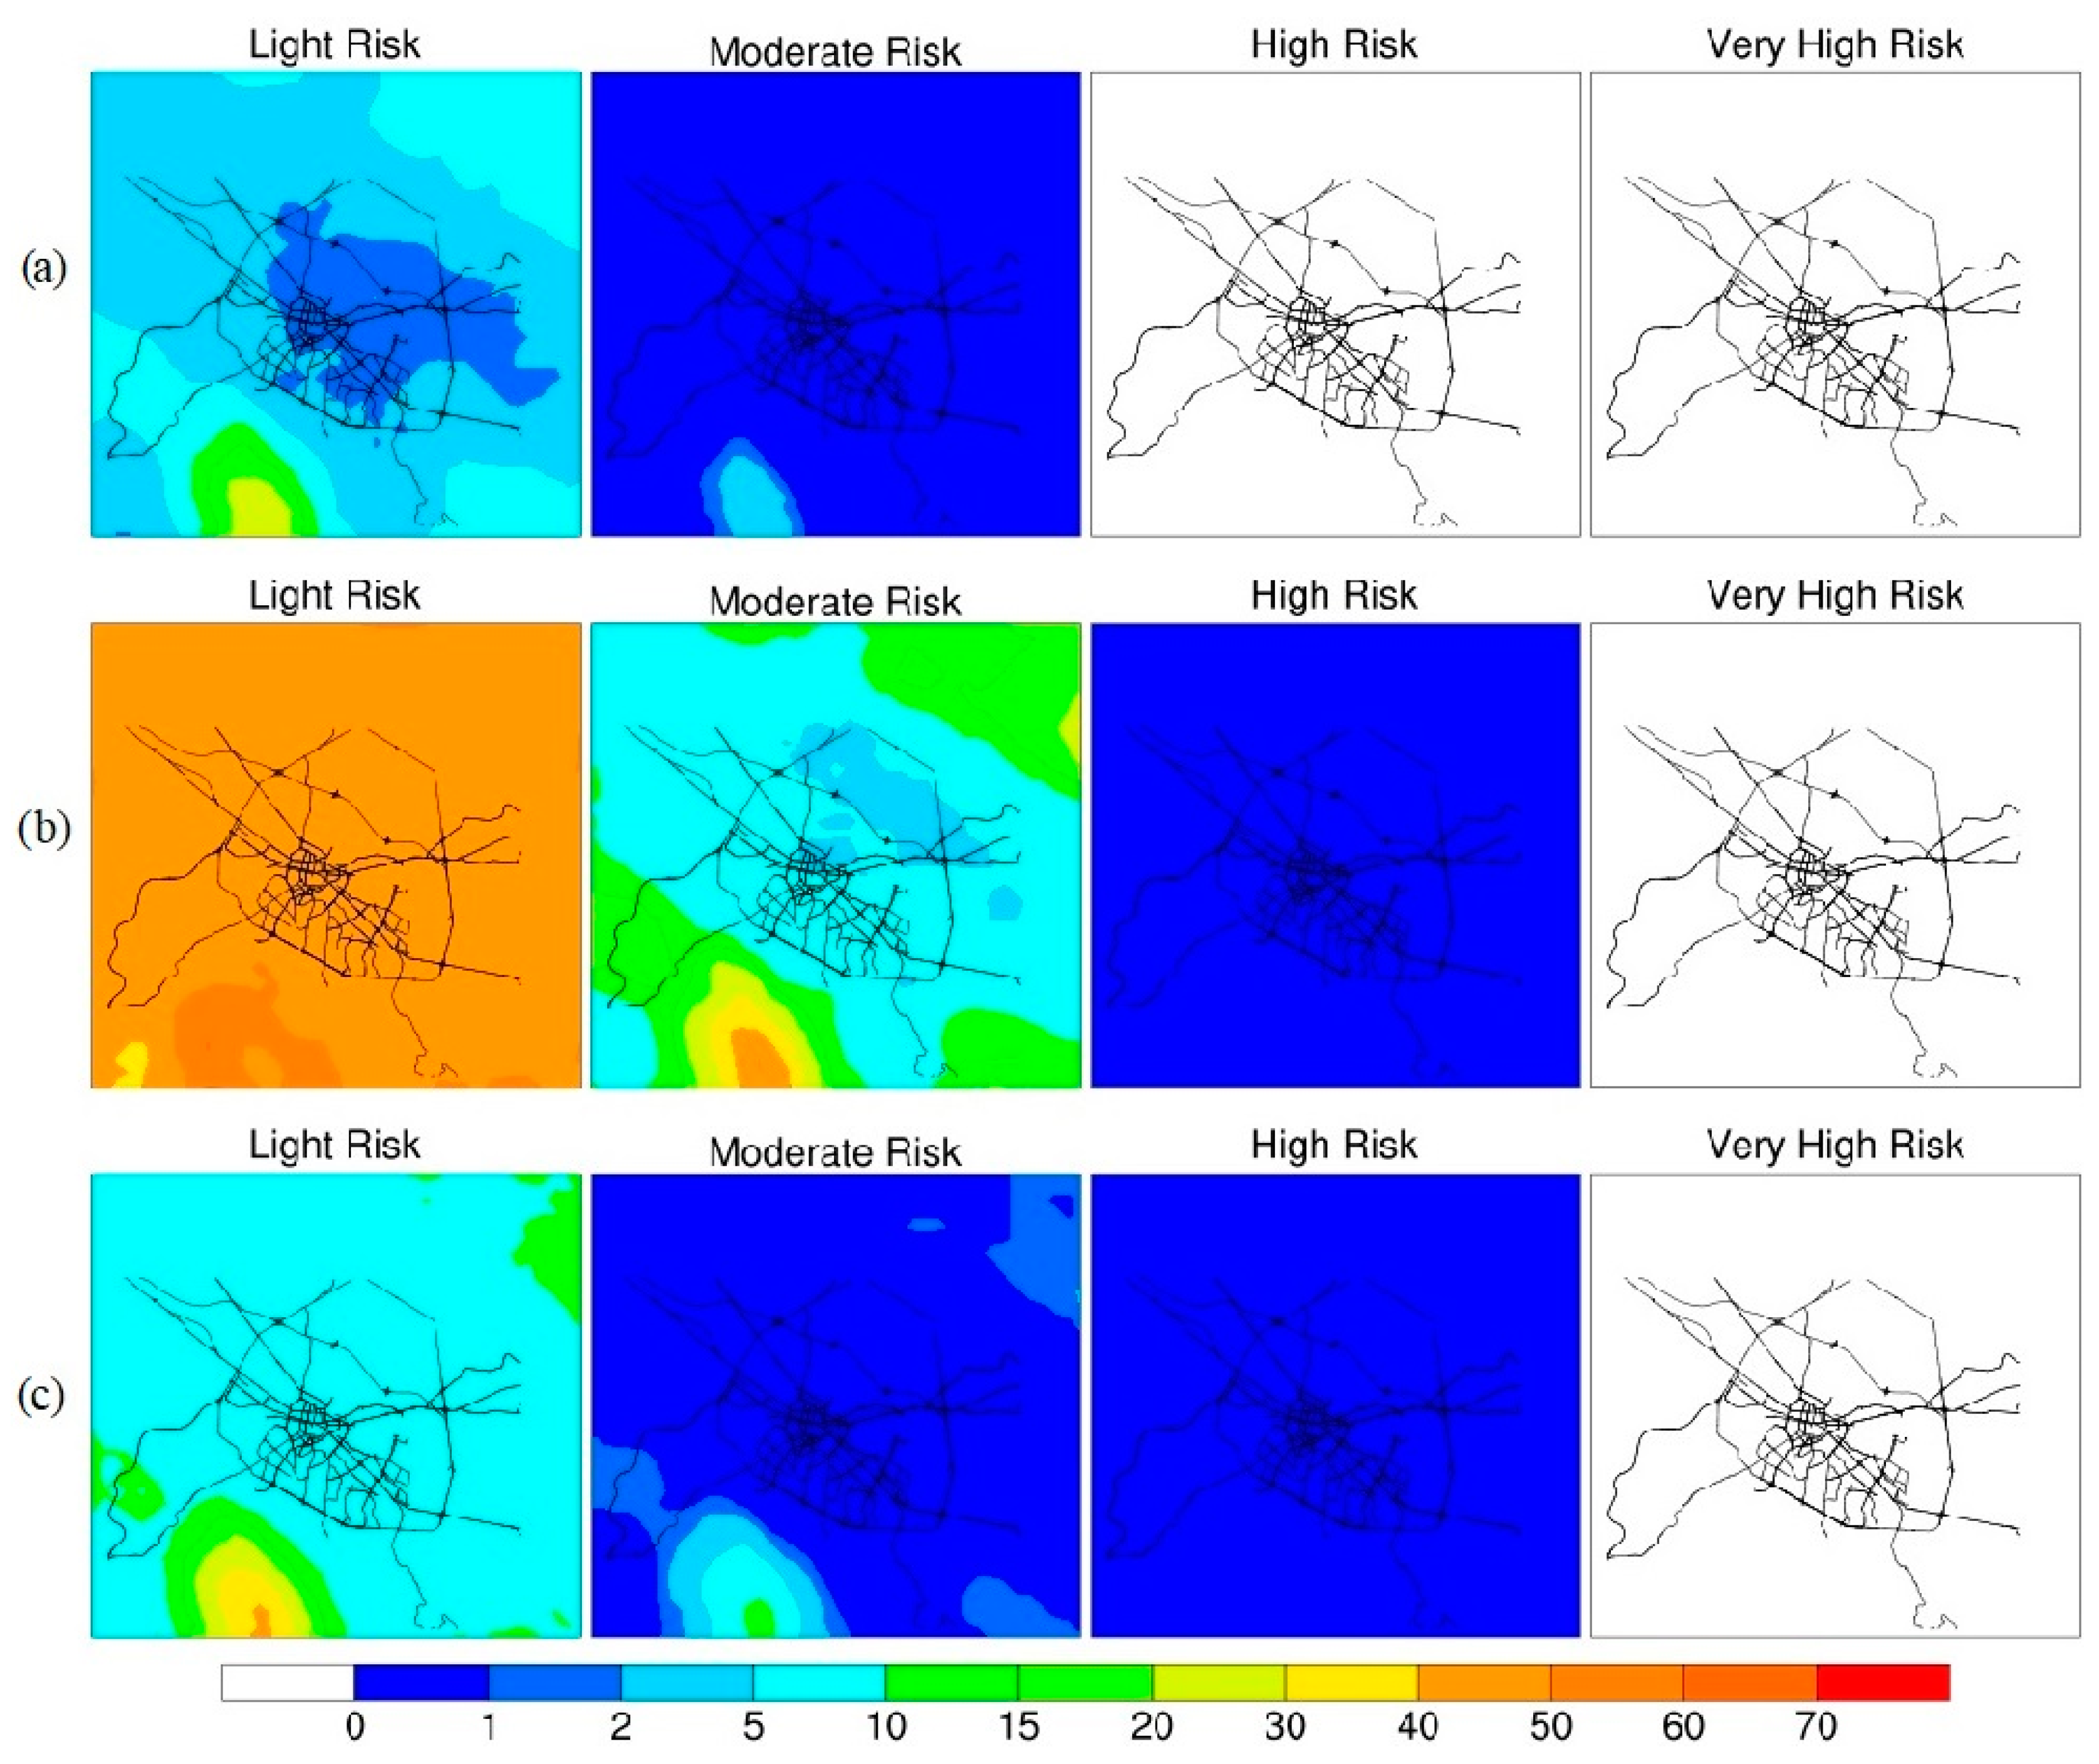
3.2. Bio-Climatic Indices

The simulation results show that the distribution of the frequency of different HI categories is more diverse only in summer (Figure 6). The Caution cases were mostly between 0 and 1% and 1 to 2% in part of the more populated city area. There was no Extreme Caution in the autumn. That season, however, is characterized by more areas with Caution cases between 1 and 2%. During the summer, the probability of the health index “Caution” conditions is higher and has a more complex horizontal distribution. The central city parts had 10 to 15%. The percentages are between 5 and 10 in the other territories of the city limits and Sofia Valley as a whole and decrease with an increasing altitude. The spatial distribution of the Extreme Caution conditions in that season is more homogeneous, similar to the spring and autumn ones. There are no cases of Danger and Extreme Danger conditions over the three seasons, and the Extreme Caution conditions absent in the autumn. Therefore, the weather was not as extreme in the autumn as in the spring.
The simulated wind chill categories over the winter and spring are Light Risk, Moderate Risk, and High Risk, and only Light Risk and Moderate Risk in the autumn (Figure 7). In most of the domain, 5 to 10% of cases were categorized as Light Risk, and this increased up to 40% in higher altitudes. The winter Moderate Risk cases were mostly between 1 and 2%, up to 10% at Vitosha Mountain. The winter Light Risk percentages were from 50 to 60, with some spots below 50%. The Moderate Risk cases follow the terrain height with 10 to 15% in the Sofia Valley, increasing up to 30% in the mountainous areas and 50% at Vitosha Mountain. The spatial distribution of the percentages with Light Risk during the spring has almost the same pattern. The Moderate Risk cases in the spring also follow the terrain height. The percentages are between 1 and 2% in the Sofia Valley, increasing to 5% in higher altitudes and 20% at Vitosha Mountain. The autumn Moderate Risk is up to 1%, except at Vitosha Mountain. There are High Risk cases only in the winter and spring.
Usually, the air temperatures in the warm and cool seasons are highest at or after noon, which draws our interest to study the frequency of the HI categories at 12 UTC (14 EET or 15 EEST). Their spatial distribution, shown in Figure 8, implies the following inferences. The summer, as the hottest season, has the highest number of Caution cases and is the only one with Extreme Caution cases. The frequency of Caution conditions is up to 20% in the mountainous areas, between 20 and 30% in the Sofia Valley, and between 40 and 50% in most of the Sofia city limits. The Extreme Caution category is presented only during that season, with below 1% in most of the domain and 5 to 10% in the more populated area of the city. The autumn percentages are between 5 and 10% in the central city parts, from 2 to 5% in the outer ones, and below 2% in the mountainous areas. The spatial distribution during the spring is kind of similar, but the percentages are smaller with 1 to 5%.
The human’s daily life regime implies that it is interesting to study the wind chill index during the early morning and evening hours. The simulated WCT categories at 06 UTC are presented in Figure 9. Only the first two categories are presented in the autumn. The percentages of Light Risk are between 10 and 15% in the central city and mountainous areas. The Sofia Valley ones are smaller, with 5 to 10%. The Moderate Risk conditions are bigger than 1% only at Vitosha Mountain. The winter Light Risk percentages are from 50 to 70%, higher in the Sofia Valley. The Moderate Risk conditions in that season are between 20 and 30% in part of the city limits and mountainous areas, and lower in the other parts of Sofia Valley. Vitosha Mountain, as the highest terrain, is above 50%. The spring Light Risk frequency distribution is similar to the winter Moderate Risk, but the percentages are about 5% smaller, and there are only three little city spots with higher ones. The spring Moderate Risk percentages are 2 to 5% in most of the domains, except Vitosha Mountain and some places around the city. The winter and spring Moderate Risk conditions are below 1%.
The spatial distribution of the frequencies of the wind chill categories at 15 UTC is shown in Figure 10. The Light Risk conditions in the three seasons are smaller than the ones in the 06 UTC. The autumn Light Risk frequencies are between 1 and 2% in most areas of the city limits, increase to between 2 and 5% in the Sofia Valley, and are higher in the mountainous areas. The winter percentages are mostly between 40 and 50, and the spring ones between 5 and 10%, except at Vitosha Mountain. The Moderate Risk during the transition seasons is mostly below 1% and up to 15% at Vitosha Mountain. The winter ones are 2 to 10% in the Sofia Valley and higher in the higher altitudes around, especially, the Vitosha mountain, where they reach up to 50%. The High-Risk cases are simulated only in the winter and spring.

4. Discussion

The Sofia city simulations show that Sofia’s air quality status (evaluated with a spatial resolution of 1 km) falls mostly in the Low and Moderate bands, but the recurrence of cases with High pollution is close to 10%, mostly at the city center. The recurrence of indices AQI2 and AQ3 (Low range) is different during the day, and it reaches 40% over the whole city territory. The recurrence of AQI2 is about 40% in the morning hours and cold months and about 50% at noon and in the afternoon. A high AQI3 recurrence can be seen in afternoon hours, at about 60% in hot months, and 20% in cold months. The AQI4 has a high recurrence at noon. The cases with bad AQ reach 10% over the selected points. The AQI10, which presents the Very High band, shows a recurrence of about 5–10% during the whole day, all the seasons, and for all points.
The pollution in the city is probably due to the surface sources such as road transport and the TPPs in the city [66]. Apart from these general features, the climatic behavior of the AQI probabilities is rather complex, with significant spatial, seasonal, and diurnal variability. The areas with a slightly worse AQ status are not necessarily linked to the big pollution sources. Wide rural and even mountainous regions can also have a significant probability for AQI from the Moderate range.
The hot spot in Sofia city, where the high-value indices have a higher recurrence, is in the city center. That is quite natural, because the dense population and street network and most intensive road transport in the city center generate very high pollution emissions. The Very High band recurrence is relatively high—about 10%, especially in cold months, where the atmosphere is usually stable and the turbulence transport of aloft pollution is hampered.
Generally, the adverse heat conditions in the Sofia city region reach up to 15% of cases. The summer frequency of conditions for fatigue decreases gradually with the increasing altitude from the city center to the Sofia Valley and mountainous areas. On the other hand, the transition seasons simulations show a more homogeneous distribution of the possibility for that health effect, with more cases in the most urbanized parts (Figure 1). The possibility for heat cramps and heat exhaustion is higher, mainly in the city during the summer. The spatial distributions for 12 UTC are more complex, and the differences between the lower and higher altitudes are more emphasized, possibly due to the higher temperatures at that time. The higher frequencies for fatigue, heat cramps, and heat exhaustion in the urban territories (Figure 1), in comparison to the other ones, are also more pronounced. Generally, the results from the simulation show higher frequencies in the most urbanized territories (Figure 1) and lower ones in higher altitudes. It should be kept in mind that the USGS land use categorization does not account for the urban trees; therefore, the strong cooling effect of urban trees [67] is not simulated in the present study.
The winter slight discomfort is almost the same in the whole domain. It changes with the elevation (Figure 1) in the transition seasons, with a higher frequency in the higher altitude areas. The risk of hypothermia in winter and spring also shows the increasing frequency with altitude. The risk of hypothermia during the autumn, as well as the risk of freezing in the winter and spring, are almost in the same frequency interval. The slight discomfort conditions in the 06 UTC show a little more complex picture, expressing a higher similarity with the changing of the elevation (Figure 1). The spatial distribution of the frequency of the risk of hypothermia, however, shows an opposite behavior—the distribution in 06 UTC is not as complex and similar to the elevation changes (Figure 1) as the whole one. The wind chill severity is highest in the 06 UTC than in the 15 UTC.

5. Conclusions

The areas with a low and partly those with a moderate air quality index are mainly the city’s ring road and busier transport routes, as well as the central parts, and they occur most in the morning hours. The Moderate pollution in the afternoon over Vitosha Mountain is due to ozone, the origin of which can be the photochemical reactions of nitrogen oxides from sources in the city and also the turbulent transport of ozone from higher levels in a turbulent atmosphere. The air quality index bands for locations in Sofia city and Bistritsa with the greatest contribution recurrence are AQI1, AQI2, and AQI3. The AQI3 index recurrence has a maximum in the afternoon hours in the spring and summer, and morning ones for other seasons and annually. The AQI1 and AQI2 recurrences are higher in the morning hours.
We suggest that at least two factors could play a role in these features of the bio-climatic indices. The first one is the normal changing of the temperatures with the changes in altitude. The second one is the urban heat island effect, manifested as higher temperatures in the urban area (Figure 1) than in the rural and suburban ones, due to the higher absorption and re-emitting radiation because of smaller green and water body areas. The conditions of slight windchill discomfort and risk of hypothermia during 2008–2014 for transition seasons and winter increase their frequencies in mountainous areas. Still, it is not always valid for the city limits and the Sofia Valley.

Author Contributions

Conceptualization, G.G. and K.G.; methodology, K.G.; software, G.G.; validation, G.G. and K.G.; formal analysis, K.G.; investigation, K.G.; resources, G.G.; data curation, G.G.; writing—original draft preparation, K.G.; writing—review and editing, K.G.; visualization, G.G.; supervision, K.G.; project administration, G.G.; funding acquisition, K.G. All authors have read and agreed to the published version of the manuscript.

Funding

This work has been accomplished with the financial support by the Grant No BG05M2OP001-1.001-0003, financed by the Science and Education for Smart Growth Operational Program (2014–2020) and co-financed by the European Union through the European structural and Investment funds. This work has been carried out in the framework of the National Science Program “Environmental Protection and Reduction of Risks of Adverse Events and Natural Disasters”, approved by the Resolution of the Council of Ministers № 577/17.08.2018 and supported by the Ministry of Education and Science (MES) of Bulgaria (Agreement No. Δ01-363/17.12.2020).

Institutional Review Board Statement

Not applicable.

Informed Consent Statement

Not applicable.

Data Availability Statement

Data is contained within this article.

Acknowledgments

Deep gratitude to the organizations and institutes (The Netherlands Organisation for applied scientific research - TNO, National Centers for Environmental Prediction/National Center for Atmospheric Research—NCEP/NCAR, European Climate Assessment & Dataset—ECA&D, Unidata, Max Planck Institute for Meteorology—MPI-M and all others), which provide free of charge software and data. Without their innovative data services and tools this study would not be possible.

Conflicts of Interest

The authors declare no conflict of interest. The funders had no role in the design of the study; in the collection, analyses, or interpretation of data; in the writing of the manuscript, or in the decision to publish the results.

References

  1. World Health Organization (WHO). Health Aspects of Air Pollution. Results from the WHO Project Systematic Review of Health Aspects of Air Pollution in Europe, 2004; WHO: Geneva, Switzerland, 2004. [Google Scholar]
  2. WHO. Fact Sheet Number 187; World Health Organization (WHO): Geneva, Switzerland, 2000. [Google Scholar]
  3. European Parliament. Directive 2002/3/EC of 12 February 2002 relating to ozone in ambient air. Off. J. Eur. Communities 2002, L67, 14–30. [Google Scholar]
  4. European Parliament: Directive 2008/50/EC of the European Parliament and of the Council of 21 May 2008 on ambient air quality and cleaner air for Europe. Off. J. Eur. Union 2008, L152, 1–44.
  5. Brunekreef, B.; Holgate, S. Air pollution and health. Lancet 2002, 360, 1233–1242. [Google Scholar] [CrossRef]
  6. Katsouyanni, K. Ambient air pollution and health. Br. Med Bull. 2003, 68, 143–156. [Google Scholar] [CrossRef] [PubMed] [Green Version]
  7. WHO. WHO Air Quality Guidelines for Particulate Matter, Ozone, Nitrogen Dioxide and Sulphur Dioxide. Global Update 2005. Summary of Risk Assessment; WHO Regional Office for Europe: Copenhagen, Denmark, 2005. [Google Scholar]
  8. Atkinson, R.W.; Yu, D.; Armstrong, B.; Pattenden, S.; Wilkinson, P.; Doherty, R.; Hea, M.R.; Anderson, H.R. Concentration–Response Function for Ozone and Daily Mortality: Results from Five Urban and Five Rural UK Populations. Environ. Health Perspect. 2012, 120, 1411–1417. [Google Scholar] [CrossRef] [PubMed] [Green Version]
  9. Nikiforov, B.; Antova, T.; Lolova, D. Health issues for the population in the town of Pleven related to ambient air pollution. Probl. Hyg. 2002, 3, 39–44. (In Bulgarian) [Google Scholar]
  10. Nikiforov, B.; Antova, T.; Lolova, D. Ambient air quality in the municipality of Rousse and public health risk. Probl. Hyg. 2003, 1, 15–22. (In Bulgarian) [Google Scholar]
  11. Antova, T.; Nikiforov, B.; Lolova, D. Ambient air quality and health risk to the population of the town of Dobrich. Probl. Hyg. 2002, 2, 27–32. (In Bulgarian) [Google Scholar]
  12. Pattenden, S.B.; Nikiforov, B.; Armstrong, B.G. Mortality and temperature in Sofia and London. J. Epidemiol. Community Health 2003, 57, 628–633. [Google Scholar] [CrossRef] [Green Version]
  13. Starr, C.; McMillan, B. Human Biology; Brooks/Cole Cengager Learning: Mason, OH, USA, 2010. [Google Scholar]
  14. Giles, B.D.; Balafoutis, C.H.; Maheras, P. Too hot for comfort: The heatwaves in Greece in 1987 and 1988. Int. J. Biometeorol. 1990, 34, 98–104. [Google Scholar] [CrossRef]
  15. Stathopoulou, M.I.; Cartalis, C.; Keramitsoglou, I.; Santamouris, M. Thermal Remote Sensing of Thom’s Discomfort Index (DI): Comparison with In Situ Measurements. In Remote Sensing for Environmental Monitoring, GIS Applications, and Geology V; SPIE Remote Sensing: Bruges, Belgium, 2005. [Google Scholar]
  16. Sajani, Z.S.; Tibaldi, S.; Scotto, F.; Lauriola, P. Bioclimatic characterisation of an urban area: A case study in B logna (Italy). Int. J. Biometeorol. 2008, 52, 779–785. [Google Scholar] [CrossRef] [PubMed] [Green Version]
  17. Da Silva, V.D.P.R.; De Azevedo, P.V.; Brito, R.S.; Da Cunha Campos, J.H.B. Evaluating the urban climate of a typically tropical city of northeastern Brazil. Environ. Monit. Assess. 2010, 161, 45–59. [Google Scholar] [CrossRef] [PubMed]
  18. Ergonomics of the Thermal Environment—Determination and Interpretation of Cold Stress When using Required Clothing Insulation (IREQ) and Local Cooling Effects. (ISO Standard No. 11079:2007). 2007. Available online: https://www.iso.org/standard/38900.html (accessed on 15 June 2021).
  19. Ergonomics of the Thermal Environment—Assessment of Heat Stress using the WBGT (Wet Bulb Globe Temperature) Index. (ISO Standard No. 7243:2017). 2017. Available online: https://www.iso.org/standard/67188.html (accessed on 15 June 2021).
  20. Ergonomics of the Thermal Environment—Assessment of Heat Stress using the WBGT (Wet Bulb Globe Temperature) Index. (ISO Standard No. 7933:2004). 2004. Available online: https://www.iso.org/standard/37600.html (accessed on 15 June 2021).
  21. Ergonomics of the Thermal Environment—Risk Assessment Strategy for the Prevention of Stress or Discomfort in Thermal Working Conditions. (ISO Standard No. 15265:2004). 2004. Available online: https://www.iso.org/standard/26129.html (accessed on 15 June 2021).
  22. de Freitas, C.R.; Grigorieva, E.A. A comparison and appraisal of a comprehensive range of human thermal climate indices. Int. J. Biometeorol. 2017, 61, 487–512. [Google Scholar] [CrossRef] [PubMed]
  23. d’Ambrosio Alfano, F.R.; Palella, B.I.; Riccio, G. Notes on the Implementation of the IREQ Model for the Assessment of Extreme Cold Environments. Ergonomics 2013, 56, 707–724. [Google Scholar] [CrossRef]
  24. Fanger, P.O. Thermal Comfort: Analysis and Applications in Environmental Engineering; McGraw-Hill: New York, NY, USA, 1972. [Google Scholar]
  25. Höppe, P. Die Thermische Komponente der Stadtklimas. Wiss. Mitt. Meteorol. Inst. Univ. München. 1986, 53, 94–108. [Google Scholar]
  26. Matzarakis, A.; Mayer, H. The extreme heat wave in Athens in July 1987 from the point of view of human biometeorology. Atmos. Environ. Part B Urban Atmos. 1991, 25, 203–211. [Google Scholar] [CrossRef]
  27. Matzarakis, A.; Mayer, H. Heat stress in Greece. Int. J. Biometeorol. 1997, 41, 34–39. [Google Scholar] [CrossRef]
  28. Höppe, P. The physiological equivalent temperature—A universal index for the biometeorological assessment of the thermal environment. Int. J. Biometeorol. 1999, 43, 71–75. [Google Scholar] [CrossRef]
  29. Matzarakis, A.; Rutz, F.; Mayer, H. Estimation and Calculation of the Mean Radiant Temperature within Urban Structures. In Biometeorology and Urban Climatology at the Turn of the Millennium: Selected Papers from the Conference ICB-ICUC’99, Sydney, Australia, 8–12 November 1999; de Dear, R.J., Kalma, J.D., Oke, T.R., Auliciems, A., Eds.; WMO: Geneva, Switzerland; UNEP: Nairobi, Kenya, 2000; pp. 273–278. [Google Scholar]
  30. Matzarakis, A.; Rutz, F.; Mayer, H. Modelling radiation fluxes in simple and complex environments—Application of the RayMan model. Int. J. Biometeorol. 2007, 51, 323–334. [Google Scholar] [CrossRef]
  31. Rothfusz, L.P. NWS Technical Attachment (SR 90-23). 1990. Available online: https://www.weather.gov/media/ffc/ta_htindx.PDF (accessed on 20 August 2021).
  32. Steadman, R.G. The assessment of sultriness, Part I: A temperature-humidity index based on human physiology and clothing science. J. Appl. Meteorol. 1979, 18, 861–873. [Google Scholar] [CrossRef] [Green Version]
  33. The NCAR Command Language (Version 6.6.2) [Software]. (2019). Boulder, Colorado: UCAR/NCAR/CISL/TDD.. Available online: https://www.ncl.ucar.edu/ (accessed on 20 August 2021).
  34. Osczevski, R.; Bluestein, M. The new wind chill equivalent temperature chart. Bull. Am. Meteorol. Soc. 2005, 86, 1453–1458. [Google Scholar] [CrossRef] [Green Version]
  35. Wind Chill Index. Available online: https://www.canada.ca/en/environment-climate-change/services/weather-health/wind-chill-cold-weather/wind-chill-index.html (accessed on 20 May 2019).
  36. Ivanov, V.; Evtimov, S. Heat Risks in Bulgaria during 2003–2012 period. Bulg. Geophys. J. 2014, 40, 3–13. [Google Scholar]
  37. Ivanov, V.; Evtimov, S. Wind chill hazard in Bulgaria during 2003–2012 period. Comptes Rendus L’Academie Bulg. Des. Sci. 2014, 67, 1521–1530. [Google Scholar]
  38. Ivanov, V.; Chervenkov, H. Modelling human biometeorological conditions using meteorological data from reanalysis and objective Analysis—Preliminary results. In BGSIAM 2018 Advanced Computing in Industrial Mathematics; Springer: Cham, Switzerland, 2018; pp. 170–181. [Google Scholar]
  39. Chervenkov, H.; Slavov, K.; Ivanov, V. STARDEX and ETCCDI Climate Indices Based on E-OBS and CARPATCLIM. In International Conference on Numerical Methods and Applications; Springer: Cham, Switzerland, 2018; pp. 360–367. [Google Scholar]
  40. Georgieva, I.; Ivanov, V. Computer simulations of the impact of air pollution on the quality of life and health risks in Bulgaria. Int. J. Environ. Pollut. 2018, 64, 35–46. [Google Scholar] [CrossRef]
  41. Ivanov, V.; Georgieva, I. Air Quality Index Evaluations for Sofia City. In Proceedings of the IEEE EUROCON 2017–17th IEEE International Conference on Smart Technologies, Ohrid, North Macedonia, 6–8 July 2017. [Google Scholar]
  42. Georgieva, I.; Ivanov, V. Impact of the Air Pollution on the Quality of Life and Health Risks in Bulgaria. In Proceedings of the HARMO 2017, 18th International Conference on Harmonisation within Atmospheric Dispersion Modelling for Regulatory Purposes, Bologna, Italy, 9–12 October 2017. [Google Scholar]
  43. Georgieva, I.; Gadzhev, G.; Ganev, K.; Prodanova, M.; Syrakov, D.; Miloshev, N. Numerical study of the air quality in the city of Sofia—Some preliminary results. Int. J. Environ. Pollut. 2015, 57, 162–174. [Google Scholar] [CrossRef]
  44. Georgieva, I.; Gadzhev, G.; Ganev, K.; Prodanova, M.; Syrakov, D.; Miloshev, N. Numerical Study of the Air Quality in the City of Sofia. In 8th Congress of the Balkan Geophysical Society; European Association of Geoscientists & Engineers: Houten, The Netherlands, 2015. [Google Scholar]
  45. Georgieva, I.; Gadzhev, G.; Ganev, K.; Prodanova, M.; Syrakov, D.; Miloshev, N. Numerical Study of the Air Quality in the City of Sofia—Some Preliminary Results. In Proceedings of the HARMO 2014—16th International Conference on Harmonisation within Atmospheric Dispersion Modelling for Regulatory Purposes 2014, Varna, Bulgaria, 8–11 September 2014; pp. 356–360. [Google Scholar]
  46. Georgieva, I.; Gadzhev, G.; Ganev, K.; Melas, D.; Wang, T. HPC simulations of the atmospheric composition in Bulgaria and the city of Sofia. Cybern. Inf. Technol. 2017, 17, 37–48. [Google Scholar]
  47. Georgieva, I.; Gadzhev, G.; Ganev, K.; Miloshev, N. Computer Simulations of Atmospheric Composition in Urban Areas some Results for the City of Sofia. In Proceedings of the Tenth International Conference on “Large Scale Scientific Computations”, LSSC2018, Sozopol, Bulgaria, 5–9 June 2017; Springer: Cham, Switzerland, 2018; pp. 474–482. [Google Scholar]
  48. Georgieva, I.; Gadzhev, G.; Ganev, K.; Miloshev, N. Analysis of Dynamical and Chemical Processes Which form Athmospheric Composition over Bulgaria. Int. Multidiscip. Sci. GeoConference: SGEM 2018, 18, 167–179. [Google Scholar]
  49. Georgieva, I.; Miloshev, N. Computer Simulations of PM Concentrations Climate for Bulgaria. In Proceedings of the International Conference on “Numerical Methods for Scientific Computations and Advanced Applications”, NMSCAA’18, Hissarya, Bulgaria, 28–31 May 2018; pp. 46–49. [Google Scholar]
  50. Shamarock, W.C.; Klemp, J.B.; Dudhia, J.; Gill, D.O.; Barker, D.M.; Wang, W.; Powers, J.G.; A Description of the Advanced Research WRF Version 2 (No. NCAR/TN-468+STR), 2017, University Corporation for Atmospheric Research. Available online: http://www.dtic.mil/dtic/tr/fulltext/u2/a487419.pdf (accessed on 15 June 2021).
  51. Available online: https://rda.ucar.edu/datasets/ds083.2/#!access (accessed on 15 June 2021).
  52. Byun, D.; Ching, J.; Science Algorithms of the EPA Models-3 Community Multi-scale Air Quality (CMAQ) Modeling System. EPA Report 600/R-99/030, Washington, DC, EPA/600/R-99/030 (NTIS PB2000-100561). 1999. Available online: https://cfpub.epa.gov/si/si public record report.cfm?Lab=NERL&dirEntryId=63400 (accessed on 15 June 2021).
  53. Byun, D. Dynamically Consistent Formulations in Meteorological and Air Quality Models for Multiscale Atmospheric Studies part I: Governing equations in a generalized coordinate system. J. Atmos. Sci. 1999, 56, 3789–3807. [Google Scholar] [CrossRef]
  54. CEP: Sparse Matrix Operator Kernel Emission (SMOKE) Modeling System, 2003, University of Carolina, Carolina Environmental Programs, Research Triangle Park, North Carolina. Available online: https://www.cmascenter.org/smoke/ (accessed on 20 August 2021).
  55. Denier van der Gon, H.; Visschedijk, A.; van de Brugh, H.; Droge, R. A High Resolution European Emission Data Base for the Year 2005, TNO-Report TNO-034-UT-2010-01895 RPT-ML, Apeldoorn, The Netherlands. 2010. Available online: https://www.umweltbundesamt.de/sites/default/files/medien/461/publikationen/texte_41_2013_appelhans_e03_komplett_0.pdf (accessed on 20 August 2021).
  56. Hong, S.-Y.; Lim, J.-O.J. The WRF Single-Moment 6-Class Microphysics Scheme (WSM6). J. Korean Meteor. Soc. 2006, 42, 129–151. [Google Scholar]
  57. Collins, W.D.; Rasch, P.J.; Boville, B.A.; Hack, J.J.; McCaa, J.R.; Williamson, D.L.; Kiehl, J.T.; Briegleb, B.; Bitz, C.; Lin, S.-J.; et al. Description of the NCAR Community Atmosphere Model (CAM 3.0). NCAR Tech. Note NCAR/TN-464+STR 2004, 226, 1326–1334. [Google Scholar]
  58. Xiu, A.; Pleim, J.E. Development of a land surface model part I: Application in a mesoscale meteorology model. J. Appl. Meteor. 2001, 40, 192–209. [Google Scholar] [CrossRef]
  59. Pleim, J.E. A combined local and non-local closure model for the atmospheric boundary layer. Part 1: Model description and testing. J. Appl. Meteor. Clim. 2007, 46, 1383–1395. [Google Scholar] [CrossRef]
  60. Ivanov, V.; Dimitrova, R. Sensitivity to the Wrf Model Configuration of the Wind Chill Index for Sofia Region—Preliminary Results. In Proceedings of the 1st Internationa Conference on Environmental Protection and Disaster RISKs, Sofia, Bulgaria, 29–30 September 2020; pp. 79–89. [Google Scholar]
  61. Gadzhev, G.; Ganev, K.; Miloshev, N. Numerical study of the atmospheric composition climate of Bulgaria—Validation of the computer simulation results. Int. J. Environ. Pollut. 2015, 57, 189–201. [Google Scholar] [CrossRef]
  62. de Leeuw, F.; Mol, W. Air Quality and Air Quality Indices: A world apart, 2005, ETC/ACC Technical Paper 2005/5. Available online: http://acm.eionet.europa.eu/docs/ETCACC TechnPaper 2005 5 AQ Indices.pdf (accessed on 15 June 2021).
  63. Georgieva, I. Air Quality Index Evaluations for Bulgaria. In Proceedings of the International Conference on Numerical Methods for Scientific Computations and Advanced Applications, Bansko, Bulgaria, 19–22 May 2014; pp. 39–42. [Google Scholar]
  64. Gadzhev, G.; Ganev, K.; Miloshev, N.; Syrakov, D.; Prodanova, M. Numerical study of the atmospheric composition in Bulgaria. Comput. Math. Appl. 2013, 65, 402–422. [Google Scholar] [CrossRef]
  65. Song, J.; Wang, Z.-H.; Wang, C. Biospheric and anthropogenic contributors to atmospheric CO2 variability in a residential neighborhood of Phoenix, Arizona. J. Geophys. Res. Atmos. 2017, 122, 3317–3329. [Google Scholar] [CrossRef]
  66. Gadzhev, G.; Georgieva, I.; Ganev, K.; Miloshev, N. Contribution of different emission sources to the atmospheric composition formation in the city of Sofia. Int. J. Environ. Pollut. 2018, 64, 47–57. [Google Scholar] [CrossRef]
  67. Wang, C.; Wang, Z.-H.; Yang, J. Cooling Effect of Urban Trees on the Built Environment of Contiguous United States. Earth’s Future 2018, 6, 1066–1081. [Google Scholar] [CrossRef] [Green Version]
Figure 1. Domain elevation in (m) (a). Land cover (b) categories: 1—Urban and Built-up Land; 2—Dryland Cropland and Pasture; 3—Irrigated Cropland and Pasture; 5—Cropland/Grassland Mosaic; 6—Cropland/Woodland Mosaic; 11—Deciduous Broadleaf Forest; 14—Evergreen Needleleaf; 15—Mixed Forest; 16—Water Bodies. Elevation (m) of five nested domains (c).
Atmosphere 12 01078 g001
Figure 2. Annual recurrences (in %) of the AQI for the band Low, Moderate, High, and Very High for the territory of Sofia city.
Atmosphere 12 01078 g002
Figure 3. Average recurrence (in %) of the different indices (from 1 to 10) for the territory of the city of Sofia.
Atmosphere 12 01078 g003
Figure 4. Average recurrence (in %) of the different indices (from 1 to 10) for the Orlov Most (Sofia).
Atmosphere 12 01078 g004
Figure 5. Average recurrence (in %) of the different indices (from 1 to 10) for the Bistrica.
Atmosphere 12 01078 g005
Figure 6. Frequency (in %) for (a) spring, (b) summer, and (c) autumn of the Heat index categories in the Sofia region during the spring (first row), summer (second row), and autumn (third row).
Atmosphere 12 01078 g006
Figure 7. Frequency (in %) for (a) autumn, (b) winter, and (c) spring of the Wind chill categories in the Sofia region during the spring (first row), summer (second row), and autumn (third row).
Atmosphere 12 01078 g007
Figure 8. Frequency (in %) for (a) spring, (b) summer, and (c) autumn of the Heat index categories “Caution” (first column), “Extreme caution” (second column), and “Danger” (third column) in the Sofia region at 12 UTC during the spring (first row), summer (second row), and autumn (third row).
Atmosphere 12 01078 g008
Figure 9. Frequency (in %) for (a) autumn, (b) winter, and (c) spring of the Wind-chill index categories “Low risk” (first column), “Moderate risk” (second column), and “High risk” (third column) in the Sofia region at 06 UTC during the autumn (first row), winter (second row), and spring (third row).
Atmosphere 12 01078 g009
Figure 10. Frequency (in %) for (a) autumn, (b) winter, and (c) spring of the Wind-chill index categories “Low risk” (first column), “Moderate risk” (second column), and “High risk” (third column) in the Sofia region at 15 UTC during the autumn (first row), winter (second row), and spring (third row).
Atmosphere 12 01078 g010
Table 1. Boundaries Between Index Points for Each Pollutant.
INDEXO3NO2SO2PM10
µg/m3µg/m3µg/m3µg/m3
10–320–950–880–21
233–6696–19089–17622–42
367–99191–286177–26543–64
4100–126287–381266–35465–74
5127–152382–477355–44275–86
6153–179478–572443–53187–96
7180–239573–635532–70897–107
8240–299636–700709–886108–118
9300–359701–763887–1063119–129
10>360>764>1064>130
Table 2. Air Quality Indices and health effect description.
BandingValueHealth Descriptor
Low1–3Effects are unlikely to be noticed even by individuals who know they are sensitive to air pollutants
Moderate4–6Mild effects, unlikely to require action, may be noticed amongst sensitive individuals.
High7–9Significant effects may be noticed by sensitive individuals and action to avoid or reduce these effects may be needed. Asthmatics will find that their “reliever” inhaler is likely to reverse the effects on the lung.
Very High10The effects on sensitive individuals described for “High” levels of pollution may worsen
Table 3. Heat index categories and health effects.
Heat Index CategoryNumerical IntervalHealth Precautions
Caution26.7–32.2 °CFatigue is possible with prolonged exposure and activity. Continuing activity could result in heat cramps.
Extreme Caution32.2–40.5 °CHeat cramps and heat exhaustion are possible. Continuing activity could result in heat stroke.
Danger40.5–54.4 °CHeat cramps and heat exhaustion are likely; heat stroke is probable with continued activity
Extreme Danger≥ 54.4 °CHeat stroke is imminent
Table 4. Wind chill index categories and health effects.
Wind Chill CategoryNumerical IntervalHealth Precautions
Light Risk0–−9 °CSlight increase in discomfort.
Moderate Risk−10–−27 °CUncomfortable. Risk of hypothermia and frostbite if outside for long periods without adequate protection.
High Risk−28–−39 °CHigh risk of frostnip or frostbite. Exposed skin can freeze in 10 to 30 min; Check face and extremities for numbness or whiteness; High risk of hypothermia if outside for long periods without adequate clothing or shelter from wind and cold.
Very High Risk−40–−47 °CVery high risk of frostbite; Exposed skin can freeze in 5 to 10 min; Check face and extremities for numbness or whiteness; Very high risk of hypothermia if outside for long periods without adequate clothing or shelter from wind and cold.
Severe Risk−48–−54 °CSevere risk of frostbite; Exposed skin can freeze in 2 to 5 min; Check face and extremities frequently for numbness or whiteness; Severe risk of hypothermia if outside for long periods without adequate clothing or shelter from wind and cold.
Extreme Risk≤−55 °CDANGER! Exposed skin can freeze in less than 2 min; Outdoor conditions are hazardous.
Publisher’s Note: MDPI stays neutral with regard to jurisdictional claims in published maps and institutional affiliations.

