Article

Characterization of Ambient Particulate Matters in an Industry-Intensive Area in Central Taiwan

1
New Materials Research & Development Department, China Steel Corporation, Kaohsiung 812, Taiwan
2
Institute of Environment Engineering, National Sun Yat-sen University, Kaohsiung 804, Taiwan
3
Department of Biotechnology, National Formosa University, Yunlin 632, Taiwan
4
Department of Environmental Science and Engineering, Tunghai University, Taichung 407, Taiwan
5
Center for Environmental Toxin and Emerging-Contaminant Research, Cheng Shiu University, Kaoshiung 833, Taiwan
6
Department of Marine Environmental Engineering, National Kaohsiung University of Science and Technology, Kaohsiung 81157, Taiwan
*
Authors to whom correspondence should be addressed.
Atmosphere 2021, 12(7), 926; https://doi.org/10.3390/atmos12070926
Submission received: 15 June 2021 / Revised: 8 July 2021 / Accepted: 15 July 2021 / Published: 18 July 2021
(This article belongs to the Section Air Quality)

Abstract

:
Atmospheric particulate matters (PMs) were measured in an industry-intensive region in central Taiwan in order to investigate the characteristics and possible sources of PMs. The samplings were simultaneously conducted using a 10- and 3-stage Micro Orifice Uniform Deposit Impactor (MOUDI) from 2017 to 2018. In this study, the characteristics of PMs in this region were evaluated by measuring the mass concentration of PMs and analyzing water-soluble ions and metallic elements, as well as dioxins. Additionally, principal component analysis (PCA) was used to identify the potential sources of PMs. The results showed that the mean concentration of coarse (>1.8 μm), fine (0.1–1.8 μm), and ultrafine (<0.1 μm) particles were 13.60, 14.38, and 3.44 μg/m3, respectively. In the industry-intensive region, the size distribution of ambient particles showed a bi-modal distribution with a high concentration of coarse particles in the spring and summer, while fine particles were dominant in the autumn and winter. The most abundant water-soluble ions of PMs were NO3, Cl, and SO42−, while the majority of metallic elements were Na, Fe, Ca, Al, and Mg in different particle sizes. The results of Pearson’s correlation analysis for metals indicated that the particles in the collected air samples were related to the iron and steelmaking industries, coal burning, vehicle exhausts, and high-tech industries. The dioxin concentration ranged from 0.0006 to 0.0017 pg I-TEQ/Nm3. Principal component analysis (PCA) revealed that the contribution to PMs was associated with sea salt, secondary pollutants, and industrial process.

1. Introduction

Air pollution is a major concern in urban areas because of its threat to human health, including asthma and acute and chronic respiratory symptoms [1]. Ambient particulate matters (PMs) include small solid or liquid particles suspended in the air. In addition, PMs included particles with an aerodynamic diameter of less than 0.1 μm, less than 2.5 μm, and less than 10 μm, also known as PM1, PM2.5, and PM10, respectively [2]. Epidemiological studies reported that the highest association noted was an 18% rise in asthma admissions correlated with a 10 µg/m3 increase in coarse particles on the same day of admissions [3]. Furthermore, ultrafine particles cause a stronger toxic effect than fine and coarse particles due to their high surface area [4,5]. The chemical compositions of PMs include water-soluble ions, metallic elements, and organic compounds, such as dioxin, which are correlated to toxicity and health [6,7]. Typically, the ionic constituents accounted for 35–60% of the PM2.5 mass in Korea, and sulfates and nitrates were the dominant ionic species [8]. In southern Taiwan, Tsai et al. [9] reported that sulfate, nitrate, and ammonium were the major ionic species and contributed a large fraction of PM mass in different sizes. In Boston, over 80% of the elements mostly found in the coarse mode included Ca, Mn (road dust), and Cl (sea salt) [10]. In Mexico City, high concentrations of Al, Cr, Ni, Pb, and V were measured in late fall [11]. PCDD/Fs have been a source of much public concern over the last decade due to adverse health effects [6]. The dioxin concentration in the atmosphere could be affected by different seasons because of domestic heating, photolysis, and chemical reactions [12]. In rural Germany, PCDD/F concentrations were higher in the winter than in the summer due to domestic heating [13].
The main objectives of this study were to investigate the characteristics of ambient PMs in an industrial area. The different particle sizes of PMs, including coarse, fine, and ultrafine modes, were measured, as well as water-soluble ions, metallic elements, and dioxins in PMs. The principal component analysis (PCA) is a useful statistical method to assess possible sources of pollution and their contribution to ambient PMs. The results of this study are of great importance to understand the characteristic of PMs in an industrial area and will provide useful information for the future control strategy of ambient PMs.

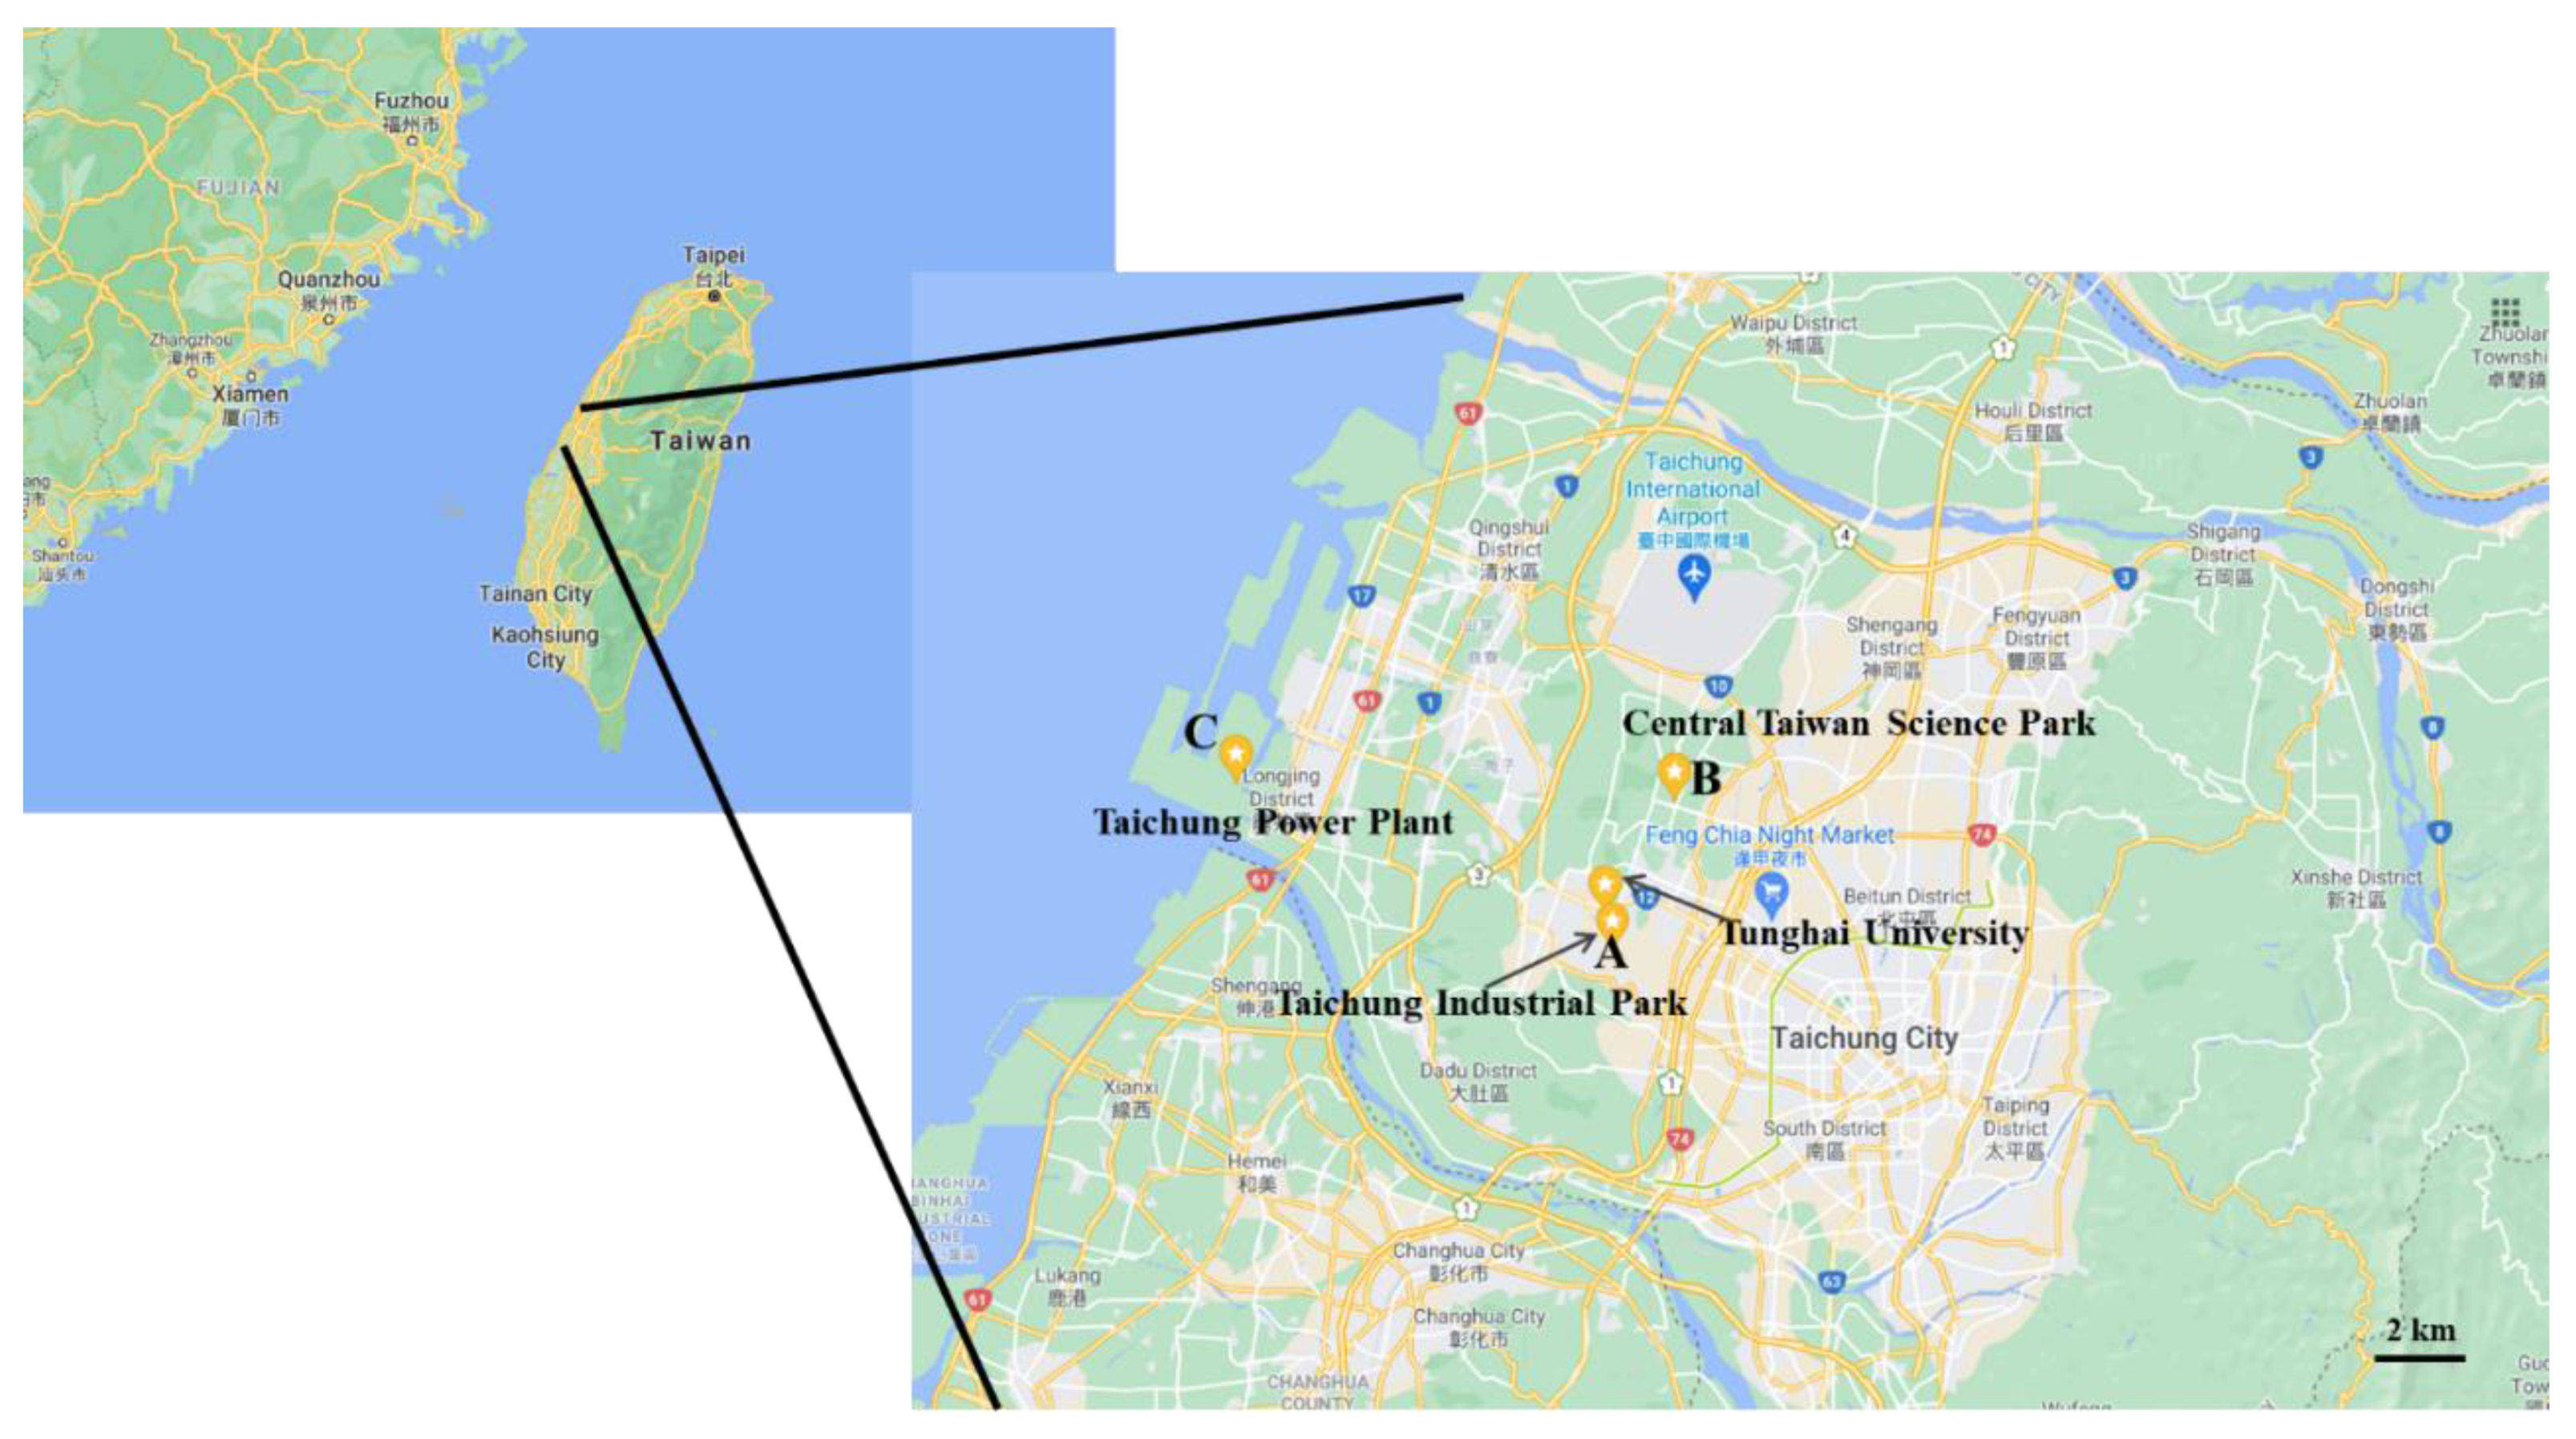
2. Experiment and Methods

2.1. Sampling of PM

The atmospheric particle sampling site was designed according to the understanding of local emission sources. The atmospheric particle samplings were taken at the campus of Tunghai University in central Taiwan as a receptor for assessment. The sampling site was surrounded by Taichung Industrial Park (A: 500 m away), Central Taiwan Science Park (B: 4 km away), and Taichung Power Station (C: 10 km away) (Figure 1). The samples were collected continuously for 24 h on four consecutive days during all four seasons in 2017 and 2018. This study employed two 10-stage and 3-stage cascade impactors from Micro-Orifice Uniform Deposit Impactors (MOUDI) (Model 110-R, 100S4; MSP Corporation, in Shoreview, MN, USA). The corresponding cut-off sizes were 0.056, 0.10, 0.18, 0.32, 0.56, 1.0, 1.8, 3.2, 5.6, 10.0, 18 μm, and 1.0, 2.5, and 18 μm, respectively. A 47 mm Teflon filter was used to collect the samples with a flow rate of 30 L/min. The filters were conditioned at 25 ± 3 °C and 45 ± 5% relative humidity for 24 h before weighing. In addition, PCDD/Fs were collected by a PS-1 sampler that was equipped with quartz fiber filters.

2.2. Analysis of Water-Soluble Ions and Metallic Elements

Water-soluble cations and anions were analyzed by ion chromatography according to the standard method of the Taiwan Environment Protection Agency (EPA): NIEA W415.54B. One-half of each Teflon filter was analyzed by ion chromatography (Metrohm, 883 Basic IC plus). Each filter was put into a polyethylene bottle with 10 mL deionized distilled water and was extracted using an ultrasonic bath for 60 min. The extract was filtered with an acetate filter with 0.22 μm pore size diameter. Five cations (Na+, NH4+, K+, Mg2+, Ca2+) and five anions (F, Cl, NO2, NO3, SO42−) were analyzed by ion chromatography (Metrohm, 883 Basic IC plus). The anion species were detected by Metrosep C 4-150/4.0 (4 × 150 mm) analytical column with an effluent of 1.7 mM HNO3/0.7 mM C7H5NO4 at a flow rate of 0.9 mL/min. The cation species were separated by Metrosep A Supp5-150/4.0 (4 × 150 mm) analytical column with an effluent of 1.0 mM NaHNO3/3.2 mM NaCO3 at a flow rate of 0.7 mL/min. The detection limits were 0.20, 0.18, 0.11, 0.42, 0.36, 0.59, 0.46, 0.48, 0.15, and 0.5 μg/L for Na+, NH4+, K+, Mg2+, Ca2+, Cl, NO3, SO42−, NO2, and F, respectively.
The metals were analyzed by inductively coupled plasma mass spectrometry according to the standard method of NIEA A306.10C of the Taiwan Environment Protection Agency (EPA). The other half of the Teflon filter was analyzed to clarify the metal concentrations. The Teflon filters were placed in a microwave digestion furnace and were heated at 175 °C for 10 min, and then 24 metals (Zn, Cd, Co, Cr, Cu, Fe, Ga, In, Mn, Ni, Pb, Sr, Ag, B, Ba, Bi, Ca, K, Li, Mg, Na, Tl, As, and Al) were analyzed by inductively coupled plasma mass spectrometry (Thermo Scientific, iCAP RQ). The method detection limits for Zn, Cd, Co, Cr, Cu, Fe, Ga, In, Mn, Ni, Pb, Sr, Ag, B, Ba, Bi, Ca, K, Li, Mg, Na, Ti, As, and Al were 0.55, 0.89, 0.66, 0.88, 0.63, 0.92, 0.78, 0.98, 0.55, 0.66, 1.75, 0.56, 0.65, 1.63, 0.37, 0.78, 0.62, 0.57, 0.36, 1.45, 0.45, 1.34, 1.23, and 1.55 ug/L, respectively. For clarity, the samples are divided into coarse (>1.8 µm), fine (0.1–1.8 µm), and ultrafine (<0.1 µm) particles.

2.3. Analysis of PCDD/Fs

Analysis of ambient air samples for PCDD/Fs was performed according to the US EPA Reference Method TO9A [14]. Each sample was spiked with a known amount of the internal standard. All samples were extracted with toluene for 24 h, and this was then followed by a series of sample cleanup and fractionation procedures. The extract was transferred to a vial and further concentrated by a N2 gas stream. High-resolution gas chromatographs/high-resolution mass spectrometers (HRGC/HRMS) were used for PCDD/F analysis. The HRGC (Hewlett-Packard 6970 Series gas, Atalanta, CA, USA) was equipped with a DB-5 fused silica capillary column (L = 60 m, ID = 0.25 mm, film thickness = 0.25 µm) (J&W Scientific, Atalanta, CA, USA) with a splitless injection, while the HRMS (Micromass Autospec Ultima, Manchester, UK) had a positive electron impact (EI+) source. The oven temperature program was set according to the following: start at 150 °C (held for 1 min), then increased by 30 °C/min to 220 °C (held for 12 min), and finally increased by 1.5 °C/min to 310 °C (held for 20 min). Helium was used as the carrier gas. Laboratory blank samples were also sampled and analyzed for quality assurance purposes. The PCDD/F mass of method blank samples for the tetra through hexa-chlorinated homologues ranged from 0.79 to 1.58 pg, while that for the hepta- and octa-chlorinated homologues ranged from 0.19 to 0.70 pg.

2.4. Principal Component Analysis

Principal component analysis (PCA) is widely used as an assessment method to identify possible pollution sources. PCA is applied to characterize large sets of data by re-expressing to a rotated coordinate system in which the eigenvectors of the variance–covariance matrix are calculated to explain as much variance as possible. The principal component score, i.e., the weight of the eigenvector, can be obtained. These scores of the original variables, called the principal component loadings (PC loadings), can illustrate the relationship between the variable and the principal component. The first PC (PC1) will explain most of the variance of the original data variables, whereas the second PC (PC2) will explain fewer of the original data variables. By doing this, the raw data matrix can be reduced to two or three principal component loadings that account for the majority of the variance. The PCA provides qualitative information about the nature of the source profile compositions and the relative importance of a given source to the observed concentration [15]. The main objective of PCA is to reduce a large number of variables to a smaller set of factors that retain most of the information in the original data set [16,17]. Each factor explains the maximum total variance of the data set, and this set is completely uncorrelated with the rest of the data. Thus, the elements with higher factor loading (>0.7) are interpreted as fingerprints of emission sources [18].

3. Results and Discussion

3.1. Particulate Matter Mass Concentrations and Particle Size distribution

The mass concentration of coarse (>1.8 µm), fine (0.1–1.8 µm), and ultrafine (<0.1 µm) particles are listed in Table 1. The order of the mass of particle sizes in spring and summer was coarse particles > fine particles > ultrafine particles, while those in autumn and winter were fine particles > coarse particles > ultrafine particles. The coarse particles were dominant in spring and summer, with an average mass concentration of 16.96 and 12.67 µg/m3, accounting for 47.5 and 45.6%, respectively. The concentration of the fine particles was 15.39 and 18.17 µg/m3 in autumn and winter, accounting for 46.7 and 62.2%, respectively. In summer, the mass levels of coarse, fine, and ultrafine particles were 12.67, 9.14, and 5.96 µg/m3, respectively, and were slightly higher than those in the Shanghai urban summer atmosphere (9.38, 8.82, and 2.02 µg/m3) and the traffic site in Los Angeles (6.3, 5.8, and 1.7 µg/m3) [19,20]. Therefore, the particle concentration in this industrial area is relatively polluted compared to the references [19,20], and the mass level was different in different seasons. In addition, the PM10 concentration was measured as being from 9.26 to 42.59 µg/m3, which is close to values of the previous study in central Taiwan [21]. Our data showed slightly lower values than the PM10 concentration of 13.83–53.67 µg/m3 at Xitun station (one of the EPA air quality monitoring stations) due to the difference between the automatic and manual sampling methods. In addition, the PM10 data were much lower than the Taiwan EAP PM10 regulations (125 µg/m3). The ambient PMs displayed a bimodal distribution, as shown in Figure 2. In spring and summer, the most prominent peak occurred in the range of Dp = 3.2–5.6 μm, and the minor peak was in the range of Dp = 0.18–0.32 μm. In autumn and winter, the most prominent peak occurred in the range of Dp = 0.32–0.56 μm, and the minor peak was in the range of Dp = 3.2–5.6 μm. These results are similar to a previous study in that coarse particles were the predominant components in spring [22]. The cumulative mass fractions for fine particles were 41.8 and 33.4% in spring and summer, respectively, while they accounted for 51.8 and 62.5% in autumn and winter, respectively (Figure 3). This indicated that fine particle pollution is dominant in Taichung in autumn and winter. In addition, both coarse and fine particles were associated with local traffic [23].

3.2. Water-Soluble Ions

Table 2 shows the water-soluble ion content in different particle sizes. The sequence of the major ionic species in the coarse particles was Cl (1.63 ± 0.41 µg/m3) > NO3 (1.62 ± 0.61 µg/m3) > SO42− (1.18 ± 0.29 µg/m3) > Na+ (0.90 ± 0.52 µg/m3), while the sequence was SO42− (2.32 ± 1.03 µg/m3) > Cl (1.37 ± 0.29 µg/m3) > NO3 (1.30 ± 1.02 µg/m3) > NH4+ (1.24 ± 1.01 µg/m3) for the fine particles. Huang et al. (2013) reported that the dominant species were SO42−, Cl, NO3, and NH4+ at an industrial complex site in China. SO42−, NH4+, and NO3 are considered to be the major secondary aerosols by anthropogenic sources [24]. Regarding ultrafine particles, the majority of components were SO42− (0.44 ± 0.20 µg/m3), Cl (0.41 ± 0.25 µg/m3), NO3 (0.26 ± 0.09 µg/m3), and Na+ (0.23 ± 0.28 µg/m3), accounting for 62.05% of the total species. The Cl in both the coarse and fine particles is generally derived from sea spray [25]. Motor vehicle emissions and fossil fuel combustion are the dominant contributors to NO3 and SO42−, respectively [26,27]. In addition, the high concentration of Cl and K+ during the heating season may be due to increased coal combustion [28] and straw burning [29]. Notably, the K+ concentration (0.16–0.35 μg/m3) was not relatively high in this study because the sampling site is 10 km away from Taichung Power Station (see Figure 1). Compared with other cities, water-soluble constituents contributed an average of 11.57% in PM2.5 and 16.98% in PM1in Drug city in India. Notably, similar to our study, the concentrations of SO42− and NO3 were high in all size fractions and accounted for 32.76% and 13.38% of the total mass of the water-soluble ions in PM2.5 [30]. In Palermo, Italy, a large fraction of PM10 (31–47% in weight) and PM2.5 (29% in weight) are made up of water-soluble ions. SO42− and NH4+ concentrations in the PM2.5 fraction were higher than in PM10. SO42−, NH4+, and NO3 ions also constituted 51–63% of the total measured water-soluble ions [31]. In the electronic processing industrial region of Kunshan, China, the most abundant ions are NO3 (30.96 μg/m3), SO42− (24.67 μg/m3), and NH4+ (19.98 μg/m3), and are significantly higher than those found in this study [32].

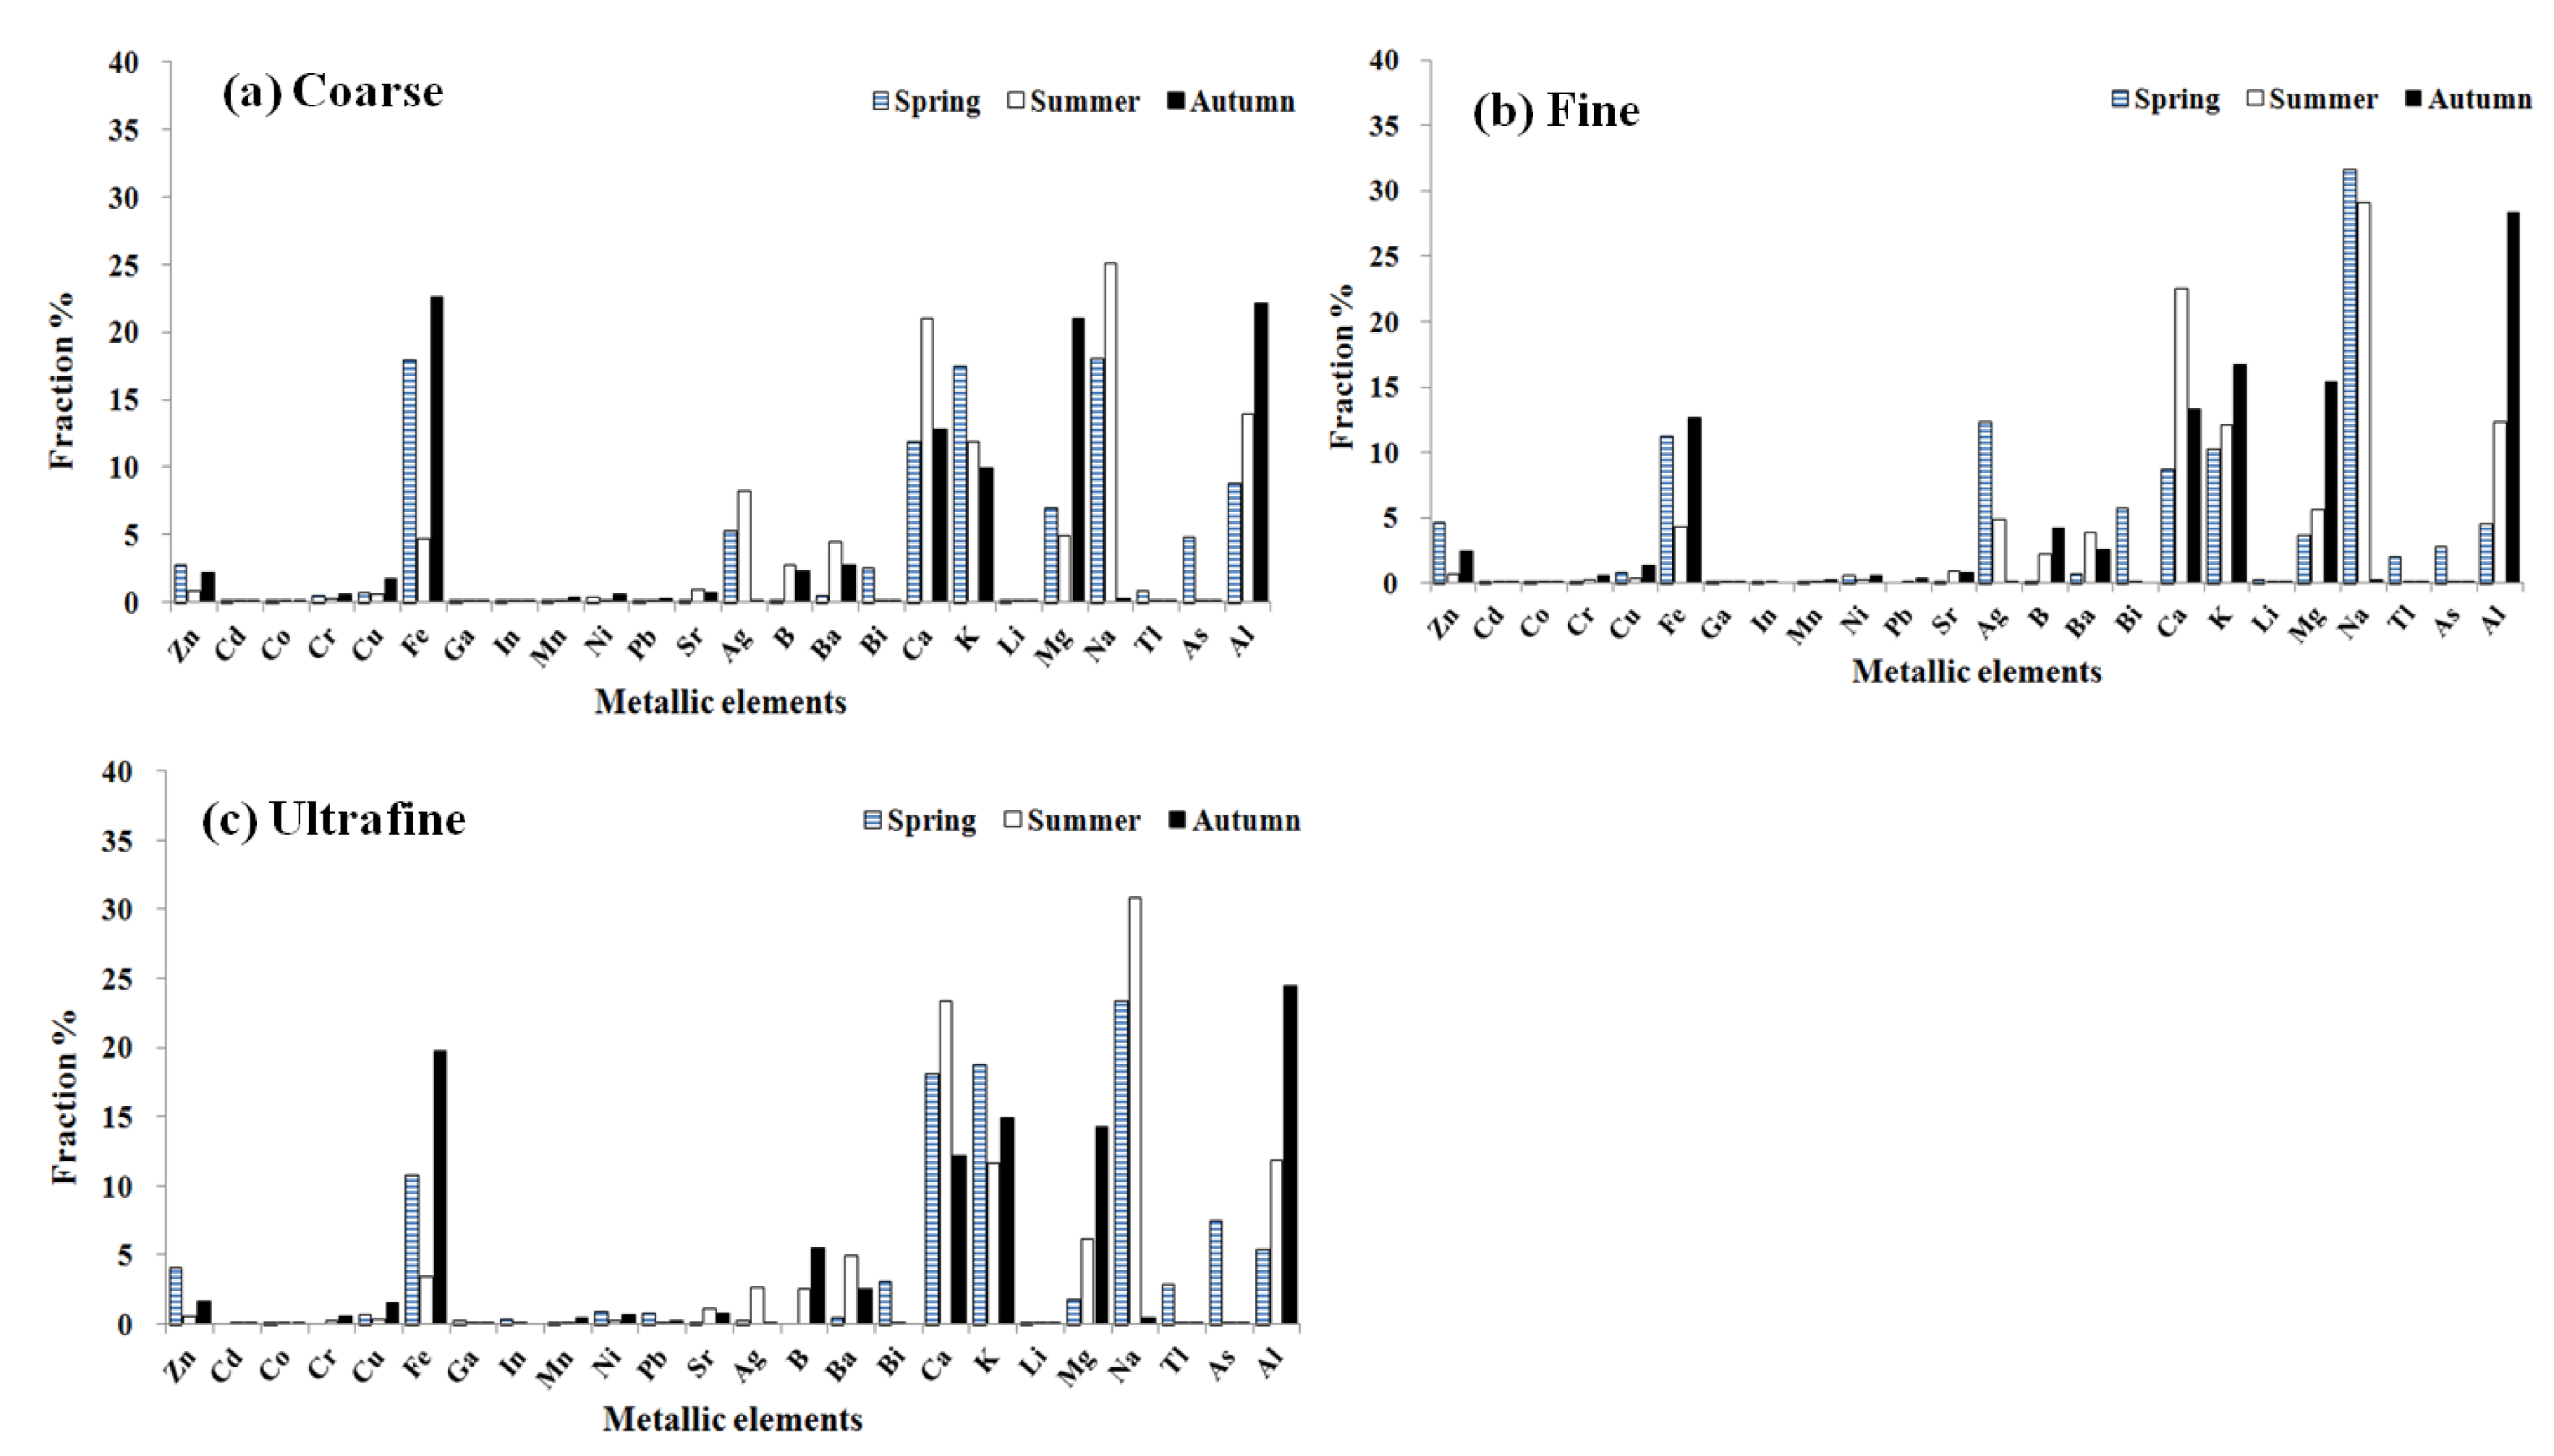
3.3. Metallic Elements

The fraction of metals in coarse particles in different seasons is shown in Figure 4a. The data of the winter samples are not discussed due to contamination. In spring, the dominant species were found to be Na (18.1%), Fe (17.9%), and K (17.5%), contributing about 53.5% of the total metallic elements, while Na (25.1%), Ca (20.9%), and Al (13.9%) accounted for 59.9% of the total components in summer. In autumn, Fe contributed 22.6%, Al 22.2%, and Mg 21.0%, which accumulated to 65.79%. Notably, Na, Fe, Ca, and Al were mainly distributed in coarse particles that may have come from the earth crust elements and road/tires [33]. Figure 4b shows the fractions of metals in fine particles during different seasons. In spring, the most abundant elements were Na (31.6%), Ag (12.3%), and Fe (11.2%), while in summer, the proportions of Na, Ca, and Al were 29.1, 22.5, and 12.4%, respectively. In autumn, the dominant species were found to be Al (28.3%), K (16.7%), and Mg (15.4%), accounting for 60.4% of total elements. In addition, Ag was measured in fine particles that came from anthropogenic sources, such as the iron and steel industries, the cement industry, the combustion of coal and oil, and incineration [34,35,36,37]. According to the national emissions inventory of sources and emissions of silver [37], the principal sources (after emission control, if any) are the iron and steel industries (46%), the cement industry (25.7%), the combustion of coal and oil (13.6%), and incinerators (5.6%). Fe was also the most abundant element that was sourced from the Earth’s crust [38]. Hence, the major elements in the fine particles were Na, Fe, Ca, and Al. In China, the crustal elements Al, Ca, K, Na, Mg, and Fe were most abundant at an industrial site, which may be due to more vehicle emissions and dust resuspension [24]. Figure 4c shows the fraction of metals in ultrafine particles in different seasons. In spring, the dominant species were found to be Na (23.4%), K (18.8%), and Ca (18.1%). On the other hand, the fractions of Na, Ca, and Al were 30.8%, 23.4%, and 11.8%, respectively, in summer. In autumn, the dominant species were Al (24.5%), Fe (19.7%), and K (14.9%), accounting for 59.1% of the total metallic elements. As a result, the most abundant species in the ultrafine particles were Na, K, Ca, and Al.
Pearson’s correlation coefficients of heavy metals in coarse, fine, and ultrafine particles are summarized in Figure 5. By analyzing the value of the correlation coefficient between the metal elements, it is possible to understand the possible sources of air pollution around the sampling point. The significant correlations of Fe-Mn (r = 0.664–0.965), Fe-Zn (r = 0.638–0.826), and Mn-Zn (r = 0.127–0.779) were observed in coarse, fine, and ultrafine particles, with the exception of Zn-Mn (0.127) in ultrafine particles, suggesting possible iron and steelmaking industry activities near the sampling site. This result agrees with a previous study conducted by Mohiuddin et al. (2014), which analyzed the correlation of Fe-Mn-Zn from iron and steel industry sites [39]. In Agra, India, Fe shows a good correlation with Mn (0.605), Pb (0.506), Cr (0.957), and Al (0.580), indicating emissions sources such as the iron or steel industries and crustal materials contribute to ambient air pollution [40]. As shown in Figure 5, Pb displayed significant correlation (p < 0.05) with Zn (r = 0.607–0.684), Cr (r = 0.772–0.914), Fe (r = 0.555–0.720), and Al (r = 0.684–0.737) in both coarse and fine particles, illustrating the contribution of crustal emissions and coal burning. The results of the statistical analyses by PCA showed that the factors loaded with Co, Cd, Pb, Ni, Cu, and Zn are anthropogenic emissions from the combustion of fossil fuels and industry in the ambient air in the central Himalayan region, Nepal [41]. High correlations were observed between Al-Cu (r = 0.718–0.891), Al-Sr (r = 0.782–0.864), Al-K (r = 0.629–0.856), K-Sr (r = 0.380–0.662), and Sr-Cu (r = 0.531–0.726) in coarse, fine and ultrafine particles (see Figure 5), indicating the contribution from the vehicle exhausts. These results are similar to the findings from the Pittsburgh metropolitan area; that is, Al, K, Mo, Sb, Sr, and Cu are related to the characteristics of vehicle emissions. Notably, Mo, Sb, Sr, and Cu are related to brake and tire wear [42]. The sampling site (THU) is near the Central Taiwan Science Park (CTSP), which is a high-tech, industry-intensive area. Therefore, positive correlations were observed between Zn-Cu (r = 0.638–0.782), Cd-Cr (r = 0.679–0.943), Cd-Pb (r = 0.638–0.675), Cu-Ga r = (0.444–0.689), Pb-K (r = 0.493–0.652), and In-Bi (r = 0.409–0.600). Some correlations between two metals (Cd-V, Cu-Ga, Zn-Cu, Mo-As, Pb-As, Pb-Cd, K-V, K-Pb, and Cr-Cd) had a greater confidence level and correlation coefficient in the CTSP [43] because the CTSP is a major contributor to Ga and As in ultrafine particles [44].

3.4. PCDD/F Concentration in Ambient Air

The measured species and concentrations of PCDD/F are listed in Table 3. In 2017, the total concentrations of PCDD/F were 0.2541 and 0.1387 pg/Nm3 in the spring and summer, respectively. The corresponding I-TEQ concentrations were 0.0017 pg I-TEQ/Nm3 in spring and 0.0006 pg I-TEQ/Nm3 in summer 2017. This result is consistent with the findings of atmospheric PCDD/Fs ranging from 0.97 to 255 fg I-TEQ/m3 in 11-year observations in Taiwan [45]. Those values were slightly lower than those in the previous study in southern Taiwan (0.0319–0.0847 pg I-TEQ/Nm3) [46,47]. A study in Southeast Asia showed that the ambient levels were 15 times greater in urban areas than in rural areas, varying from 23 to 565 fg TEQ m−3 [48]. In addition, the present results were much lower than the regulation values of ambient air PCDD/F concentrations in Japan (0.6 pg I-TEQ/Nm3). As shown in Table 3, the main species of measured PCDD/F were 1,2,3,7,8,9- Hexachlorodibenzo-p-dioxin (1,2,3,7,8,9-HxCDD), 1,2,3,4,6,7,8-Heptachlorodibenzo-p-dioxin (1,2,3,4,6,7,8-HpCDD), 1,2,3,7,8,9-Hexachlorodibenzofuran (1,2,3,7,8,9-HxCDF), 2,3,4,6,7,8-Hexachlorodibenzofuran (2,3,4,6,7,8-HxCDF), 1,2,3,4,6,7,8-Heptachlorodibenzofuran (1,2,3,4,6,7,8-HpCDF), and Octachlorodibenzofuran (OCDF), which were similar to the dominant congeners of OCDD, OCDF, 1,2,3,4,6,7,8-HpCDF, and 1,2,3,4,6,7,8-HpCDD in Taiwan’s atmosphere [49].

3.5. Source Identification by Principal Component Analysis

In order to estimate the possible emission sources for PMs, the PCA model was used in this study. The PCA for water-soluble ions is listed in Table 4. The total value was over 79.8% of the explained variance. The PC1 had high loadings of Cl, Na+, F, and Mg2+ with a maximum percentage of variance of 46.94%. The Na+, Mg2+, and Cl may come from sea salt, while F may come from industrial processes [50]. The PC2 consisted of NO3 and SO42, with 32.92% of the total variance comprised of secondary pollutants formed by photochemical reactions [51,52,53].

4. Conclusions

In this study, we successfully characterized the PMs with size distributions, ion and cation compositions, metals, and PCDD/F concentrations in an industry-intensive area in central Taiwan. Coarse particles were dominant in spring and summer, with an average mass concentration of 16.96 and 12.67 µg/m3, accounting for 47.5 and 45.6%, respectively. Fine particle concentrations were 15.39 and 18.17 µg/m3 in autumn and winter, accounting for 46.7 and 62.2%, respectively. The sequence of the major ionic species in the coarse particles were Cl (1.63 µg/m3) > NO3 (1.62 µg/m3) > SO42−(1.18 µg/m3), whereas the sequence was SO42− (2.32 µg/m3) > Cl (1.37 µg/m3) > NO3 (1.30 µg/m3) in the fine particles. In addition, the largest metal components were Na, Fe, Ca, Al, and Mg in different particle sizes. The measured PCDD/F concentrations ranged from 0.0006 to 0.0017 pg I-TEQ/Nm3. According to the results of PCA, the contribution to PMs were associated with sea salt, secondary pollutants, and industrial process.

Author Contributions

Conceptualization, Y.-P.P. and M.-H.L.; methodology, H.-W.L.; investigation, T.-Y.C., Y.-C.L. (Yi-Ching Lin) and C.-H.C.; resources, Y.-C.L. (Yung-Chang Lin); data curation, C.-H.L.; writing—original draft preparation, H.-W.L. and Y.-P.P.; writing—review and editing, H.-W.L., Y.-P.P. and M.-H.L.; supervision, K.-S.C. All authors have read and agreed to the published version of the manuscript.

Funding

This study is funded by Tunghai University, Taiwan.

Institutional Review Board Statement

This study did not involve humans or animals.

Informed Consent Statement

This study did not involve humans.

Data Availability Statement

Data is contained within the article.

Acknowledgments

The authors acknowledge Chia-Hung Chen and Chinh-Chen Liu for their help in sampling and analysis work.

Conflicts of Interest

The authors declare no conflict of interest.

References

  1. WHO. Health Risk of Particulate Matter from Long-Rang Transboundary Air Pollution, Joint WHO/Convention Task Force on the Health Aspects of Air Pollution; World Health Organization Regional Office for Europe: Copenhagen, Denmark, 2006. [Google Scholar]
  2. Hinds, W.C. Aerosol Technology, Introduction, 2nd ed.; John Wiley and Sons: New York, NY, USA, 1999. [Google Scholar]
  3. Tecer, L.H.; Alagha, O.; Karaca, F.; Tuncel, G.; Eldes, N. Particulate matter (PM2.5, PM10-2.5, and PM10) and children’s hospital admissions for asthma and respiratory diseases: A bidirectional case-crossover study. J. Toxicol. Environ. Health Part A 2008, 71, 512–520. [Google Scholar] [CrossRef]
  4. Hughes, L.S.; Cass, G.R.; Gone, J.; Ames, M.; Olmez, I. Physical and chemical characterization of atmospheric ultrafine particles in the Los Angeles area. Environ. Sci. Technol. 1998, 32, 1153–1161. [Google Scholar] [CrossRef]
  5. Harrison, R.M.; Shi, J.P.; Xi, S.; Khan, A.; Mark, D.; Kinnersley, R.; Yin, J. Measurement of number, mass and size distribution of particles in the atmosphere. Philosophical Transactions of the Royal Society of London. Ser. A Math. Phys. Eng. Sci. 2000, 358, 2567–2580. [Google Scholar] [CrossRef]
  6. United States Environmental Protection Agency. Exposure and Human Health Reassessment of 2,3,7,8-Tetrachlorodibenzo-p-Dioxin (TCDD) and Related Compounds National Academy Sciences Review Draft; United States Environmental Protection Agency: Washington, DC, USA, 2000. [Google Scholar]
  7. Lai, C.-H.; Lin, C.-H.; Liao, C.-C. Respiratory deposition and health risk of inhalation of particle-bound heavy metals in the carbon black feeding area of a tire manufacturer. Air Qual. Atmos. Health 2017, 10, 1281–1289. [Google Scholar] [CrossRef]
  8. Han, Y.-J.; Kim, T.-S.; Kim, H. Ionic constituents and source analysis of PM2. 5 in three Korean cities. Atmos. Environ. 2008, 42, 4735–4746. [Google Scholar] [CrossRef]
  9. Tsai, J.-H.; Lin, J.-H.; Yao, Y.-C.; Chiang, H.-L. Size distribution and water soluble ions of ambient particulate matter on episode and non-episode days in Southern Taiwan. Aerosol Air Qual. Res. 2011, 12, 263–274. [Google Scholar] [CrossRef] [Green Version]
  10. Masri, S.; Kang, C.-M.; Koutrakis, P. Composition and sources of fine and coarse particles collected during 2002–2010 in Boston, MA. J. Air Waste Manag. Assoc. 2015, 65, 287–297. [Google Scholar] [CrossRef] [Green Version]
  11. Vega, E.; Ruiz, H.; Escalona, S.; Cervantes, A.; Lopez–Veneroni, D.; Gonzalez–Avalos, E.; Sanchez–Reyna, G. Chemical composition of fine particles in Mexico City during 2003–2004. Atmos. Pollut. Res. 2011, 2, 477–483. [Google Scholar] [CrossRef]
  12. Lohmann, R.; Jones, K.C. Dioxins and furans in air and deposition: A review of levels, behaviour and processes. Sci. Total Environ. 1998, 219, 53–81. [Google Scholar] [CrossRef]
  13. Hippelein, M.; Kaupp, H.; Dörr, G.; McLachlan, M. Testing of a sampling system and analytical method for determination of semivolatile organic compounds in ambient air. Chemosphere 1993, 26, 2255–2263. [Google Scholar] [CrossRef]
  14. United States Environmental Protection Agency. Determination of Polychlorinated, Polybrominated and Brominated/Chlorinated Dibenzo-p-Dioxins and Dibenzofurans in Ambient Air, Compendium Method TO-9A; United States Environmental Protection Agency: Washington, DC, USA, 1999. [Google Scholar]
  15. Hopke, P.K. Review of receptor modeling methods for source apportionment. J. Air Waste Manag. Assoc. 2016, 66, 237–259. [Google Scholar] [CrossRef]
  16. Hopke, P.K. Receptor Modeling in Environmental Chemistry; John Wiley & Sons: Hoboken, NJ, USA, 1985. [Google Scholar]
  17. Marcazzan, G.; Ceriani, M.; Valli, G.; Vecchi, R. Source apportionment of PM10 and PM2. 5 in Milan (Italy) using receptor modelling. Sci. Total Environ. 2003, 317, 137–147. [Google Scholar] [CrossRef]
  18. Saradhi, I.; Prathibha, P.; Hopke, P.K.; Pandit, G.; Puranik, V.J.A.; Research, A.Q. Source apportionment of coarse and fine particulate matter at Navi Mumbai, India. Aerosol Air Qual. Res. 2008, 8, 423–436. [Google Scholar]
  19. Lü, S.; Zhang, R.; Yao, Z.; Yi, F.; Ren, J.; Wu, M.; Feng, M.; Wang, Q. Size distribution of chemical elements and their source apportionment in ambient coarse, fine, and ultrafine particles in Shanghai urban summer atmosphere. J. Environ. Sci. 2012, 24, 882–890. [Google Scholar] [CrossRef]
  20. Ntziachristos, L.; Ning, Z.; Geller, M.D.; Sheesley, R.J.; Schauer, J.J.; Sioutas, C. Fine, ultrafine and nanoparticle trace element compositions near a major freeway with a high heavy-duty diesel fraction. Atmos. Environ. 2007, 41, 5684–5696. [Google Scholar] [CrossRef]
  21. Fang, G.-C.; Chang, C.-N.; Wu, Y.-S.; Fu, P.P.-C.; Yang, C.-J.; Chen, C.-D.; Chang, S.-C. Ambient suspended particulate matters and related chemical species study in central Taiwan, Taichung during 1998–2001. Atmos. Environ. 2002, 36, 1921–1928. [Google Scholar] [CrossRef]
  22. Tsai, H.-H.; Yuan, C.-S.; Hung, C.-H.; Lin, Y.-C. Comparing physicochemical properties of ambient particulate matter of hot spots in a highly polluted air quality zone. Aerosol Air Qual. Res. 2010, 10, 331–344. [Google Scholar] [CrossRef] [Green Version]
  23. Gupta, A.; Nag, S.; Mukhopadhyay, U. Characterisation of PM 10, PM 2.5 and benzene soluble organic fraction of particulate matter in an urban area of Kolkata, India. Environ. Monit. Assess. 2006, 115, 205–222. [Google Scholar] [CrossRef]
  24. Huang, B.; Liu, M.; Ren, Z.; Bi, X.; Zhang, G.; Sheng, G.; Fu, J. Chemical composition, diurnal variation and sources of PM2. 5 at two industrial sites of South China. Atmos. Pollut. Res. 2013, 4, 298–305. [Google Scholar] [CrossRef] [Green Version]
  25. Turnbull, A.B.; Harrison, R.M. Major component contributions to PM10 composition in the UK atmosphere. Atmos. Environ. 2000, 34, 3129–3137. [Google Scholar] [CrossRef]
  26. Huang, R.-J.; Zhang, Y.; Bozzetti, C.; Ho, K.-F.; Cao, J.-J.; Han, Y.; Daellenbach, K.R.; Slowik, J.G.; Platt, S.M.; Canonaco, F. High secondary aerosol contribution to particulate pollution during haze events in China. Nature 2014, 514, 218–222. [Google Scholar] [CrossRef] [Green Version]
  27. Bourotte, C.; Curi-Amarante, A.-P.; Forti, M.-C.; Pereira, L.A.; Braga, A.L.; Lotufo, P.A. Association between ionic composition of fine and coarse aerosol soluble fraction and peak expiratory flow of asthmatic patients in São Paulo city (Brazil). Atmos. Environ. 2007, 41, 2036–2048. [Google Scholar] [CrossRef]
  28. Cheng, H.; Gong, W.; Wang, Z.; Zhang, F.; Wang, X.; Lv, X.; Liu, J.; Fu, X.; Zhang, G. Ionic composition of submicron particles (PM1.0) during the long-lasting haze period in January 2013 in Wuhan, central China. J. Environ. Sci. 2014, 26, 810–817. [Google Scholar] [CrossRef]
  29. Shen, Z.; Cao, J.; Arimoto, R.; Han, Z.; Zhang, R.; Han, Y.; Liu, S.; Okuda, T.; Nakao, S.; Tanaka, S. Ionic composition of TSP and PM2.5 during dust storms and air pollution episodes at Xi’an, China. Atmos. Environ. 2009, 43, 2911–2918. [Google Scholar] [CrossRef]
  30. Deshmukh, D.K.; Deb, M.K.; Tsai, Y.I.; Mkoma, S.L.; Research, A.Q. Water soluble ions in PM2. 5 and PM1 aerosols in Durg city, Chhattisgarh, India. Aerosol Air Qual. Res. 2011, 11, 696–708. [Google Scholar] [CrossRef]
  31. Dongarrà, G.; Manno, E.; Varrica, D.; Lombardo, M.; Vultaggio, M. Study on ambient concentrations of PM10, PM10–2.5, PM2. 5 and gaseous pollutants. Trace elements and chemical speciation of atmospheric particulates. Atmos. Environ. 2010, 44, 5244–5257. [Google Scholar] [CrossRef]
  32. Yan, J.; Lai, C.-H.; Lung, S.-C.C.; Chen, C.; Wang, W.-C.; Huang, P.-I.; Lin, C.-H. Industrial PM2. 5 cause pulmonary adverse effect through RhoA/ROCK pathway. Sci. Total Environ. 2017, 599, 1658–1666. [Google Scholar] [CrossRef]
  33. Wåhlin, P.; Berkowicz, R.; Palmgren, F. Characterisation of traffic-generated particulate matter in Copenhagen. Atmos. Environ. 2006, 40, 2151–2159. [Google Scholar] [CrossRef]
  34. López, J.; Callén, M.; Murillo, R.; Garcia, T.; Navarro, M.; De la Cruz, M.; Mastral, A. Levels of selected metals in ambient air PM10 in an urban site of Zaragoza (Spain). Environ. Res. 2005, 99, 58–67. [Google Scholar] [CrossRef]
  35. Rahn, K.A. A graphical technique for determining major components in a mixed aerosol. I. Descriptive aspects. Atmos. Environ. 1999, 33, 1441–1455. [Google Scholar] [CrossRef]
  36. Zhi, M.; Zhang, X.; Zhang, K.; Ussher, S.J.; Lv, W.; Li, J.; Gao, J.; Luo, Y.; Meng, F. The characteristics of atmospheric particles and metal elements during winter in Beijing: Size distribution, source analysis, and environmental risk assessment. Ecotoxicol. Environ. Saf. 2021, 211, 111937. [Google Scholar] [CrossRef]
  37. United States Environmental Protection Agency. National Emissions Inventory of Sources and Emissions of Silver; Office of Air and Water Programs; United States Environmental Protection Agency: Washington, DC, USA, 1973. [Google Scholar]
  38. Taner, S.; Pekey, B.; Pekey, H. Fine particulate matter in the indoor air of barbeque restaurants: Elemental compositions, sources and health risks. Sci. Total Environ. 2013, 454, 79–87. [Google Scholar] [CrossRef] [PubMed]
  39. Mohiuddin, K.; Strezov, V.; Nelson, P.; Stelcer, E. Characterisation of trace metals in atmospheric particles in the vicinity of iron and steelmaking industries in Australia. Atmos. Environ. 2014, 83, 72–79. [Google Scholar] [CrossRef]
  40. Agarwal, A.; Mangal, A.; Satsangi, A.; Lakhani, A.; Kumari, K.M. Characterization, sources and health risk analysis of PM2.5 bound metals during foggy and non-foggy days in sub-urban atmosphere of Agra. Atmos. Res. 2017, 197, 121–131. [Google Scholar] [CrossRef]
  41. Tripathee, L.; Kang, S.; Huang, J.; Sharma, C.M.; Sillanpää, M.; Guo, J.; Paudyal, R. Concentrations of trace elements in wet deposition over the central Himalayas, Nepal. Atmos. Environ. 2014, 95, 231–238. [Google Scholar] [CrossRef]
  42. Tunno, B.J.; Dalton, R.; Michanowicz, D.R.; Shmool, J.L.; Kinnee, E.; Tripathy, S.; Cambal, L.; Clougherty, J.E. Spatial patterning in PM 2.5 constituents under an inversion-focused sampling design across an urban area of complex terrain. J. Expo. Sci. Environ. Epidemiol. 2016, 26, 385–396. [Google Scholar] [CrossRef] [Green Version]
  43. Chen, H.-W.; Chen, W.-Y.; Chang, C.-N.; Chuang, Y.-H.; Lin, Y.-H. Identifying airborne metal particles sources near an optoelectronic and semiconductor industrial park. Atmos. Res. 2016, 174, 97–105. [Google Scholar] [CrossRef]
  44. Chen, W.-Y.; Chen, H.-W.; Chang, C.-N.; Lin, Y.-H.; Chuang, Y.-H.; Lin, Y.-C.; Research, A.Q. Particles and metallic elements near a high-tech industrial park: Analysis of size distributions. Aerosol Air Qual. Res. 2015, 15, 1787–1798. [Google Scholar] [CrossRef] [Green Version]
  45. Ngo, T.H.; Yang, Y.-H.; Chen, Y.-C.; Pan, W.C.; Chi, K.H. Continuous nationwide atmospheric PCDD/F monitoring network in Taiwan (2006–2016): Variation in concentrations and apportionment of emission sources. Chemosphere 2020, 255, 126979. [Google Scholar] [CrossRef] [PubMed]
  46. Hsieh, L.-T.; Wang, Y.-F.; Kuo, G.-H.; Wang, L.-C.; Chang-Chien, G.-P. Cluster analysis for polychlorinated dibenzo-p-dioxins and dibenzofurans concentrations in southern Taiwan. J. Air Waste Manag. Assoc. 2009, 59, 1474–1480. [Google Scholar] [CrossRef]
  47. Wang, J.B.; Chang-Chien, G.-P.; Lin, W.-Y.; Yeh, J.-H.; Hung, C.-H. A seasonality study of polychlorinated dibenzo-p-dioxins and dibenzofurans in ambient air in Kaohsiung (Taiwan) clustered with metallurgical industries. J. Hazard. Mater. 2009, 162, 103–110. [Google Scholar] [CrossRef]
  48. Zain, S.M.S.M.; Latif, M.T.; Baharudin, N.H.; Anual, Z.F.; Hanif, N.M.; Khan, M.F. Atmospheric PCDDs/PCDFs levels and occurrences in Southeast Asia: A review. Sci. Total Environ. 2021, 783, 146929. [Google Scholar] [CrossRef] [PubMed]
  49. Li, H.-W.; Wu, Y.-L.; Lee, W.-J.; Chang-Chien, G.-P. Fate of polychlorinated dibenzo-p-dioxins and dibenzofurans in a fly ash treatment plant. J. Air Waste Manag. Assoc. 2007, 57, 1024–1031. [Google Scholar] [CrossRef] [Green Version]
  50. Quinn, P.; Miller, T.; Bates, T.; Ogren, J.; Andrews, E.; Shaw, G. A 3-year record of simultaneously measured aerosol chemical and optical properties at Barrow, Alaska. J. Geophys. Res. Atmos. 2002, 107, AAC 8-1–AAC 8-15. [Google Scholar] [CrossRef]
  51. Kleeman, M.J.; Schauer, J.J.; Cass, G.R. Size and composition distribution of fine particulate matter emitted from motor vehicles. Environ. Sci. Technol. 2000, 34, 1132–1142. [Google Scholar] [CrossRef]
  52. Watson, J.G.; Chow, J.C.; Lurmann, F.W.; Musarra, S.P. Ammonium nitrate, nitric acid, and ammonia equilibrium in wintertime Phoenix, Arizona. Air Waste 1994, 44, 405–412. [Google Scholar] [CrossRef]
  53. Seinfeld, J.H.; Pandis, S.N. Atmospheric Chemistry and Physics: From Air Pollution to Climate Change; John Wiley & Sons: Hoboken, NJ, USA, 2016. [Google Scholar]
Figure 1. Schematic diagram of sampling site (Tunghai University) and the surrounding pollution sources (A: Taichung Industrial Park; B: Central Taiwan Science Park; C: Taichung Power Plant). The figure is reproduced from Google map at 24°10′54.1″ N 120°36′24.7″ E.
Atmosphere 12 00926 g001
Figure 2. Particle size distributions: (a) Spring; (b) Summer; (c) Autumn; (d) Winter.
Atmosphere 12 00926 g002
Figure 3. Cumulative mass fractions of particulate matter: (a) Spring; (b) Summer; (c) Autumn; (d) Winter.
Atmosphere 12 00926 g003
Figure 4. The fraction of metallic elements in different seasons (a): Coarse particles; (b): Fine particles; (c): Ultrafine particles.
Atmosphere 12 00926 g004
Figure 5. Correlations among metal elements for (a) coarse, (b) fine, and (c) ultrafine particles in sampling periods. *: p ≤ 0.05.
Atmosphere 12 00926 g005
Table 1. The mass concentration of different particle sizes (coarse, fine, ultrafine particles).
Sampling TimeCoarse Particles
(μg/m3)
Fine Particles
(μg/m3)
Ultrafine Particles
(μg/m3)
MeanSDMeanSDMeanSD
Spring16.963.914.825.73.940.9
Summer12.673.39.141.75.963.7
Autumn14.991.815.393.02.610.5
Winter9.785.818.1710.01.270.1
Table 2. The content of water-soluble ions in different particle sizes.
Water-Soluble IonsCoarse Particles
(μg/m3)
Fine Particles
(μg/m3)
Ultrafine Particles
(μg/m3)
Mean SDMean SDMean SD
Na+0.90±0.520.43±0.390.23±0.28
NH4+0.30±0.101.24±1.010.16±0.05
K+0.35±0.160.32±0.110.16±0.21
Ca2+0.47±0.180.25±0.170.09±0.08
Mg2+0.20±0.170.11±0.100.04±0.05
F0.35±0.280.35±0.250.13±0.13
Cl1.63±0.411.37±0.290.41±0.25
NO31.62±0.611.30±1.020.26±0.09
SO421.18±0.292.32±1.030.44±0.20
Table 3. PCDD/F concentration (pg/m3) in ambient air.
PCDD/FSpring, 2017Summer, 2017
2,3,7,8-TeCDDNDND
1,2,3,7,8-PeCDDNDND
1,2,3,4,7,8-HxCDDNDND
1,2,3,6,7,8-HxCDDNDND
1,2,3,7,8,9-HxCDDNDND
1,2,3,4,6,7,8-HpCDD0.03770.0177
OCDD0.10420.0488
2,3,7,8-TeCDFNDND
1,2,3,7,8-PeCDFNDND
2,3,4,7,8-PeCDFNDND
1,2,3,4,7,8-HxCDFNDND
1,2,3,6,7,8-HxCDFNDND
1,2,3,7,8,9-HxCDF0.0068ND
2,3,4,6,7,8-HxCDF0.0013ND
1,2,3,4,6,7,8-HpCDF0.03410.0288
1,2,3,4,7,8,9-HpCDFNDND
OCDF0.06990.0434
PCDDs0.11220.0722
PCDFs0.14180.0665
PCDDs/PCDFs ratio1.260.92
Total PCDD/DFs0.25410.1387
PCDDs I-TEQ a0.00050.0002
PCDFs I-TEQ a0.00120.0003
PCDDs/PCDFs(TEQ) ratio0.390.68
I-TEQ a0.00170.0006
a The unit is pg I-TEQ/Nm3.
Table 4. Principal component analysis (PCA) for water-soluble ions. The bold means it emphasize the strong related ions to each Factors.
Water-Soluble Ions Factor 1Factors 2
Na+0.8310.324
NH4+−0.7110.657
K+−0.4490.138
Ca2+0.184−0.365
Mg2+0.7810.064
F0.821−0.110
Cl0.8700.109
NO30.1630.950
SO42−0.4870.719
% of Variance 46.94232.921
Cumulative %46.94279.864
Possible sourcesSea salt
Industrial process
Secondary pollutants
Publisher’s Note: MDPI stays neutral with regard to jurisdictional claims in published maps and institutional affiliations.

