Article

Chemical Composition of Gas and Particle Phase Products of Toluene Photooxidation Reaction under High OH Exposure Condition

1
JC School of Public Health and Primary Care, The Chinese University of Hong Kong, Hong Kong, China
2
Earth System Science Programme, The Chinese University of Hong Kong, Hong Kong, China
3
Department of Civil and Structural Engineering, The Hong Kong Polytechnic University, Hong Kong, China
4
State Key Laboratory of Loess and Quaternary Geology, Institute of Earth Environment, Chinese Academy of Sciences, Xi’an 710061, China
*
Author to whom correspondence should be addressed.
Atmosphere 2021, 12(7), 915; https://doi.org/10.3390/atmos12070915
Submission received: 2 June 2021 / Revised: 5 July 2021 / Accepted: 9 July 2021 / Published: 15 July 2021

Abstract

:
In the current study, the photooxidation reaction of toluene (C7H8) was investigated in a Potential Aerosol Mass Oxidation Flow Reactor (PAM OFR). The hydroxyl radical (OH) exposure of toluene in the PAM OFR ranged from 0.4 to 1.4 × 10¹² molec cm−3 s, which is equivalent to 3 to 12 days of atmospheric oxidation. A proton transfer reaction-mass spectrometer (PTR-MS) and a scanning mobility particle sizer (SMPS) were used to study the gas-phase products formed and particle number changes of the oxidation reaction in PAM OFR. The secondary organic aerosol (SOA) formed in the PAM OFR was also collected for off-line chemical analysis. Key gas-phase reaction products of toluene, including glyoxal, methyl glyoxal, unsaturated carbonyl compounds, and benzaldehyde, were identified by the PTR-MS. Second generation products, including acetic acid, formaldehyde, formic acid, and acetaldehyde, were also detected. By comparing the mass spectrums obtained under different OH exposures and relative humidity (RH), changes in the two parameters have minimal effects on the composition of gas-phase products formed, expect for the spectrum obtained at OH exposure of 0.4 × 1012 cm−3 s and RH = 17%, which is slightly different from other spectrums. SMPS results showed that particle mass concentration increases with increasing OH exposure, while particle number concentration first increases and then decreases with increasing OH exposure. This result probably suggests the formation of oligomers at high OH exposure conditions. Off-line chemical analysis of the SOA sample was dominated by C4 diacids, including malic acid, citramalic acid, and tartaric acid. The well-known toluene SOA marker 2,3-Dihydroxy-4-oxopentanoic acid, as well as 2,3-dihydroxyglutaric acid, which has not been identified in previous toluene photooxidation experiments, were also detected in the SOA sample. Our results showed good agreements with the results of previous smog chamber studies of toluene photooxidation reaction, and they suggested that using PAM OFR for studies of oxidation reaction of different VOCs can be atmospherically relevant.

1. Introduction

Formation of secondary organic aerosol (SOA) in the atmosphere has become the emerging topic in atmospheric science and chemistry in the recent decades. It has been shown in previous studies that SOA is associated with air pollution and haze events [1], which affects the global climate forcing by serving as a cloud condensation nuclei and participating in heterogeneous chemical reactions [2,3]. It has also been shown that exposure to SOA is associated with different adverse effects on human health [4]. SOA makes up a large fraction of the submicron-sized atmospheric organic aerosol (OA) [5], and these OA can trigger respiratory and cardiovascular diseases [6,7]. Therefore, understanding the formation mechanism of SOA is crucial to both the study of atmospheric processes and public health. A myriad of studies have attempted to reveal the physical and chemical reactions leading to the formation of SOA from their precursor species [8,9,10]. In spite of the number of studies, the understanding of the formation processes of SOA in the atmospheric is still far from complete. For example, model predictions based on the experimental yield of SOA generally underestimate the mass loading of SOA in ambient measurements [11,12]. The discrepancy between empirical and observed value mainly arise from the uncertain emission inventory of low volatility SOA precursors [13,14], and the heterogenous and ageing reactions involved in SOA formation [15]. Therefore, it can be foreseen that study of SOA formation mechanism will continue to play an important role in atmospheric studies in the coming decades.
There are many challenges in the study of SOA formation from their VOC precursors. For example, the abilities of the experimental setup to simulate atmospheric conditions, and the time scale of the reactions. In the last few decades, SOA experiments were almost exclusively conducted in smog chambers. The advantage of using smog chamber to simulate atmospheric oxidation reaction of VOCs leading to the formation of SOA is that it can reasonably simulate the conditions in the atmosphere, i.e., being atmospherically relevant. However, there are limitations of smog chamber experiments. For example, loss of particles to the chamber wall hindered the ability of using smog chamber to study reactions with time scales up to several days or weeks [16]. In the recent years, the use of oxidation flow reactor (OFR) to study atmospheric processes has become more and more popular. In particular, Potential Aerosol Mass (PAM) OFR, which is the only commercialized OFR on market, has been used by many research groups for their studies. The concept of PAM was first introduced by Kang et al. [17], which utilizes extreme amounts of oxidant (predominantly hydroxyl radical OH) to simulate photochemical ageing processes in the atmosphere. The advantages of PAM included short experimental time, low wall loss, the ability to simulate oxidation processes with long lifetimes, and ability to deploy for field study. A comparison of key functionalities between smog chamber and OFR was given in Table 1. With the advantages of the PAM OFR, it becomes possible and easier than before to assess the effect of photochemical ageing on primary organic aerosol and VOCs, as well as some complex sources, such as vehicle emissions [18,19].
With the aforementioned advantages, more and more studies used OFR rather than smog chamber as their tool to investigate the atmospheric oxidation reactions. For example, Lambe et al. [20] assessed the chemical composition of SOA formed from fourteen different biogenic and anthropogenic precursors, Molteni et al. [21] studied the formation of highly oxygenated compound from aromatic VOC precursors, Palm et al. [22] deployed their PAM OFR on field to study the SOA formation of ambient forest air, and Ma et al. [23] investigated the role of NOx in the formation of sulphate, nitrate, and ammonium ion in air by PAM OFR. In spite of the extensive application of PAM OFR to study atmospheric reaction, concerns remained on its ability to truly simulate the conditions in atmosphere, i.e., if the results from PAM OFR are atmospherically relevant. Lambe et al. [24] compared the chemical compositions of SOA generated by a smog chamber and PAM OFR using similar OH exposure. Their study concluded that the AMS mass spectrums for the SOA generated by the two reactors were similar, which suggested that the SOA generated by PAM OFR is actually atmospherically relevant. In a recent review article, Peng and Jimenez [16] outlined the detailed chemistry that happens in a PAM OFR, and summarized the experimental conditions and requirements that make the chemical reactions in PAM OFR atmospherically relevant. Therefore, with extra attention and careful experimental designs, PAM OFR can be used as an alternative tool in studying atmospheric chemistry.
Although there are several previous investigations of the chemical compositions of SOA formed in PAM OFR [21,25,26], most of these studies focused on the analysis of the elemental composition (e.g., O/C ratio and f44 value) of the SOA. Direct speciation of the SOA generated by PAM OFR using well established offline analytical methods (e.g., GC or LC/MS) was limited [27]. The current study aimed at investigating the gas phase products and SOA compositions of toluene photooxidation reaction in PAM OFR. Although the photooxidation reaction of toluene is well studied in smog chambers, investigations of its aged products are scarce. Toluene is an important anthropogenic VOC commonly found in combustion processes, and therefore understanding its oxidation and ageing mechanism is crucial in predicting the SOA loading in urban environments. Since PAM OFR can generate high concentration of OH radicals, it can be used to investigate the atmospheric ageing process of toluene in this study. The gas phase products formed in PAM OFR was monitored by a proton transfer reaction-mass spectrometer (PTR-MS) and SOA samples were collected for offline chemical characterization. The results obtained were used to examine the relationship between the gas phase and particle phase products observed. Moreover, the changes in gas phase product composition under different experimental conditions, such as OH exposure and relative humidity (RH), were assessed. The overall result of this study enhances our understanding of the photochemical ageing process of toluene and to assess the ability of PAM OFR to study atmospheric processes by comparing the results with related chamber studies.

2. Methodology

2.1. PAM OFR

The PAM OFR used in the current study is a Penn State PAM, which is developed by the Pennsylvania State University. The reactor is 45.7 cm long, with an inner diameter of 19.7 cm, resulting in a volume of around 13 L. A UV lamp (BHK Inc., Ontario, CA, USA) is mounted inside the reactor, providing UV radiation at 254 nm only. PAM OFR of this type is usually termed OFR254 to differentiate from its counterpart OFR185, of which the UV lamp inside the reactor produce radiation at both 185 nm and 254 nm. Detailed principals and characterization of the PAM OFR in the current study can be found elsewhere [17,28]. Briefly, the main oxidant in PAM, OH radical, is generated inside the reactor by the reaction between water vapor and excited oxygen [O(1D)] atom. The excited oxygen [O(1D)] atom is produced as a result of the irradiation of O3 by UV light at 254 nm inside the reactor. O3 is externally generated, and injected to the reactor in prior to the injection of VOC.

2.2. Experimental Setup

A schematic diagram of the experimental setup is given in Figure 1. N2 and O2 were injected to the PAM OFR at a ratio of 4:1 to mimic the composition of air. O3 is generated by passing through a stream of O2 through an ozone generator (1000BT-12, ENALY, Japan). The ozone concentration was measured by an ozone monitor (Model 202, 2B Technologies, Boulder, CO, USA). RH in the PAM is controlled by the amount of N2 and O2 passing through a water bubbler. The RH and temperature of the outflow of the PAM OFR were monitored by a temperature/humidity sensor (HMP 110, Vaisala Inc, Finland). Toluene used in the current study is prepared in gas phase (Scientific Gas Engineering Co., Ltd., Hong Kong, China), and is directly injected to the PAM OFR. In experiments using seed particle, ammonium sulphate (≥99%, Missouri Sigma-Aldrich, Inc., St. Louis, MO, USA) powder was dissolved in milli-Q water (18.2 MΩ-cm) and then atomized by an atomizer (3076, TSI, Shoreview, MN, USA). The atomized (NH4)2SO4 stream was directed through a diffusion dryer before entering the PAM OFR. The flow of all the aforementioned gases were controlled by a mass flow controller (MFC) system consisting of 8 mass flow controllers (G-series, MKS instruments, Andover, MA, USA) of different range of flow rate. The total flow of gases in the PAM OFR was maintained at 8 L min−1 for all experiments. The experiment list with all experimental conditions were given in Supporting Information. Briefly, three sets of experiments with different RH were carried out without using seed particles. For each set of RH, different OH exposure was achieved by varying the amount of O3 generated externally. In addition to the aforementioned three sets of experiments, two sets of experiments with different RH were also carried out using (NH4)2SO4 seed particle in order to find out the effect of seed particle on the composition of gas phase products.
To study the gas phase products generated in PAM OFR, a proton transfer reaction-mass spectrometer (PTR-QMS 300, IONICON ANALYTIK GES.M.B.H., Innsbruck, Austria) was connected to the outlet of the reactor. The PTR-MS was run in scan mode to record all peaks from 21 to 250 m/z with resolution of 1 amu. To check if the PTR-MS was capturing the right m/z, the presence of peaks at m/z = 30 (NO+ ion) and m/z = 93 (toluene ion) were checked before and after the injection of toluene respectively. Particle number and mass concentration at the outlet of the PAM OFR was monitored by a scanning mobility particle sizer (SMPS, TSI, Shoreview, MN, USA). One set of SOA sample was collected for off-line GC/MS analysis. These samples were collected on five quartz filters (47 mm, Global Life Sciences Solutions USA LLC, Marlborough, MA, Whatman, USA) under the same experimental conditions (OH exposure = 1.4 × 10¹² molec cm−3 s and in the presence of (NH4)2SO4 seed). The sample collection time for each filter was around 6 h, and an average of 1.6 mg of SOA sample was collected on each filter. An ozone denuder was installed before the filter to prevent prolonged oxidation of SOA sample on the filter by O3. During the study of gas phase products, blank quartz filters were put in the two filter holders to protect the pump from being stuck by the SOA generated in PAM OFR.

2.3. Calibration of OH Concentration in PAM OFR

Since direct measurement of OH concentration is not available in the current study, indirect determination and calibration of OH concentration is needed. The calibration of OH concentration was carried out by the method described in Lambe et al. [24], using SO2 gas. Briefly, the flow rate of PAM was set to 8 L/min, resulting in a residence time of approximately 100 s. SO2 gas was delivered to the PAM together with O3 gas. Since the reaction between SO2 and O3 was insignificant compare to that between SO2 and OH [29], any decrease in SO2 concentration was assumed to be caused by the reaction with the OH radical. By measuring the SO2 at different O3 level, the OH concentration could be estimated by the decay of SO2 concentration via the following equation.
OH exp = 1 k SO 2 + OH ln SO 2 i SO 2 f
where kSO2+OH = 9 × 10⁻¹³ cm3 molec −1 s−1 at 298K, [SO2]i = SO2 concentration when O3 concentration is zero, and [SO2]f = SO2 concentration at a certain O3 level. Since this calibration of OH concentration is RH sensitive (OH is produced by the reaction between [O(1D)] and water vapor), calibrations were carried out at four RH levels close to the RH used in our experiments. OH exposure calibrated span from 0.4 to 1.5 × 10¹² molec cm−3 s, which is equivalent to 3 to 12 days of atmospheric oxidation assuming the OH concentration in the atmosphere to be 1.5 × 10⁶ molec cm−3 [30]. The calibration curves were given in Supporting Information Figure S1. After the calibration, OH exposure inside the PAM OFR could be controlled by the amount of O3 injected.

2.4. GC/EI-MS Analysis

The filter samples for SOA characterization were analyzed by a Gas Chromatography/Electron Ionization-Mass Spectrometry (GC/EI-MS) system. One-fourth of the quartz filter sample was cut and extracted with dichloromethane and methanol (2:1, v/v) under ultrasonication. The extracts were concentrated using a rotary evaporator under vacuum conditions and then dried by pure nitrogen gas. The dried extract was reacted with N,O-bis-(trimethylsilyl) trifluoroacetamide (BSTFA) at 70 °C for 3 hours, and the resulting derivatives were determined using gas chromatography/electron ionization mass spectrometry (GC/EI-MS).
The GC/EI-MS analysis was performed by an Agilent 7890A GC coupled with an Agilent 5975C MSD. The GC separation was carried out on a DB-5MS fused silica capillary column with the GC oven temperature programmed from 50 °C (2 min) to 120 °C at 15 °C min−1 and then to 300 °C at 5 °C min−1 with a final isothermal hold at 300 °C for 16 min. The sample was injected in a splitless mode at an injector temperature of 280 °C, and scanned from 50 to 650 Daltons using electron impact (EI) mode at 70 eV.
GC/MS response factors of 2,3-dihydroxy-4-oxopentanoic acid, malic acid, and tataric acid were determined using authentic standards. Response factors of citramalic acid and 2,3-dihydroxy-glutraric acid were substituted by those of succinic acid and tartaric acid, respectively, because the authentic standards are not commercially available. No significant contamination (<5% of those in the samples) was found in the blanks. Recoveries of the organic compounds represented by n-alkanes and PAHs were ranged from 80% to120%. Data presented were corrected for the field blanks but not corrected for the recoveries.

3. Result and Discussion

3.1. Gas Phase Product Identification by PTR-MS

3.1.1. Peak Identification

Figure 2 depicted the PTR-MS spectrum for the gas phase products observed in the three sets of experiments without seed particle. These spectrums were obtained by subtracting the spectrum at a certain OH exposure by the spectrum at OH exposure = 0 molec cm−3 s. Therefore, the spectrums shown in Figure 2 correspond to the products formed in the PAM OFR. Signals that were captured in all three spectrums in Figure 2 are m/z = 31, 43, 45, 47, 59, 61, 73, 99, and 107. By comparing the results with previous studies [31,32,33,34], the National Institute of Standards and Technology (NIST) database, and the Master Chemical Mechanism (MCM) version 3.3.1 database, the aforementioned peaks were assigned as formaldehyde (m/z = 31), acetyl radical (m/z = 43), acetaldehyde (m/z = 45), formic acid (m/z = 47), glyoxal (m/z = 59), acetic acid (m/z = 61), methyl glyoxal (m/z = 73), unsaturated carbonyls (m/z = 99), and benzaldehyde (m/z = 107). The proposed mechanism for the formation of these products were outlined in Figure 3. Benzaldehyde was produced through the abstraction of a methyl group hydrogen in toluene (route 2 in Figure 3), while other products were formed through the hydrogen abstraction from the benzene ring, resulting in the formation of a bicyclic peroxy radical. The bicyclic peroxy radical then decomposed to form two groups of first-generation products. The first group of products are glyoxal and unsaturated carbonyls with a molecular weight 98, and the second group of products are methyl glyoxal and unsaturated carbonyls with a molecular weight of 84. Further oxidation of the aforementioned first-generation products results in the production of acetaldehyde, formaldehyde, formic acid, and acetic acid. In the current study, the signal of m/z = 99 was very weak while signal of m/z = 85 was under detection limit. It has been shown in a previous study by Arey et al. [35] that the yields of unsaturated carbonyls were significantly lower than their smaller 1,2-dicarbonyl counterparts, which agree with the results of the current study. The weak signal of m/z = 99 and the absence of m/z = 85 signal showed that these unsaturated carbonyls may undergo rapid oxidation right after their formation in the PAM OFR. A rapid degradation of unsaturated carbonyls is also supported by the observation that spectrums depicted in Figure 2 were dominated by second generation products, which are the oxidation products of the unsaturated carbonyls.

3.1.2. Effect of OH Exposure on the Composition and Yield of Gas Phase Products

The effect of oh exposure on the composition of the gas phase products can also be examined in Figure 2. The blue scale of the color legend represents the OH exposure at which the peak was identified. The lighter the color, the higher the OH exposure. In general, most products observed at low OH exposure (0.4–0.8 × 10¹² molec cm−3 s) were also observed at high OH exposure (1.2 × 10¹² molec cm−3 s or above) conditions. One exceptional case was found at m/z = 107 in Figure 2. This peak represents benzaldehyde, and its signal presents at low OH exposure but not at high OH exposure condition. The reason for the aforementioned observation can be explained by the formation and reaction mechanism of benzaldehyde in toluene oxidation reaction. As elucidated in the previous section, benzaldehyde is formed as a result of the abstraction of methyl group hydrogen followed by reaction with peroxy and OH radicals (route 2 in Figure 3). At high OH exposure conditions, benzaldehyde further oxidized to low volatility products (e.g., benzoic acid), which was not detected by PTR-MS. Therefore, benzaldehyde was observed in low OH exposure conditions, while its signal disappeared at high OH exposure conditions.
To quantify the similarities between gas phase products formed under different experimental conditions, the dot products between the mass spectrums obtained in different conditions were calculated. The dot product approach has been used to quantify the similarities between mass spectrums in previous studies [24,36]. To calculate the dot product of a spectrum, the intensity of a peak is divided by the square root of the sum of the squares of the intensity of all peaks in the spectrum. The result of this normalization process is represented by a vector A, where A = [a1, a2, a3, …], and a1, a2, a3, … represent the normalized intensity of peaks at each m/z in the spectrum. When two vectors, A and B, were obtained by the aforementioned normalization method from two different mass spectrums, the dot product of A and B, denoted by A   ·   B = i = 1 n a i b i , can be used to quantify the similarities between the two spectrums. When A   ·   B = 0 , the two spectrums are orthogonal. When A   ·   B = 1 , the two spectrums are identical.
The results of dot products calculated between different OH exposure and RH were depicted as a correlogram in Figure 4. In general, most of the dot products between spectrums obtained under same RH but different OH exposures are very close to 1, as shown by the deep blue color boxes. One exceptional case was observed at RH = 17% with OH exposure of 0.40 × 10¹² molec cm−3 s, which is the lowest OH exposure in the current study. The spectrum under this condition showed a decrease in dot product with increasing OH exposure, as depicted by the gradual change of color from deep blue to deep yellow. The above observations suggest that except for the lowest OH exposure in this study (OH exposure = 0.40 × 1012 cm−3 s), the OH exposure range investigated by our experiments is high enough to reach the “final stage” of gas-phase oxidation, and further increase in OH exposure will not change the gas-phase product compositions significantly. At OH exposure = 0.40 × 1012 cm−3 s, the oxidation reaction of toluene does not reach the “final stage”, and therefore its gas-phase product composition is different from other experimental conditions in the current study.
Although OH exposures in the current study have minimal effects on the composition of gas-phase products, they significantly affect the yield of the gas-phase products observed. Figure 5 visualized the effect of OH exposure on the major gas phase products observed in the Figure 2. In general, an increase in OH exposure will increase the yield of the gas phase products observed, except for benzaldehyde. Figure 5 divided the products into two groups, namely the first generation products and second generation products. It can be observed that for second generation products, an increase of OH exposure causes a smooth increase of the signal of the products, while for first generation products, a more complicated trend was shown. The main reason for this observation is that first generation products serve as the product of toluene photooxidation as well as the percussors of the second generation products, and therefore when its production rate is lower than the consumption rate, a decrease on the signal of the first generation products will be observed.

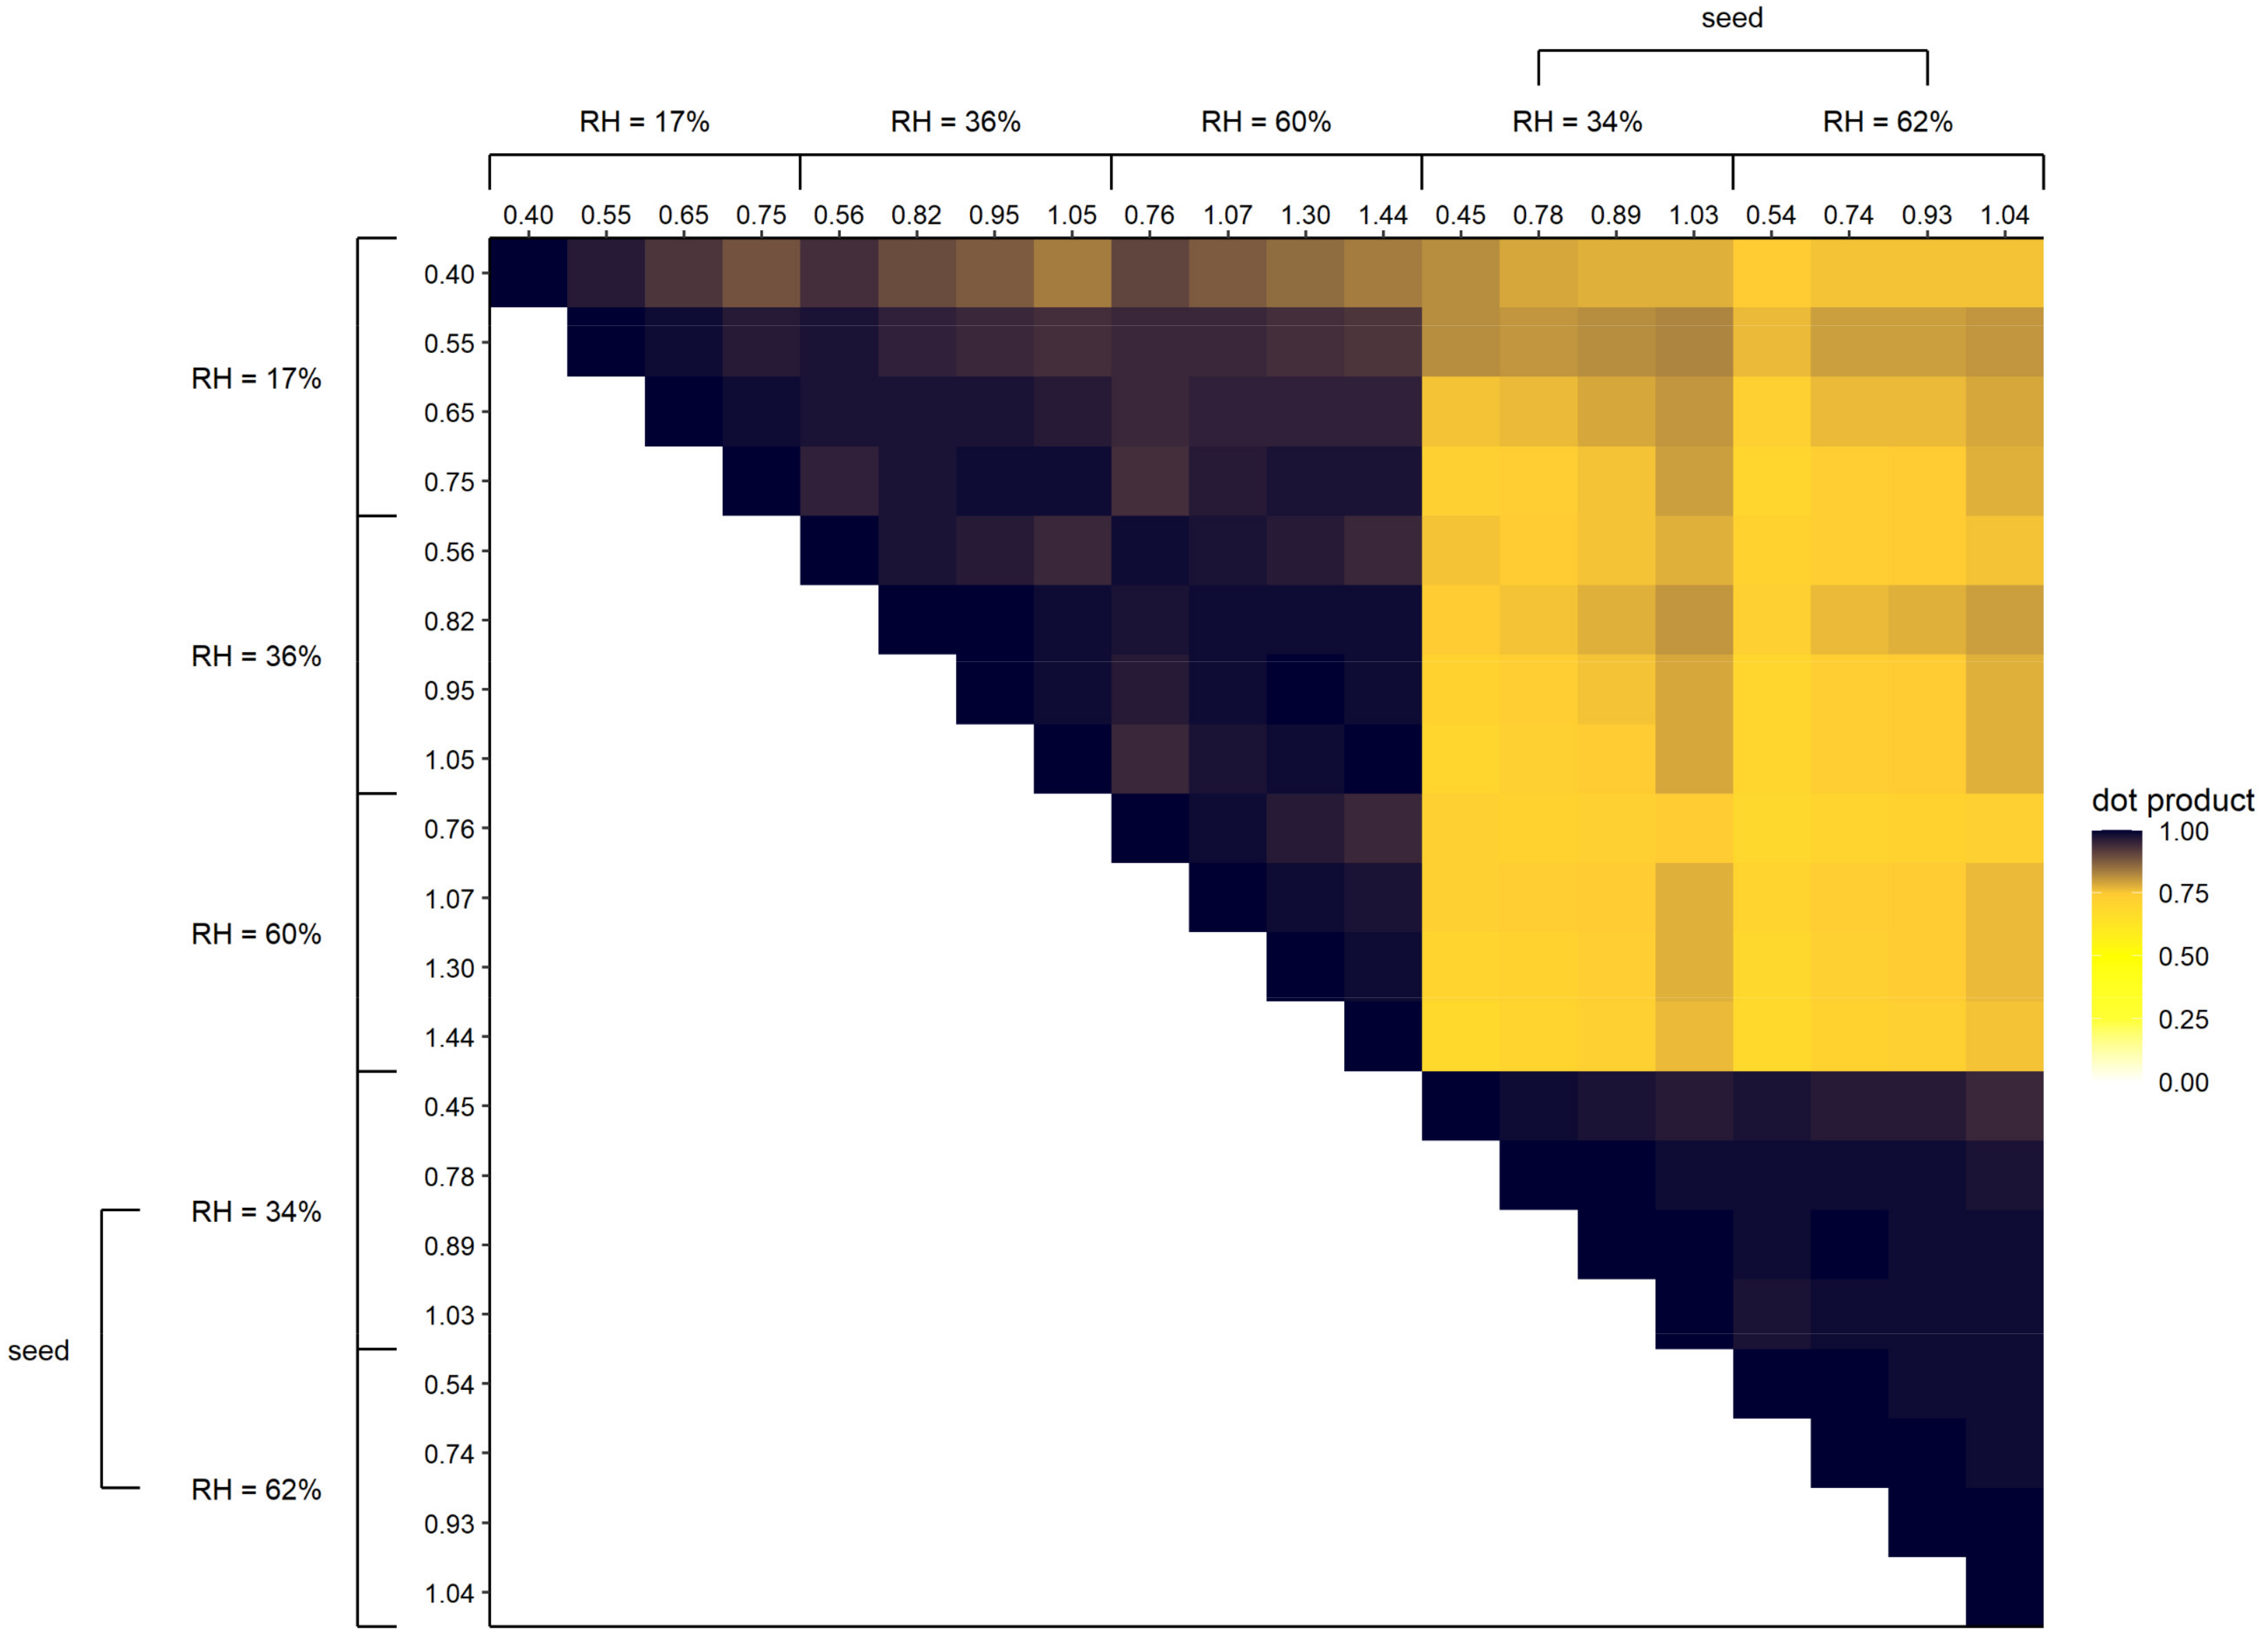
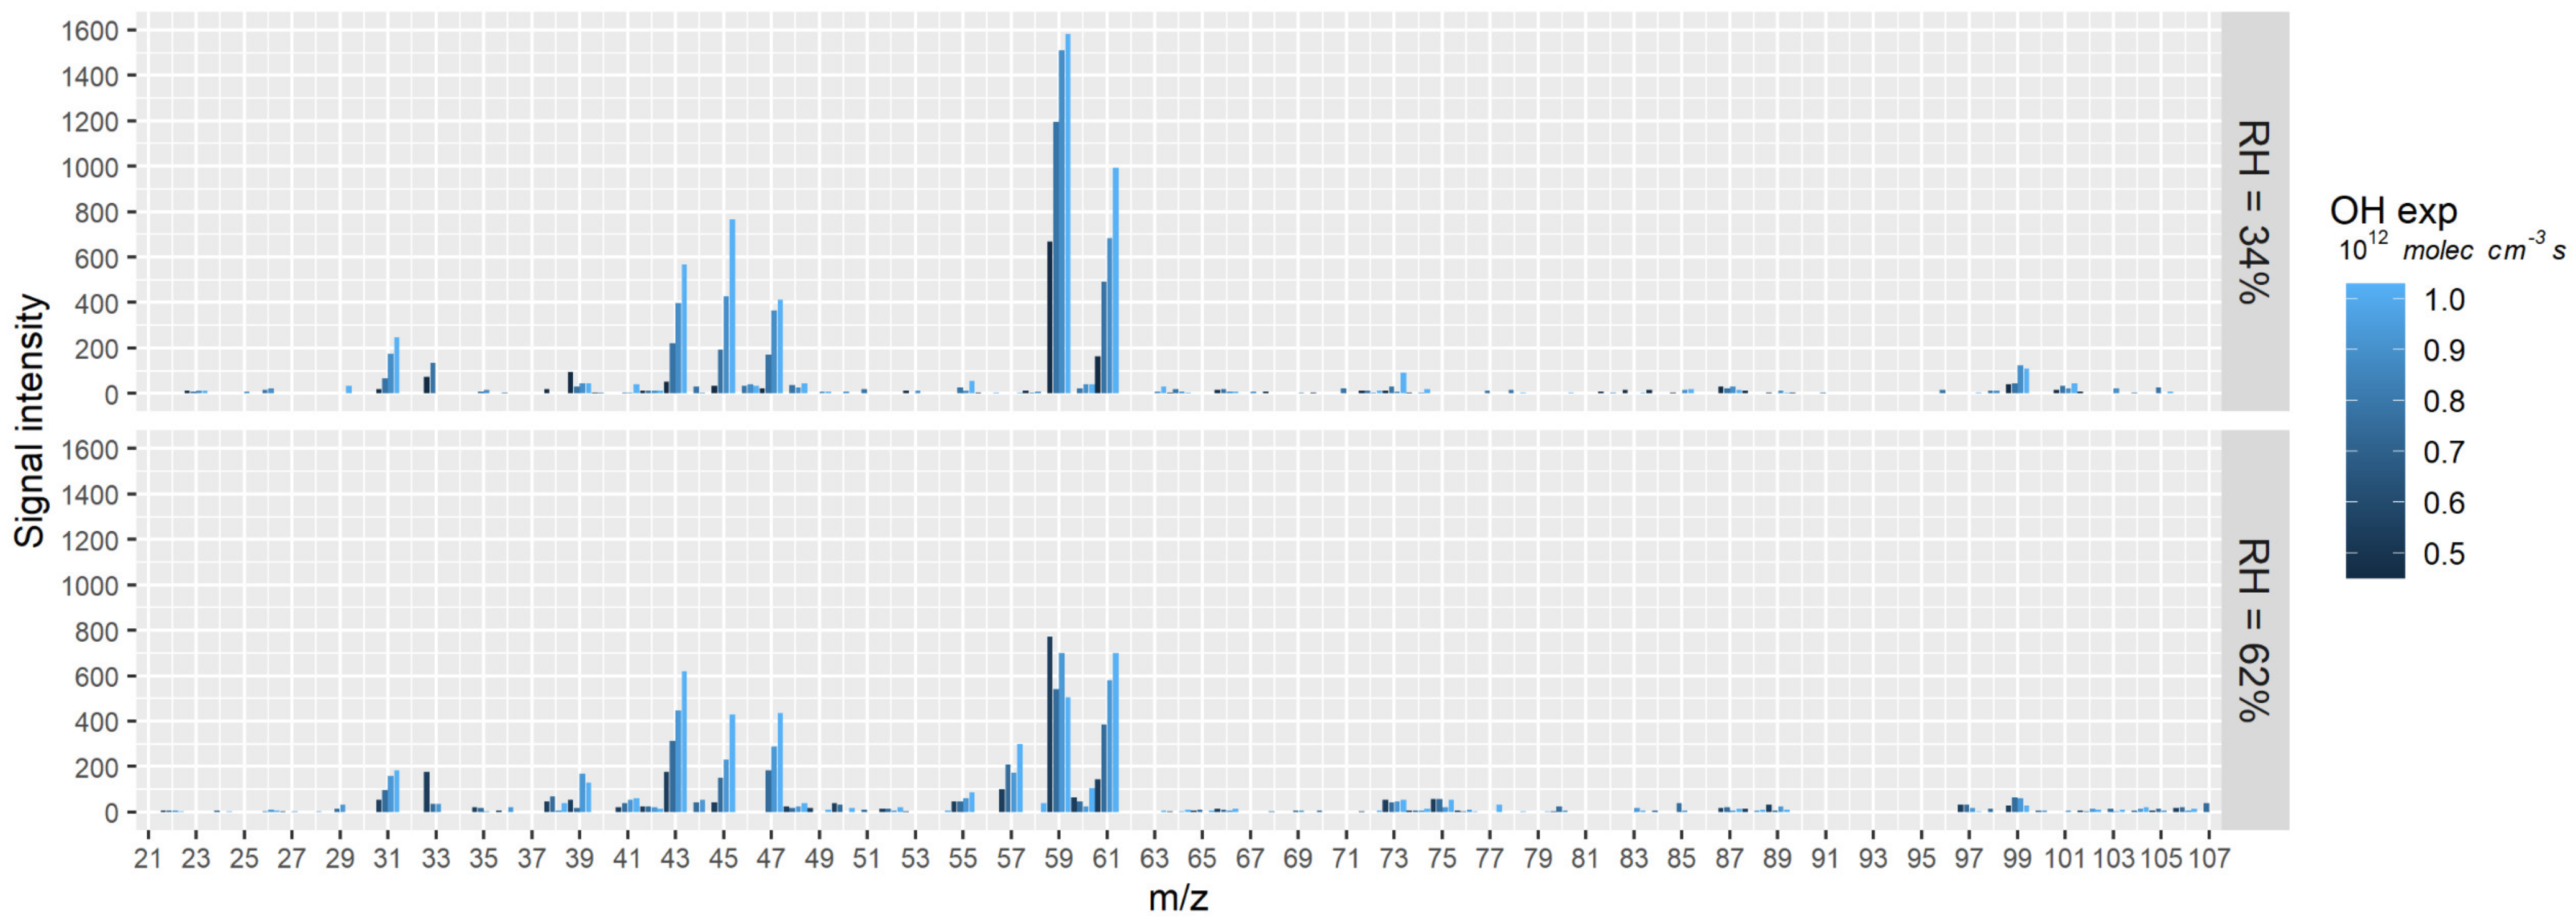
3.1.3. Effect of RH on the Chemical Composition of Gas Phase Products

It has been reported in previous studies that RH will change the chemical composition of gas phase and particle phase oxidation products of different VOCs. The effect of RH on the chemical composition of gas phase products can again be examined by the dot products between experiments carried out at different RH as shown by Figure 4. In most of the cases, dot products between spectrums are larger than 0.9 with deep blue color, indicating great similarities between them. At the same time, it can be observed that dot products between RH = 17% (0.4) and other RHs are smaller than all other dot products in experiments without using seed particles. This observation can be explained by the effect of OH exposure as presented in the previous section. Therefore, in general, the effect of RH on gas-phase product compositions in the current study is minimal.

3.1.4. Effect of (NH4)2SO4 Seed

To examine the effects of adding seed particles to the chemical composition of gas phase oxidation products, photooxidation experiments were repeated with the addition of (NH4)2SO4 particle at RH = 34% and 62%. (NH4)2SO4 was produced by passing (NH4)2SO4 solution through an atomizer. The resulting wet stream of atomized (NH4)2SO4 was then directed through a diffusion dryer and injected to the PAM OFR from an inlet other than the one for the main reactants. The initial mass concentration of (NH4)2SO4 was around 78.4 µg m−3.
Figure 6 depicted the spectrum obtained from experiments with seed particle. Compared with Figure 2, it is obvious that most of the peaks identified in seeded experiments were also present in experiments without seed particles. However, the weighing of peaks in Figure 6 is different from that in Figure 2. In particular, the dominating species in experiments without using seed particles are acetic acids and formic acids (as shown in Figure 2), while the most abundant peak in experiments with seed particle is glyoxal. This feature is also captured by the dot product calculation. Dot products between experiments with and without using the seed particle (area in light brown) are smaller dot products in other conditions. However, data obtained from the current study is insufficient to conclude the origin of the enhanced glyoxal level observed.

3.2. Particle Phase Products

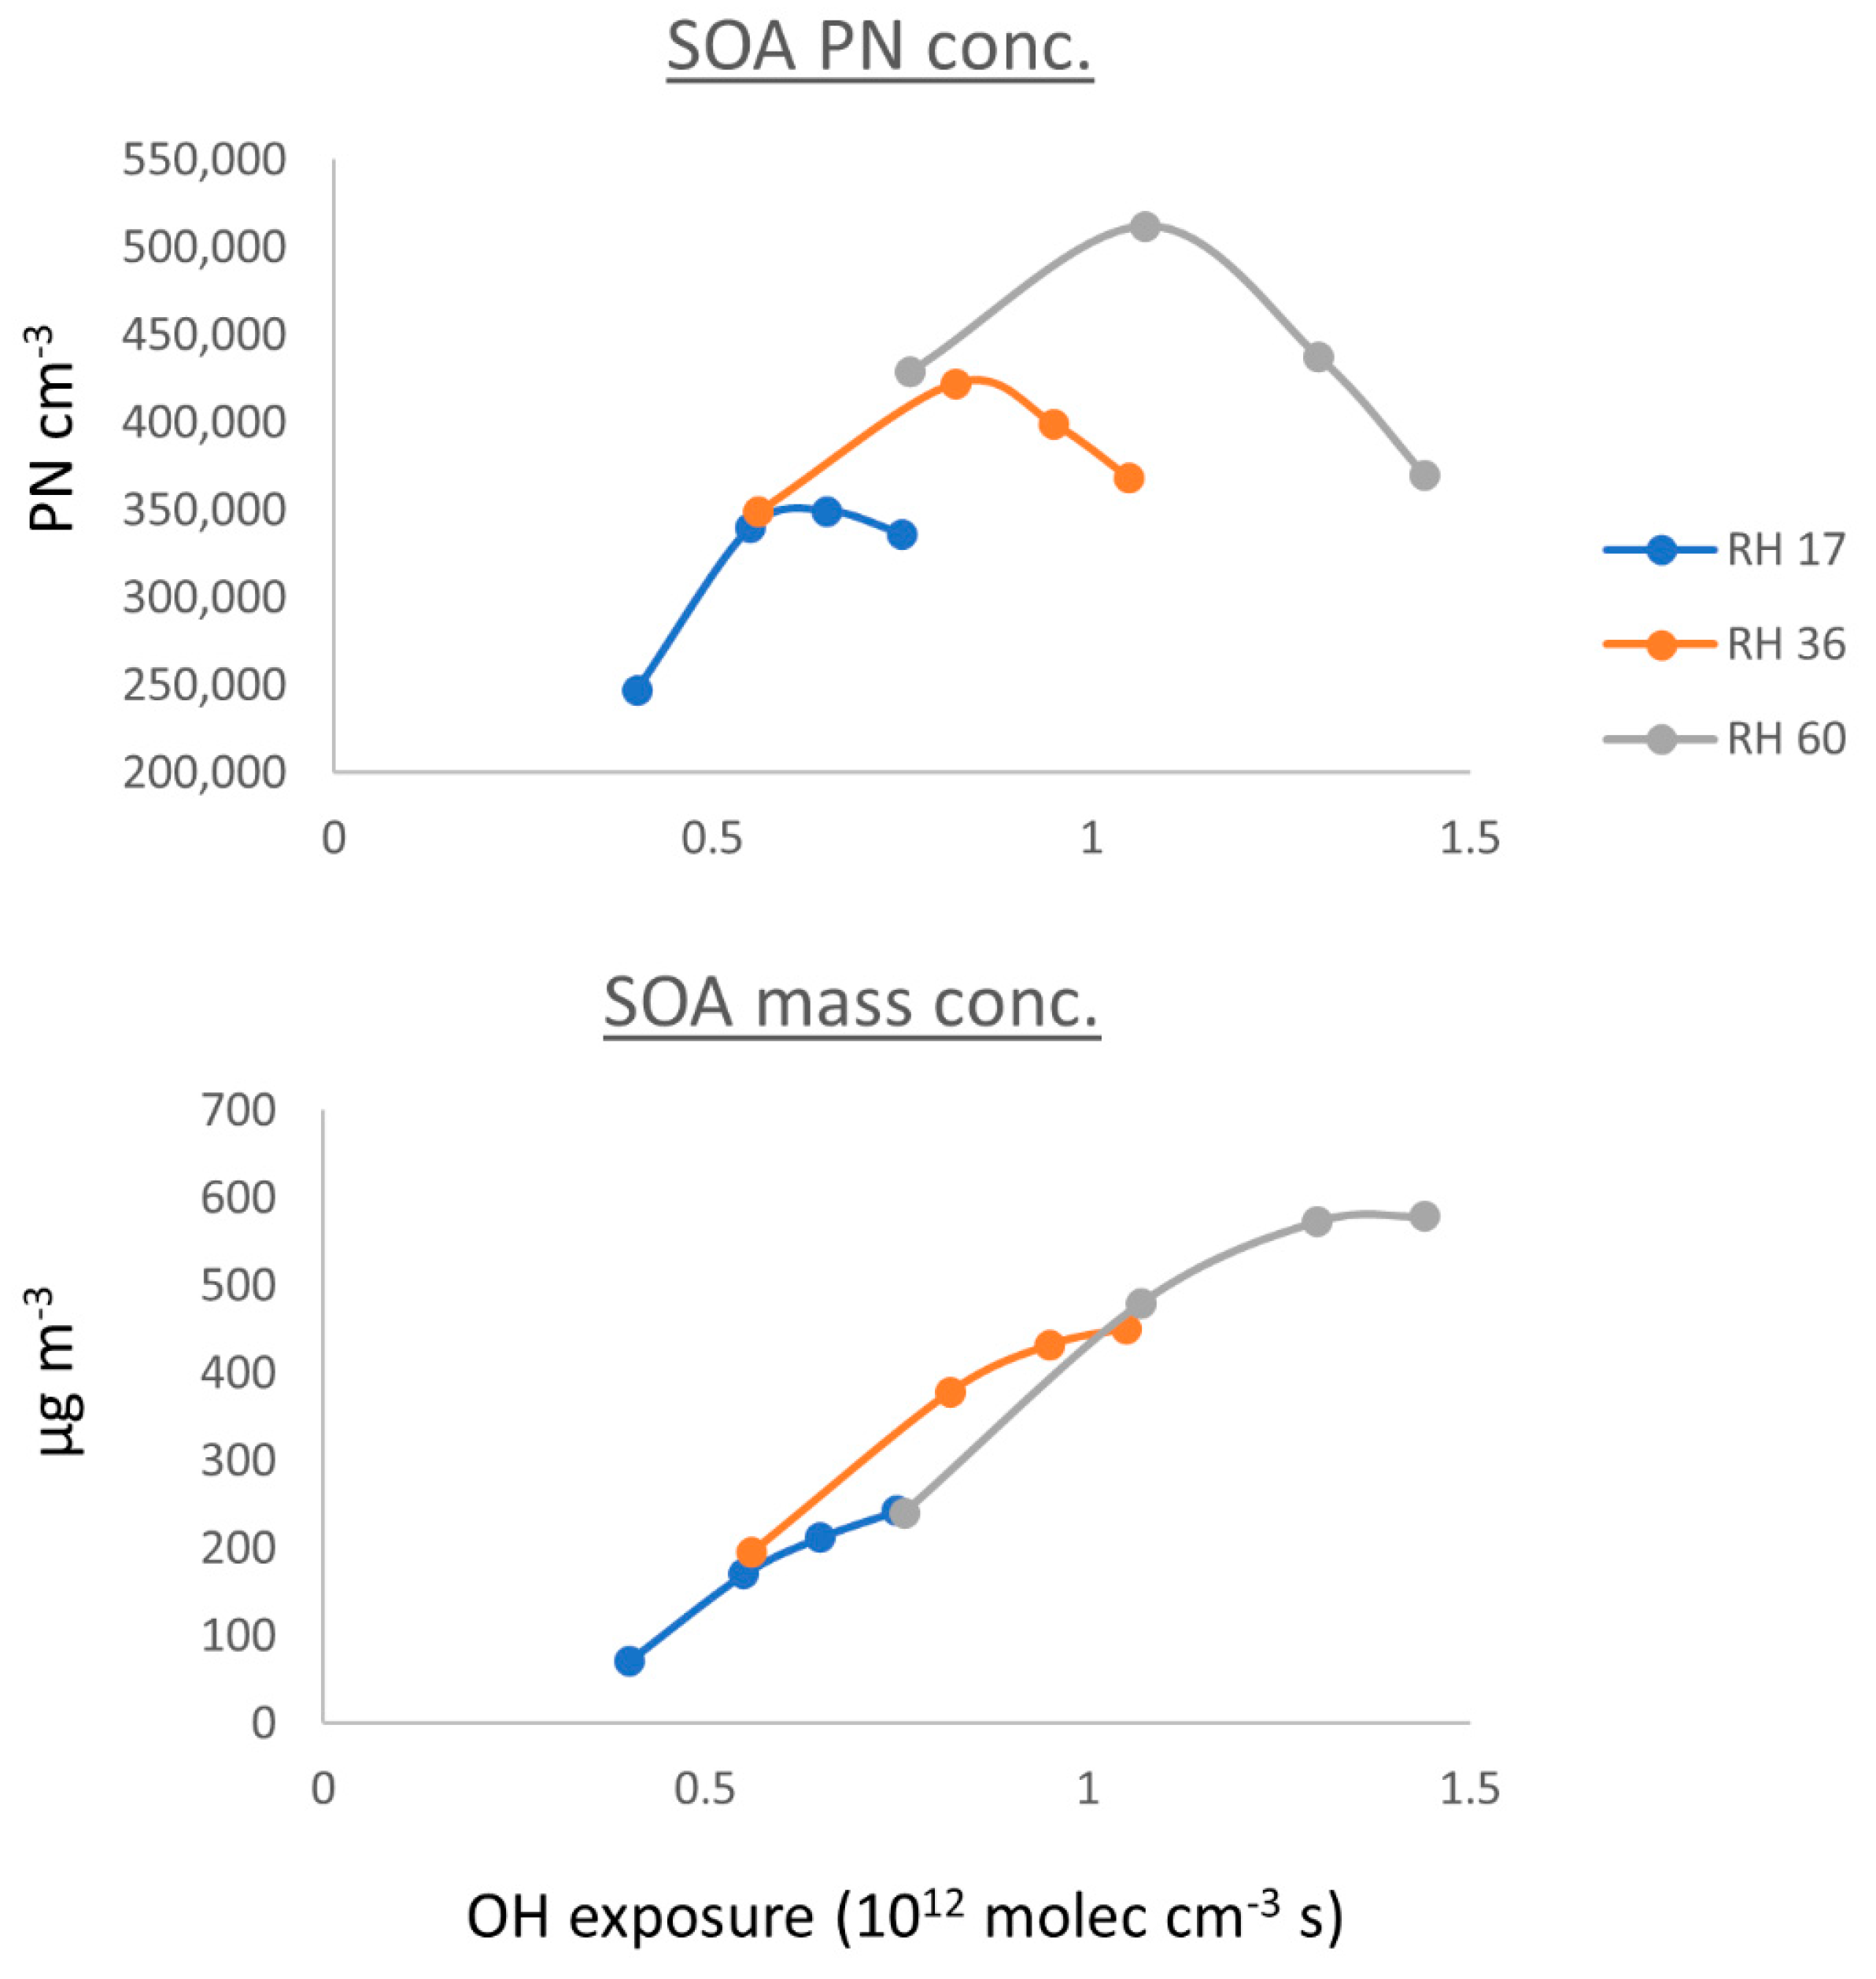
3.2.1. Number and Mass Concentration of SOA

The effect of increasing OH exposure on the number and mass concentration of SOA in the absence of seed particle was depicted in Figure 7. The change of SOA mass and number concentration under different OH exposure was monitored by a SMPS. According to the user manual of SMPS [37], the mass concentration of a sample is calculated from the particle number concentration and diameter distribution of the sample with the assumption that the particle is spherical in shape with a certain density (set to 1 g cm−3 in this study). Figure 7 showed that SOA mass concentration increases with OH exposure, while SOA number concentration first increases and then decreases with increasing OH exposure. It has been shown in previous studies that at high OH exposure, chemical reaction changes from functionalization (addition of oxygen atom to the product) to fragmentation (breaking of carbon–carbon bond), causing a decrease in SOA mass yield [26]. In their study, the transition from functionalization to fragmentation take place at OH exposure around 0.5–1 × 10¹² molec cm−3 s. The transition of reaction type in the aforementioned study may help to explain the observed decrease of particle number in the current study, which also occurs at OH exposure around 0.5–1 × 10¹² molec cm−3 s. However, it cannot explain the constant increase of SOA mass concentration at this range of OH exposure. The increase in SOA mass concentration indicates the formation of larger particles, since the particle density was assumed to be 1 g cm−3 in all experiments. One possible reason for the observed increase in particle mass concentration is the oligomerization of oxidation products. As shown by Loeffler et al. [38], glyoxal and methyl glyoxal can form dimer and trimers effectively. The combination of smaller particles to form a larger particle may help to explain the increase in particle mass concentration observed. However, results from the current study are insufficient to confirm the building blocks of the oligomers. Further studies are needed to identify the formation mechanism and composition of the possible oligomerization processes.

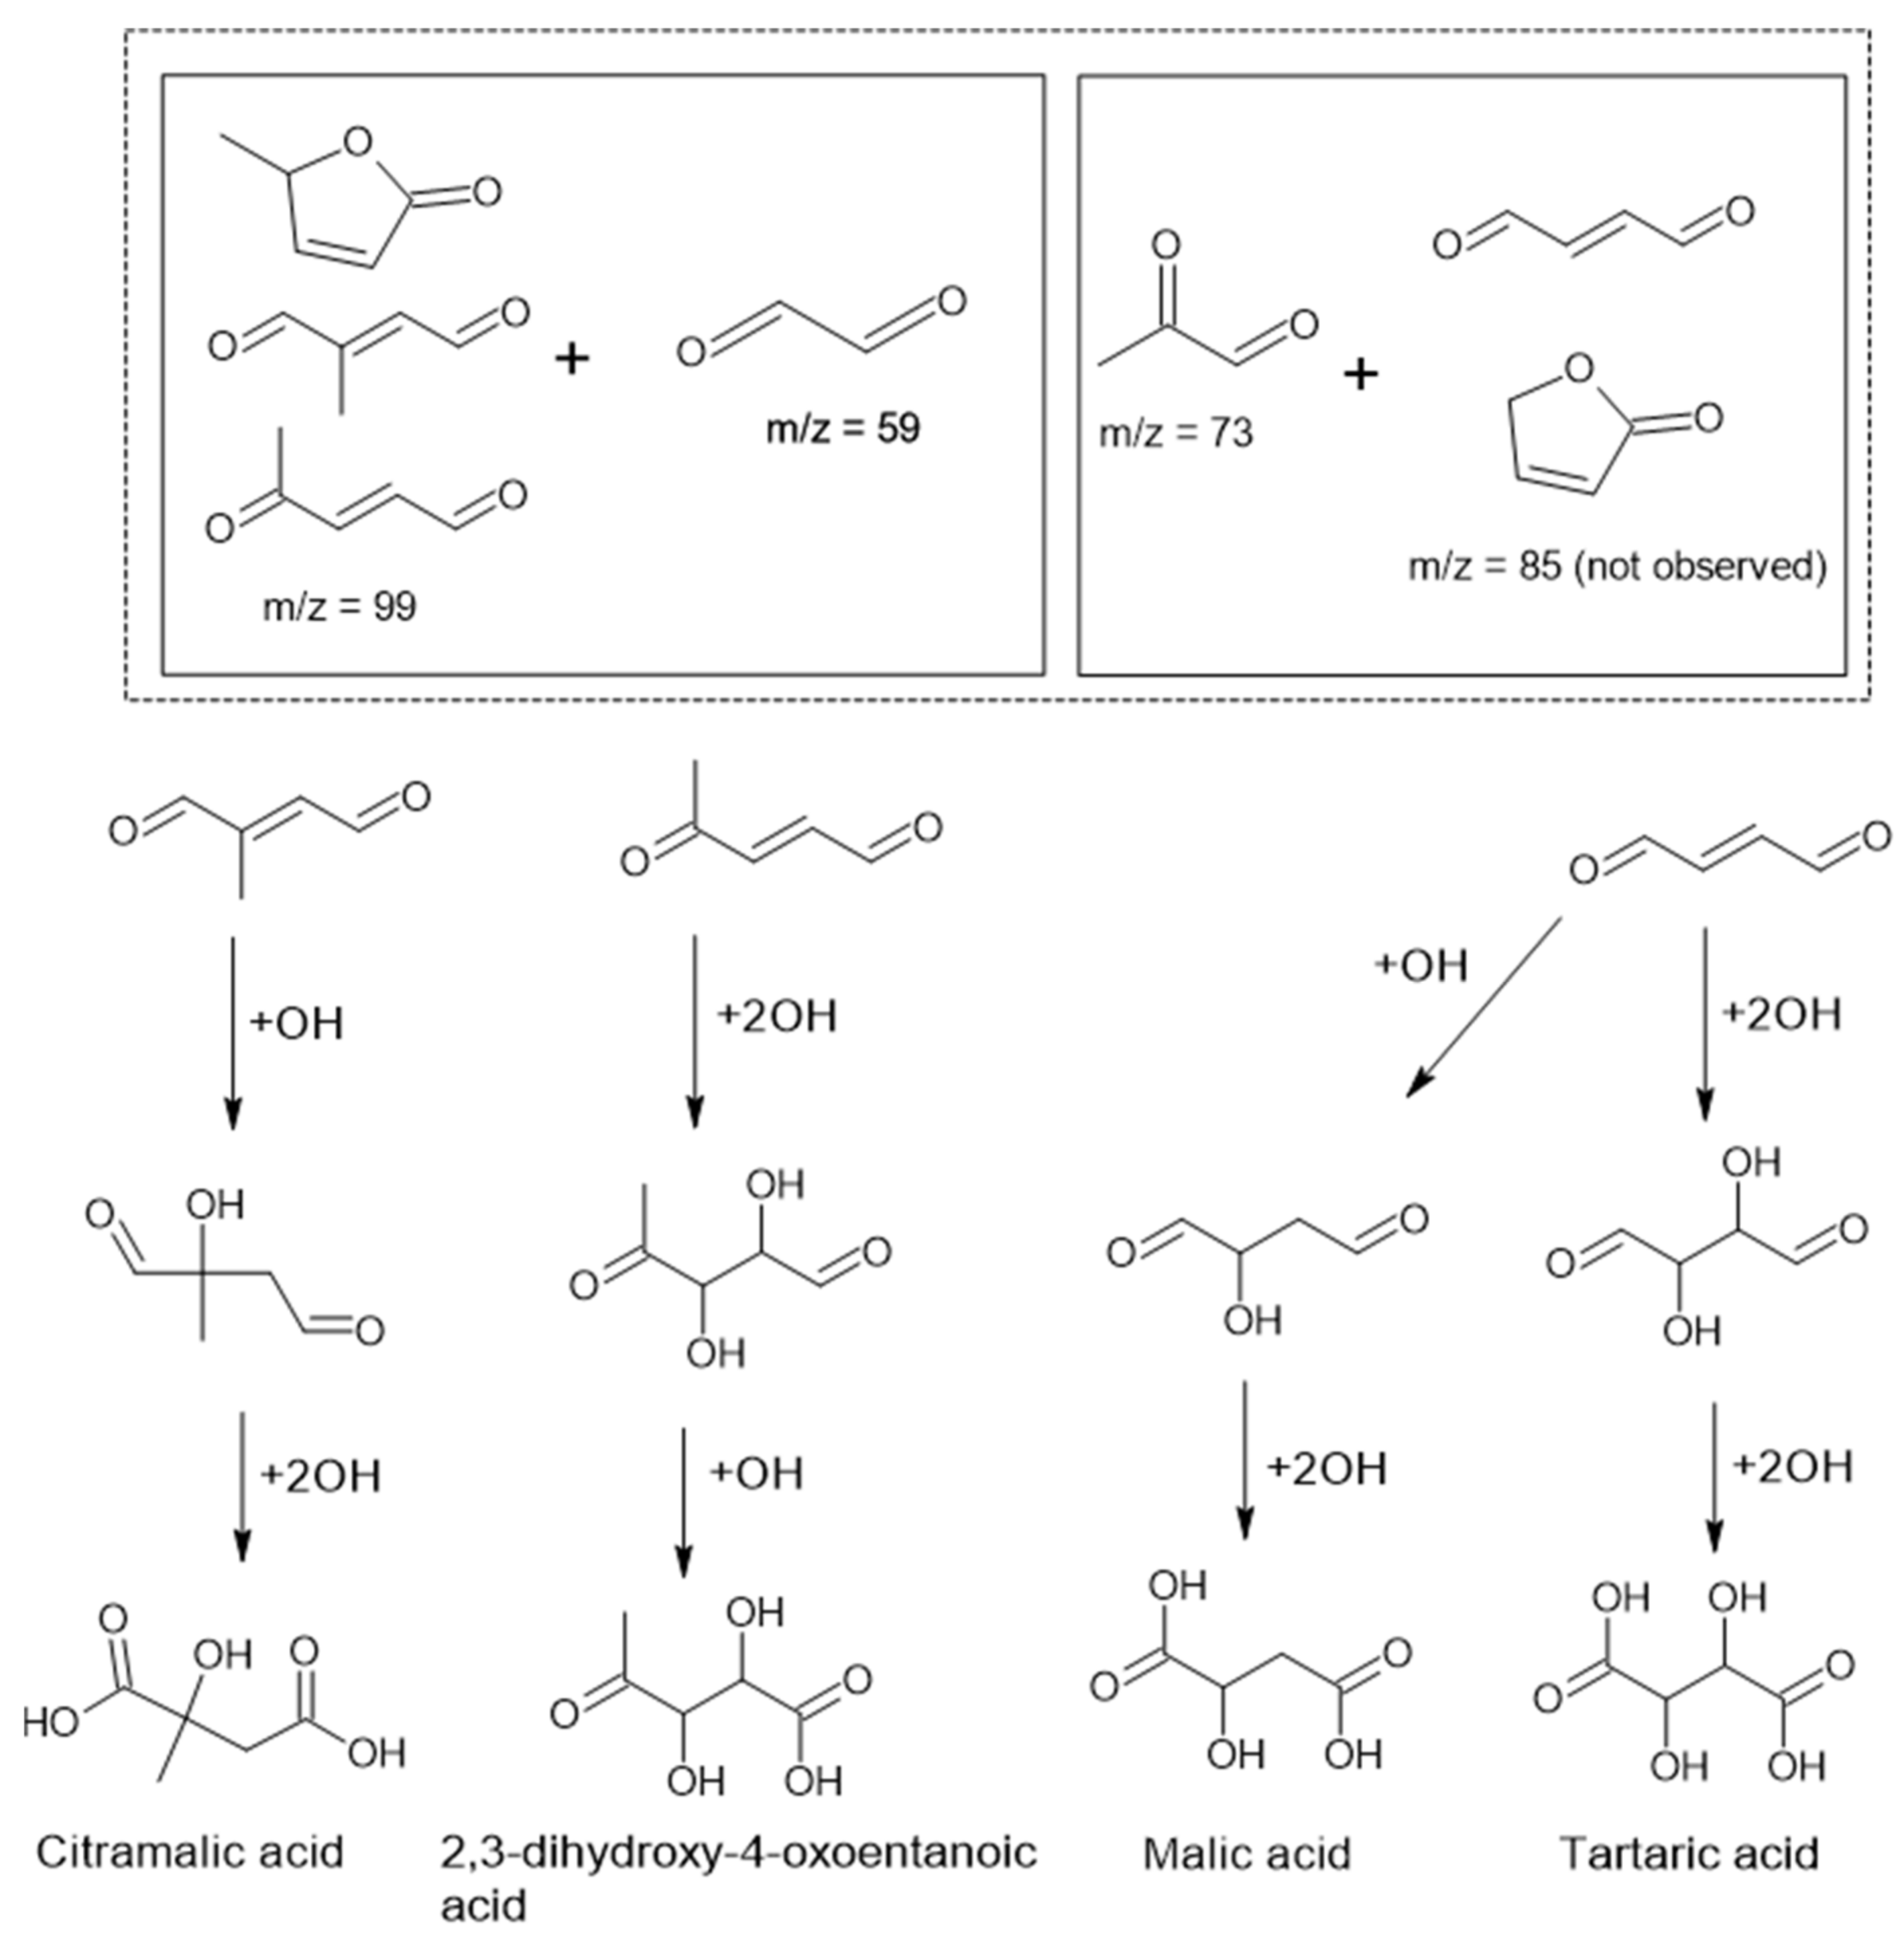
3.2.2. Chemical Characterization of Particle Phase Products

SOA samples collected in the current study were analyzed for its chemical composition by GC/MS. Chromatograms of the SOA sample are shown in Figure S2 in Supporting Information. The five most abundant organic acids identified in the sample were listed in Table 2. As shown in the table, four out of five acids are dicarboxylic acids, and the remaining one is the well-known toluene SOA tracer DHOPA. The first four acids in Table 2 have previously been identified in other studies. They are probably originated from the unsaturated carbonyl compound formed as the first generation product in gas phase. The proposed formation mechanism of these four acids were outlined in Figure 8.
C5 diacids, such as glutaric acid, 3-hydroxyglutaric acid, and 2,3-dihydroxyglutaric acid, have been identified in many SOA samples, including SOA collected from urban and rural areas [40,41,44,45], as well as from cyclohexene oxidation [46,47]. However, to the best of our knowledge, the identification of C5 diacids has not been reported in SOA sample derived from toluene. 2,3-dihydroxyglutaric acid identified in the SOA sample of the current study is unlikely originated from the gas-particle partitioning of gas phase oxidation products, since in the PTR-MS result of the current study, as well as the MCM database, no compound that could lead to the formation of it can be found. Therefore, we suggest that it is either formed through particle phase reaction or the recombination of small fragmentation products. In any case, its formation mechanism under high OH condition warrants further investigation. Apart from glutaric acid, all other particle phase products identified in the current study agree with previous studies, again suggesting that the use of PAM OFR to study atmospherically relevant oxidation reaction is reliable.

4. Conclusions

The current study examined the reaction mechanism of the photooxidation and ageing of toluene using the PAM OFR. The range of OH exposure studied spanned from 0.4 to 1.5 × 10¹² molec cm−3 s, which is equivalent to 3 to 12 days of atmospheric oxidation. Results showed that OH exposure has minimal effect on the gas phase products formed, while an increase in OH exposure will increase the yield of second generation gas phase products. The composition of gas phase product obtained under different RH are similar, except for the experiment conducted at RH = 17% and OH exposure = 0.4 × 10¹² molec cm−3 s. Experiments using (NH4)2SO4 seed particle showed similar gas phase products composition, but the spectrum is dominated by glyoxal (m/z = 59). The mass concentration of SOA increased with increasing OH exposure, while the PN concentration of SOA first increased then decreased with increasing OH exposure. It was also found that the SOA samples in the current study were dominated by highly oxygenated dicarboxylic acids. In general, the results of the current study showed good agreement with previous studies carried out in smog chambers. It shows that using PAM OFR to study the reaction mechanism of photooxidation and ageing of different VOCs in the atmosphere is reliable, and, with stringent control in experimental conditions, atmospherically relevant.

Supplementary Materials

The following are available online at https://www.mdpi.com/article/10.3390/atmos12070915/s1, Figure S1: Calibration curve of OH exposure under different RH, Table S1: Experiment list for gas phase product study, Figure S2: Total ion chromatogram of aerosol samples and target compounds. Target Compounds: #1, Citramalic acid; #2, 2,3-Dihydroxy-4-oxopentanoic acid; #3, Malic acid; #4, Tataric acid; #5, 2,3-dihydroxy-glutraric acid, Table S2: Dot products between spectrums obtained in each experiment. The unit of OH exposure is 1 × 10¹² molec cm−3 s. Areas in grey represent dot products between experiments of different RH, and areas in light brown represent dot products between experiments with and without using seed particles.

Author Contributions

Conceptualization, Y.-S.L. and K.-F.H.; Data curation, Y.-S.L.; Formal analysis, Y.-S.L.; Funding acquisition, K.-F.H.; Investigation, Y.-S.L., M.-N.C., H.-Y.P., Y.T. and J.L.; Methodology, Y.-S.L. and K.-F.H.; Project administration, K.-F.H.; Resources, M.-N.C., Y.T., S.-C.L. and K.-F.H.; Software, Y.-S.L. and Y.T.; Supervision, M.-N.C., S.-C.L., J.L. and K.-F.H.; Validation, Y.-S.L., H.-Y.P. and K.-F.H.; Visualization, Y.-S.L.; Writing—original draft, Y.-S.L., H.-Y.P. and K.-F.H.; Writing—review & editing, Y.-S.L., J.L. and K.-F.H. All authors have read and agreed to the published version of the manuscript.

Funding

This study was supported by grants from the Research Grant Council of the Hong Kong Special Administrative Region China, Theme-Based Research Scheme (T24-504/17-N) and General Research Fund (Project No. CUHK 14205318).

Institutional Review Board Statement

Not applicable.

Informed Consent Statement

Not applicable.

Data Availability Statement

Data are available upon request to the authors.

Conflicts of Interest

The authors declare no conflict of interest.

References

  1. Huang, R.-J.; Zhang, Y.; Bozzetti, C.; Ho, K.-F.; Cao, J.-J.; Han, Y.; Daellenbach, K.R.; Slowik, J.G.; Platt, S.M.; Canonaco, F.; et al. High secondary aerosol contribution to particulate pollution during haze events in China. Nature 2014, 514, 218–222. [Google Scholar] [CrossRef] [PubMed] [Green Version]
  2. Shrivastava, M.; Cappa, C.D.; Fan, J.; Goldstein, A.H.; Guenther, A.B.; Jimenez, J.L.; Kuang, C.; Laskin, A.; Martin, S.T.; Ng, N.L.; et al. Recent advances in understanding secondary organic aerosol: Implications for global climate forcing. Rev. Geophys. 2017, 55, 509–559. [Google Scholar] [CrossRef] [Green Version]
  3. Hallquist, M.; Wenger, J.C.; Baltensperger, U.; Rudich, Y.; Simpson, D.; Claeys, M.; Dommen, J.; Donahue, N.M.; George, C.; Goldstein, A.H.; et al. The formation, properties and impact of secondary organic aerosol: Current and emerging issues. Atmos. Chem. Phys. 2009, 9, 5155–5236. [Google Scholar] [CrossRef] [Green Version]
  4. Tuet, W.Y.; Chen, Y.; Fok, S.; Champion, J.A.; Ng, N.L. Inflammatory responses to secondary organic aerosols (SOA) generated from biogenic and anthropogenic precursors. Atmos. Chem. Phys. 2017, 17, 11418–11440. [Google Scholar] [CrossRef] [Green Version]
  5. Ng, N.L.; Canagaratna, M.R.; Zhang, Q.; Jimenez, J.L.; Tian, J.; Ulbrich, I.M.; Kroll, J.H.; Docherty, K.S.; Chhabra, P.S.; Bahreini, R.; et al. Organic aerosol components observed in Northern Hemispheric datasets from Aerosol Mass Spectrometry. Atmos. Chem. Phys. 2010, 10, 4610–4641. [Google Scholar] [CrossRef] [Green Version]
  6. Davidson, C.I.; Phalen, R.F.; Solomon, P.A. Airborne Particulate Matter and Human Health: A Review. Aerosol Sci. Technol. 2005, 39, 737–749. [Google Scholar] [CrossRef]
  7. Valavanidis, A.; Fiotakis, K.; Vlachogianni, T. Airborne particulate matter and human health: Toxicological assessment and importance of size and composition of particles for oxidative damage and carcinogenic mechanisms. J. Environ. Sci. Health C 2008, 26, 339–362. [Google Scholar] [CrossRef]
  8. Ng, N.L.; Brown, S.S.; Archibald, A.T.; Atlas, E.; Cohen, R.C.; Crowley, J.N.; Day, D.A.; Donahue, N.M.; Fry, J.L.; Fuchs, H.; et al. Nitrate radicals and biogenic volatile organic compounds: Oxidation, mechanisms, and organic aerosol. Atmos. Chem. Phys. 2017, 17, 2103–2162. [Google Scholar] [CrossRef] [Green Version]
  9. Kroll, J.H.; Seinfeld, J.H. Chemistry of secondary organic aerosol: Formation and evolution of low-volatility organics in the atmosphere. Atmos. Environ. 2008, 42, 3593–3624. [Google Scholar] [CrossRef]
  10. Ziemann, P.J.; Atkinson, A.R. Kinetics, products, and mechanisms of secondary organic aerosol formation. Chem. Soc. Rev. 2012, 41, 6582–6605. [Google Scholar] [CrossRef]
  11. Rollins, A.W.; Pusede, S.; Wooldridge, P.; Min, K.E.; Gentner, D.R.; Goldstein, A.H.; Liu, S.; Day, D.A.; Russell, L.M.; Rubitschun, C.L.; et al. Gas/particle partitioning of total alkyl nitrates observed with TD-LIF in Bakersfield. J. Geophys. Res. Atmos. 2013, 118, 6651–6662. [Google Scholar] [CrossRef]
  12. Deng, W.; Liu, T.; Zhang, Y.; Situ, S.; Hu, Q.; He, Q.; Zhang, Z.; Lü, S.; Bi, X.; Wang, X.; et al. Secondary organic aerosol formation from photo-oxidation of toluene with NOx and SO2: Chamber simulation with purified air versus urban ambient air as matrix. Atmos. Environ. 2017, 150, 67–76. [Google Scholar] [CrossRef]
  13. Robinson, A.L.; Donahue, N.M.; Shrivastava, M.K.; Weitkamp, E.A.; Sage, A.M.; Grieshop, A.P.; Lane, T.E.; Pierce, J.R.; Pandis, S.N. Rethinking Organic Aerosols: Semivolatile Emissions and Photochemical Aging. Science 2007, 315, 1259. [Google Scholar] [CrossRef]
  14. Liggio, J.; Li, S.-M.; Hayden, K.; Taha, Y.M.; Stroud, C.; Darlington, A.; Drollette, B.D.; Gordon, M.; Lee, P.; Liu, P.; et al. Oil sands operations as a large source of secondary organic aerosols. Nature 2016, 534, 91–94. [Google Scholar] [CrossRef]
  15. Lu, Q.; Murphy, B.N.; Qin, M.; Adams, P.J.; Zhao, Y.; Pye, H.O.T.; Efstathiou, C.; Allen, C.; Robinson, A.L. Simulation of organic aerosol formation during the CalNex study: Updated mobile emissions and secondary organic aerosol parameterization for intermediate-volatility organic compounds. Atmos. Chem. Phys. 2020, 20, 4313–4332. [Google Scholar] [CrossRef] [Green Version]
  16. Peng, Z.; Jimenez, J.L. Radical chemistry in oxidation flow reactors for atmospheric chemistry research. Chem. Soc. Rev. 2020, 49, 2570–2616. [Google Scholar] [CrossRef]
  17. Kang, E.; Root, M.J.; Toohey, D.W.; Brune, W.H. Introducing the concept of Potential Aerosol Mass (PAM). Atmos. Chem. Phys. 2007, 7, 5727–5744. [Google Scholar] [CrossRef] [Green Version]
  18. Tkacik, D.S.; Lambe, A.T.; Jathar, S.; Li, X.; Presto, A.A.; Zhao, Y.; Blake, D.; Meinardi, S.; Jayne, J.T.; Croteau, P.L.; et al. Secondary organic aerosol formation from in-use motor vehicle emissions using a potential aerosol mass reactor. Environ. Sci. Technol. 2014, 48, 11235–11242. [Google Scholar] [CrossRef] [Green Version]
  19. Zhao, Y.; Lambe, A.T.; Saleh, R.; Saliba, G.; Robinson, A.L. Secondary Organic Aerosol Production from Gasoline Vehicle Exhaust: Effects of Engine Technology, Cold Start, and Emission Certification Standard. Environ. Sci. Technol. 2018, 52, 1253–1261. [Google Scholar] [CrossRef]
  20. Lambe, A.T.; Onasch, T.B.; Massoli, P.; Croasdale, D.R.; Wright, J.P.; Ahern, A.T.; Williams, L.R.; Worsnop, D.R.; Brune, W.H.; Davidovits, P. Laboratory studies of the chemical composition and cloud condensation nuclei (CCN) activity of secondary organic aerosol (SOA) and oxidized primary organic aerosol (OPOA). Atmos. Chem. Phys. 2011, 11, 8913–8928. [Google Scholar] [CrossRef] [Green Version]
  21. Molteni, U.; Bianchi, F.; Klein, F.; el Haddad, I.; Frege, C.; Rossi, M.J.; Dommen, J.; Baltensperger, U. Formation of highly oxygenated organic molecules from aromatic compounds. Atmos. Chem. Phys. 2018, 18, 1909–1921. [Google Scholar] [CrossRef] [Green Version]
  22. Palm, B.B.; Campuzano-Jost, P.; Day, D.A.; Ortega, A.M.; Fry, J.L.; Brown, S.S.; Zarzana, K.J.; Dube, W.; Wagner, N.L.; Draper, D.C.; et al. Secondary organic aerosol formation from in situ OH, O3, and NO3 oxidation of ambient forest air in an oxidation flow reactor. Atmos. Chem. Phys. 2017, 17, 5331–5354. [Google Scholar] [CrossRef] [Green Version]
  23. Ma, J.; Chu, B.; Liu, J.; Liu, Y.; Zhang, H.; He, H. NOx promotion of SO2 conversion to sulfate: An important mechanism for the occurrence of heavy haze during winter in Beijing. Environ. Pollut. 2018, 233, 662–669. [Google Scholar] [CrossRef] [PubMed]
  24. Lambe, A.T.; Chhabra, P.S.; Onasch, T.B.; Brune, W.H.; Hunter, J.F.; Kroll, J.H.; Cummings, M.J.; Brogan, J.F.; Parmar, Y.; Worsnop, D.R.; et al. Effect of oxidant concentration, exposure time, and seed particles on secondary organic aerosol chemical composition and yield. Atmos. Chem. Phys. 2015, 15, 3063–3075. [Google Scholar] [CrossRef] [Green Version]
  25. Ortega, A.M.; Day, D.A.; Cubison, M.J.; Brune, W.H.; Bon, D.; de Gouw, J.A.; Jimenez, J.L. Secondary organic aerosol formation and primary organic aerosol oxidation from biomass-burning smoke in a flow reactor during FLAME-3. Atmos. Chem. Phys. 2013, 13, 11551–11571. [Google Scholar] [CrossRef] [Green Version]
  26. Lambe, A.T.; Onasch, T.B.; Croasdale, D.R.; Wright, J.P.; Martin, A.T.; Franklin, J.P.; Massoli, P.; Kroll, J.H.; Canagaratna, M.R.; Brune, W.H.; et al. Transitions from functionalization to fragmentation reactions of laboratory secondary organic aerosol (SOA) generated from the OH oxidation of alkane precursors. Environ. Sci. Technol. 2012, 46, 5430–5437. [Google Scholar] [CrossRef]
  27. Wang, Y.; Mehra, A.; Krechmer, J.E.; Yang, G.; Hu, X.; Lu, Y.; Lambe, A.; Canagaratna, M.; Chen, J.; Worsnop, D.; et al. Oxygenated products formed from OH-initiated reactions of trimethylbenzene: Autoxidation and accretion. Atmos. Chem. Phys. 2020, 20, 9563–9579. [Google Scholar] [CrossRef]
  28. Lambe, A.T.; Ahern, A.T.; Williams, L.R.; Slowik, J.G.; Wong, J.P.S.; Abbatt, J.P.D.; Brune, W.H.; Ng, N.L.; Wright, J.P.; Croasdale, D.R.; et al. Characterization of aerosol photooxidation flow reactors: Heterogeneous oxidation, secondary organic aerosol formation and cloud condensation nuclei activity measurements. Atmos. Meas. Tech. 2011, 4, 445–461. [Google Scholar] [CrossRef] [Green Version]
  29. Rattigan, O.V.; Boniface, J.; Swartz, E.; Davidovits, P.; Jayne, J.T.; Kolb, C.E.; Worsnop, D.R. Uptake of gas-phase SO2 in aqueous sulfuric acid: Oxidation by H2O2, O3, and HONO. J. Geophys. Res. Atoms. 2000, 105, 29065–29078. [Google Scholar] [CrossRef]
  30. Mao, J.; Ren, X.; Brune, W.H.; Olson, J.R.; Crawford, J.H.; Fried, A.; Huey, L.G.; Cohen, R.C.; Heikes, B.; Singh, H.B.; et al. Airborne measurement of OH reactivity during INTEX-B. Atmos. Chem. Phys. 2009, 9, 163–173. [Google Scholar] [CrossRef] [Green Version]
  31. Johnson, D.; Jenkin, M.E.; Wirtz, K.; Martin-Reviejo, M. Simulating the Formation of Secondary Organic Aerosol from the Photooxidation of Toluene. Environ. Chem. 2004, 1, 150–165. [Google Scholar] [CrossRef]
  32. Maleknia, S.D.; Bell, T.L.; Adams, M.A. PTR-MS analysis of reference and plant-emitted volatile organic compounds. Int. J. Mass. Spectrom. 2007, 262, 203–210. [Google Scholar] [CrossRef]
  33. Calvert, J.G.; Atkinson, R.; Becker, K.H.; Kamens, R.M.; Seinfeld, J.H.; Wallington, T.H.; Yarwood, G. The Mechanisms of Atmospheric Oxidation of the Aromatic Hydrocarbons; Oxford University Press: Oxford, UK, 2002. [Google Scholar]
  34. Ji, Y.; Zhao, J.; Terazono, H.; Misawa, K.; Levitt, N.P.; Li, Y.; Lin, Y.; Peng, J.; Wang, Y.; Duan, L.; et al. Reassessing the atmospheric oxidation mechanism of toluene. Proc. Natl. Acad. Sci. USA 2017, 114, 8169–8174. [Google Scholar] [CrossRef] [Green Version]
  35. Arey, J.; Obermeyer, G.; Aschmann, S.M.; Chattopadhyay, S.; Cusick, R.D.; Atkinson, R. Dicarbonyl Products of the OH Radical-Initiated Reaction of a Series of Aromatic Hydrocarbons. Environ. Sci. Technol. 2009, 43, 683–689. [Google Scholar] [CrossRef] [PubMed]
  36. Marcolli, C.; Canagaratna, M.R.; Worsnop, D.R.; Bahreini, R.; de Gouw, J.A.; Warneke, C.; Goldan, P.D.; Kuster, W.C.; Williams, E.J.; Lerner, B.M.; et al. Cluster Analysis of the Organic Peaks in Bulk Mass Spectra Obtained During the 2002 New England Air Quality Study with an Aerodyne Aerosol Mass Spectrometer. Atmos. Chem. Phys. 2006, 6, 5649–5666. [Google Scholar] [CrossRef] [Green Version]
  37. TSI. Aerosol Instrument Manager Sofware for Scanning Mobility Particle Sizer (SMPS) Spectrometer, User’s Manual; TSI: Shoreview, MN, USA, 2010. [Google Scholar]
  38. Loeffler, K.W.; Koehler, C.A.; Paul, N.M.; de Haan, D.O. Oligomer Formation in Evaporating Aqueous Glyoxal and Methyl Glyoxal Solutions. Environ. Sci. Technol. 2006, 40, 6318–6323. [Google Scholar] [CrossRef]
  39. Kleindienst, T.E.; Conver, T.S.; McIver, C.D.; Edney, E.O. Determination of secondary organic aerosol products from the photooxidation of toluene and their implications in ambient PM2.5. J. Atmos. Chem. 2004, 47, 79–100. [Google Scholar] [CrossRef]
  40. Lewandowski, M.; Jaoui, M.; Kleindienst, T.E.; Offenberg, J.H.; Edney, E.O. Composition of PM2.5 during the summer of 2003 in Research Triangle Park, North Carolina. Atmos. Environ. 2007, 41, 4073–4083. [Google Scholar] [CrossRef]
  41. Hu, D.; Bian, Q.; Li, T.W.Y.; Lau, A.K.H.; Yu, J.Z. Contributions of isoprene, monoterpenes, β-caryophyllene, and toluene to secondary organic aerosols in Hong Kong during the summer of 2006. J. Geophys. Res. Atmos. 2008, 113. [Google Scholar] [CrossRef]
  42. Sato, K.; Hatakeyama, S.; Imamura, T. Secondary organic aerosol formation during the photooxidation of toluene: NOx dependence of chemical composition. J. Phys. Chem. A 2007, 111, 9796–9808. [Google Scholar] [CrossRef]
  43. White, S.J.; Jamie, I.M.; Angove, D.E. Chemical characterisation of semi-volatile and aerosol compounds from the photooxidation of toluene and NOx. Atmos. Environ. 2014, 83, 237–244. [Google Scholar] [CrossRef]
  44. Ding, X.; Wang, X.-M.; Zheng, M. The influence of temperature and aerosol acidity on biogenic secondary organic aerosol tracers: Observations at a rural site in the central Pearl River Delta region, South China. Atmos. Environ. 2011, 45, 1303–1311. [Google Scholar] [CrossRef]
  45. Claeys, M.; Graham, B.; Vas, G.; Wang, W.; Vermeylen, R.; Pashynska, V.; Cafmeyer, J.; Guyon, P.; Andreae, M.O.; Artaxo, P.; et al. Formation of Secondary Organic Aerosols Through Photooxidation of Isoprene. Science 2004, 303, 1173. [Google Scholar] [CrossRef] [PubMed] [Green Version]
  46. Hamilton, J.F.; Lewis, A.C.; Reynolds, J.C.; Carpenter, L.J.; Lubben, A. Investigating the composition of organic aerosol resulting from cyclohexene ozonolysis: Low molecular weight and heterogeneous reaction products. Atmos. Chem. Phys. 2006, 6, 4973–4984. [Google Scholar] [CrossRef] [Green Version]
  47. Liu, S.; Tsona, N.T.; Zhang, Q.; Jia, L.; Xu, Y.; Du, L. Influence of relative humidity on cyclohexene SOA formation from OH photooxidation. Chemosphere 2019, 231, 478–486. [Google Scholar] [CrossRef] [PubMed]
Figure 1. Schematic diagram of the instrumental setup.
Atmosphere 12 00915 g001
Figure 2. Mass spectrum of gas phase products observed in experiments without seed particles. All the spectrums shown are background (OH exposure = 0) corrected.
Atmosphere 12 00915 g002
Figure 3. Proposed mechanism of toluene oxidation reaction leading to the products observed in the current study.
Atmosphere 12 00915 g003
Figure 4. The dot products between mass spectrums obtained under different experimental conditions. Numbers on the x- and y-axis correspond to the OH exposure of that experiment in 1012 molec cm−3 s. Numeric results were presented in Supporting Information Table S2.
Atmosphere 12 00915 g004
Figure 5. Changes in signal intensity of products observed by PTR-MS under different RH and OH exposure. Plots in light brown correspond to first generation products while plots in grey represents second generation products.
Atmosphere 12 00915 g005
Figure 6. Mass spectrum of gas phase products observed in experiments using (NH4)2SO4 seed particles. All the spectrums shown are background (OH exposure = 0) subtracted.
Atmosphere 12 00915 g006
Figure 7. Changes of SOA particle number (PN) concentration and mass concentration under different RH and OH exposure.
Atmosphere 12 00915 g007
Figure 8. Proposed formation mechanism of particle phase products observed in the current study.
Atmosphere 12 00915 g008
Table 1. Comparison of features between smog chamber and OFR [16].
Smog ChamberOFR
Experimental timescaleHours to dayMinutes to hours
Wall loseSignificantMinimal
OH exposureHours to daysDays to weeks
Field workPossible but not easyPossible
Atmospheric relevance of oxidant and precursor concentrationsYesPossible for precursor, impossible for oxidant
Time for condensation and partitioning of productsEnoughModerate
Table 2. List of particle phase products identified in SOA sample.
Chemical StructureMolecular WeightAverage Mass on Each Filter (ng)Previously Identified
2,3-Dihydroxy-4-oxopentanoic acid (DHOPA) Atmosphere 12 00915 i001148.1 g mol−135.4Kleindienst, Conver, McIver and Edney [39]
Citramalic acid Atmosphere 12 00915 i002148.1 g mol−1269.7Lewandowski, Jaoui, Kleindienst, Offenberg and Edney [40], Hu, Bian, Li, Lau and Yu [41]
Malic acid Atmosphere 12 00915 i003134.1 g mol−168.5Sato, Hatakeyama and Imamura [42]
Tartaric acid Atmosphere 12 00915 i004150.1 g mol−178.6White, Jamie and Angove [43]
2,3-dihydroxyglutaric acid Atmosphere 12 00915 i005164.1 g mol−156.2New product
Publisher’s Note: MDPI stays neutral with regard to jurisdictional claims in published maps and institutional affiliations.

