1. Introduction
Gvozdevsky et al. [
1] have summarized that when low-altitude NOAA spacecraft cross into the ionosphere from high to low latitudes, they detected an isotropic flux distribution in higher latitudes and subsequently detected anisotropic flux distribution in lower latitudes. The boundary between zones of isotropic and anisotropic fluxes is called the isotropic boundary (IB). The IB corresponds to the boundary separating adiabatic (isotropic) and stochastic (anisotropic) regimes of particle motion in the tail current sheet [
2]. It was shown in earlier research that electron precipitation within the isotropic zone can be caused by pitch angle scattering in the equatorial current sheet, where, because of the large curvature of magnetic field lines, the adiabatic invariant is violated due to the tail current sheet scattering (TCS) mechanism [
2,
3]. Nonadiabaticity of particle motion will lead to the filling of the loss cone and isotropic particle precipitation. Nevertheless, the trapped fluxes within the isotropic zone are lower than trapped fluxes within the anisotropic zone, generally [
2,
4]. The precipitation within the isotropic zone is strong during substorms because of the injected electrons from the plasma sheet. One of the prominent signature signs of substorm onset is the “injection” of an enhanced population of energetic charged particles (tens to hundreds of keV) into the nightside geosynchronous orbit of the magnetosphere [
5]. During substorms, energetic electron precipitation within the anisotropic zone occurs frequently [
6,
7,
8]. Typically, energetic electron precipitation within the isotropic zone from a substorm injection occurs firstly near midnight, rapidly expanding eastward with drifting velocities of energetic electrons with energies of 50–300 keV [
9]. On the other hand, energetic particle precipitation within the anisotropic zone is generally caused by the wave-particle interaction in the inner magnetosphere [
10,
11,
12]. In the basically collisionless magnetosphere, the energetic electron population can be changed through interactions with a variety of plasma waves, which lead to the violation of one or more of the particle adiabatic invariants. The plasmaspheric hiss wave is one of the important plasma waves in the magnetosphere. The hiss waves are wide band, with no structural ELF emissions, and typically emit in high-density regions inside the Earth’s plasmasphere [
13]. One of the consequences of the hiss-ring current (RC) interaction is the precipitation of energetic electrons into the atmosphere due to pitch angle diffusion within the anisotropic zone [
14,
15,
16]. It also has been suggested that the hiss waves play an important role in the formation of the radiation belt slot region [
17,
18].
The precipitating energetic electrons can collide with the neutral components in the low ionosphere, thus increasing the ionization rate and electron density in the ionosphere. Fang et al. [
19] suggest that the precipitating electrons with higher energies result in the enhancement of electron density at lower altitudes. The enhanced electron density in the
D region can sufficiently impact VLF radio waves in the Earth–ionosphere waveguide [
20]. In addition, the riometer makes use of the absorption of cosmic radio noise by the ionosphere to survey the increase of
D region electron density [
21]. Thus, VLF radio waves and riometers have been used to detect the fluctuation of the low ionosphere, driven by energetic electron precipitation on both sides of the IB. Baker et al. [
22,
23] utilized data from a geostationary satellite and riometers to depict energetic electron precipitation during substorms. They confirmed that substantial precipitation is essentially always accompanied by substorm injection at synchronous orbit [
22,
23]. Rodger et al. [
24] used pulsation magnetometer data and VLF radio waves to investigate the precipitation of >1 MeV radiation belt electrons scattered by EMIC waves in the inner magnetosphere. The mechanism proposed suggests that relativistic electrons would be rapidly driven into the bounce loss cone through interaction with electromagnetic ion cyclotron (EMIC) waves [
24]. Clilverd et al. [
25] used VLF measurements to detect precipitation events at high latitudes (in the isotropic zone) during substorms. They found that substorm injection can disturb the lower ionosphere distinctly and cause obvious fluctuation of VLF waves passing the high latitudes (the isotropic zone). However, the influence of substorms on the propagation of VLF radio waves at middle latitudes is not depicted in detail. In addition, Clilverd et al. [
26] have estimated seasonal changes of the precipitating flux of the outer radiation belt energetic electrons into the atmosphere by the observations of NOAA satellite and VLF radio waves.
For this paper, observations of satellites and ground stations were used to analyze energetic electron precipitation, and fluctuation of the low ionosphere within both sides of the IB during a substorm. The NOAA satellites were used to observe energetic electron and proton precipitations from the inner magnetosphere at ionospheric altitudes. The NOAA satellites also identify the isotropic and anisotropic zones. We used the riometers at high latitudes (L > 4.5) to detect fluctuations of the lower ionosphere due to energetic electron precipitation within the isotropic zone, which are caused by the TCS mechanism. The precipitating electron fluxes induced by the TCS mechanism can increase by orders of magnitude because of the electron injection during a substorm. VLF radio wave receivers at middle latitudes (L < 4) are used to depict the fluctuation of the lower ionosphere due to energetic electron precipitation within the anisotropic zone, which is caused by the wave-particle interaction in the inner magnetosphere. With the injection of energetic electrons into the inner magnetosphere during substorms, the flux and anisotropy of inner magnetospheric energetic electrons increase. The wave emissions which are induced by cyclotron resonance with energetic electrons can scatter energetic electrons into the loss cone. The effect of energetic electron precipitation within the anisotropic zone on the profile of lower ionospheric electron density and VLF radio wave propagation are also discussed in this paper.
2. Instrumentations
Very low frequency (VLF) radio waves are transmitted by many countries in contact with submarines around the world [
27]. VLF radio waves are guided within the spherical waveguide formed between the Earth and the lower ionosphere. The VLF radio wave technique has an advantage for studying Relativistic Electrons Precipitation (REP) in that it is most sensitive to ionization caused by electron precipitation with high energies, typically >100 keV, as these energies ionize the neutral atmosphere in the Earth–ionosphere waveguide [
24]. Subionospheric VLF radio wave propagation is sensitive to ionization below 90 km altitude. The effect of increased ionization on the propagating signal can be seen as either an increase or decrease of single amplitude or phase depending on the modal mixture of each observed signal [
27,
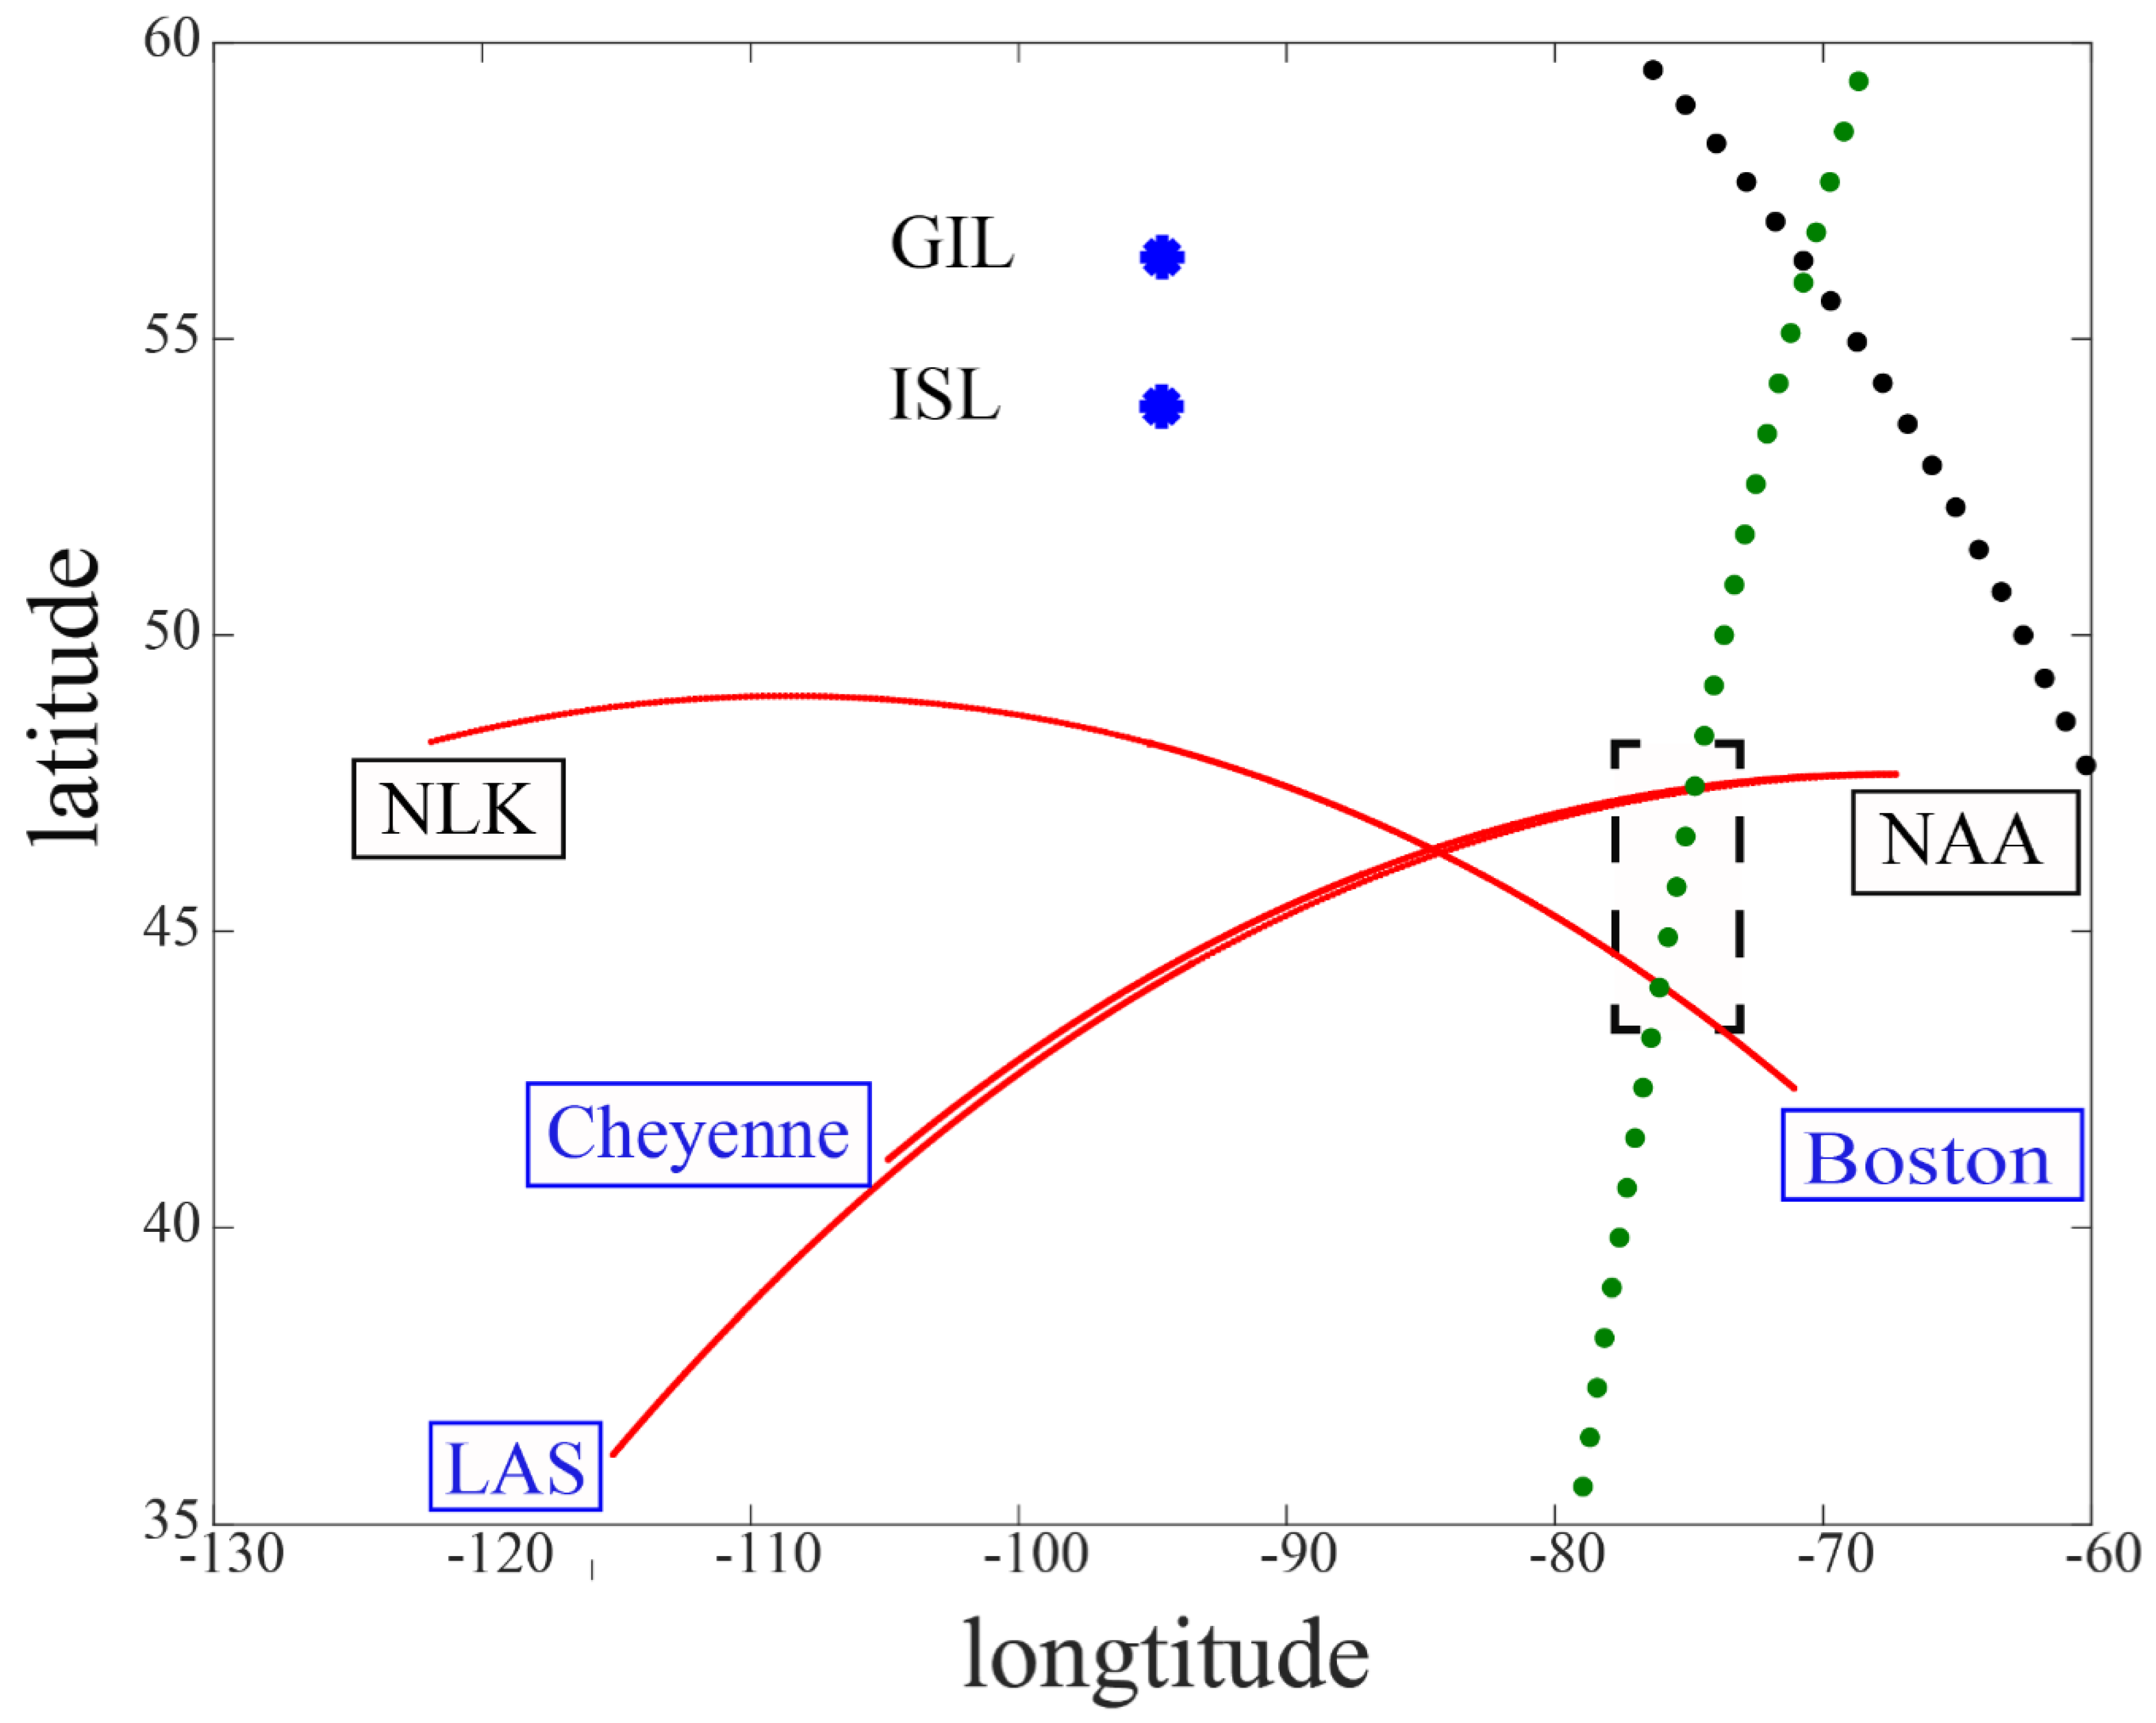
28]. Therefore, the effects of changing ionization conditions in the mesosphere, due to energetic particle precipitation, can be detected along the propagation path between a VLF transmitter and a receiver. In this paper, we used narrow band data of VLF radio waves, transmitted from NLK (Jim Creek, Washington. 24.8 kHz, 48.2° N, 121.9° W,
L ~ 2.9), received at Boston (42.35° N, 71.083° W,
L ~ 2.7), and transmitted from NAA (Cutler, Maine. 24 kHz, 47.65° N, 67.3° W,
L ~ 3.5), received at Cheyenne (41.15° N, 104.87° W,
L ~ 2.3) and Las Vegas (36.18° N, 115.14° W,
L ~ 1.9), respectively. The three VLF radio wave propagating paths from transmitters to receivers are shown as the red curve in
Figure 1. The transmitters and receivers are all in North America. All the
L-shell of the points on the propagation paths are less than 3.6.
Additional ground-based observations were provided by the riometers, which were tuned to a frequency of 30 MHz at higher latitudes. Riometers are used to observe the integrated absorption of cosmic radio noise through the ionosphere, with increased absorption due to additional ionization from both proton and electron precipitation [
21]. The dominant altitude of the absorption is typically in the range of 70–100 km, that is, biased toward relatively soft particle energies (~30 keV electrons) [
25]. In this study, we focus on the riometers at high latitudes with the callsigns GIL (56.38° N, 94.64° W,
L ~ 6.15) and ISL (53.86° N, 94.66° W,
L ~ 5.15). The riometers are represented by blue dots in
Figure 1. Since the riometers are located at high latitudes, they can detect the variations of the lower ionosphere within the isotropic zone that is affected by the TCS mechanism with energetic electrons injected during substorms.
Data from the Synchronous Orbit Analyzer (SOPA) on LANL-01A (
L ~ 6.6, 8.15° E) were used to depict the electron fluxes in geosynchronous orbit in this paper. The footprint of the LANL-01A is not shown in
Figure 1, because the footprint of it is too far from North America. The electron energies involved in substorm injections, which can be observed by satellite in geosynchronous orbit, are typically 50–1000 keV, with the highest fluxes occurring at the lowest energies [
29].
The NOAA satellite data was used to depict the electron and proton fluxes at ionospheric altitudes. The NOAA satellite is in Sun-synchronous orbits at ~800–850 km altitudes. The data has 2 s time resolutions, which we use in this paper. The SEM-2 instrument package onboard the spacecraft includes the Medium Energy Proton and Electron Detector (MEPED) and the Total Energy Detector (TED). Since the MEPED instrument has two detectors oriented approximately one along and another perpendicularly to the geomagnetic field at high geomagnetic latitudes (>50°), it can measure both trapped (at the satellite’s altitude) and precipitating particles [
30]. The MEPED instrument measures the energetic electrons in three channels (>30 keV (e1), >100 keV (e2), and >300 keV (e3)) and energetic protons in six channels (30–80 keV (P1), 80–240 keV (P2), 240–800 keV (P3), 800–2500 keV (P4), 2500–6900 keV (P5), >6900 keV (P6)).
The EUV (Extreme Ultraviolet Imager) on IMAGE satellite is designed to study the distribution of cold plasma in Earth’s plasmasphere by imaging the distribution of the He
+ ion through its emission at 30.4 nm. The EUV produces global images of the plasmapause [
31]. The EUV plasmapause is assumed to be the “He
+ edge” [
32]. The global position of the plasmapause can be precisely estimated with the observations of EUV.
3. Observations
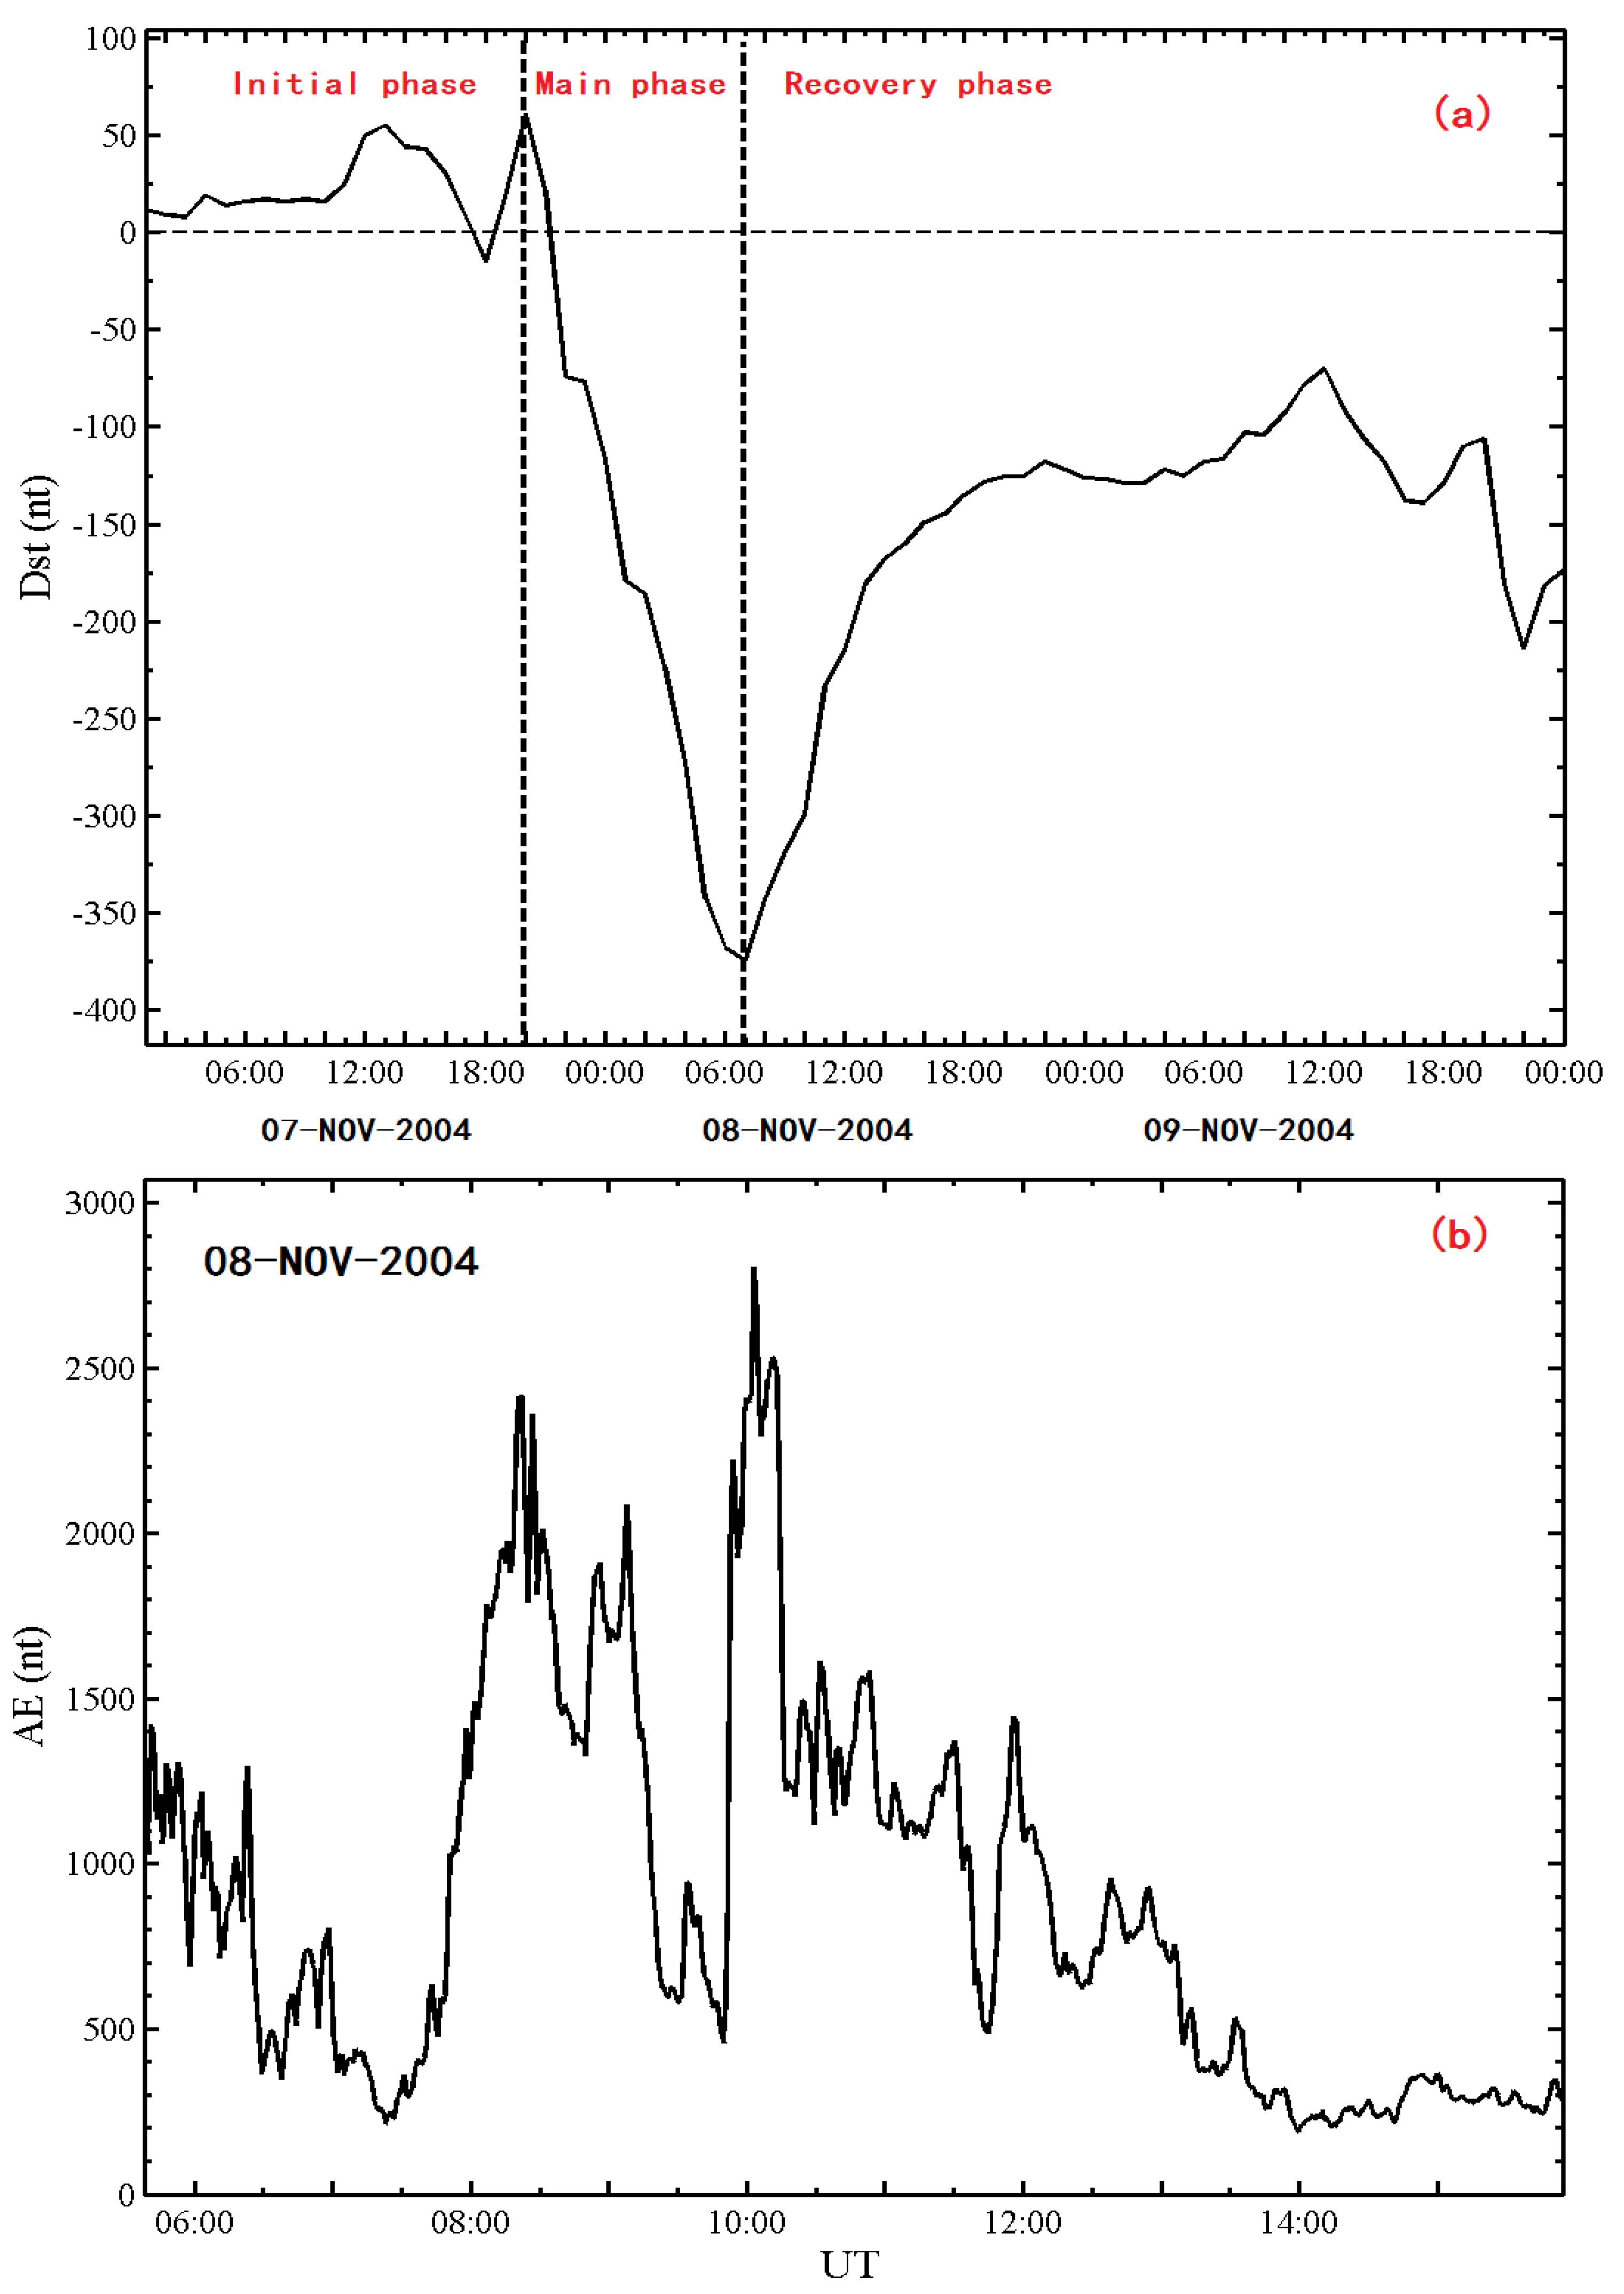
The substorm event we studied for this paper is in the recovery phase of a super geomagnetic storm. The Dst index from 7 November to 9 November is presented in the top of
Figure 2. At 07:00 UT on 8 November 2004, the recovery phase of the geomagnetic storm started. The AE index from 06:00 UT to 16:00 UT on 8 November 2004 is shown in the bottom of
Figure 2. The AE index increased sharply at 06:25 UT, 07:42 UT, and 09:50 UT, respectively, implying three onsets of substorms. Here, we focus on the second substorm event. The Far Ultra Violet (FUV) imaging system on the IMAGE satellite also detected substorm onset for the frame starting at 07:42 UT (not shown here).
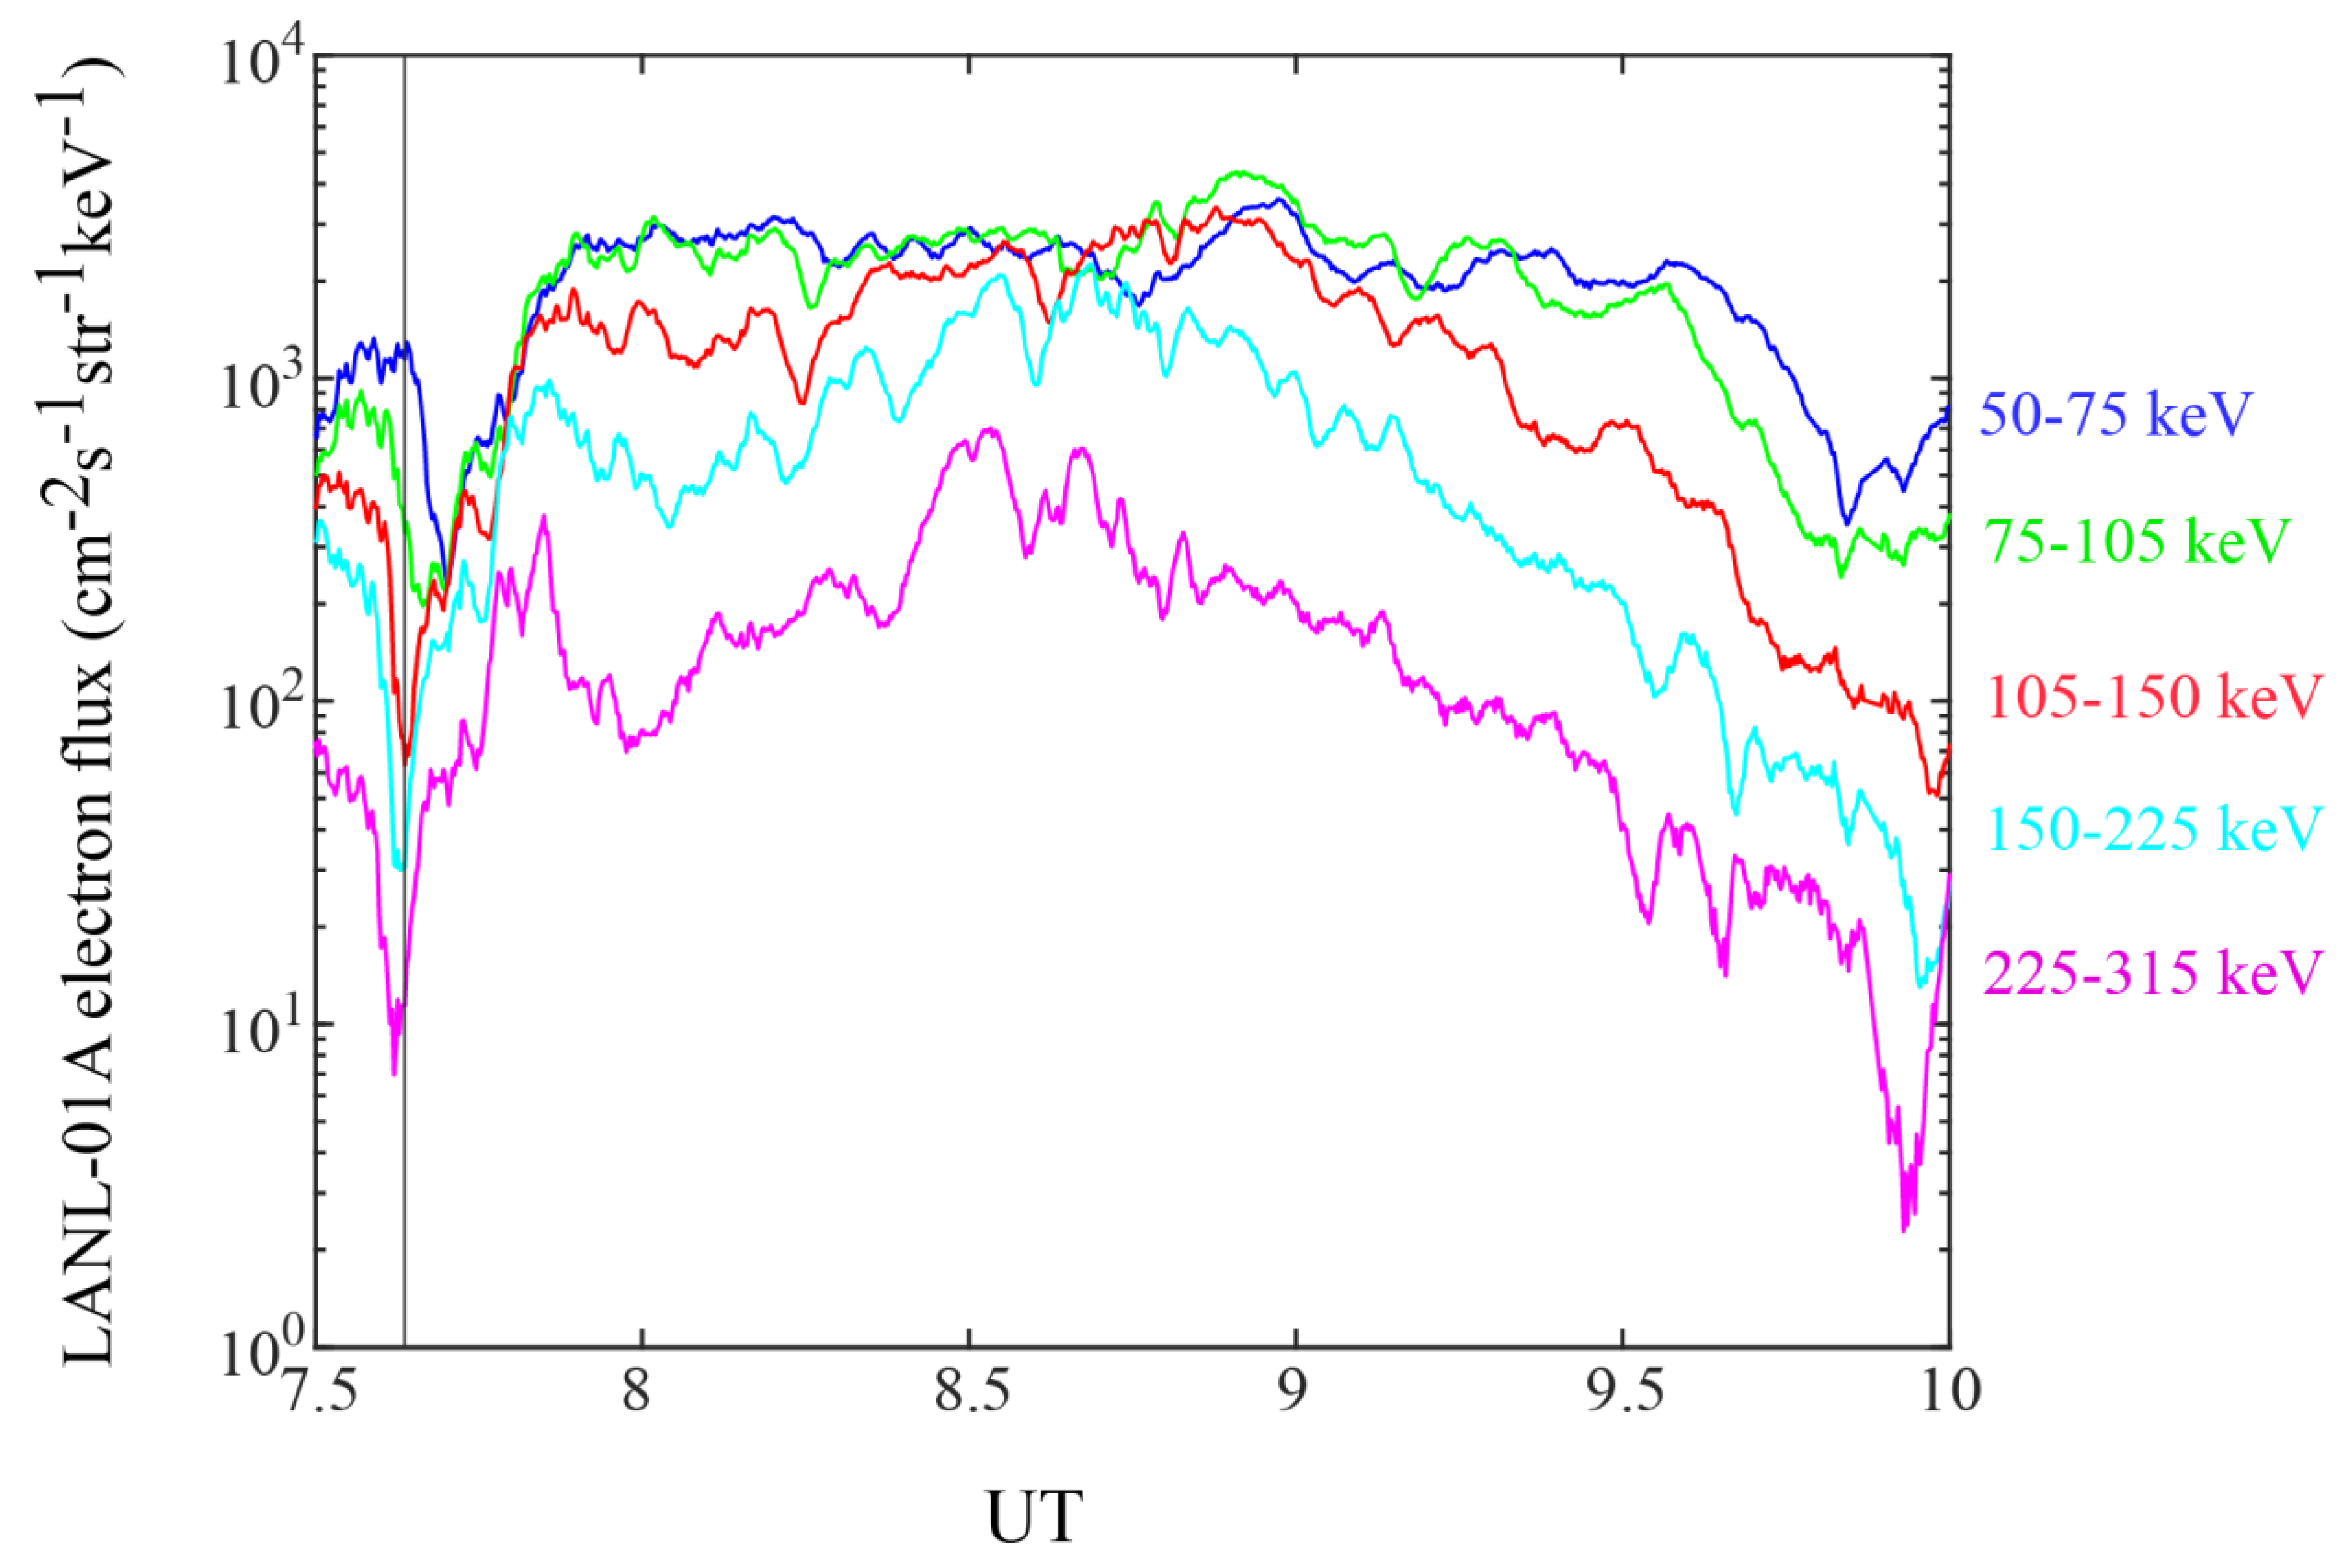
From the detection of LANL-01A, we find that the geosynchronous orbit electron fluxes arise at the onset of the substorm.
Figure 3 shows the differential geosynchronous orbit energetic electron fluxes detected by LANL-01A from 07:30 UT to 10:00 UT. The LANL-01A was located in the morning sector in the interval (MLT was 8.4 at 07:42 UT). The LANL-01A observed a sharp enhancement of electron fluxes around 07:42 UT that is called the ‘major injection’, which is associated with the onset of substorm. We can see that the highest-energy (225–315 keV) channel increased 5 min earlier than the lowest-energy (50–75 keV) channel, implying a dispersive injection. The satellite was located on morning sector, while the injection location was usually close to the midnight. Owing to curvature and the ∇B-drift velocities of higher-energy electrons being greater than those of lower-energy electrons, as a result the higher-energy electrons arrived earlier than the satellite. The high fluxes before 07:36 UT are contributed to the previous substorm with an onset at 06:05 UT.
NOAA 15 and NOAA 16 were used to investigate the energetic particles precipitating into the ionosphere during this substorm. The dashed green line in
Figure 1 shows the footprint of NOAA 16 from 7:58 UT to 08:03 UT. Although NOAA 15 was over the southern hemisphere from 08:25 UT to 08:31 UT, we projected the trajectory of NOAA 15 onto the northern hemisphere along the magnetic field line. The projection path of NOAA 15 from 08:25 UT to 08:31 UT is denoted by the dashed black line in
Figure 1.
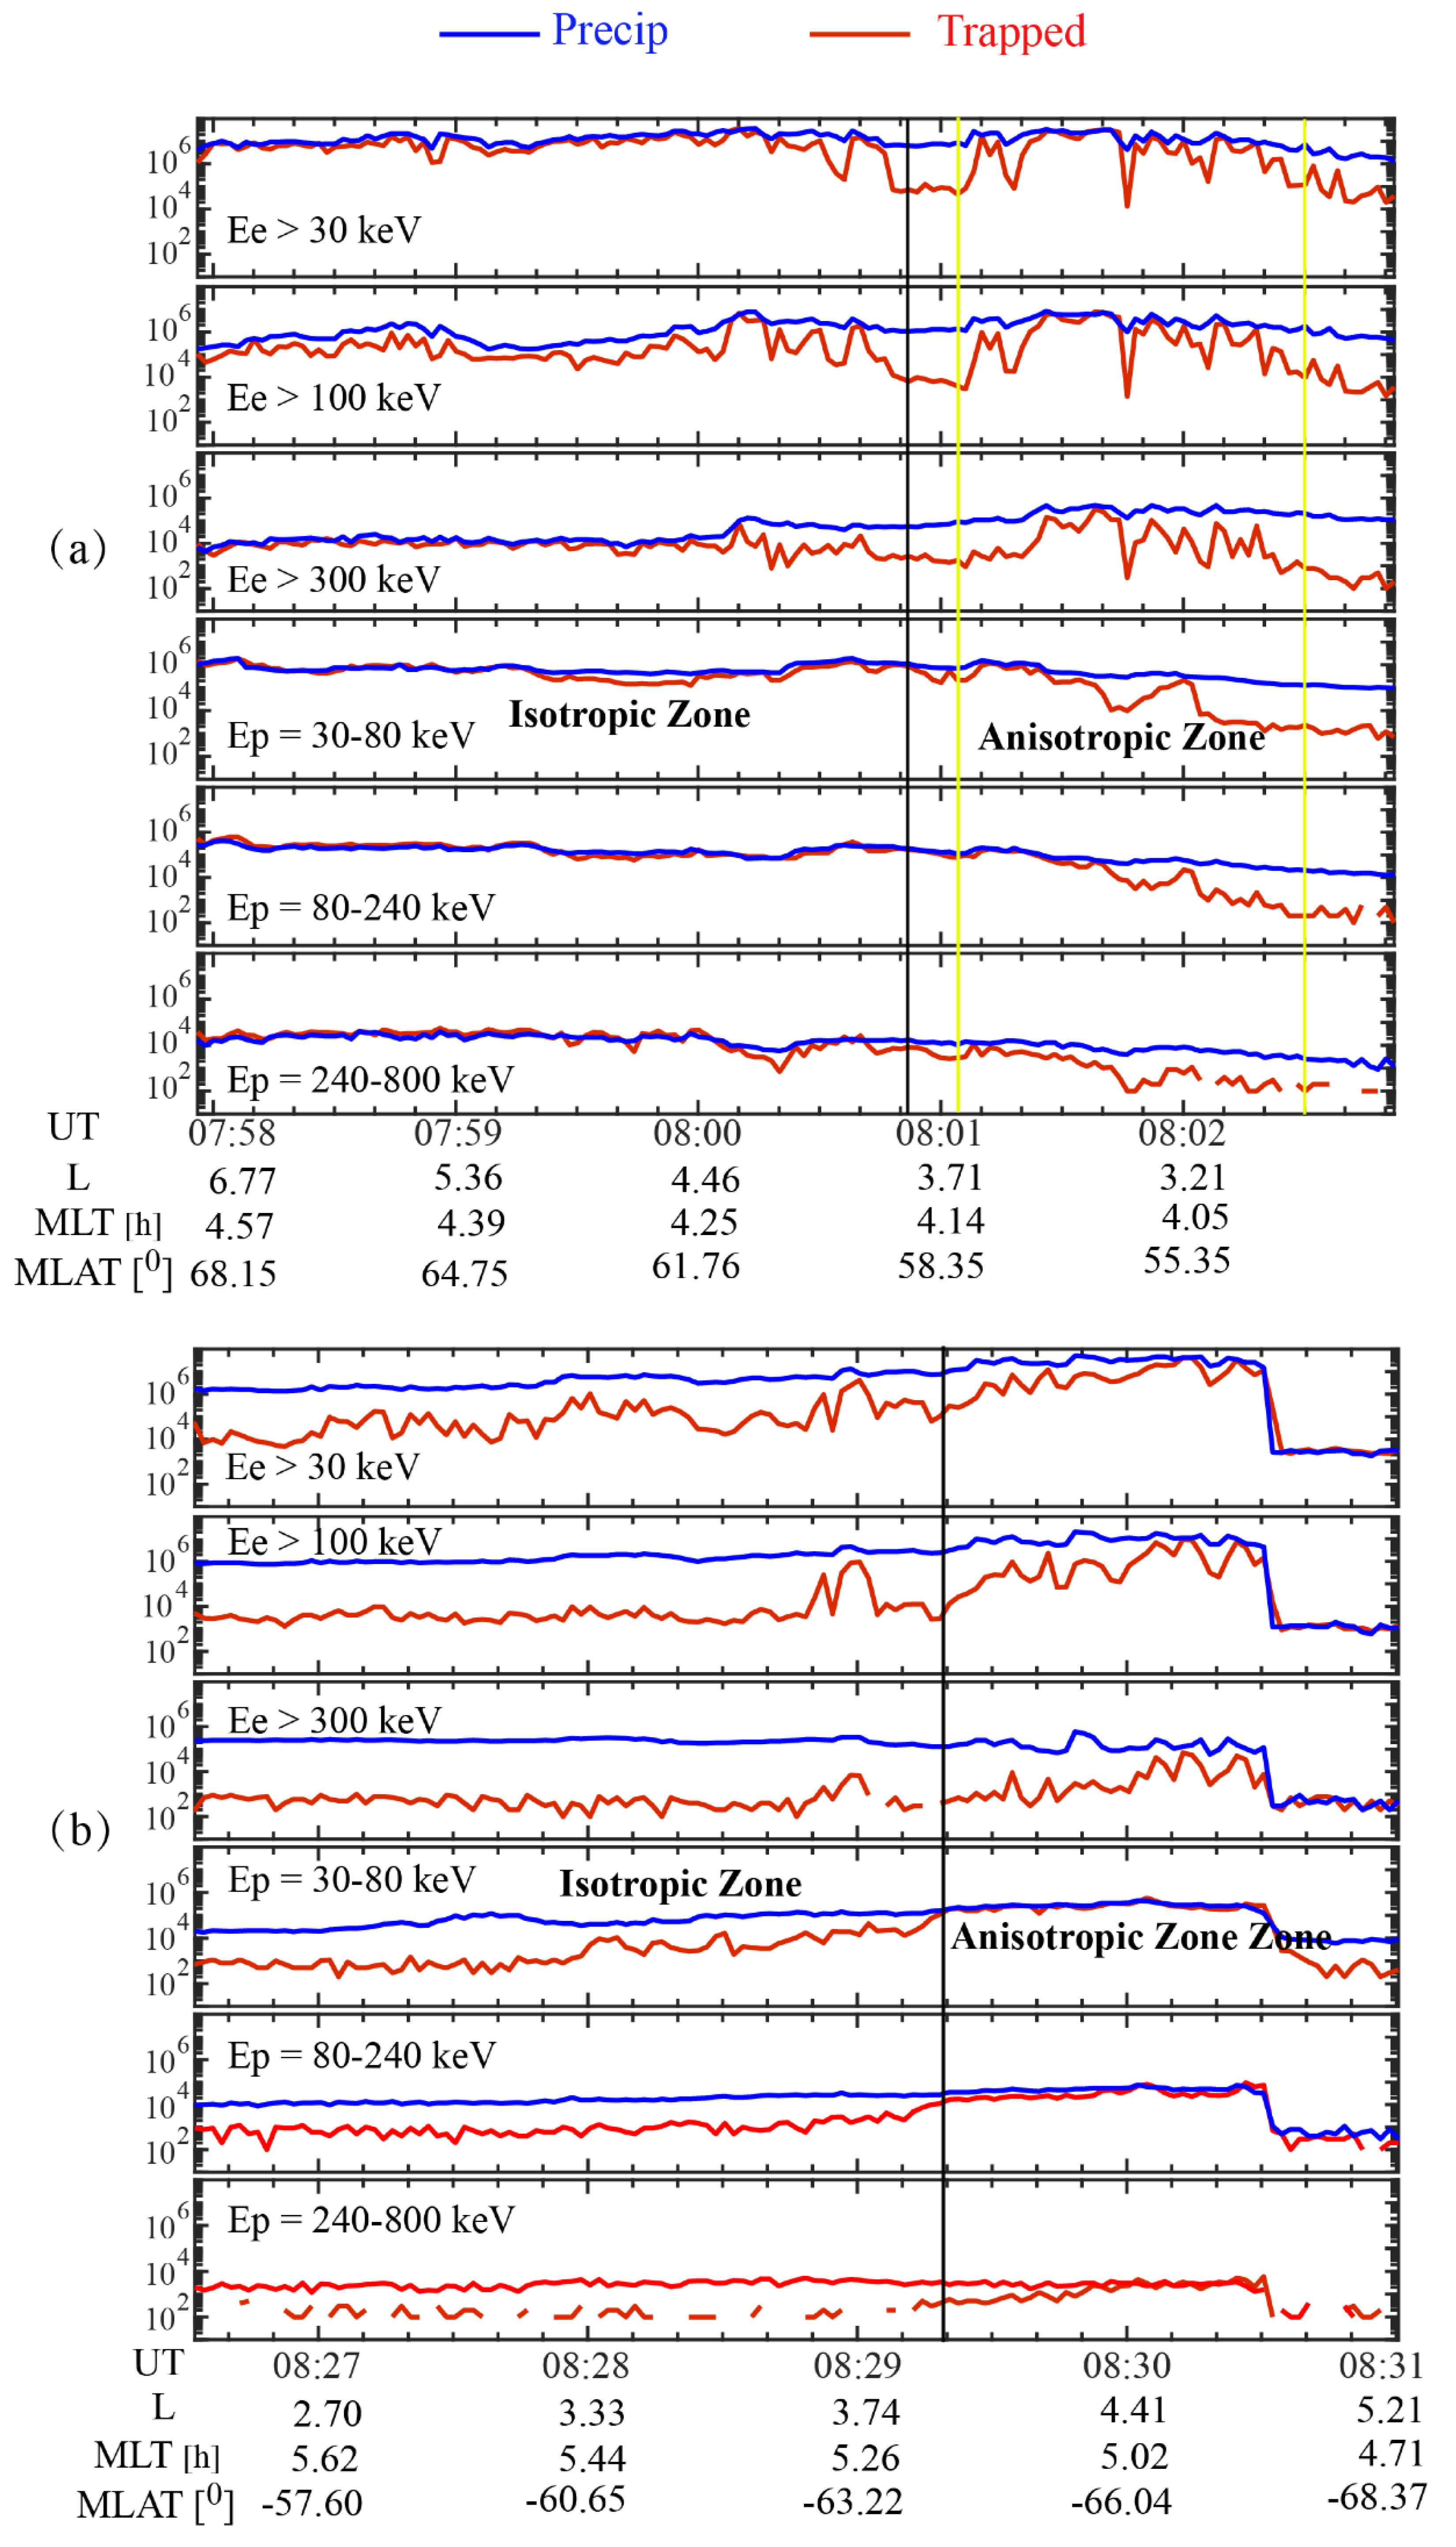
It is necessary to compare intensities of precipitating fluxes with those of trapped fluxes in order to characterize the anisotropy of the particle pitch angle distribution [
14]. In
Figure 4a, blue and red lines show the trapped and precipitating flux intensities observed by the MEPED instruments of the NOAA 16, since the latitudinal position of electron IB is expected to be more variably unstable than that of proton IB [
3]. The proton IB has always defined as the boundary between the adiabatic and stochastic particle motion in the equatorial tail current sheet [
33]. Here, we used the IB of proton with energy from 30 to 80 keV to separate the isotropic zone and anisotropic zone. The black vertical solid line denotes the proton IB (
L ~ 3.79), which is poleward boundary of the anisotropic zone and also the equatorial boundary of the isotropic zone.
We can see that when NOAA 16 crosses from the isotropic zone to the anisotropic zone, precipitating electron fluxes decrease sharply, especially electrons with energies > 30 keV and >100 keV. Nevertheless, a sharp enhancement of the precipitating electron fluxes in all energy channels is seen at 08:01:02 UT within the anisotropic zone. The precipitating electron fluxes within the anisotropic zone in the first two channels (electron with energies > 30 keV and >100 keV) are almost as intense as the mirroring fluxes. The higher precipitating electron fluxes persist from
L ~ 3.71 to
L ~ 2.92 (this section of the path of NOAA 16 is marked by the black dashed box in
Figure 1). The peak of precipitating electron flux within the anisotropic zone is located at MLAT = 55.64°,
L = 3.41, MLT = 4.03. The peak of precipitating flux is particularly significant for precipitating electrons with energy > 300 keV. There are also apparent precipitating proton fluxes in the anisotropic zone. The peak of precipitating proton flux within the anisotropic zone is located at MLAT = 57.92°,
L = 3.63, MLT = 4.12.
On the other hand, the precipitating electron fluxes within the isotropic zone (L > 3.79) in channels >30 keV are almost equal to or exceed the precipitating electron fluxes from L ~ 3.71 to L ~ 2.92, while precipitating electron fluxes within the isotropic zone in channels >100 keV and >300 keV are smaller than those from L ~ 3.71 to L ~ 2.92. It can be seen that the precipitation of energetic electrons within the anisotropic zone is latitudinally separated from that within the isotropic zone distinctly. This latitude separation enables us to identify the different precipitation zone due to the different coupling mechanism.
In
Figure 4b, the trapped and precipitating flux intensities observed by NOAA 15 are shown. The
L-value’ of IB was 3.97 at 08:30 UT and 3.79 at 08:01 UT observed by NOAA 15 and NOAA 16, respectively. Because the
L-values of VLF paths are less than 3.6, the three VLF paths should be in the anisotropic zone between 08:01 UT and 08:29 UT.
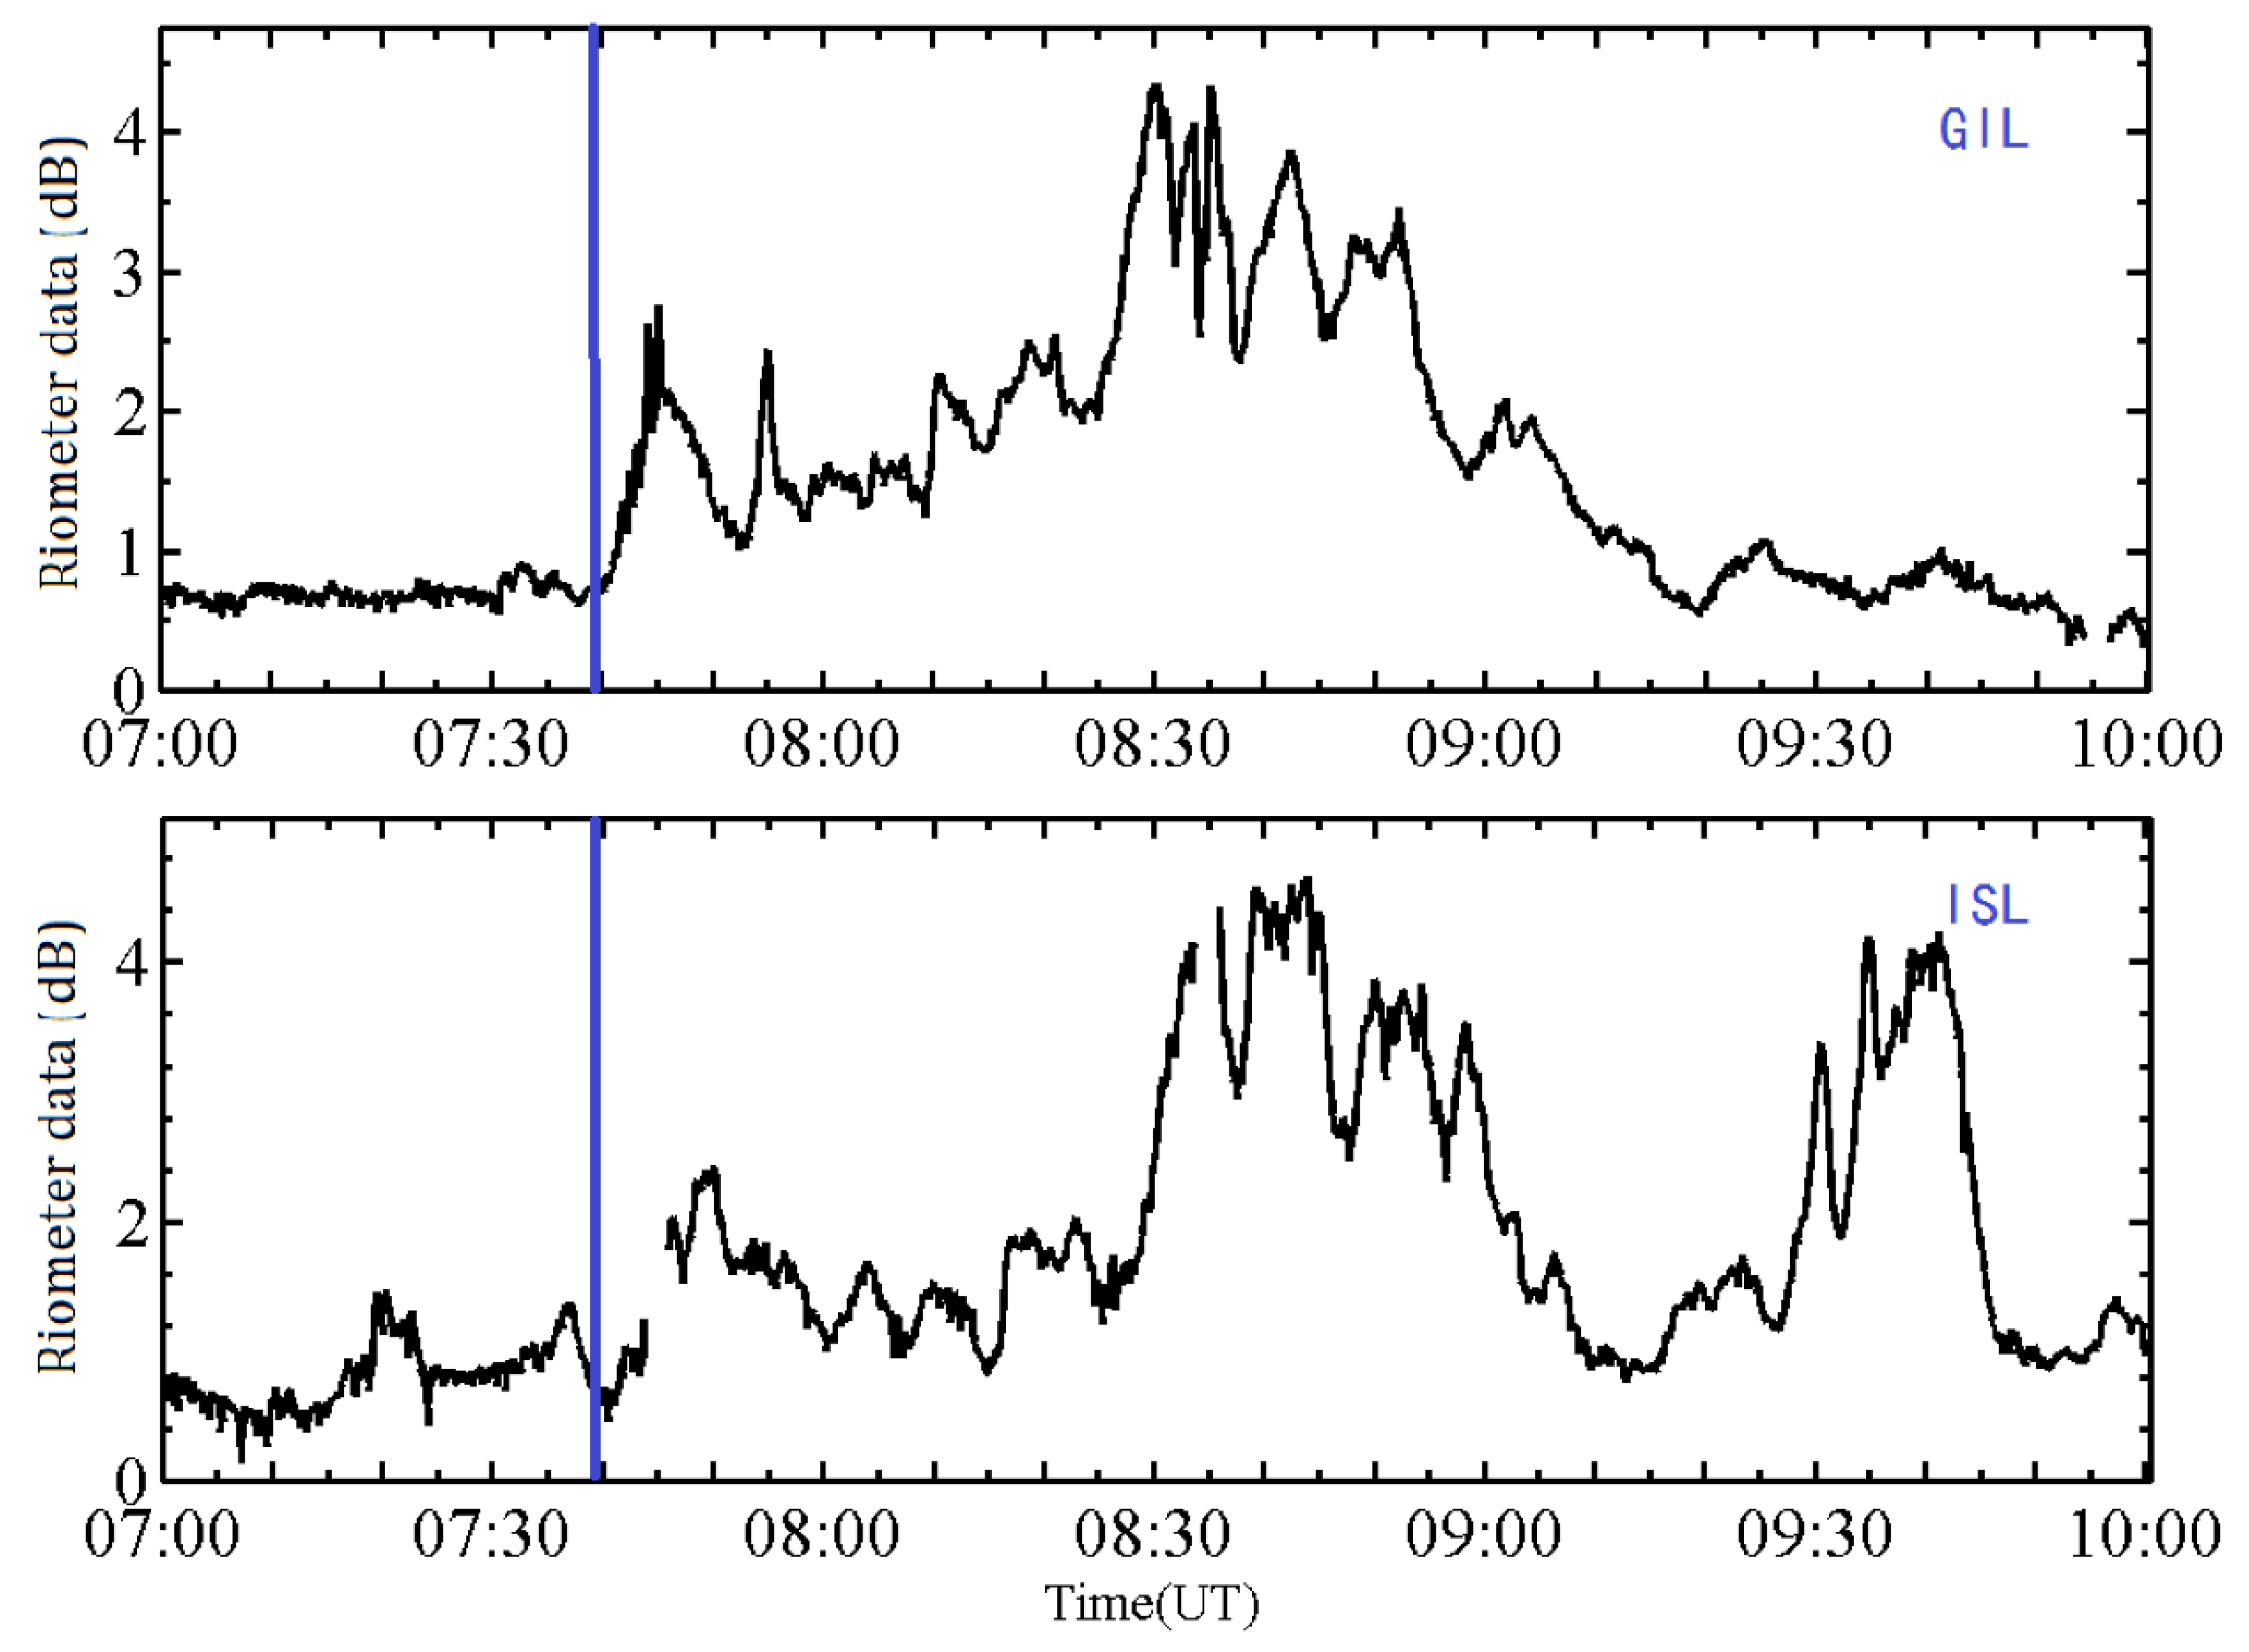
Figure 5 shows the ionospheric absorption measured by riometers at GIL (
L ~ 6.15) and ISL (
L ~ 5.15) stations between 07:30 UT and 10:00 UT. The latitudes of riometers are high, and located at the poleward of IB in the event. It can be seen that the ionospheric absorption detected by the GIL and ISL riometers increased sharply at about 07:39 UT. The ionospheric absorption increased after 2 min of the onset of the substorm. Since the magnetotail magnetic field in the magnetospheric equator is so weak that the particle gyroradius may be comparable with the field line curvature radius, the adiabatic invariant is violated due to the TCS mechanism [
3,
4]. The isotropic energetic electron precipitation is caused nonadiabatically or by sophistication of electron motion which leads to the filling of the loss cone uninterruptedly. The high electron flux within the isotropic zone is a result of electrons injected from the magnetotail current sheet scattered into the loss cone during the substorm. Since the two riometers were located in the isotropic zone and very close to midnight (GIL was at 1.85 MLT, ISL was at 1.92 MLT on the onset of substorm injection), the energetic electrons within the isotropic zone precipitated into the atmosphere and cause additional ionization, which led to enhancements of ionospheric absorption. The enhancement of the ionospheric absorption probed by the two riometers lasts about 100 min, which is very consistent with the interval of the substorm injection detected by LANL-01A shown in
Figure 3.
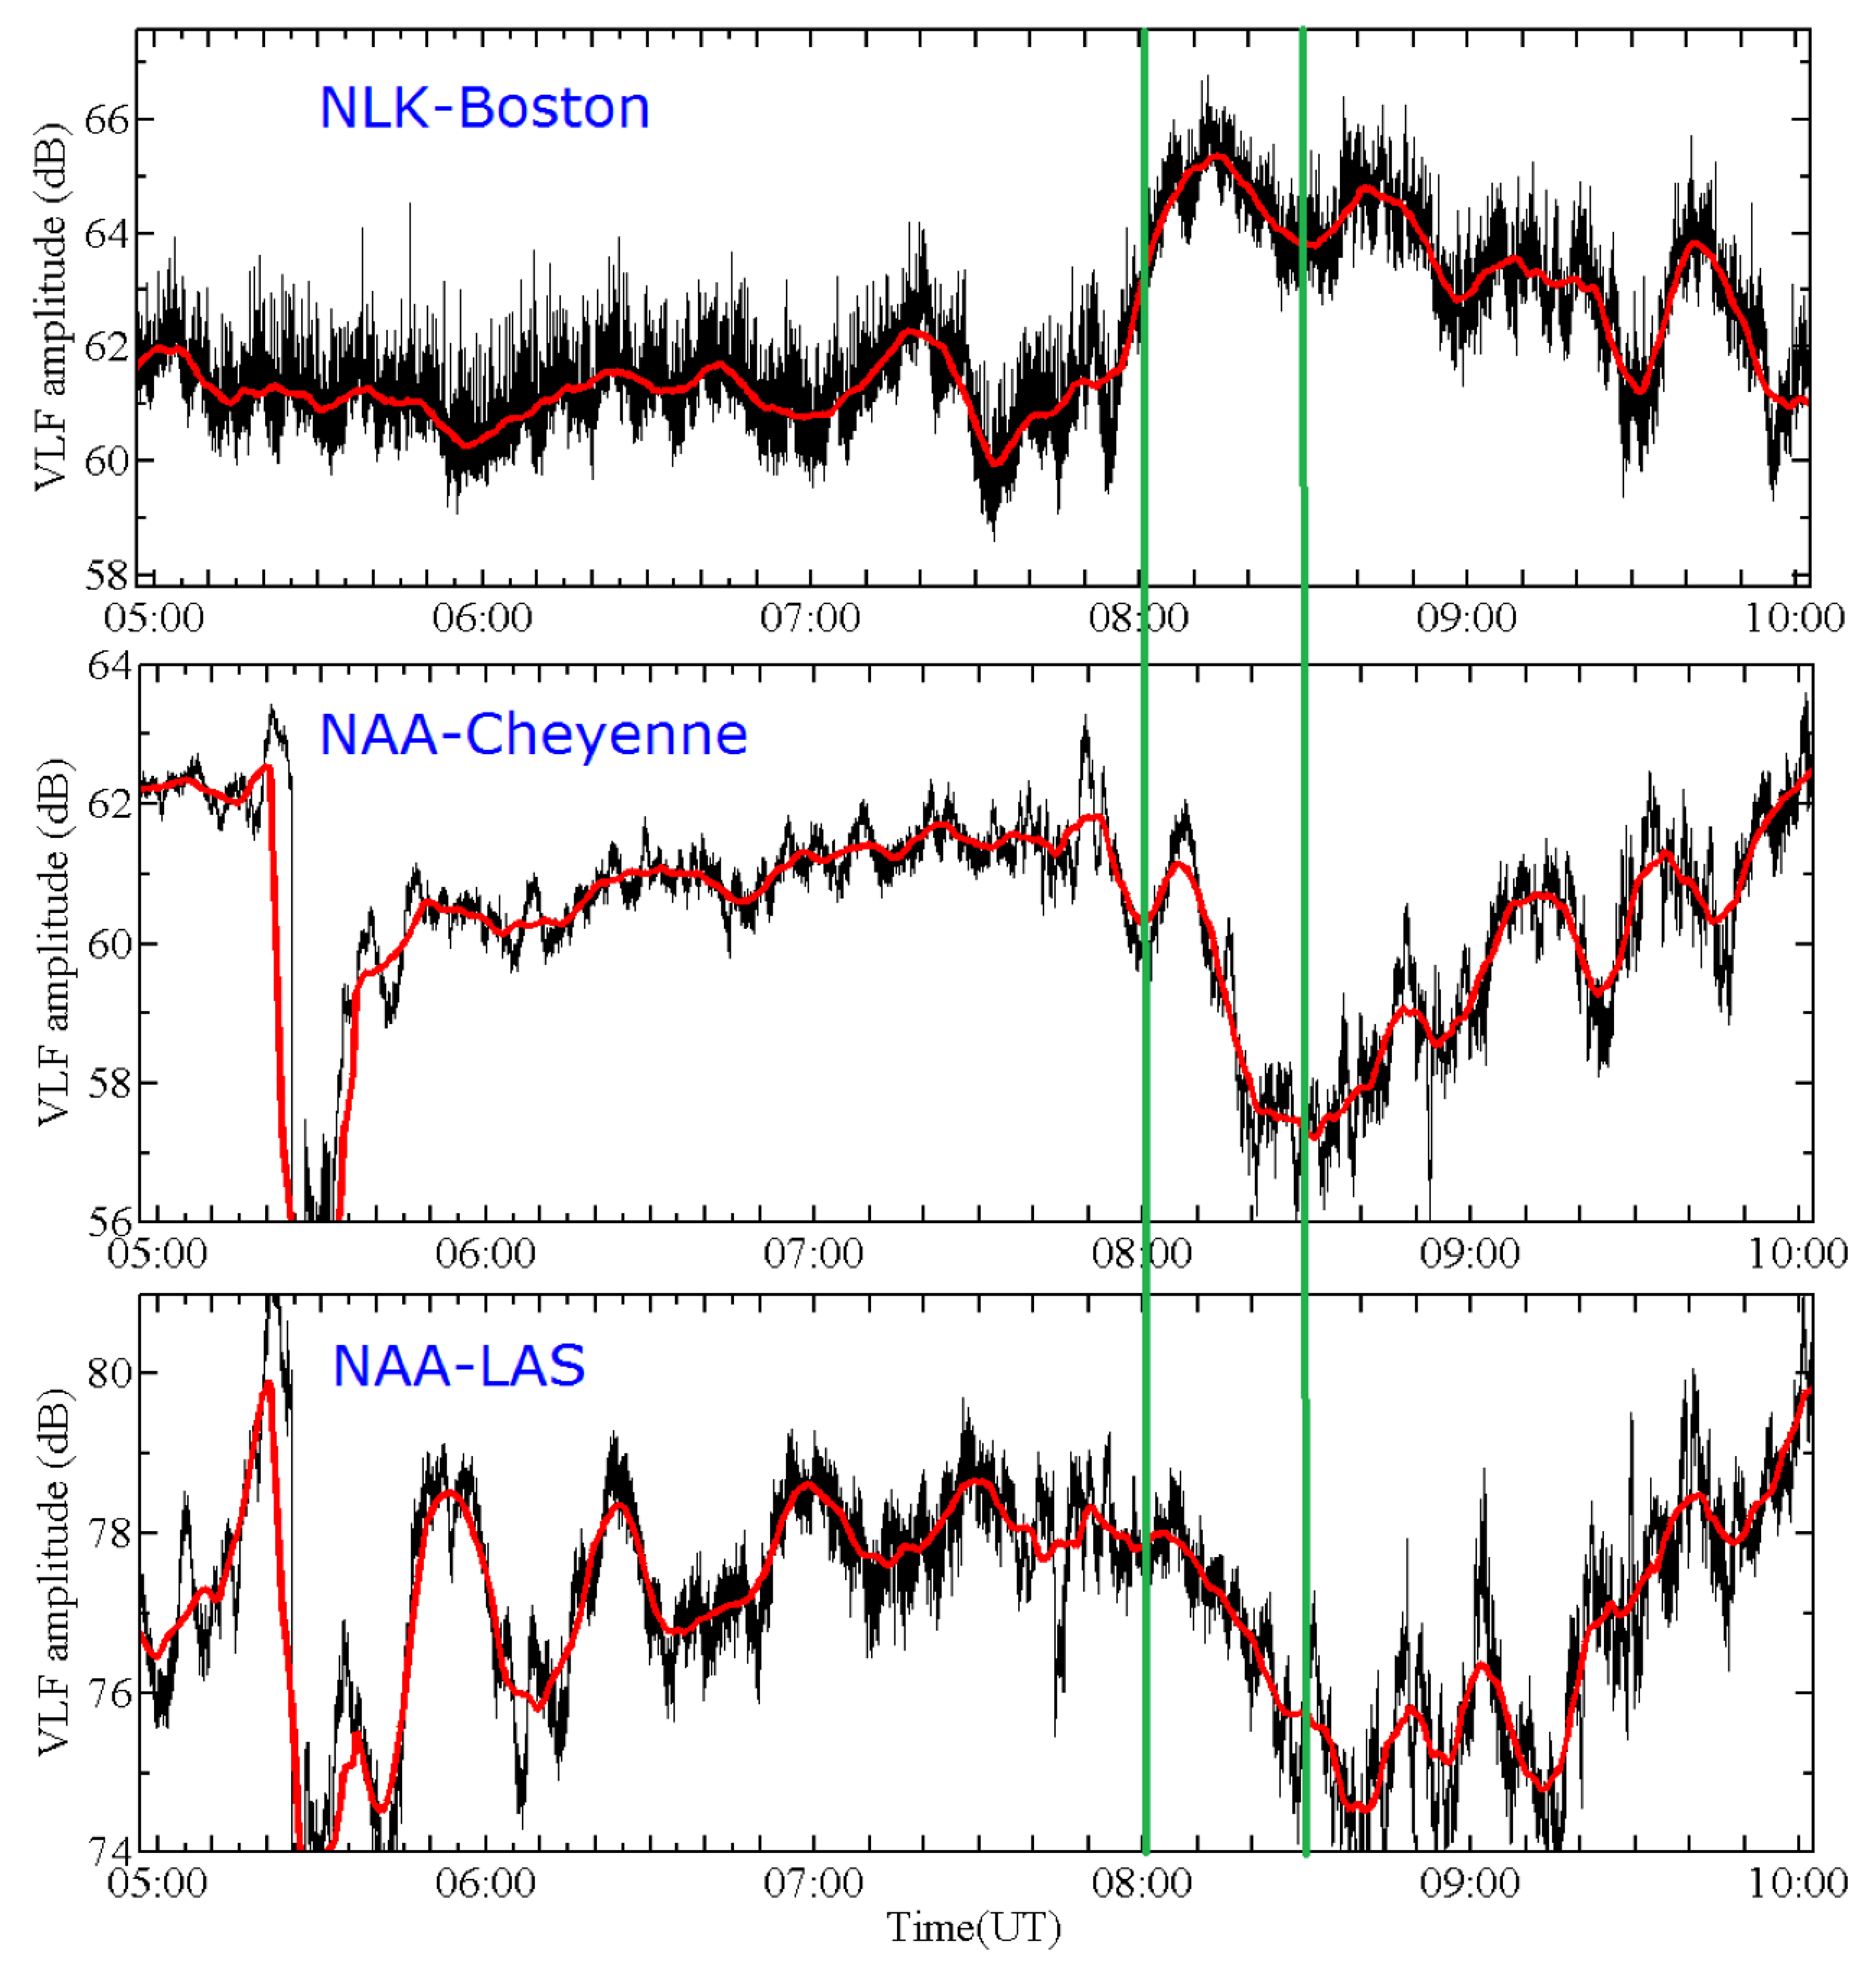
The VLF radio wave paths (indicated by the red curve in
Figure 1,
L < 3.6) in the paper were in the equatorward zone of the IB during the interval from 08:01 UT to 08:29 UT, therefore, the propagation of those VLF radio waves could not be interfered with by electron precipitation within the isotropic zone in this interval. All three paths (NLK–Boston, NAA–Cheyenne, NAA–LAS) pass through the region of energetic electron precipitation within the anisotropic zone (
L = 3.71~2.92) detected by the NOAA 16 satellite. The amplitude of the subionospheric VLF waves from 05:00 UT to 10:00 UT is shown in
Figure 6. The amplitude of VLF radio waves received at Boston and Cheyenne showed obvious variations from 07:50 UT, while those received at LAS showed obvious variation from 08:00 UT. The amplitudes of VLF radio waves from the NAA-LAS path and NAA-CHE path decreased by 6 dB. On the contrary, as shown in
Figure 6, the amplitude of VLF wave from the NLK-Boston path increases by about 6 dB. The amplitude variations of VLF radio waves imply a secondary ionization in the lower ionosphere along the propagating paths from the transmitters to the receivers. With the conjugate observations of the NOAA satellite and the VLF waves propagating through the precipitating electron region as well as the precipitating proton region within the anisotropic zone in the interval from 08:01 UT to 08:29 UT, the variations of VLF waves amplitude may be contributed to precipitating energetic electrons or energetic protons within the anisotropic zone in the interval.
4. Discussion and Conclusions
The conjugate observations demonstrate that there are energetic electron precipitations in both sides of electron IB during the substorm on 8 November 2004. As shown in
Figure 3, a sharp enhancement of energetic electron fluxes is detected by the LANL-01A satellite corresponding to an onset of the substorm, indicating a substorm injection. The onset of the substorm is followed by a sharp enhancement of ionospheric absorption detected by riometers (GIL
L ~ 5.8 and ISL
L ~ 4.8) within the isotropic zone during this substorm. Since the particle gyroradius is comparable with the field line curvature radius in the equatorial plane, the energetic electrons from the substorm injection can be scattered into the loss cone easily and precipitate into the high-latitude ionosphere [
34], which leads to an increase of the ionospheric absorption. Therefore, the ionospheric absorption increase at high latitudes (isotropic zone) is a result of electron precipitation due to tail current scattered energetic electrons from direct substorm injection. Clilverd et al. [
9] have concluded that the electron precipitating flux induced by the TCS mechanism at high latitudes is comparable to the electron flux in geosynchronous orbit during a substorm.
In our event, there not only was an obvious high-latitude ionospheric signature, but also a mid-latitude ionospheric characteristic associated with energetic particle precipitation during a substorm. A sharp enhancement of the precipitating electron flux within the anisotropic zone, with an obvious latitudinal separation of energetic electron precipitation within the isotropic zone (high latitude zone), was observed by NOAA 16. The three VLF radio wave paths only crossed the anisotropic zone and passed through the energetic electron region within the anisotropic zone from 08:01 UT to 08:29 UT. The amplitude of VLF radio waves obviously varied (increased or decreased) during the interval. Variations of the VLF radio wave amplitude imply that there was a great deal of energetic particle precipitate into the lower ionosphere, since all three VLF paths crossed the electron precipitation region detected by NOAA 16 within the anisotropic zone. The conjugate observations of the VLF radio waves and NOAA 16 satellite demonstrate a flux enhancement of energetic electrons precipitating into the lower ionosphere.
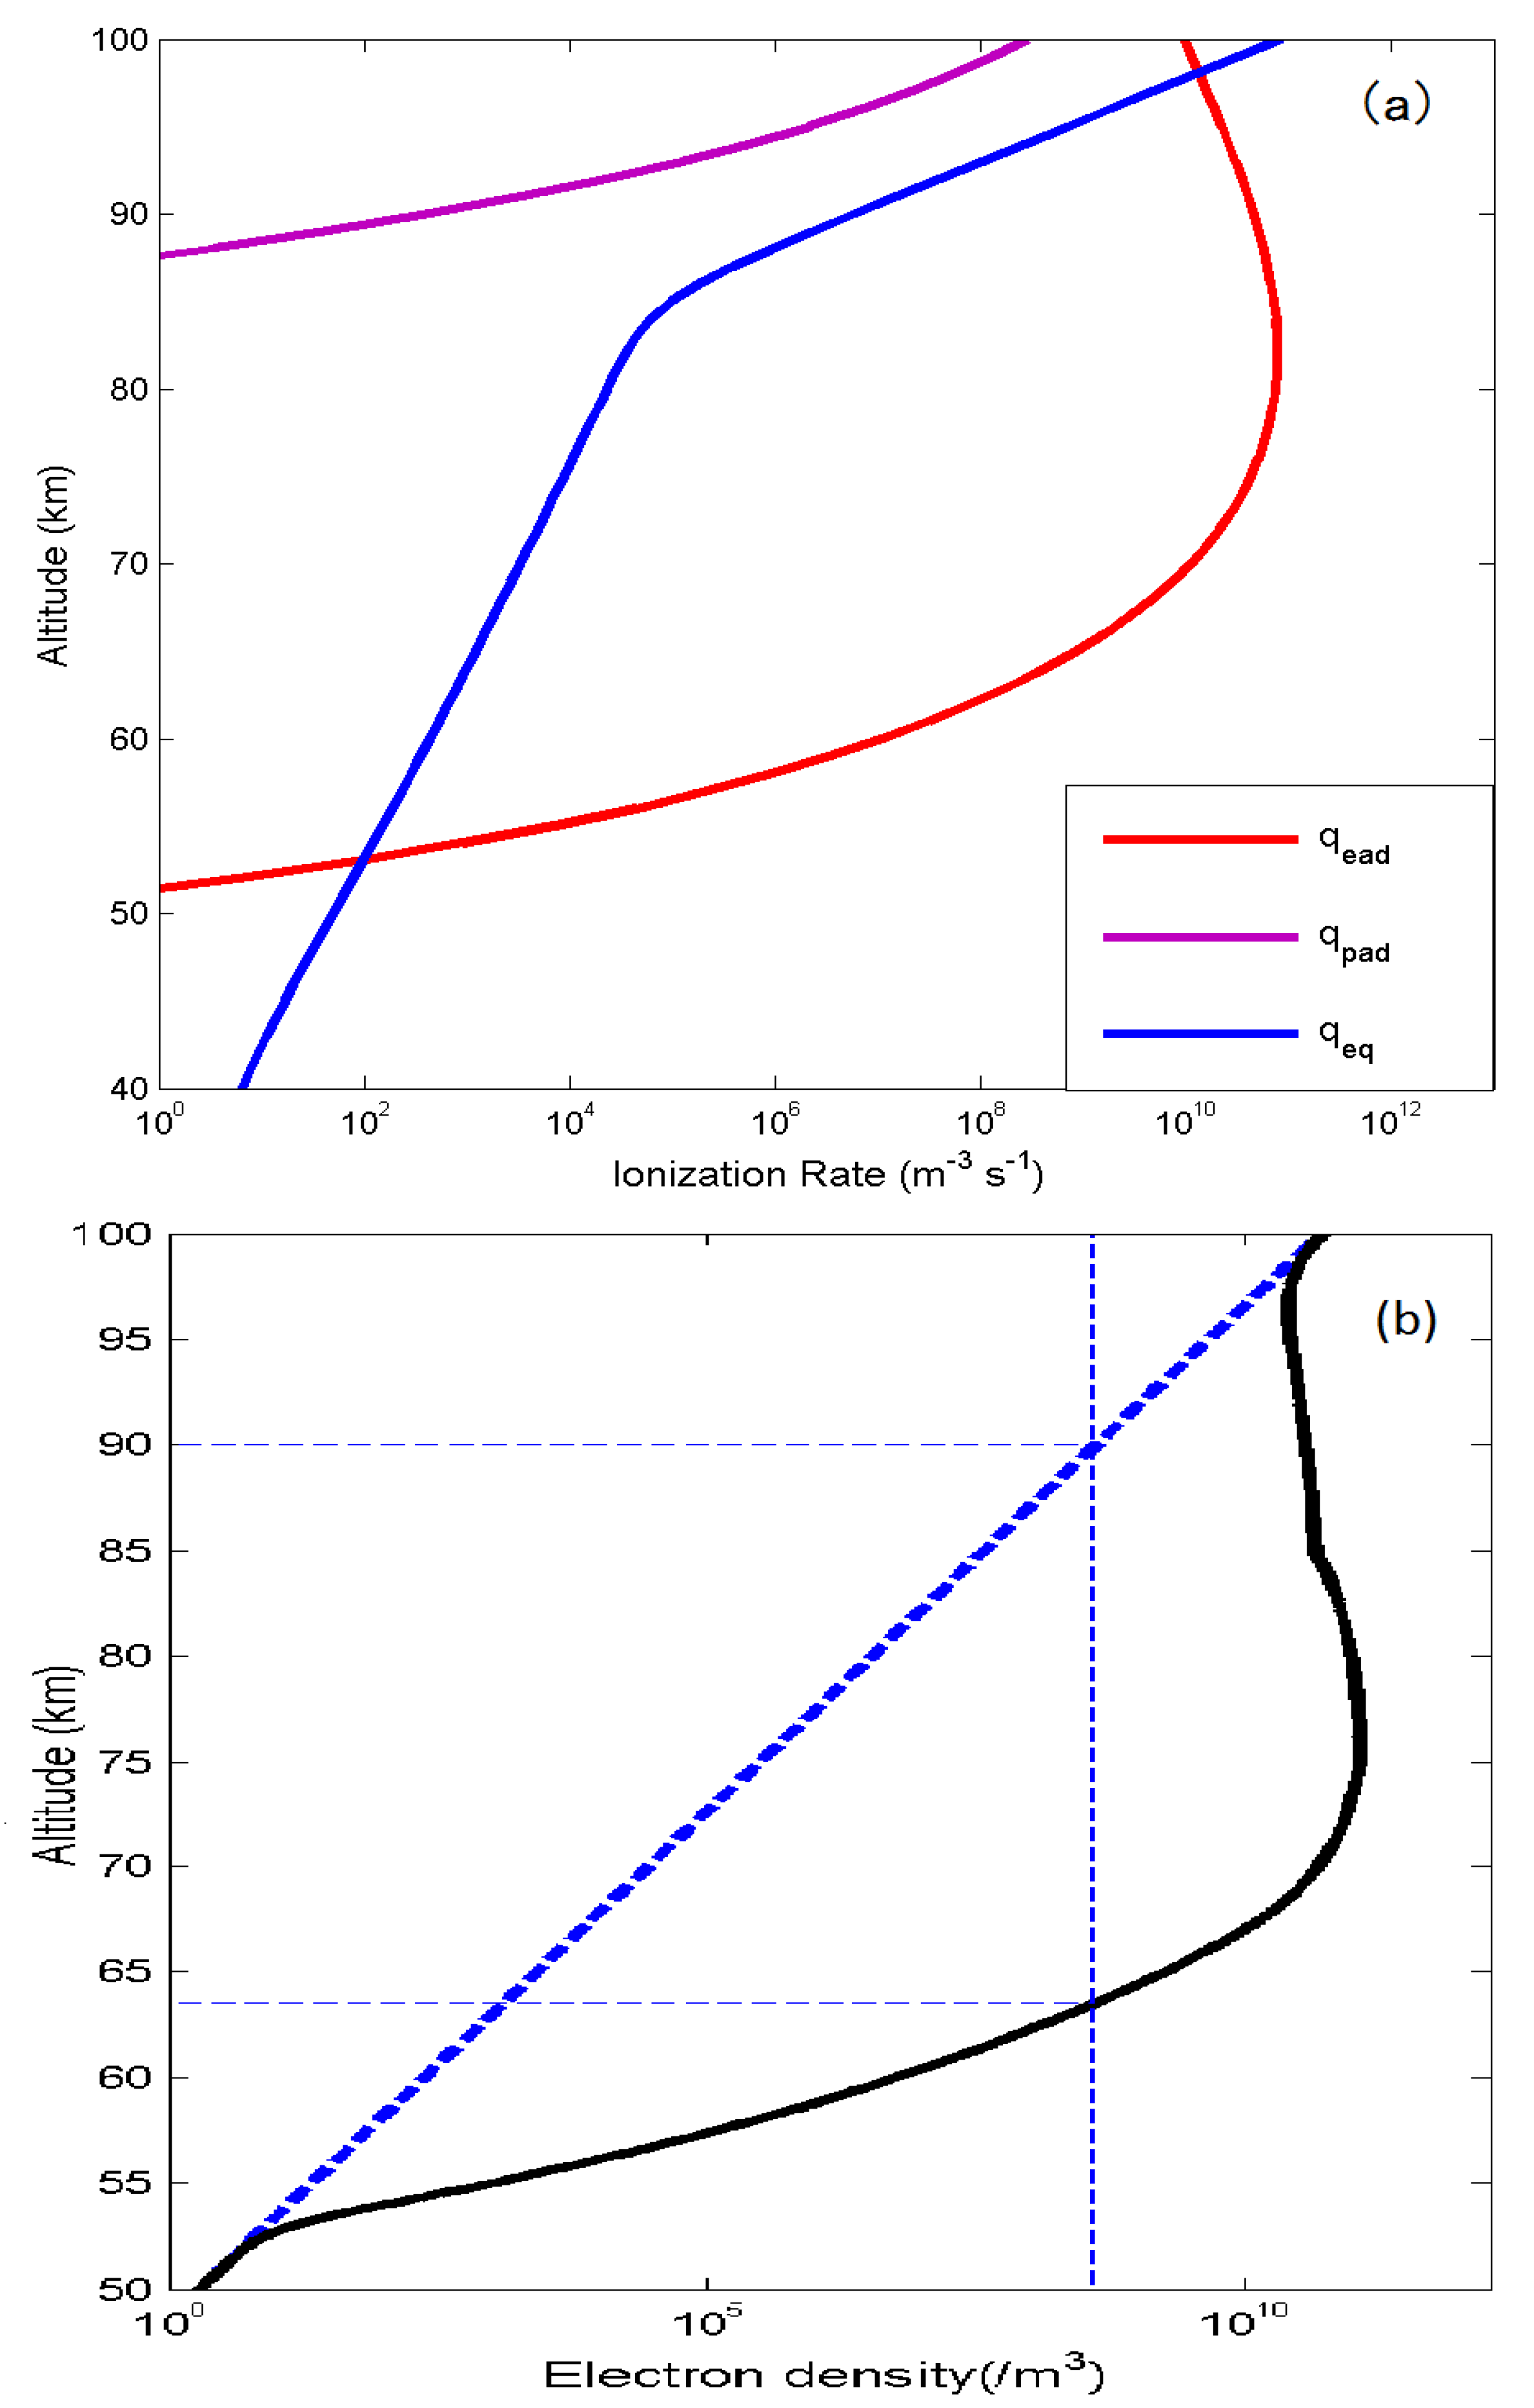
To analyze the influence of energetic electron/proton precipitation within the anisotropic zone on the lower ionosphere and VLF radio wave propagation, the ionization rates in the quiet geomagnetic interval, induced by energetic electron/proton precipitation, were calculated. The electron number density ionization rate in the stable equilibrium without precipitating energetic electrons/protons is defined as
qeq. The
qeq can be derived by the Wait ionosphere model, which is defined in terms of a sharpness parameter and a reference height [
7]. The electron number density profile without energetic particle precipitation is denoted by dashed lines in
Figure 7b.
Given precipitating energetic electrons inside the loss cone within a Maxwellian distribution, the Maxwellian function of energetic flux can be derived with the measured energetic electron fluxes in three channels (>30 keV (e1), >100 keV (e2), >300 keV (e3)) [
35]. The Maxwellian distribution of electron fluxes at the peak of precipitating energetic electron flux detected by NOAA 16 (MLAT = 55.64°,
L = 3.41) can be derived with a characteristic energy of 50.07 keV. The Maxwellian distribution proton flux at the peak of precipitating energetic proton (MLAT = 57.92°,
L = 3.63) can also be derived with a characteristic energy of 33.90 keV. Thereafter, the ionization rate induced by precipitating energetic electrons (
qead) and precipitating energetic protons (defined as
qead and
qpad, respectively) are derived by parameterization models of monoenergetic electron and monoenergetic proton [
21,
36], respectively. In order to clearly describe the added ionization rate induced by precipitation, the ionization rates
qead,
qpad and
qeq in ionospheric below 100 km are shown in
Figure 7a. As shown in
Figure 7a,
qead was much larger than
qeq at altitudes from 60 km to 90 km; on the contrary,
qpad is very little compared to
qeq. We conclude that precipitating energetic electrons increase the electron density in the lower ionosphere remarkably, whereas the precipitating protons contribute little to the electron density of the lower ionosphere. The electron density in the state with precipitating energetic particles below 100 km can be derived by the sum of
qead and
qeq with a simple model [
7]. The solid line in
Figure 7b denotes the electron number density profile with energetic electron precipitation. The energetic electron precipitation alters electron density over the altitude range of ~52 km to 98 km significantly.
In order to further quantitatively estimate the effect of energetic electron precipitation on the VLF radio wave propagation, we calculated the electron number density at its reflection height. The electron density at the reflection height for 24 kHz (the VLF radio waves from NAA) is calculated as 4 × 10
8/m
3 using the Appleton–Hartree formulation [
37]. The reflection height is denoted in
Figure 7b. The full reflection height decreases from 90 km to 64 km due to the energetic electron precipitation.
Since the wave-guide mode can change due to the reduced reflection height during energetic electron precipitation event [
27], the mode number of narrow band VLF radio waves must be converted. The relative initial excitation levels and attenuation rates of the VLF amplitude are very sensitive to the mode number and they are very different for different mode numbers [
38]. Since the narrow band VLF radio waves propagating through the precipitating electron region within the anisotropic zone in the interval from 08:01 UT to 08:29 UT can be converted into different mode numbers, the amplitude of the VLF radio waves (24 kHz and 24.8 kHz) can increase or decrease. We conclude that the amplitude variations of VLF radio waves (
Figure 6) in this interval are in agreement with the wave-guide mode theory. The variations of VLF radio wave amplitude are attributed to the decrease of reflection height significantly due to precipitating energetic electrons. Our calculations of the electron number density due to precipitating electrons certify that the electron precipitation decreases the reflection height of the VLF radio waves and converts the mode number of the VLF radio waves, leading to variations of the VLF radio waves amplitude.
The particle precipitation within the anisotropic zone is induced by wave-particle interaction in the inner magnetosphere. Chorus, hiss, or EMIC can be excited by cyclotron resonance with anisotropic energetic electrons or ions injected near midnight from the plasma sheet [
39,
40]. The EMIC waves can scatter the relativistic electrons (~MeV) and energetic ions into the loss cone [
41,
42,
43,
44,
45]. Nevertheless, ELF, hiss, and chorus can scatter the energetic electrons (>30 keV) within the anisotropic zone [
7,
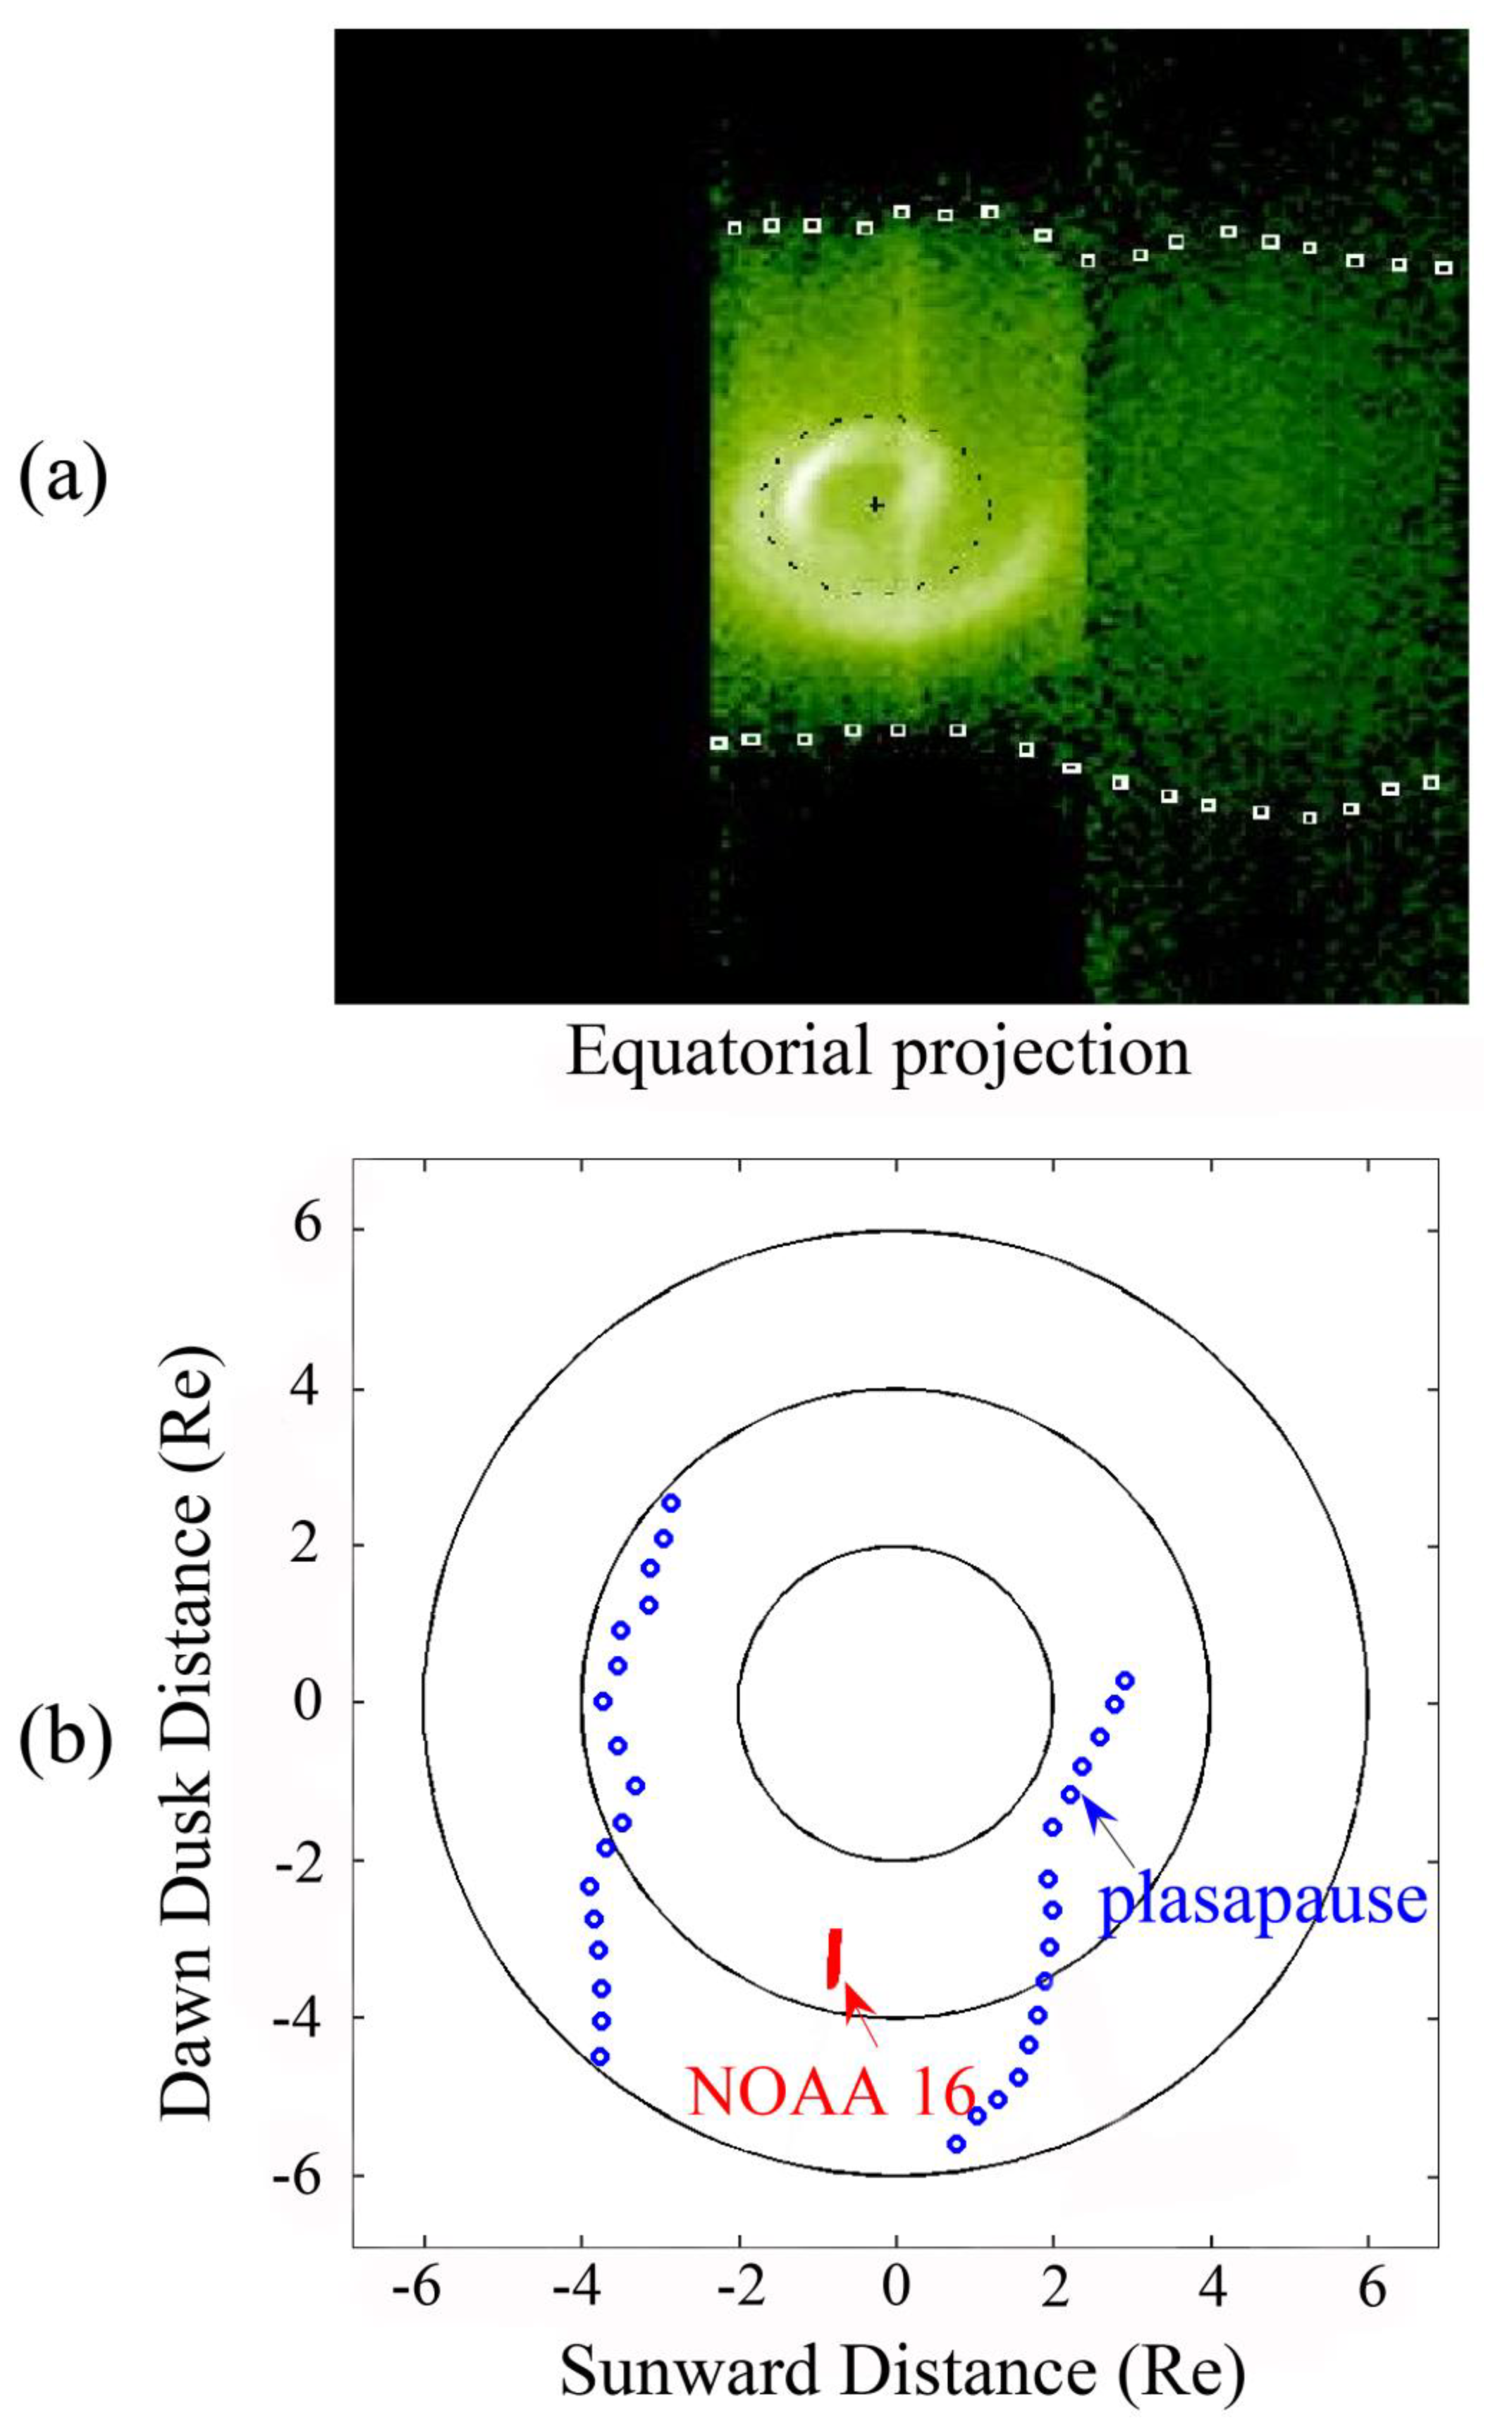
46]; the precipitating electrons within the anisotropic zone should be scattered by ELF, hiss, or chorus in the inner magnetosphere. In order to ensure the origin of precipitating electrons within the anisotropic zone, the data from the EUV of the IMAGE satellite is used in our study. The Extreme Ultraviolet Imager (EUV) images the distribution of He
+ in Earth’s plasmasphere by detecting its resonantly-scattered emissions at 304 Å The approach of the IMAGE Mission is based on simultaneous global imaging of the plasmasphere using neutral atoms, extreme and far ultraviolet light, and radio sounding techniques. The white squares in
Figure 8a depict the plasmapause at 08:06 UT. Blue circles in the
Figure 8b denote the determination of the plasmasphere boundary projected scaled from the corresponding IMAGE EUV snapshot in the top panel at 08:06 UT. When NOAA 16 observes the enhancements of energetic electron precipitation within the anisotropic zone, the trace of NOAA 16 is projected into the magnetic equatorial plane, which is denoted by the red line in the
Figure 8b. It is obvious that the projected energetic electron precipitation region is inside the inner edge of the plasmapause, as chorus waves exist outside the plasmapause while the conjugate position of the energetic electron precipitation is in the inner edge of plasmapause. In addition, obvious energetic electron (>30 keV) precipitation is detected within the anisotropic zone. Therefore, the energetic electron precipitation within the anisotropic region should be induced by the plasmaspheric hiss–electron interaction in the inner edge of the plasmapause. Plasmaspheric hiss waves play important roles in the evolution of energetic electron fluxes in the magnetosphere. Energetic electrons can be scattered into the loss cone by plasmaspheric hiss waves. Thorne et al. (1973) suggest that the pitch angle scattering of energetic electrons induced by plasmaspheric hiss waves is responsible for the slot region that separate the inner and outer radiation belts.
Plasmaspheric hiss can persist during relatively quiet conditions, but the emission intensifies during magnetic storms or substorms [
47,
48,
49]. The intensification of plasmaspheric hiss is associated with the injection of plasma sheet electrons into the inner magnetosphere during substorms, especially substorms in the recovery phase of geomagnetic storms [
50,
51,
52]. Church et al. [
53] and Huang et al. [
54] have suggested that plasmaspheric hiss is generated by cyclotron resonant instability with 10–100 keV inside the plasmapause. Since the injected plasma sheet electrons provide the source of free energy, the plasmaspheric hiss emissions tend to intensify and amplify of plasmaspheric hiss, which is also enhanced during a substorm [
55]. Due to substorm-injected electrons (shown in
Figure 3) going through geosynchronous orbit and drifting into the plasmasphere, the emission intensification of the plasmaspheric hiss can increase. Since the electrons are injected into the ring current, the ring current and its anisotropic rate are also strengthened. The flux of energetic electrons scattered by plasmaspheric hiss into the loss cone could increase sharply. The storm time plasmaspheric hiss waves provide an efficient mechanism for the precipitation loss of energetic electrons from the magnetosphere [
56]. The energetic electrons are scattered into the loss cone and precipitate into the lower ionosphere.
In this study, we investigated the fluctuation of lower ionosphere-associated precipitating energetic electrons during a substorm with observations of the NOAA 16, LANL-01A, and IMAGE satellites; riometers at high latitudes; and VLF radio waves at middle latitudes. Compared with previous studies, in the research we directly examined the fluxes’ energetic electron precipitation within both sides of the IB; both the two different energetic electron precipitation regions and mechanisms within both sides of the IB associated with the substorm were observed and analyzed. Using the data of the ground station, we directly observed the fluctuation of low ionosphere in both sides of the IB. It suggests that the energetic electron precipitation within the isotropic zone effectively contributes to the increase of ionospheric absorption of cosmic radio noise. Furthermore, the NOAA satellite also observed an enhanced precipitating electron flux within the anisotropic zone, which is obviously latitudinal separation with energetic electron precipitation within the isotropic zone. Due to the calculation of the lower ionospheric model, we find that the energetic electron precipitation within the anisotropic zone alters the electron profile of the lower ionosphere, which causes the fluctuation of VLF radio waves. It is consistent with the observed variation of VLF radio wave amplitude, since the projected energetic electron region within the anisotropic zone is in the inner side of the plasmapause observed by IMAGE EUV. The energetic electron precipitation within the anisotropic zone is attributed to ELF hiss-ring current electron interaction inside the plasmapause. As a result, the energetic electron precipitations due to tail current sheet scattering mechanism and wave-particle interaction in the inner magnetosphere were both observed and analyzed as associated with a substorm during a geomagnetic storm.


