Article

Initial Results of Long-term Continuous Observation of Lightning Discharges by FALMA in Chinese Inland Plateau Region

1
Department of Electrical, Electronic and Computer Engineering, Gifu University, Gifu 5011193, Japan
2
China Science Skyline Technology Co., Ltd., Ningxia 751400, China
*
Author to whom correspondence should be addressed.
Atmosphere 2021, 12(4), 514; https://doi.org/10.3390/atmos12040514
Submission received: 26 March 2021 / Accepted: 16 April 2021 / Published: 18 April 2021
(This article belongs to the Section Atmospheric Techniques, Instruments, and Modeling)

Abstract

:
We started a long-term continuous observation of lightning discharges in the Chinese inland plateau region using a fast antenna lightning mapping array (FALMA). During the first year of observation, 2019, we recorded lightning discharges on 25 days in Yinchuan city, the capital of Ningxia. Most of the lightning discharges appeared to occur in the afternoons of individual thunderstorm days in August. We studied the cloud-to-ground (CG) flash percentages, lightning discharge source spatiotemporal distributions, and preliminary breakdown (PB) process characteristics for the two thunderstorm cases that produced the most frequent lightning flashes in 2019 over a wide area. It was found that (1) CG flashes in these two thunderstorms accounted for 28.4% and 32.5% of total lightning flashes, respectively; (2) most lightning discharge sources in these two thunderstorms occurred at temperatures between 5 and −30 °C, with a peak at around −10 °C; and (3) more than 90% of well-mapped PB processes of intracloud (IC) flashes propagated downward. By overlapping the altitudes and the progression directions of the PB processes on the lightning source spatiotemporal distributions, we inferred that the main negative charge of the two storms observed in Ningxia, China, was at a height of around −15 to −25 °C (7 to 9 km) and the main positive charge was at a height of around 5 to 0 °C (2 to 4 km).

1. Introduction

It has been known for over 30 years that the thunderstorms occurring in the Chinese inland plateau region usually produce dominant electric fields on the ground with polarity opposite to that of ordinary summer thunderstorms in low-altitude areas [1,2]. During the early research on the unusual dominant electric fields, two different types of charge structures were debated, one a tripolar charge structure but with a larger than usual lower positive charge center (LPCC) at the base of the thundercloud [1,2,3,4] and the other an inverted dipole [5]. Although a series of subsequent studies were on the side of the former charge structure [6,7,8,9], recent studies using the three-dimensional (3D) lightning mapping system installed in Qinghai province, China [10], for two isolated plateau thunderstorms have shown that the charge structure was an inverted dipole during the developing and mature stages but transformed into more complicated structures during the dissipation stage [11,12]. However, since the 3D lightning mapping system used in those studies consisted of only seven sites and could be continuously operational for less than two months each year, its 3D observation area and time span were very limited. Many thunderstorms larger than those two isolated ones could not be properly observed. Moreover, in order to understand the mechanism of the inverted charge structures, it would be very interesting to locate the boundary areas between inverted and non-inverted thunderstorms and find out how thunderstorms behave in those boundary areas. For this, it is apparently necessary to install a 3D lightning mapping system which covers a plateau area not only much wider than that investigated previously [10,11,12], but which is also close to lowland areas. On the other hand, as reported previously, the return strokes (RSs) produced in the plateau thunderstorms tended to have longer rise times in both slow fronts and fast transitions [13,14,15,16]. Accordingly, we believe that the protection measures for plateau lightning should be different from those for ordinary lightning in lowlands. In order to find out the optimum protection measures for plateau lightning, the RS characteristics apparently also need to be investigated more specifically and widely across the plateau area. As shown in [17,18], the fast antenna lightning mapping array system (FALMA) can not only perform 3D lightning mapping for estimating thunderstorm charge structures but can also record fine features of RS waveforms for the study of their various characteristics. All these factors combined motivated us to semi-permanently install a 25-site FALMA in Ningxia, China, which was located on the Loess plateau adjoining the Qinghai–Tibet Plateau to the west. Although Ningxia has many mountainous areas, most of its terrain is at an elevation of 1250–2000 m, and it is also close to lowland areas to the southeast. We started to install the FALMA in March 2019 and it began continuously operation from the spring of 2019. So far, the FALMA has recorded a large number of lightning flashes. In this paper, we report several preliminary results obtained during our first year of observation. We first give a brief introduction to the Ningxia FALMA and discuss some general thunderstorm characteristics. Then, we report the characteristics of the lightning discharges for the two largest thunderstorms observed in 2019.

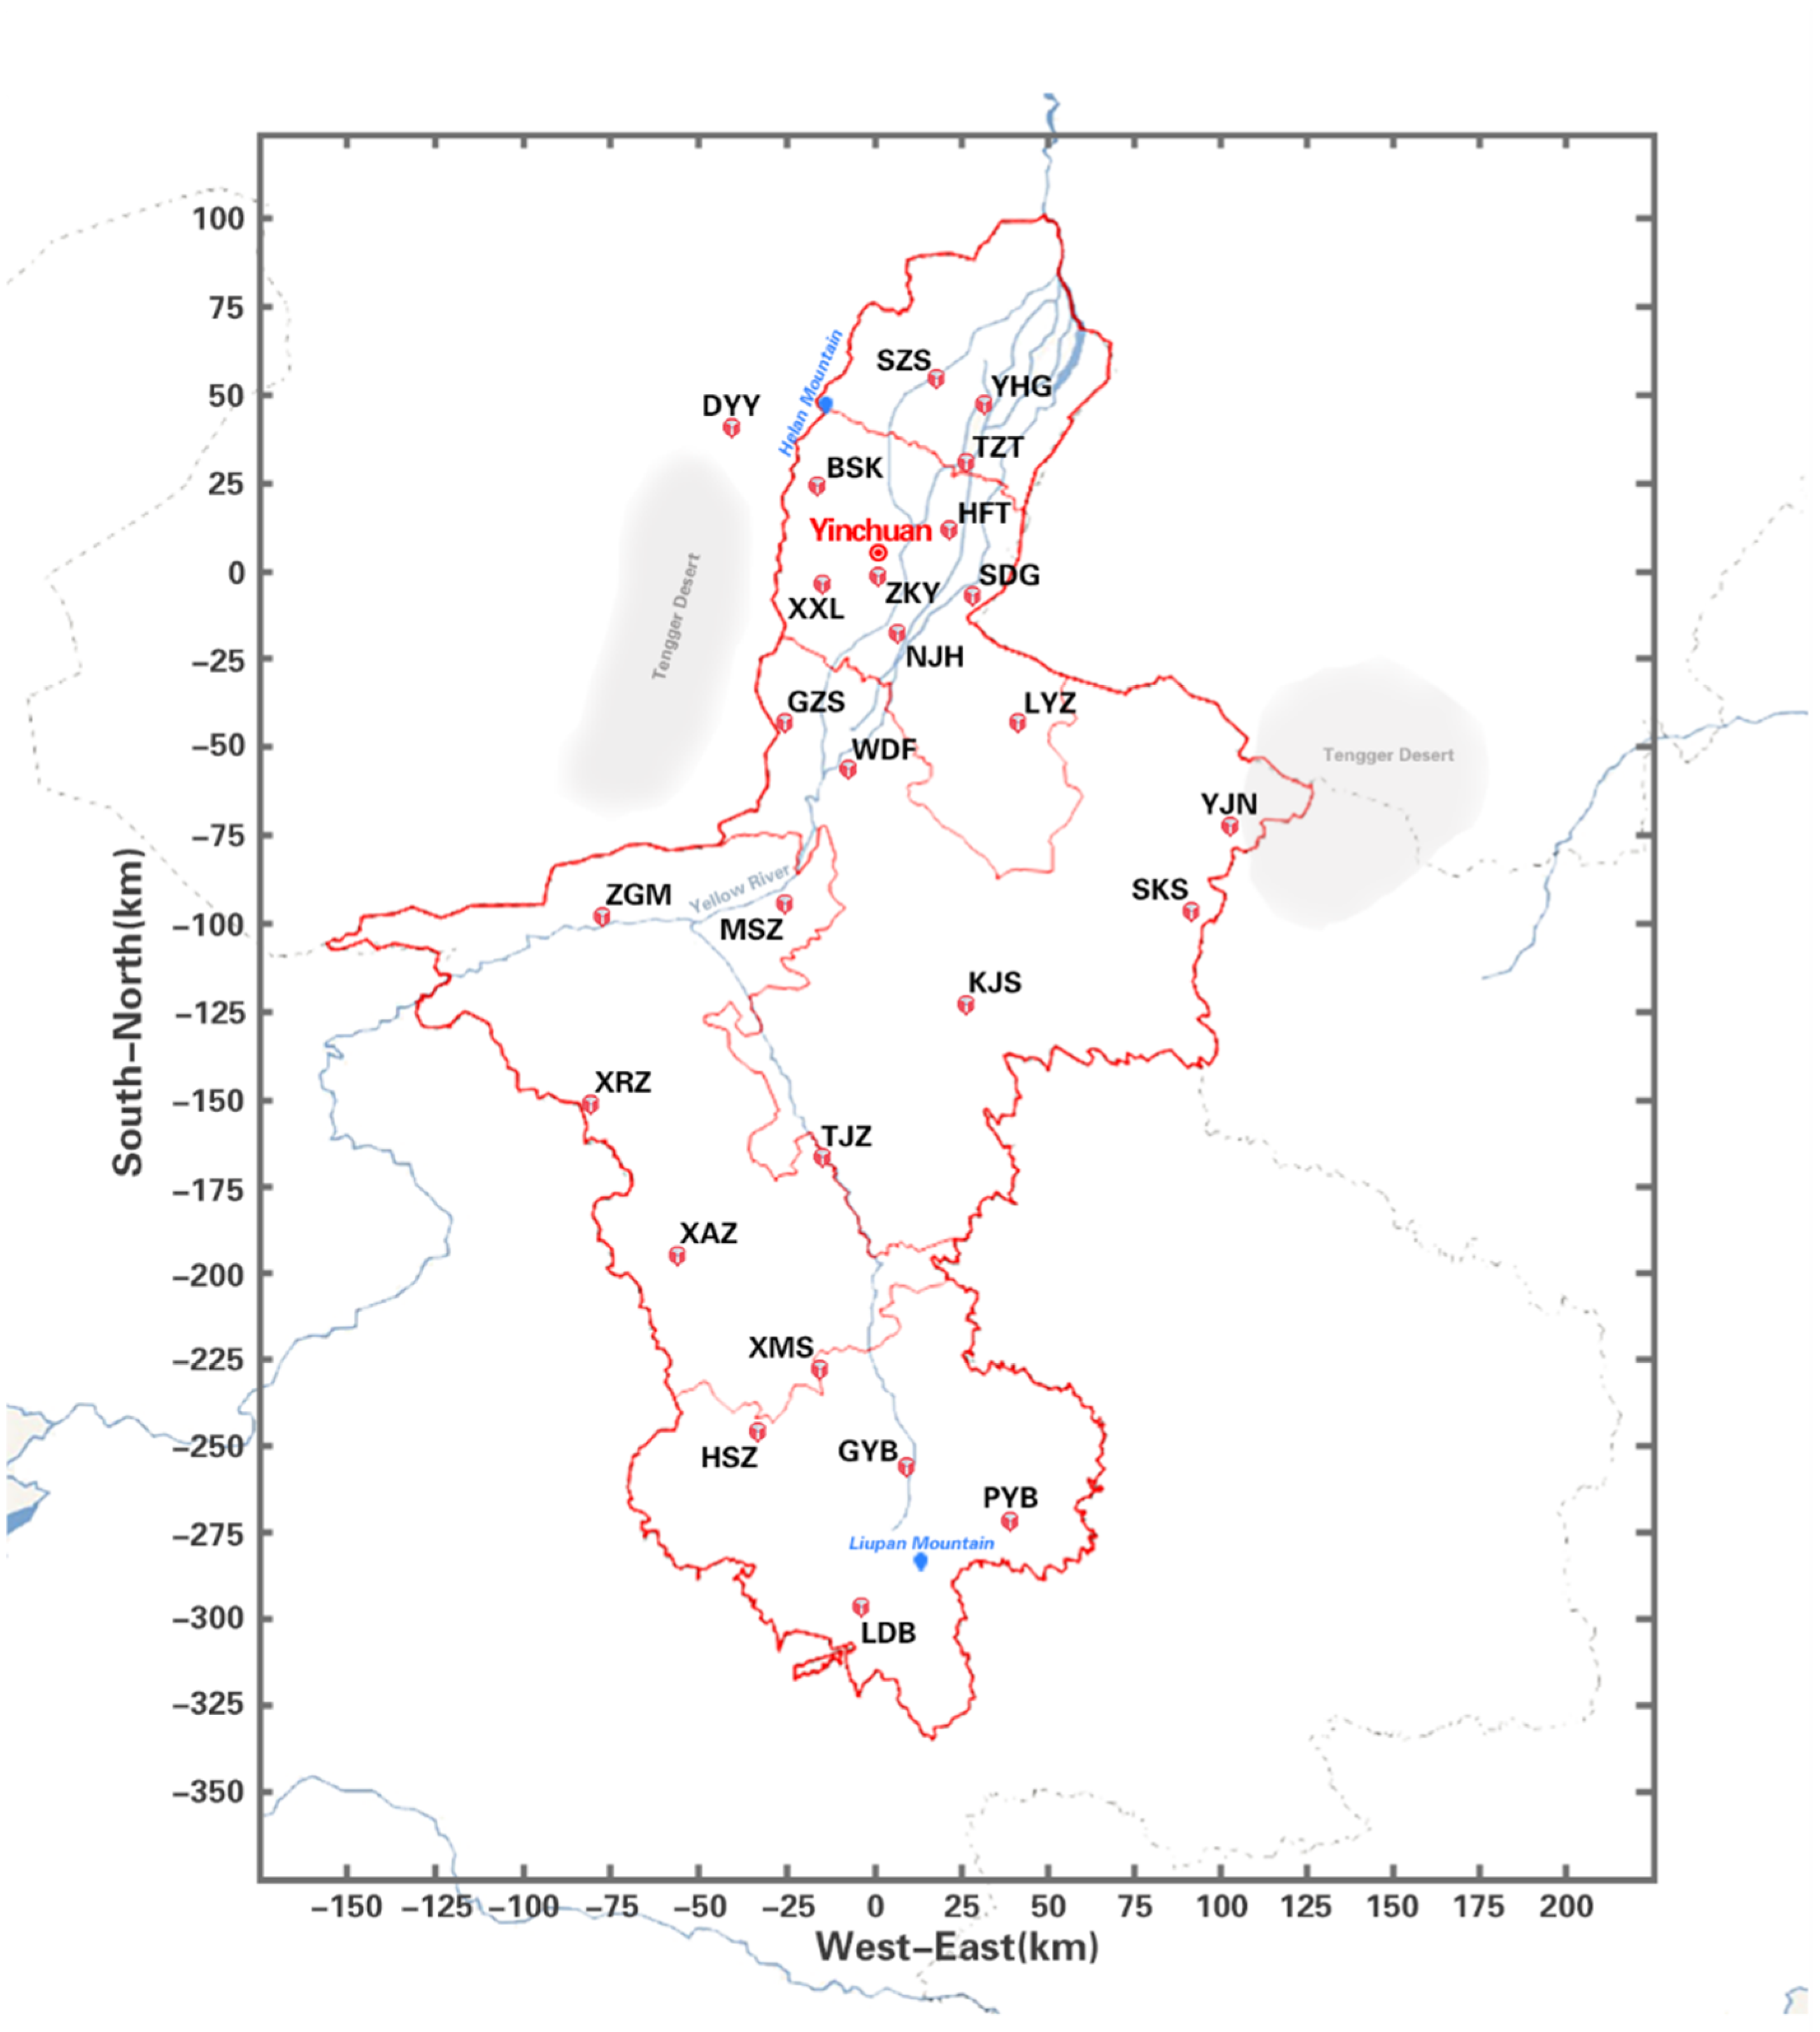
2. Configuration of Ningxia FALMA

Figure 1 shows the site map of the Ningxia FALMA, which covers an area of about 400 km × 300 km. Each of the FALMA sites was equipped with a fast antenna and a data-acquiring system. The fast antennas had a time constant of about 200 μs and received radio waves in the frequency range of about 500 Hz to 500 kHz. In order to achieve a high timing accuracy, each site was allocated a real-time GPS clock to synchronize the signals arriving at different antennas. In the data acquiring system, a commercially available analog-to-digital converter was used. The converter sampling rate was set at 10 mega samples per second (MS/s), indicating that the time precision of the acquired data was 0.1 μs. The time-of-arrival technique was applied for locating the pulses on the electric field change (E-change) waveforms. As shown in [17], using FALMA, a detailed 3D mapping for lightning flashes occurring inside the network can be produced. The estimated horizontal location accuracy for RSs was around 20 m. More information about FALMA and the results obtained in Japan with FALMA can be found in [19,20,21,22,23,24].

3. Initial Results

3.1. General Characteristics of Lightning Discharges in Ningxia

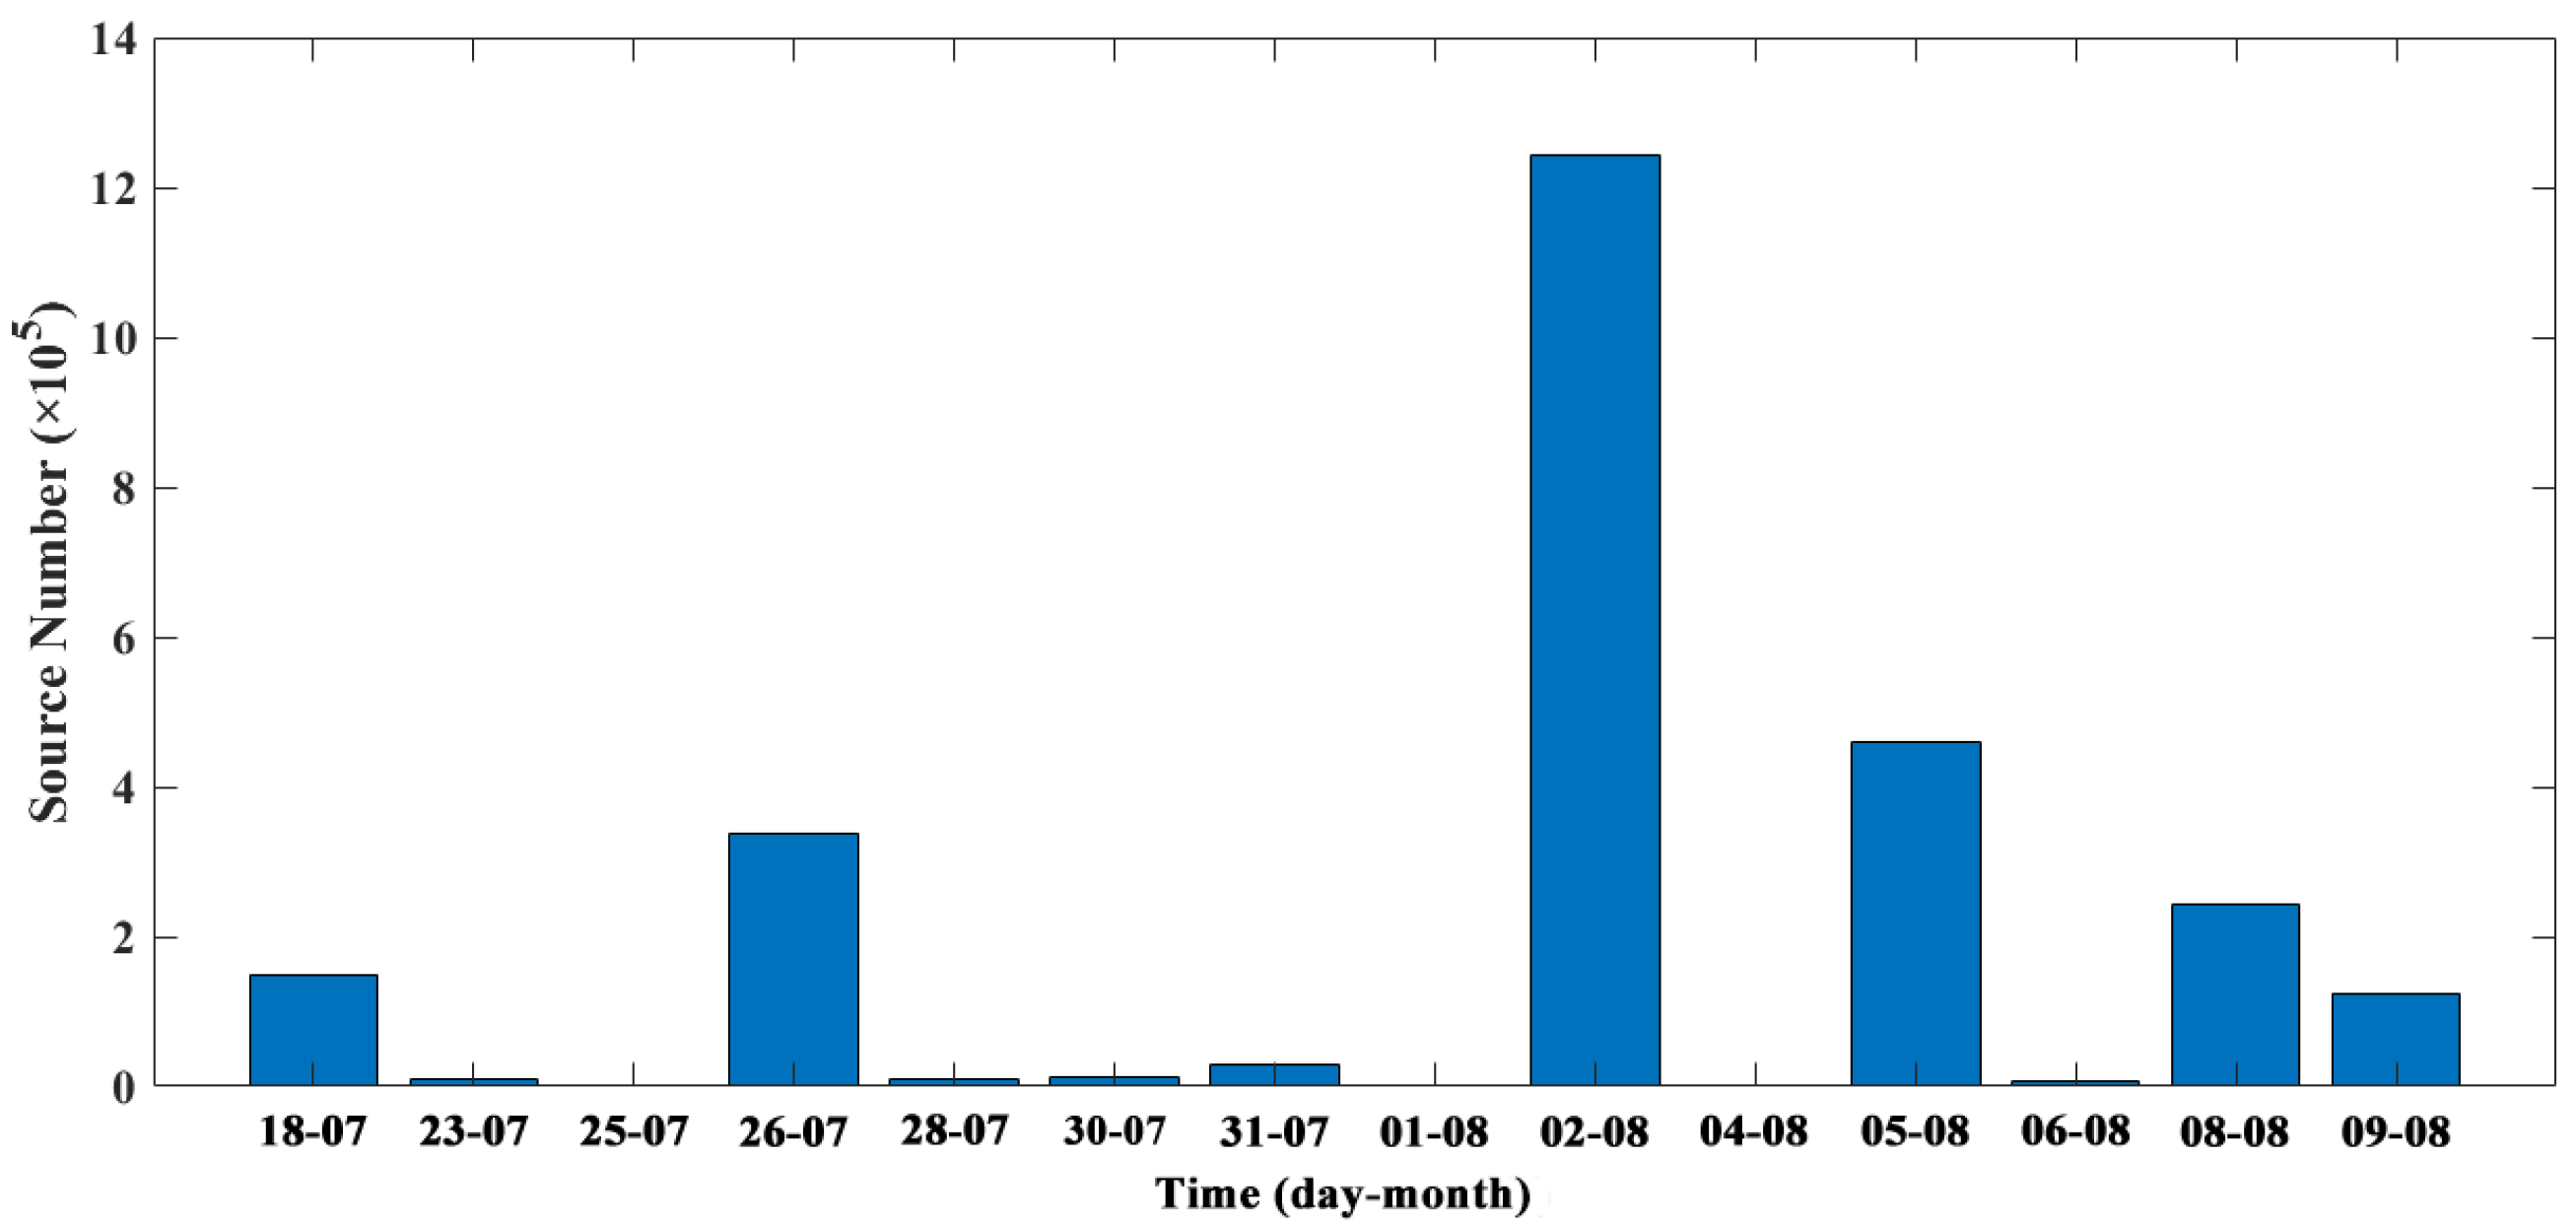
3.1.1. Thunderstorm Days in Yinchuan City

The FALMA installation was begun in Yinchuan city before the thunderstorm season in early March 2019 and it has been operating normally up to the present date, enabling the realization of complete data collection. Based on the data obtained at the Yinchuan site, thunderstorm days in Ningxia were counted and statistical results are shown in Table 1. The first thunderstorm day of Ningxia in 2019 was 26 April and the last thunderstorm day was 6 November. The thunderstorm days were mainly between late July and early September.
On each of these thunderstorm days, FALMA recorded a large number of E-change pulses and thus we were able to locate their corresponding sources. Such sources are termed “lightning sources” in this study. As will be shown in Figures 7–10, a lightning flash usually consists of many lightning sources. Figure 2 shows the number of lightning sources detected by the FALMA on each thunderstorm day. The first and second highest numbers were on August 2nd and 5th, respectively, which when combined accounted for 65% (1,701,107/2,623,686) of all the recorded lightning sources. The detailed characteristics of these two thunderstorms are reported in Section 3.2.

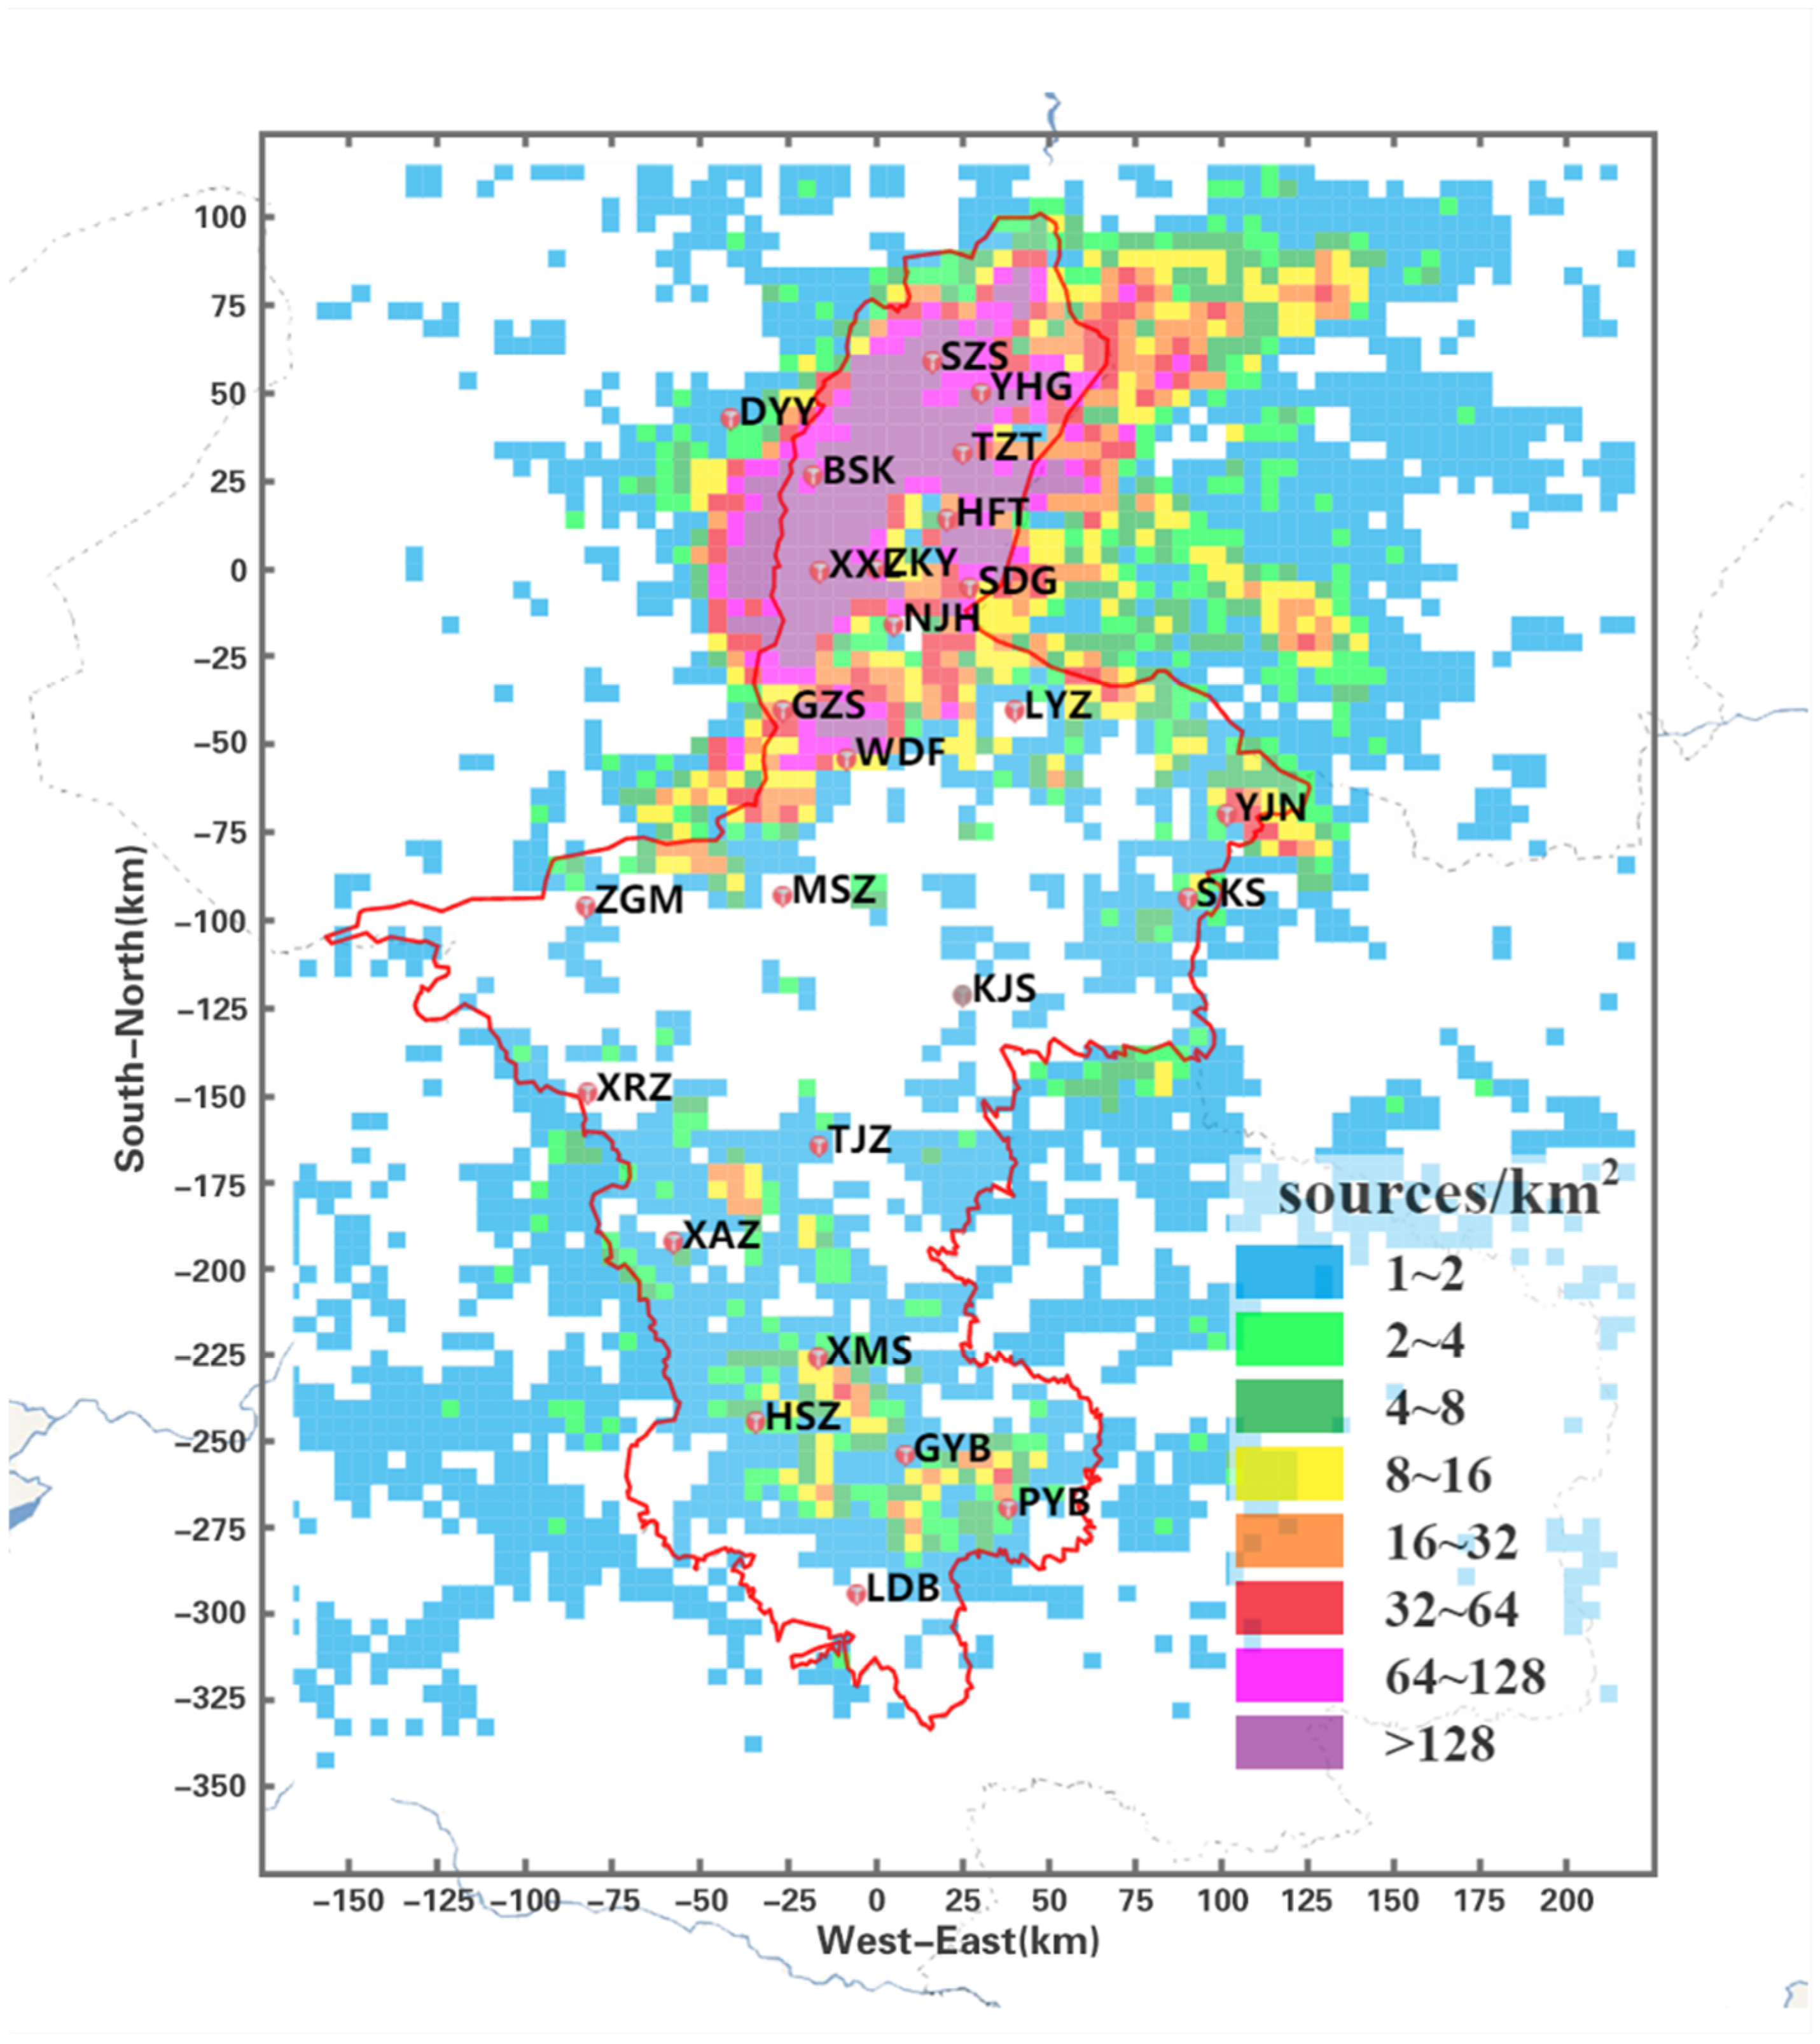
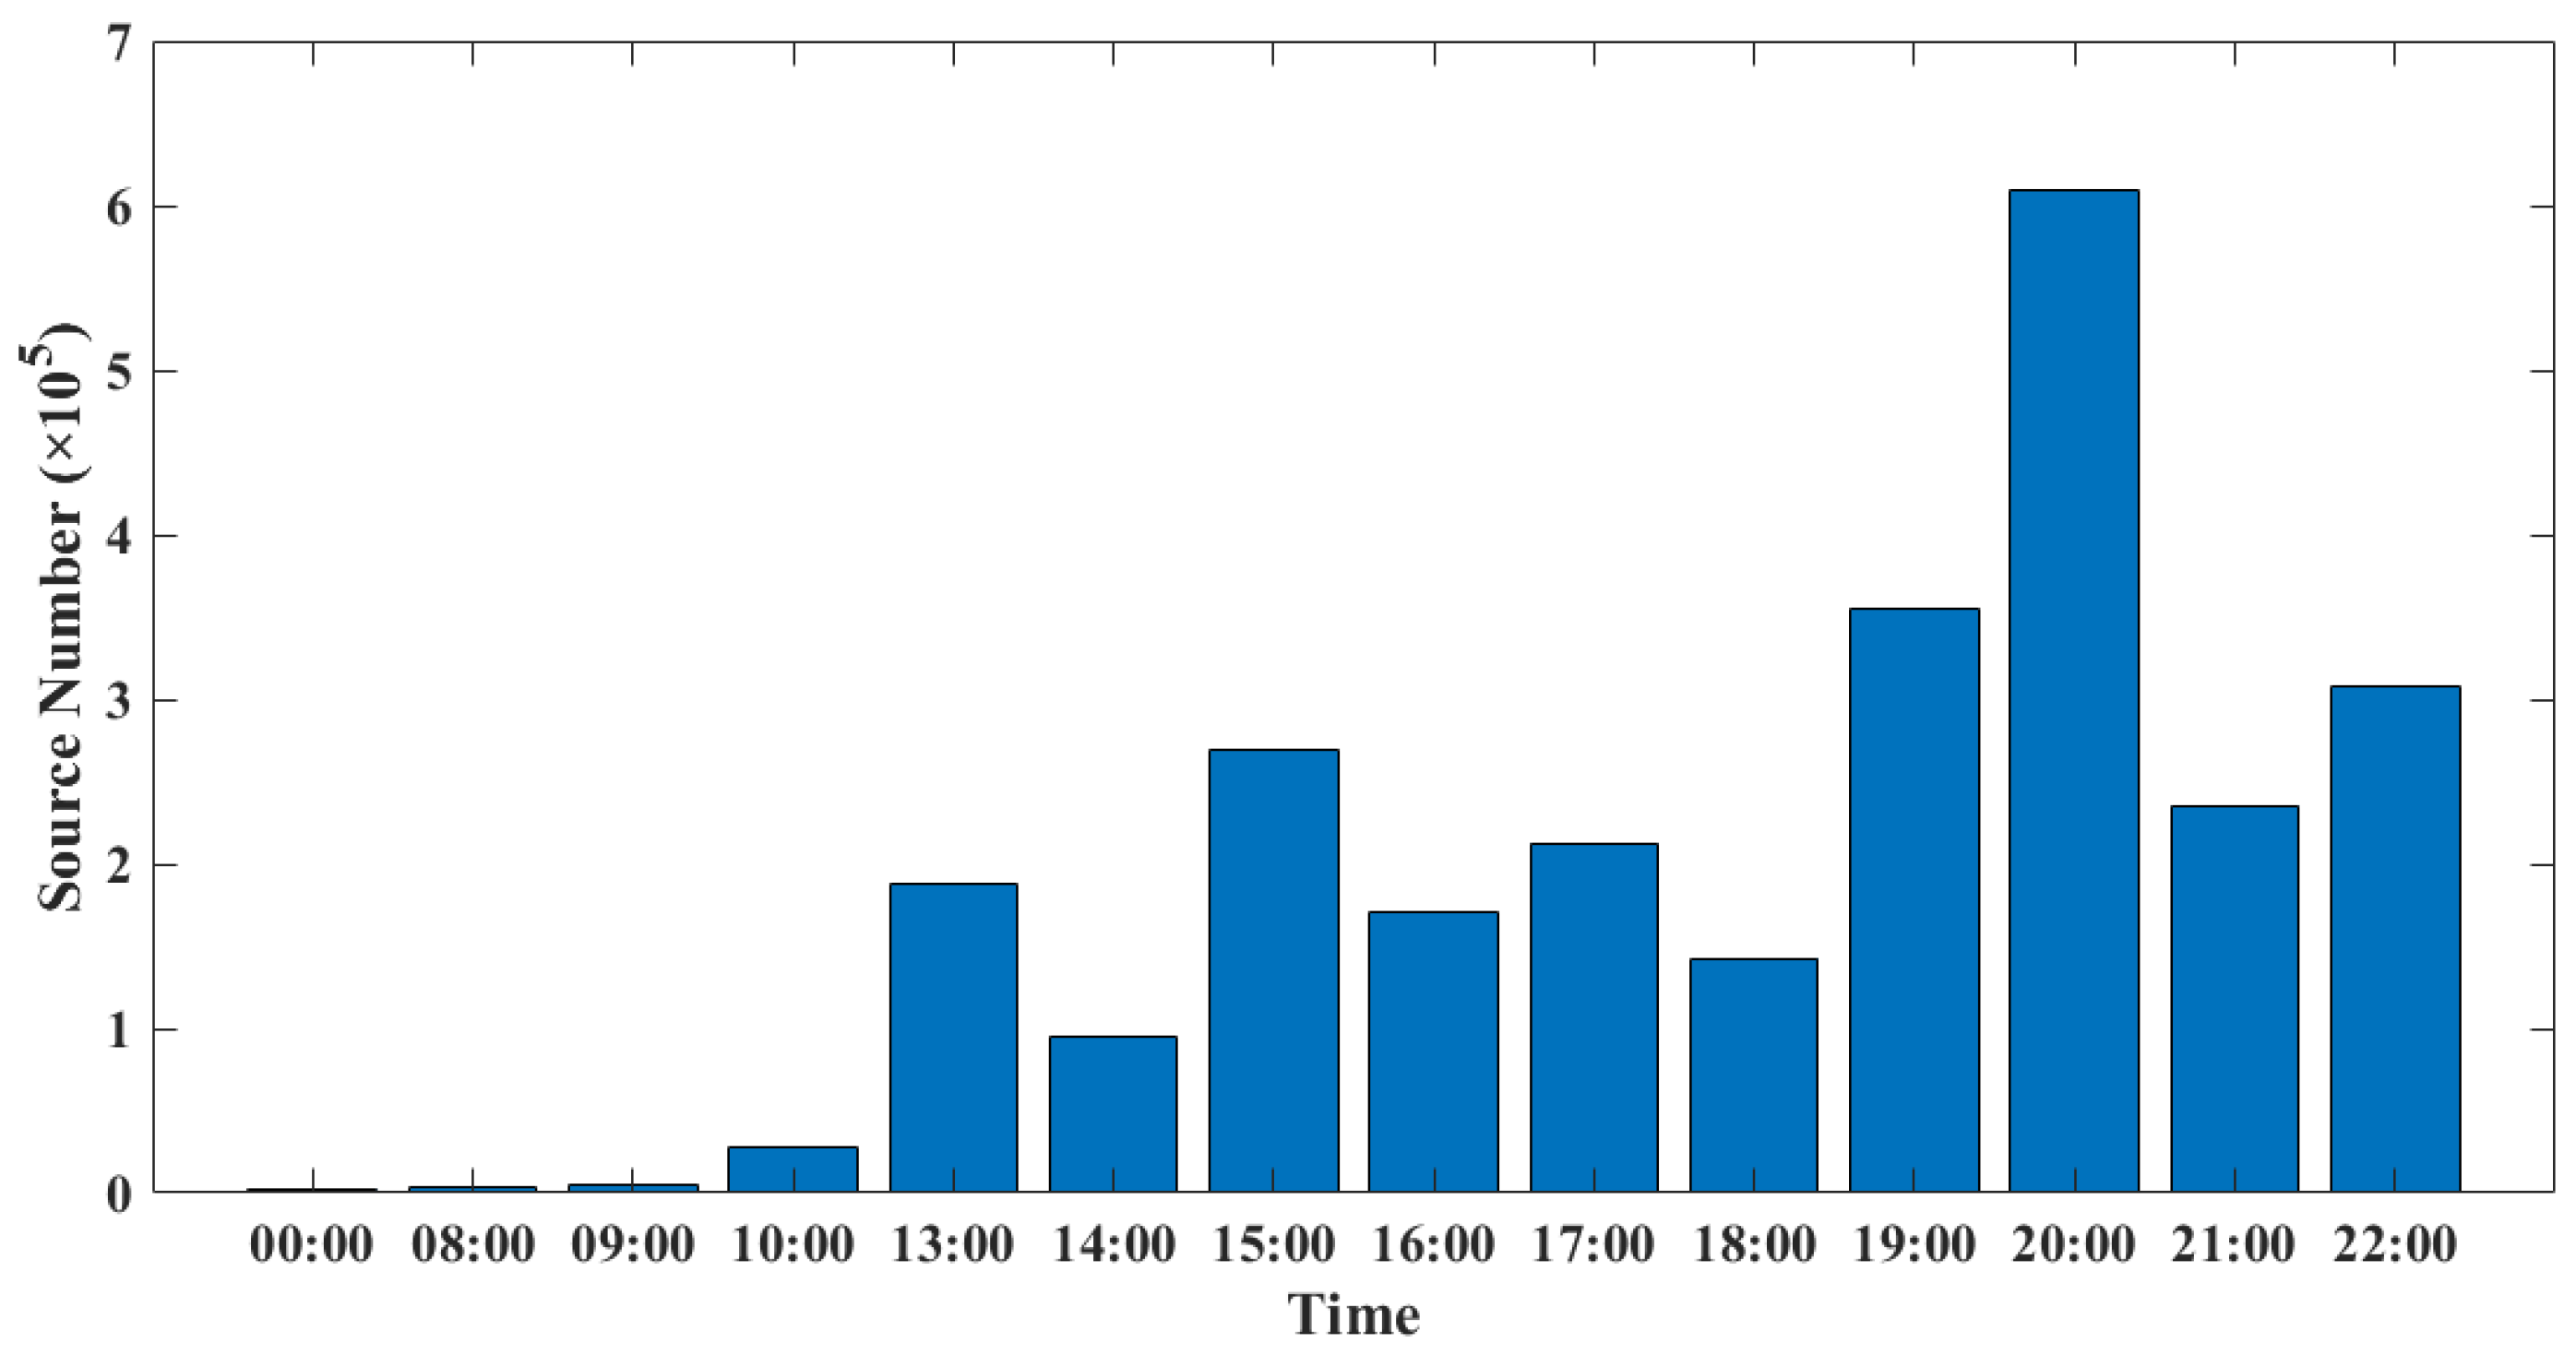
3.1.2. Spatial Distribution and Diurnal Variation of Lightning Sources

Figure 3 and Figure 4 show the spatial distribution and diurnal variation of lightning sources located in 2019. As seen in Figure 3, the northern region of Ningxia appeared to have a relatively higher source density in 2019. From Figure 4, it can be seen that the lightning sources occurred mainly after the afternoon, which is similar to previous findings [25,26].

3.2. General Characteristics of the Two Largest Thunderstorms

In this section, we report the features of the lightning discharges in the two largest thunderstorms observed in 2019.

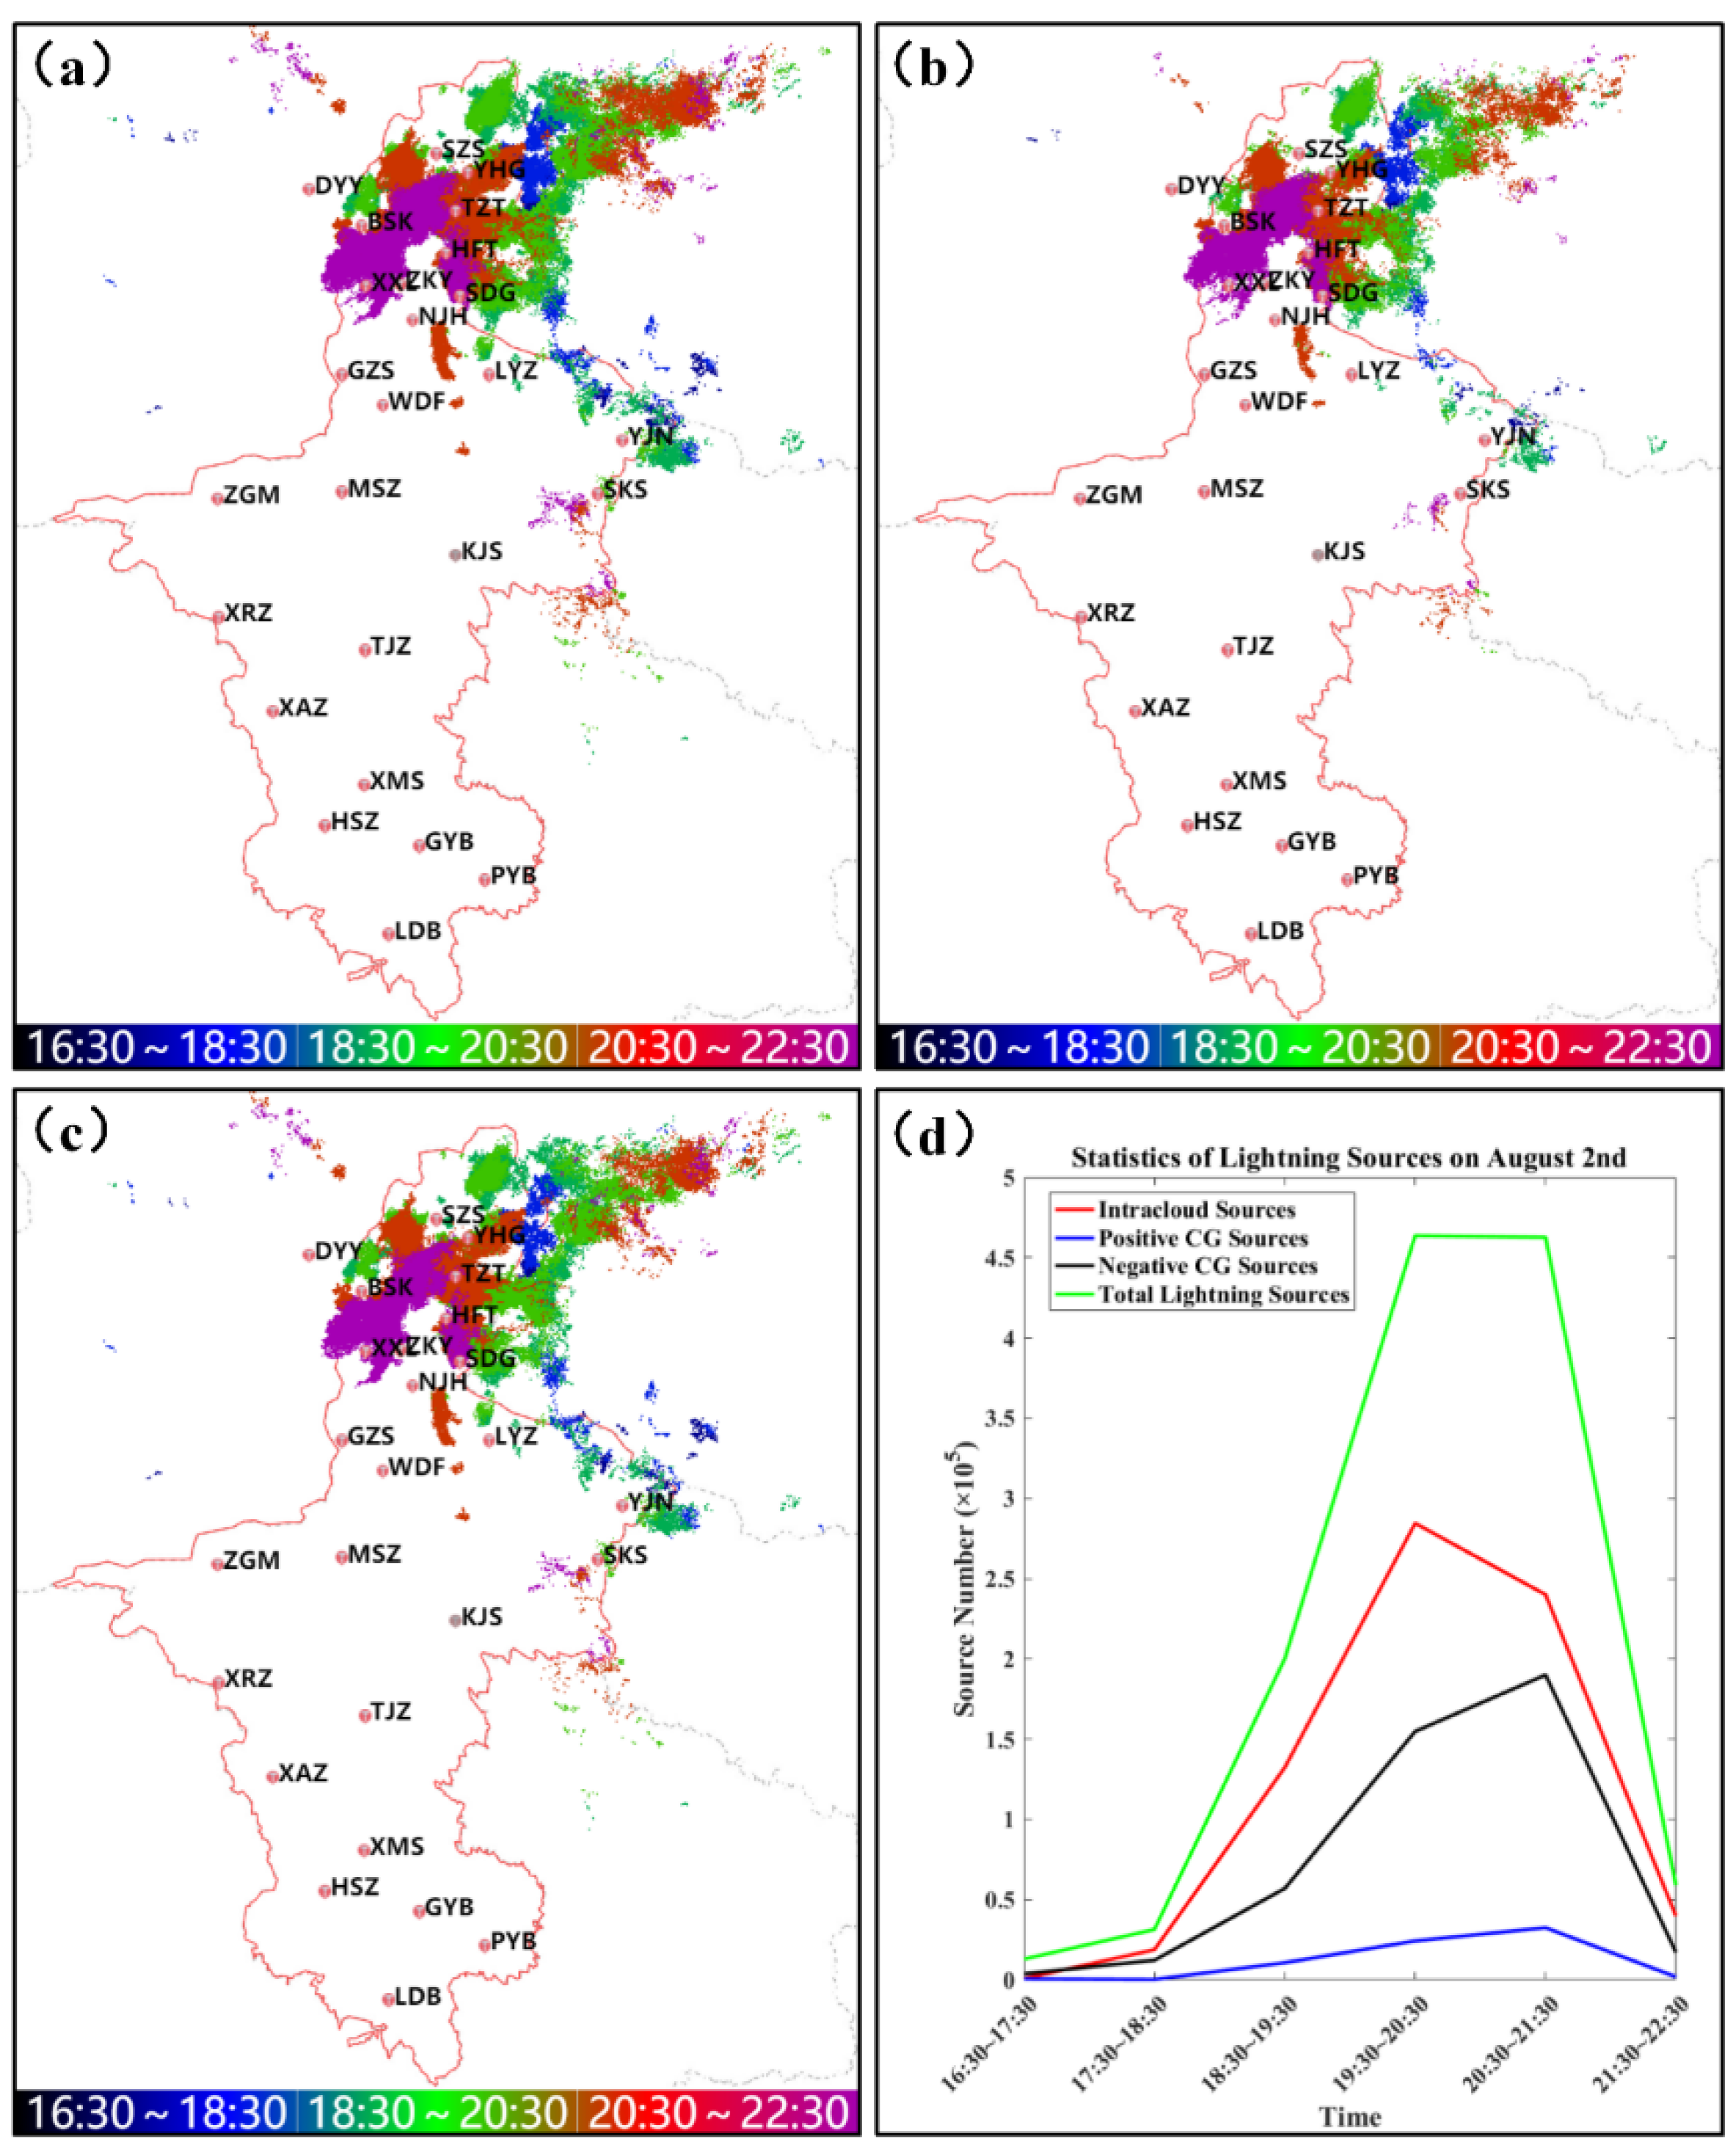
3.2.1. The Thunderstorm on August 2nd

The thunderstorm on August 2nd started at 16:30 and ended at 22:30, producing more than one million lightning sources. These sources were produced by a total of 9779 lightning flashes, with 7000 of them being intracloud (IC) flashes, 379 positive CG flashes, and 2400 negative CG flashes. The CG flashes accounted for 28.4% of the total flashes. Figure 5 shows the spatial and temporal distributions of the sources for the total flashes, IC flashes, and CG flashes. In terms of spatial evolution, lightning sources of various types generally developed from southeast to northwest, as seen in Figure 5a–c. Figure 5d gives the source number counted in a one-hour bin. Between 19:30 and 20:30, the flash number rose to the maximum value and then showed a falling trend from 20:30 to 22:30. The variation tendency of falling after rising indicates that the thunderstorm probably went through the growth, maturation and dissipation stages.

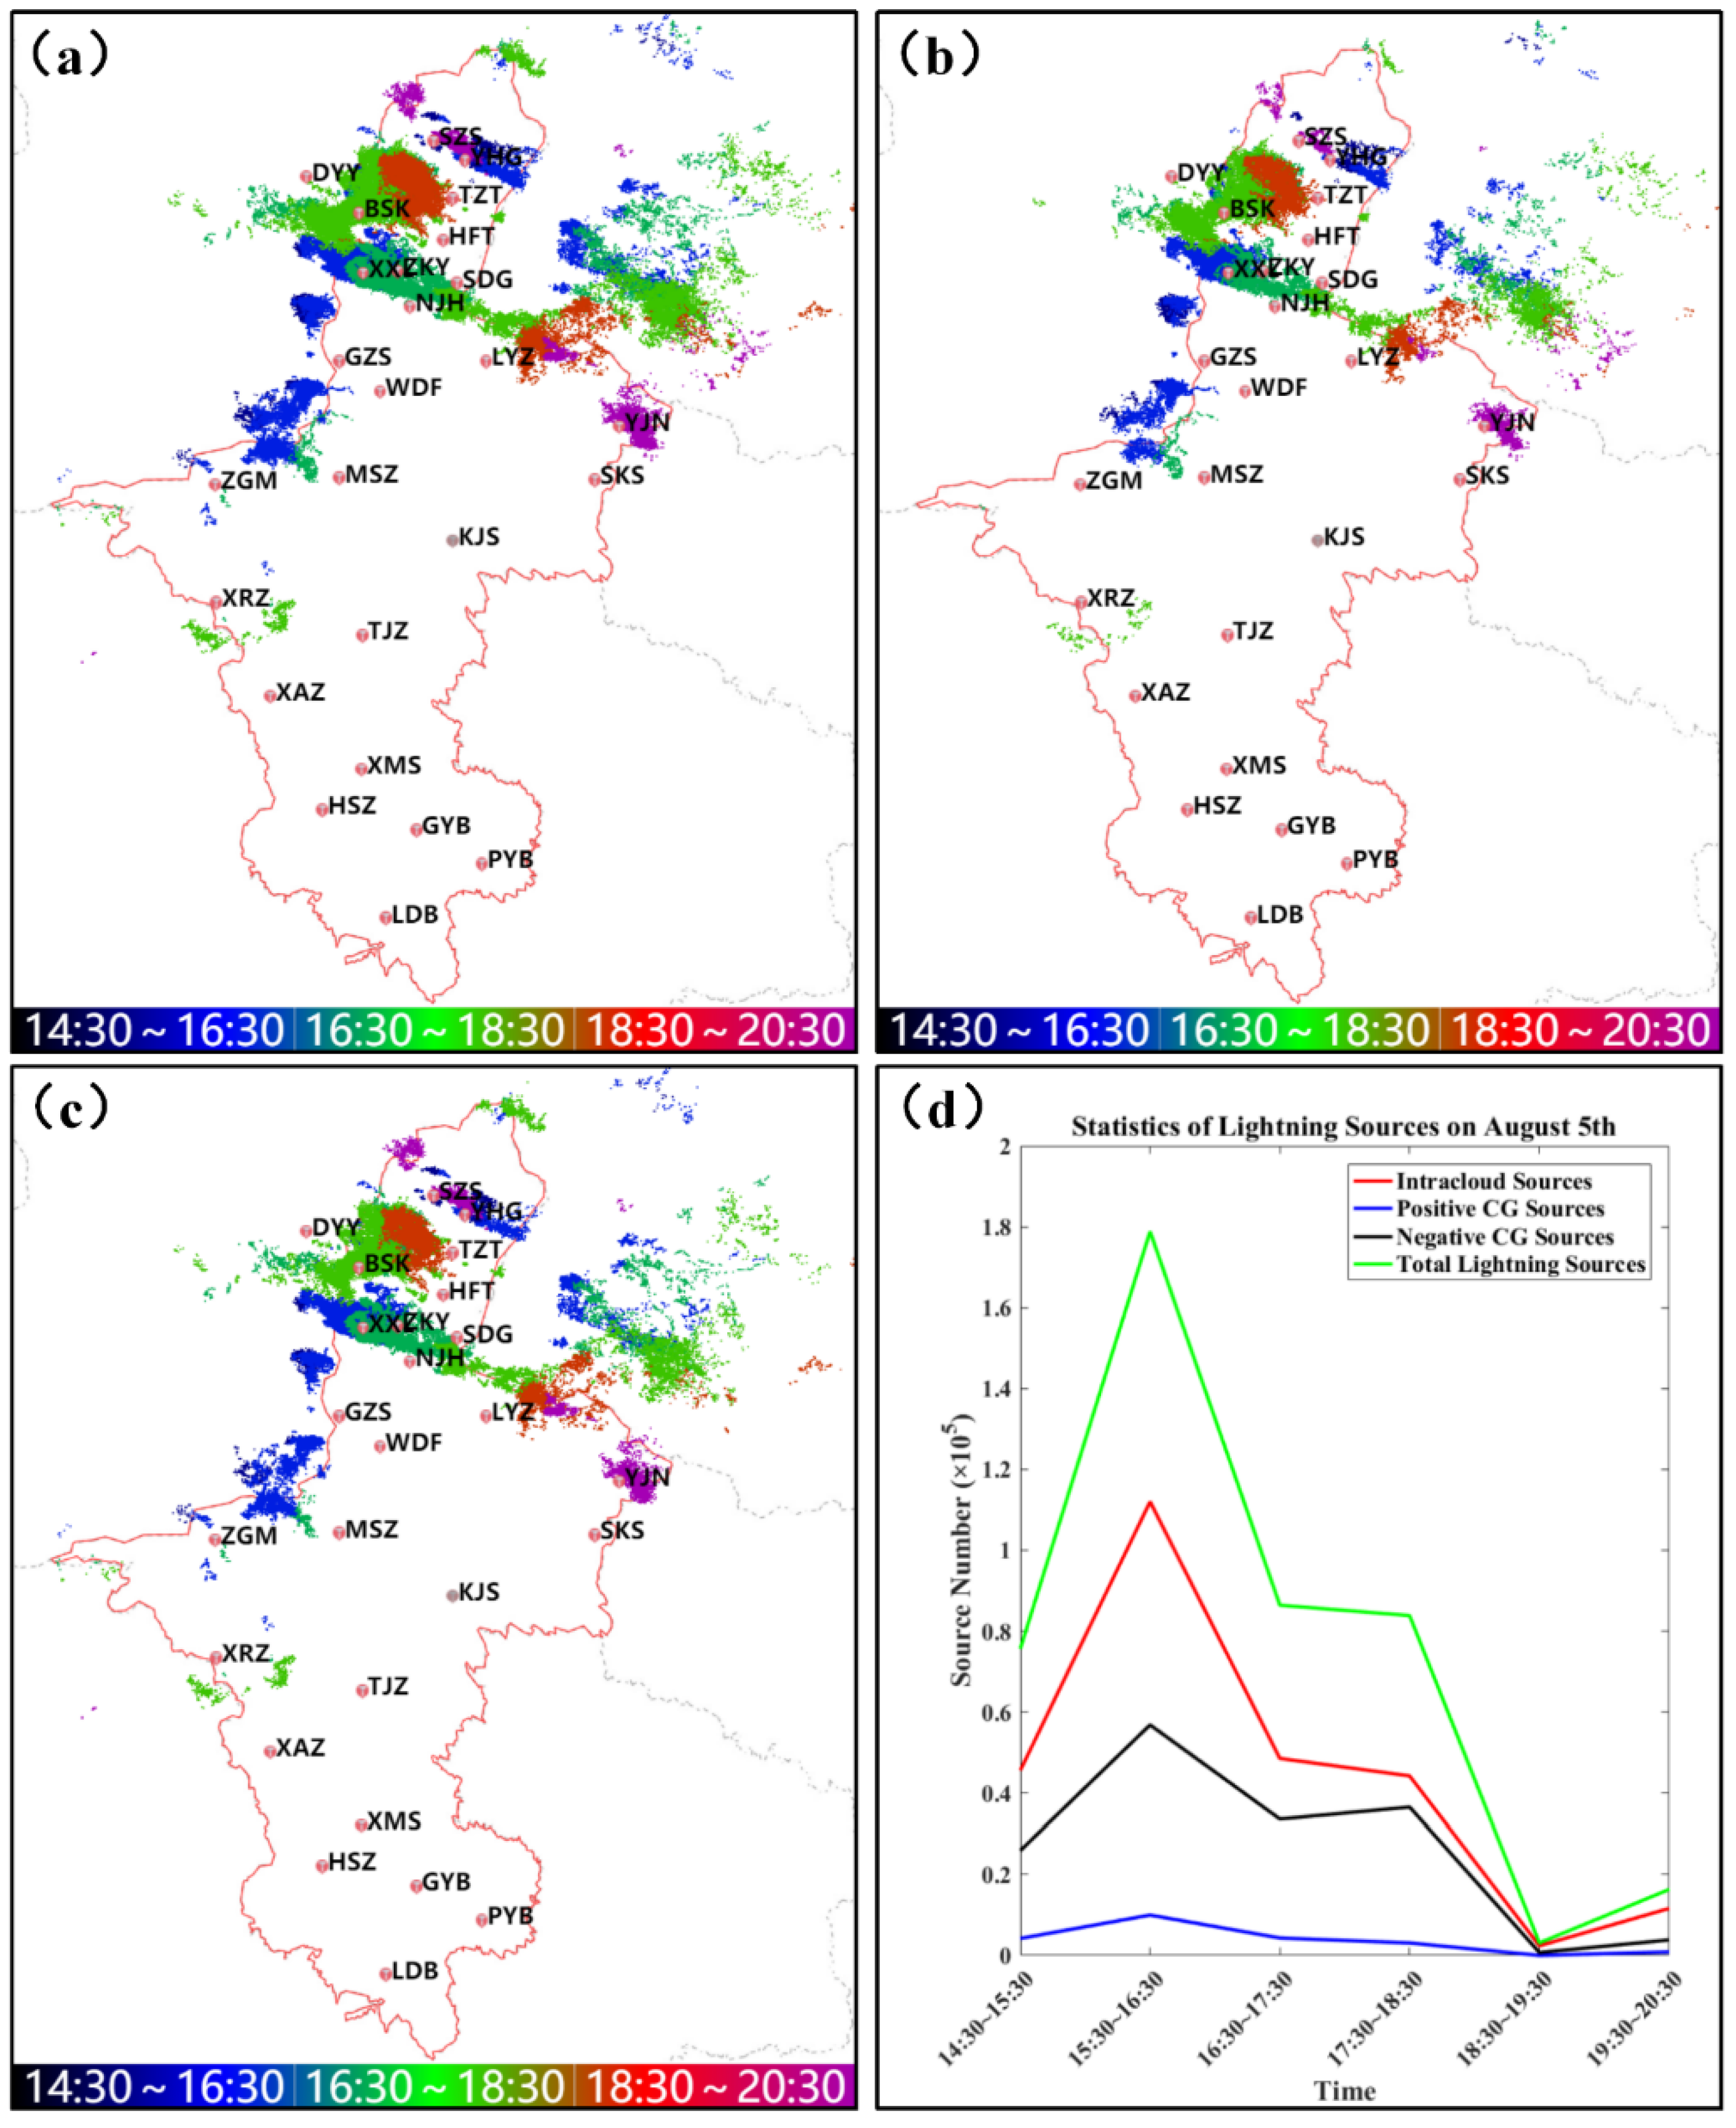
3.2.2. The Thunderstorm on August 5th

This thunderstorm began at 14:30 and ended at 20:30. A total of 4025 lightning flashes, including 1307 (136 positive and 1171 negative) CG lightning flashes and 2718 IC lightning flashes, were recorded and their source distributions are shown in Figure 6a–c. The CG flashes accounted for 32.5% of the total flashes. The number of flashes on August 5th was much lower than on August 2nd. The thunderstorm generally moved from southwest to northeast, which was different from the case on August 2nd. However, as indicated in Figure 6d, the variation tendency of the lightning source number counted in a one-hour bin was similar for both thunderstorms.

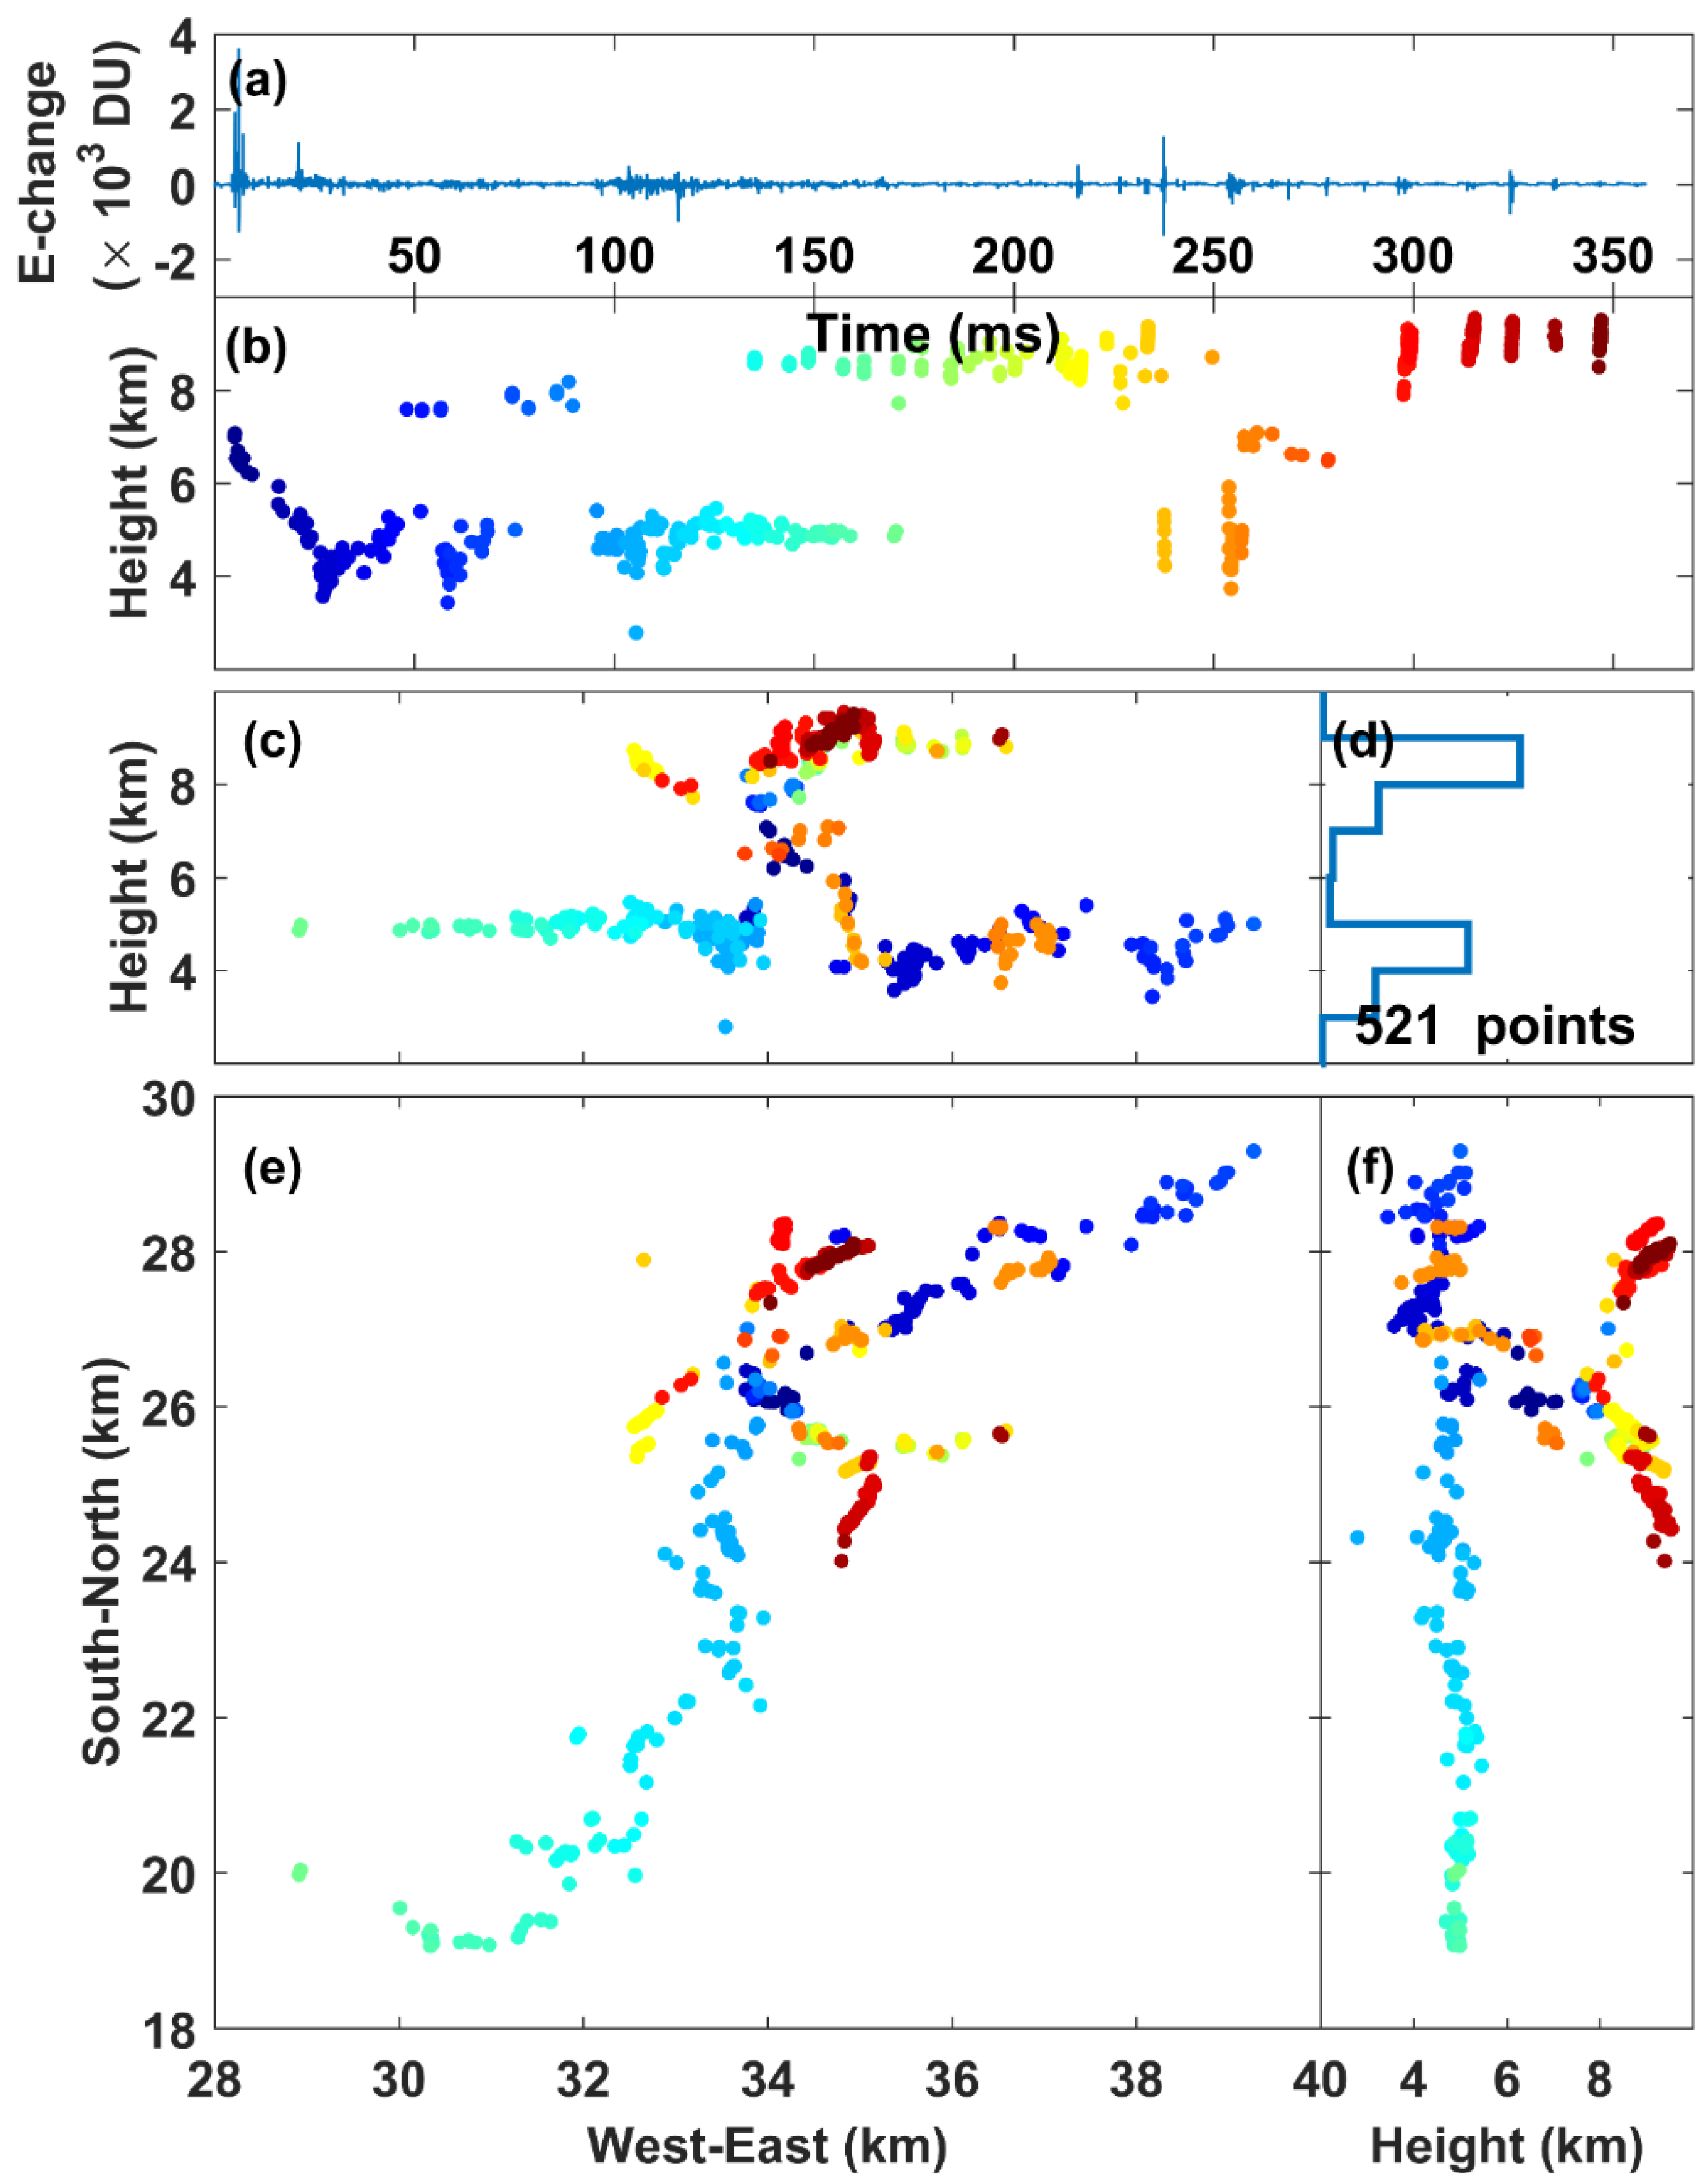
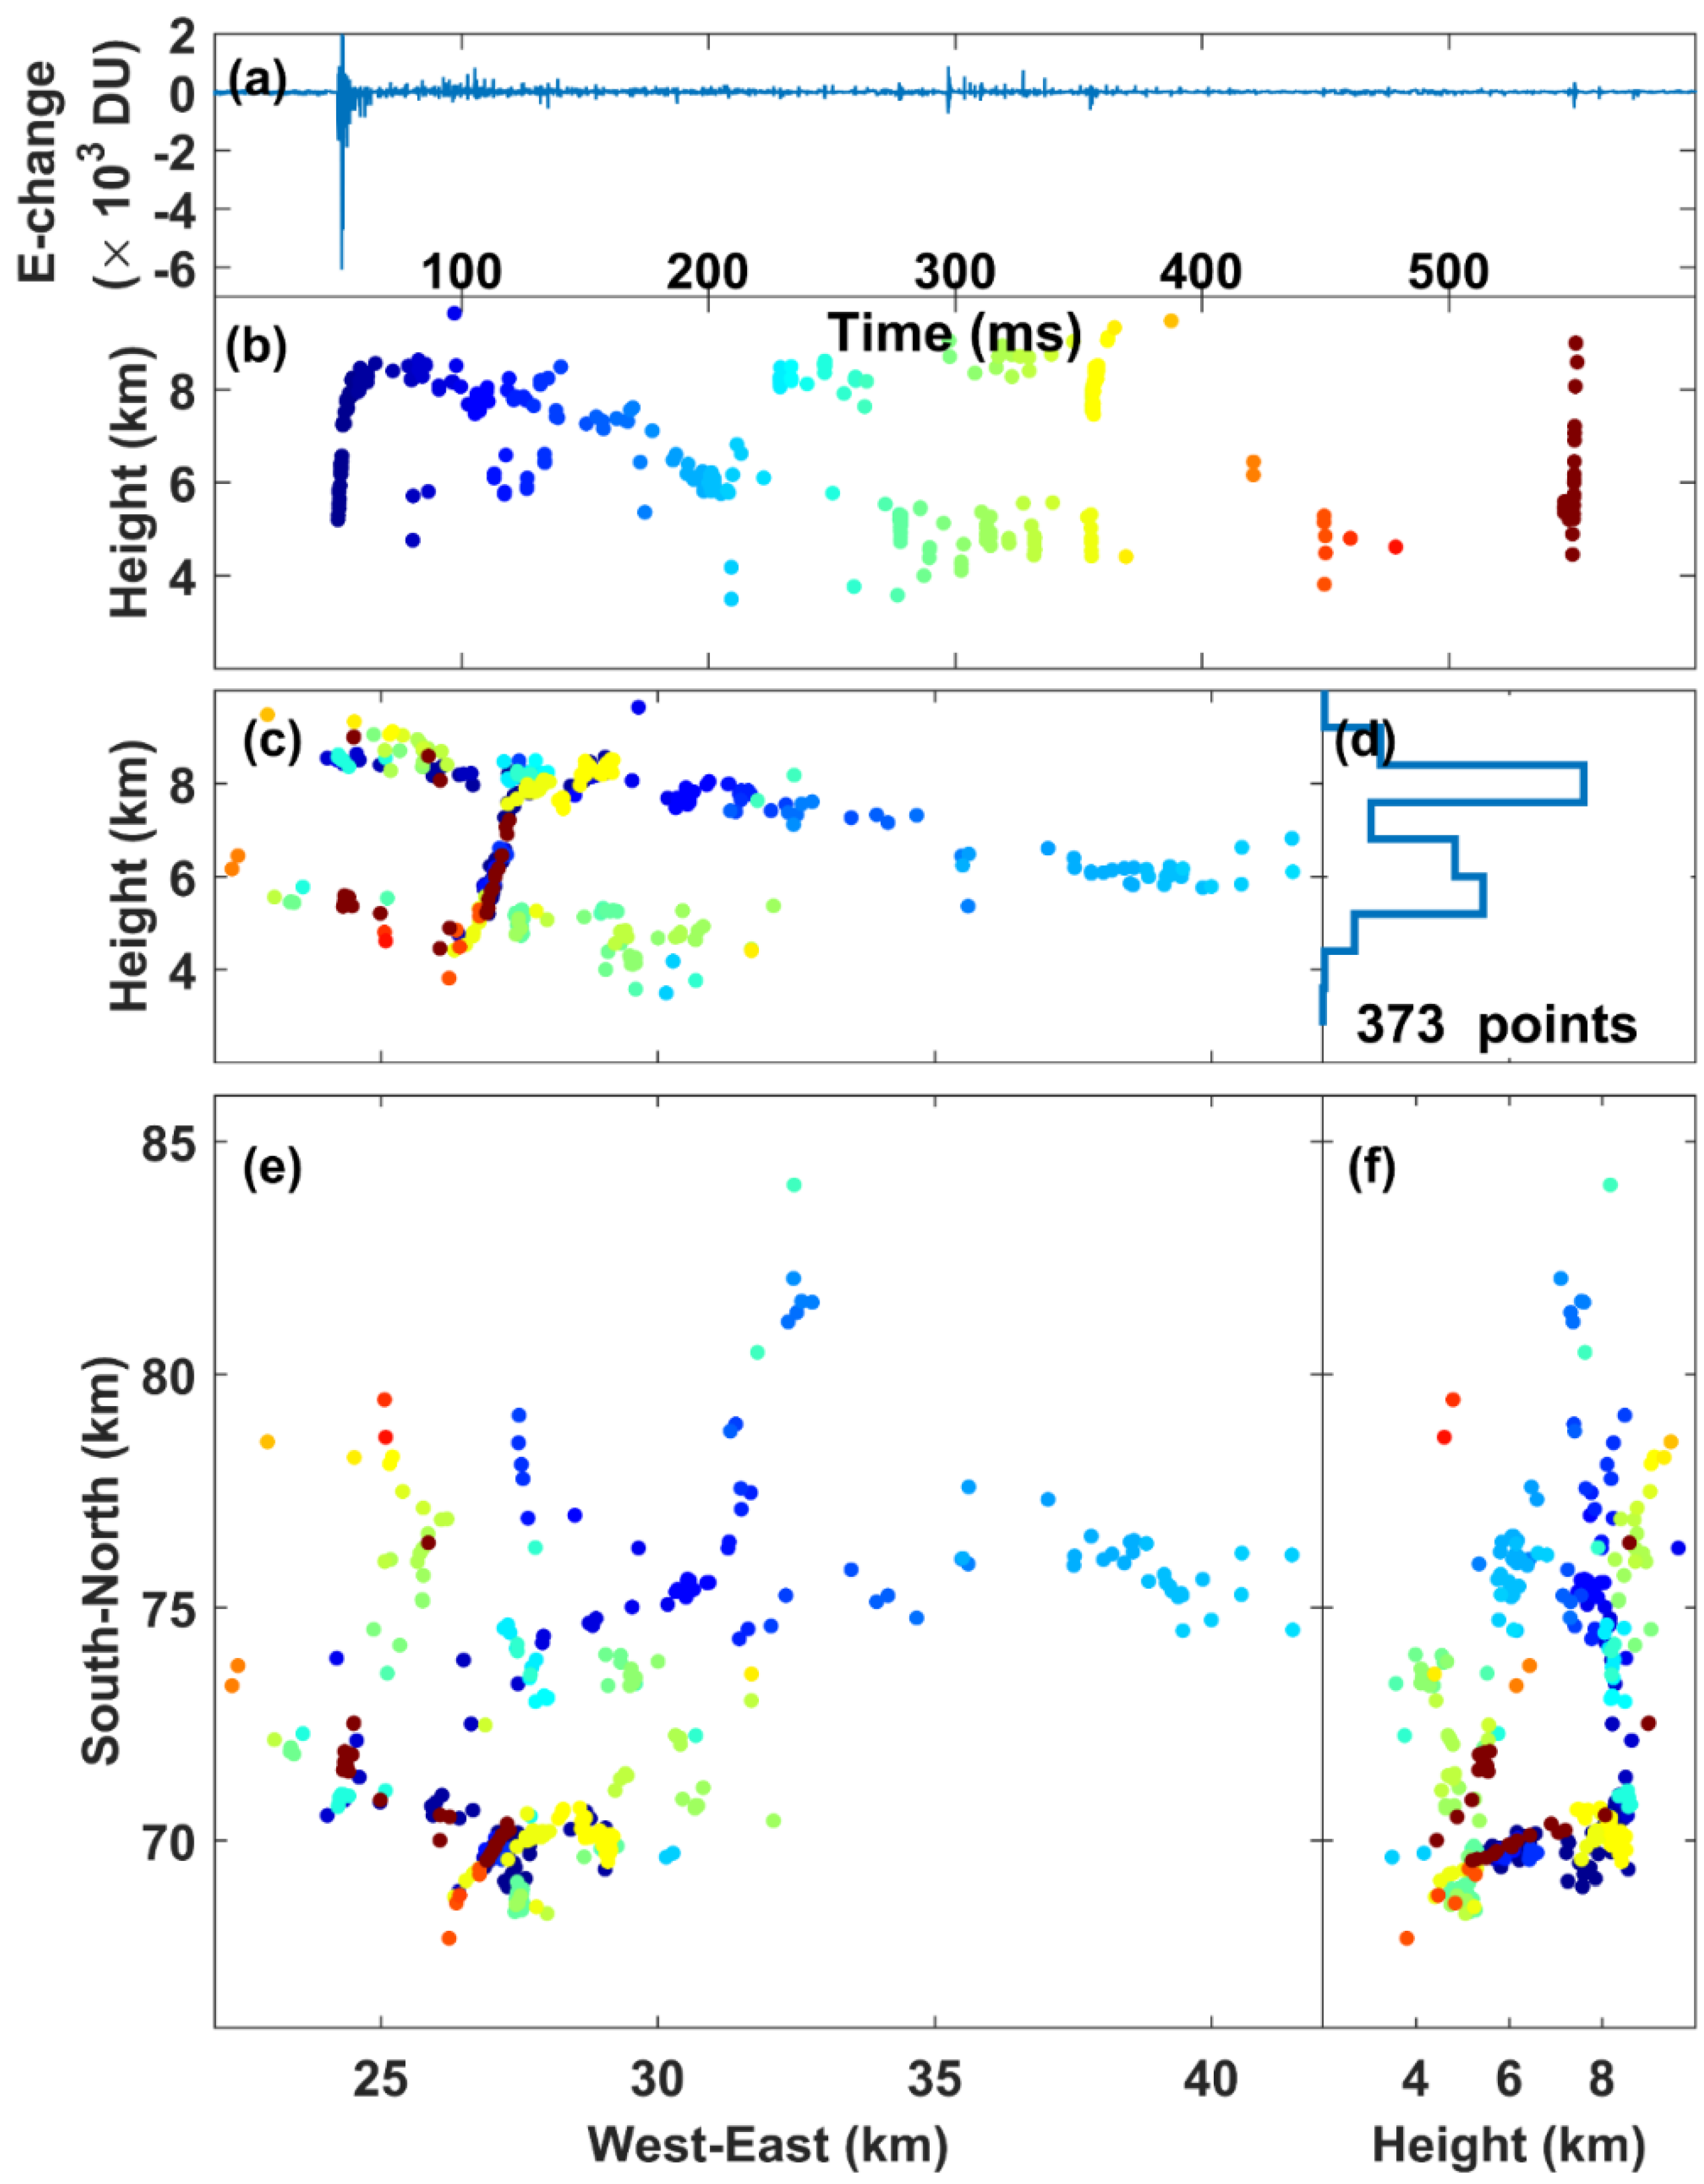
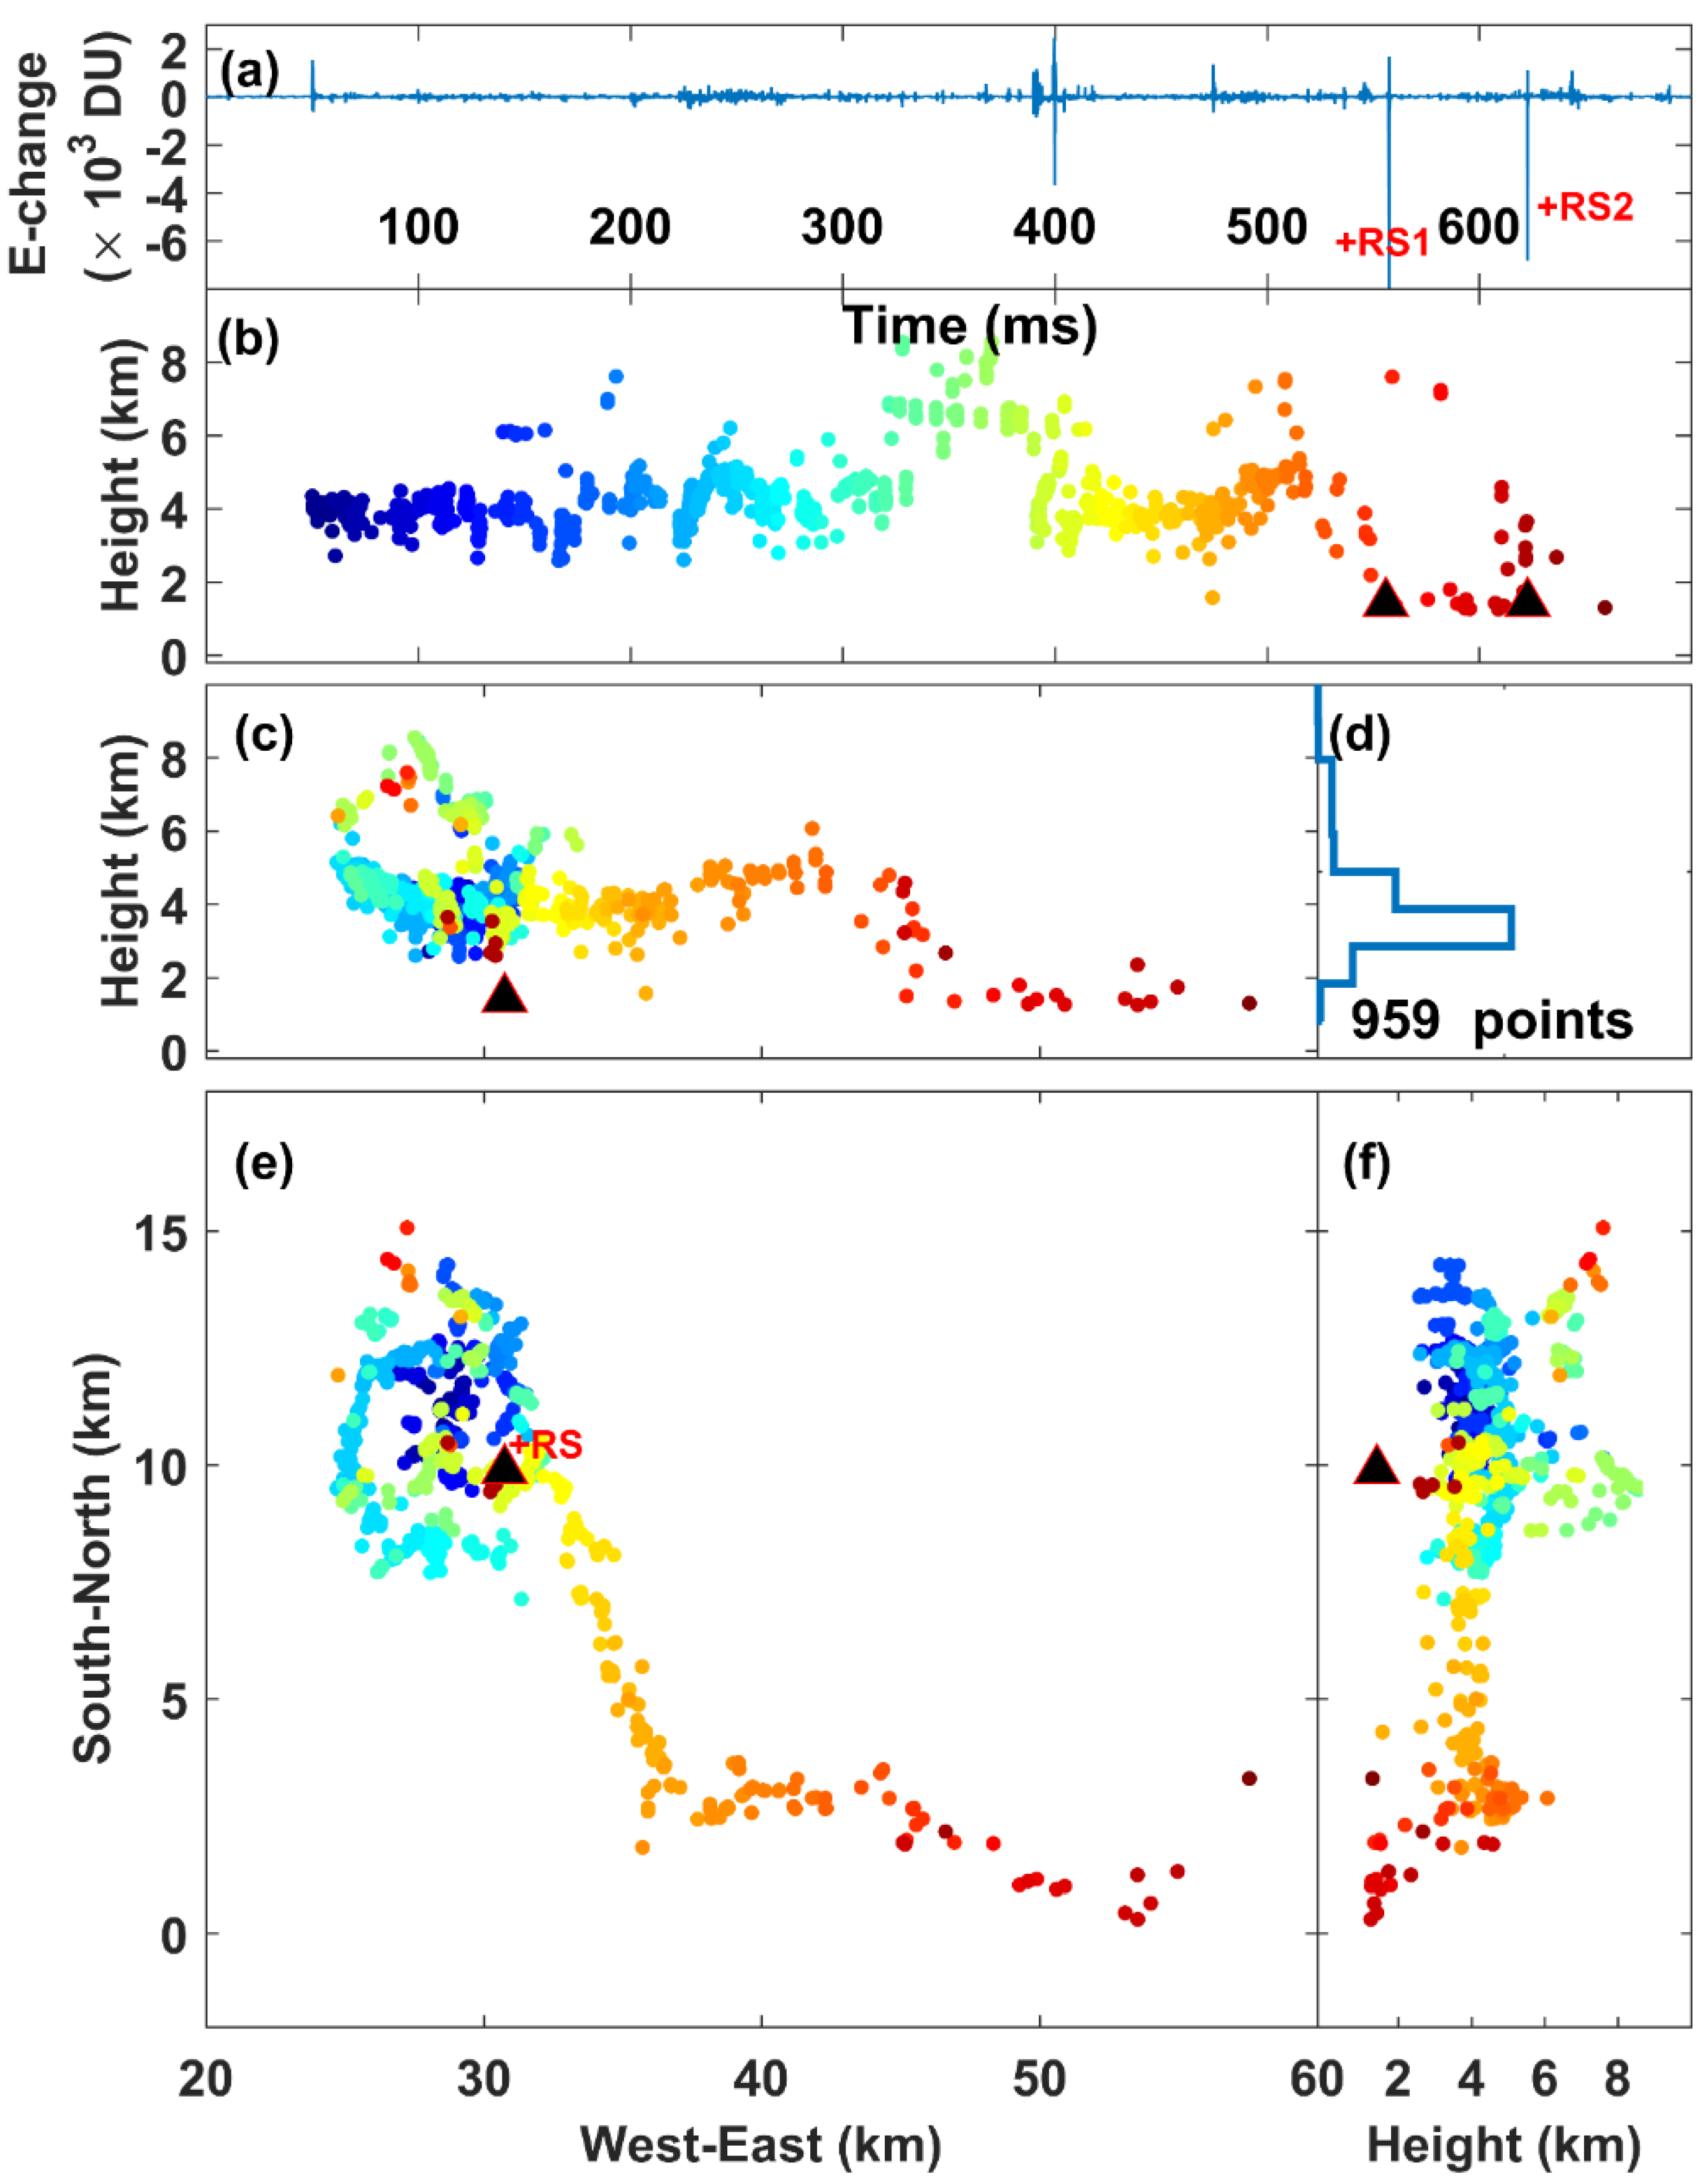
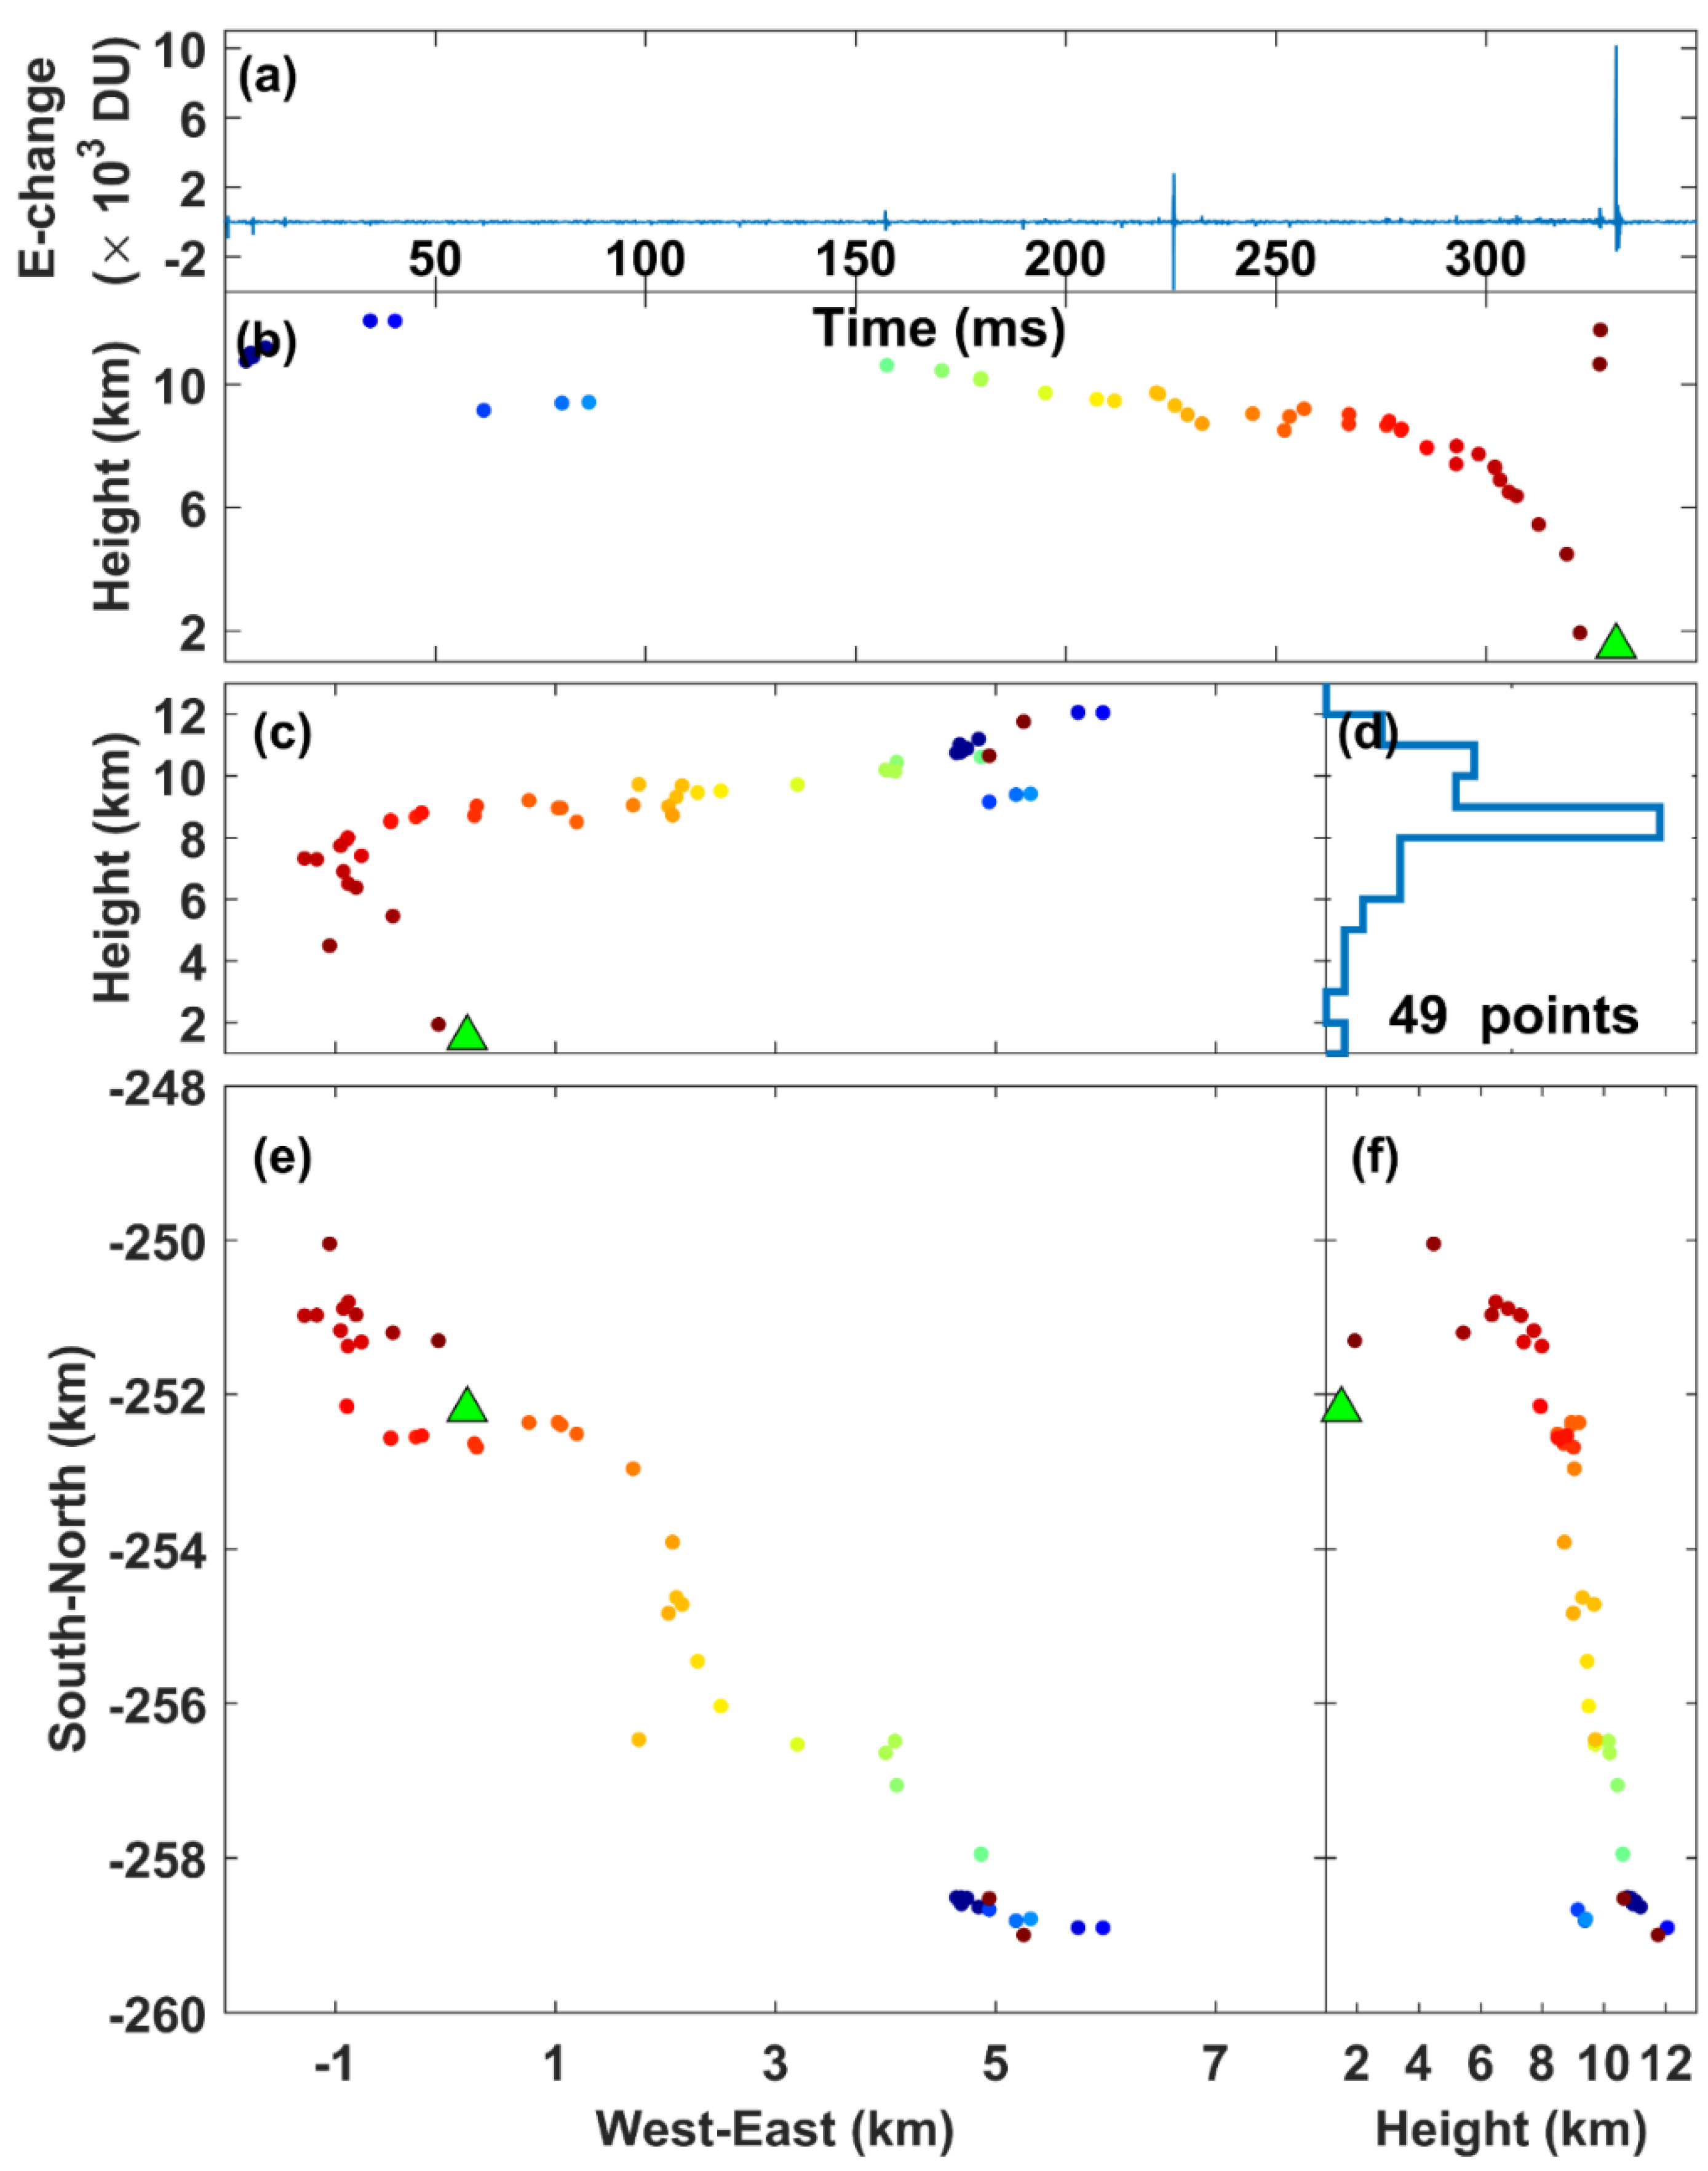
3.3. Examples of 3D Mapping Results

The most prominent feature of lightning flashes in Ningxia is that the vast majority of lightning flashes are inverted-polarity IC flashes. Figure 7 shows an example of the 3D mapping result of an inverted-polarity IC flash with (a) the E-change waveform following the atmospheric electricity sign convention, (b) the source altitude above the sea level versus the time, (c) the west–east vertical view, (d) the source distribution along the altitude, (e) the plan view and (f) the south–north vertical view. We can see that its preliminary breakdown (PB) process started at an altitude of about 7.0 km and propagated downward to an altitude of about 5 km. In Section 3.4, these two altitudes are named the upper altitude and lower altitude of the PB process. After the PB process, its negative leader then propagated mainly horizontally at an altitude of about 5 to 6 km. Some sources were also detected at a higher layer (about 8 to 9 km), indicating the horizontal propagation of a positive leader.
Normal IC flashes in Ningxia are relatively rare, which is very different from other regions. One of the normal IC examples is shown in Figure 8. It was mapped by 373 sources and lasted more than 400 ms. Its PB process started at an altitude of about 5 km and developed upward to an altitude of nearly 9 km, with a vertical speed of about 2.2 × 10⁵ m/s. Its leader channels presented an inclined bi-level structure, as shown in Figure 8c.
Figure 9 shows an example of a positive CG flash. It consisted of two positive RSs. It was mapped by 981 dots and lasted more than 600 ms. During this period, the in-cloud negative leader extended far away from the lightning initiation, similar to those observed in winter thunderstorms in Japan [27]. Two positive RSs with a located height of around 1.4 km struck at the same position.
Figure 10 shows a negative CG flash with a single negative RS. It had a very simple structure, lasted for about 350 ms and had a horizontal extent of about 10 km. As reported previously [5,6], a negative CG flash in the Chinese inland plateau region usually starts with a long intracloud discharge process. The flash in Figure 10 indeed had a long intracloud discharge process. However, interestingly, the intracloud discharge process mainly occurred at a high altitude, unlike the scenarios suggested previously [5,6].

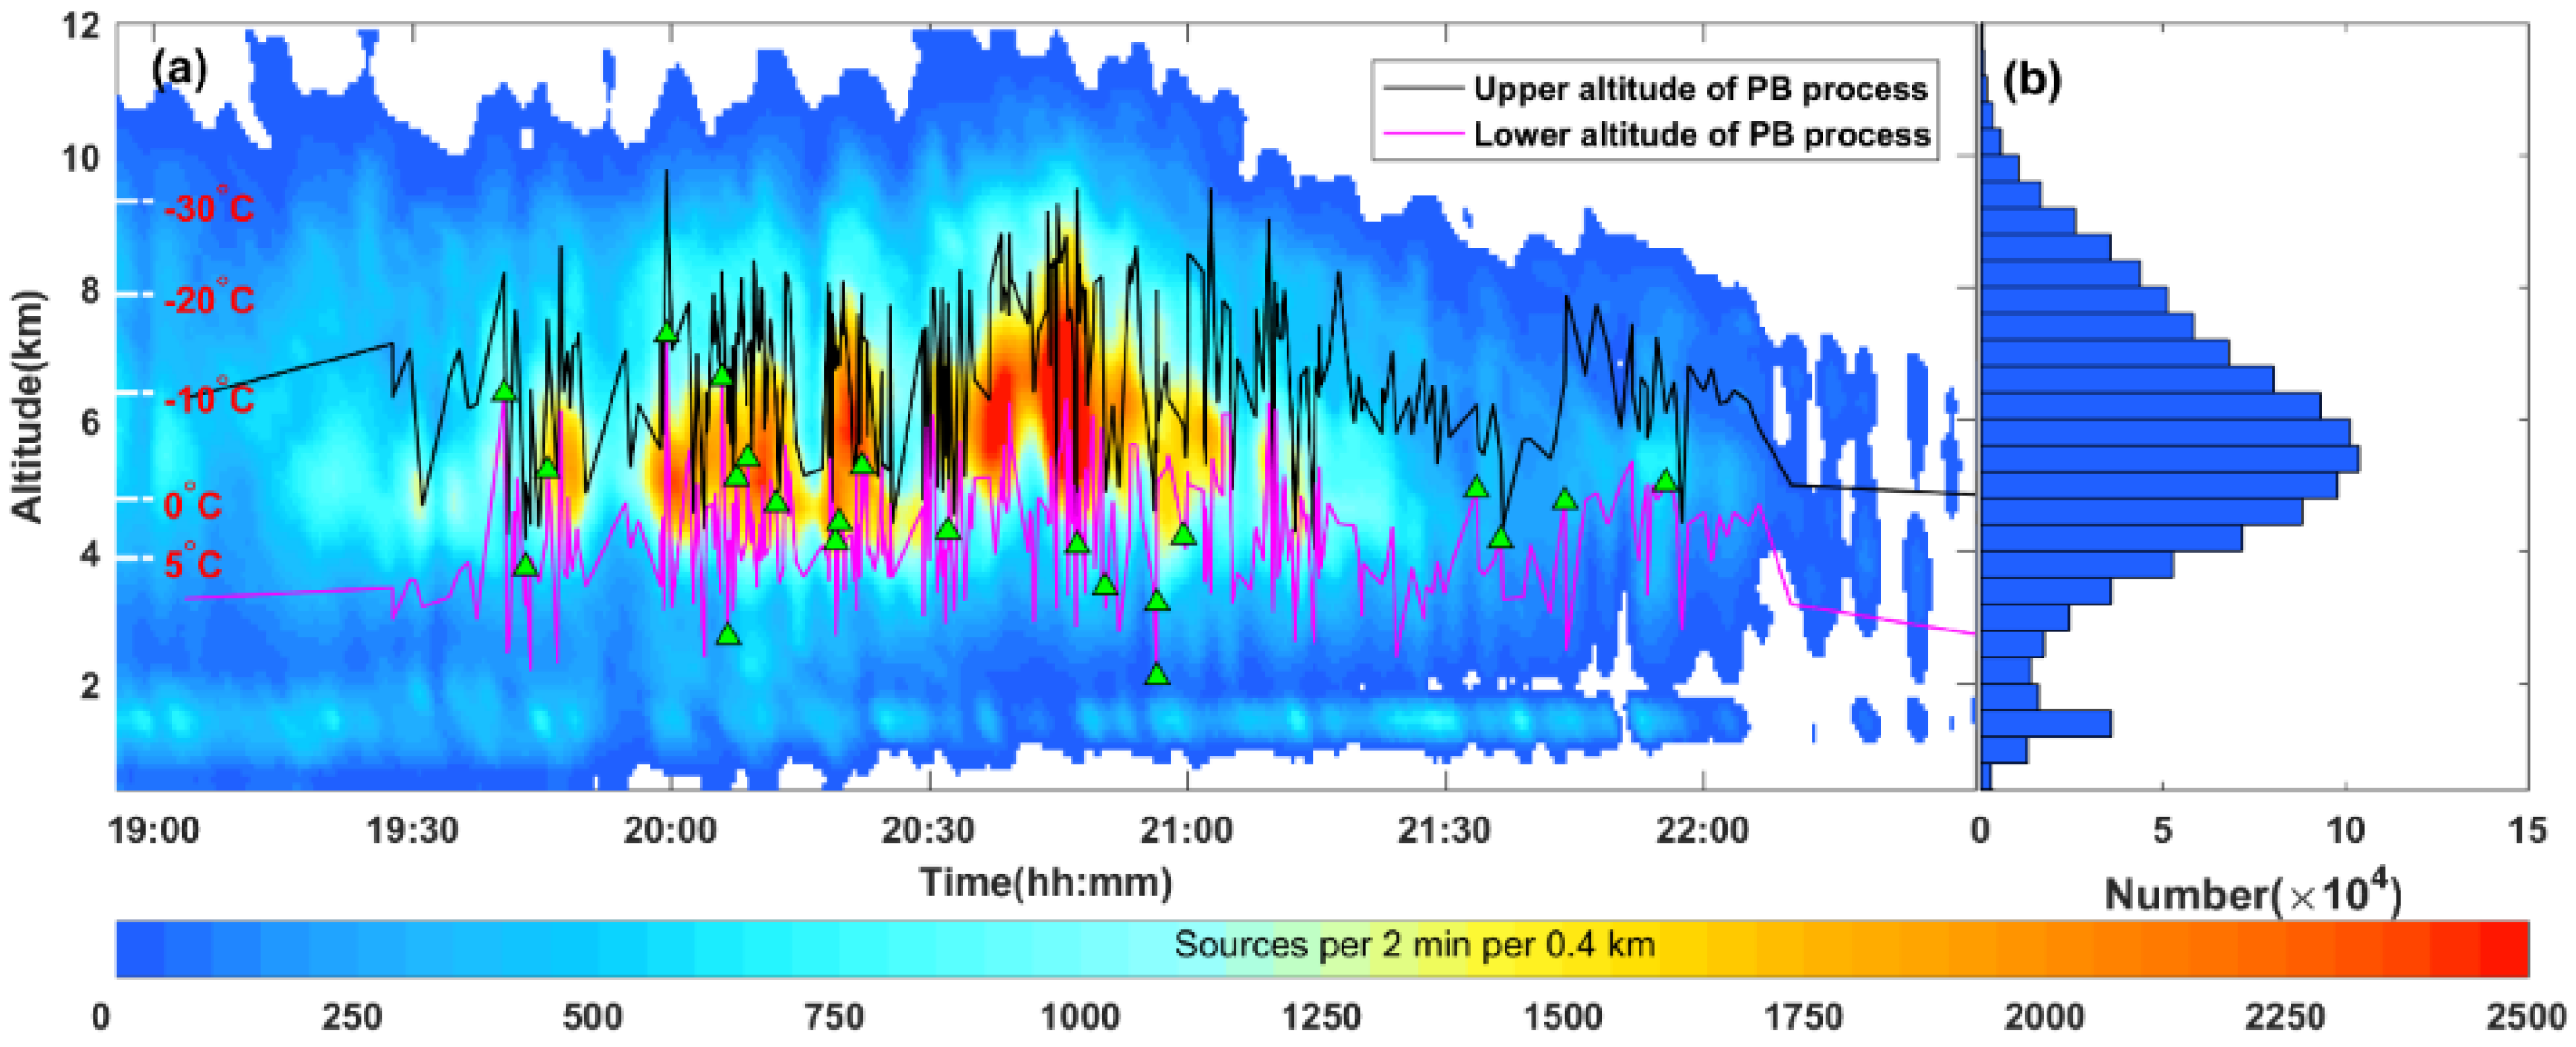
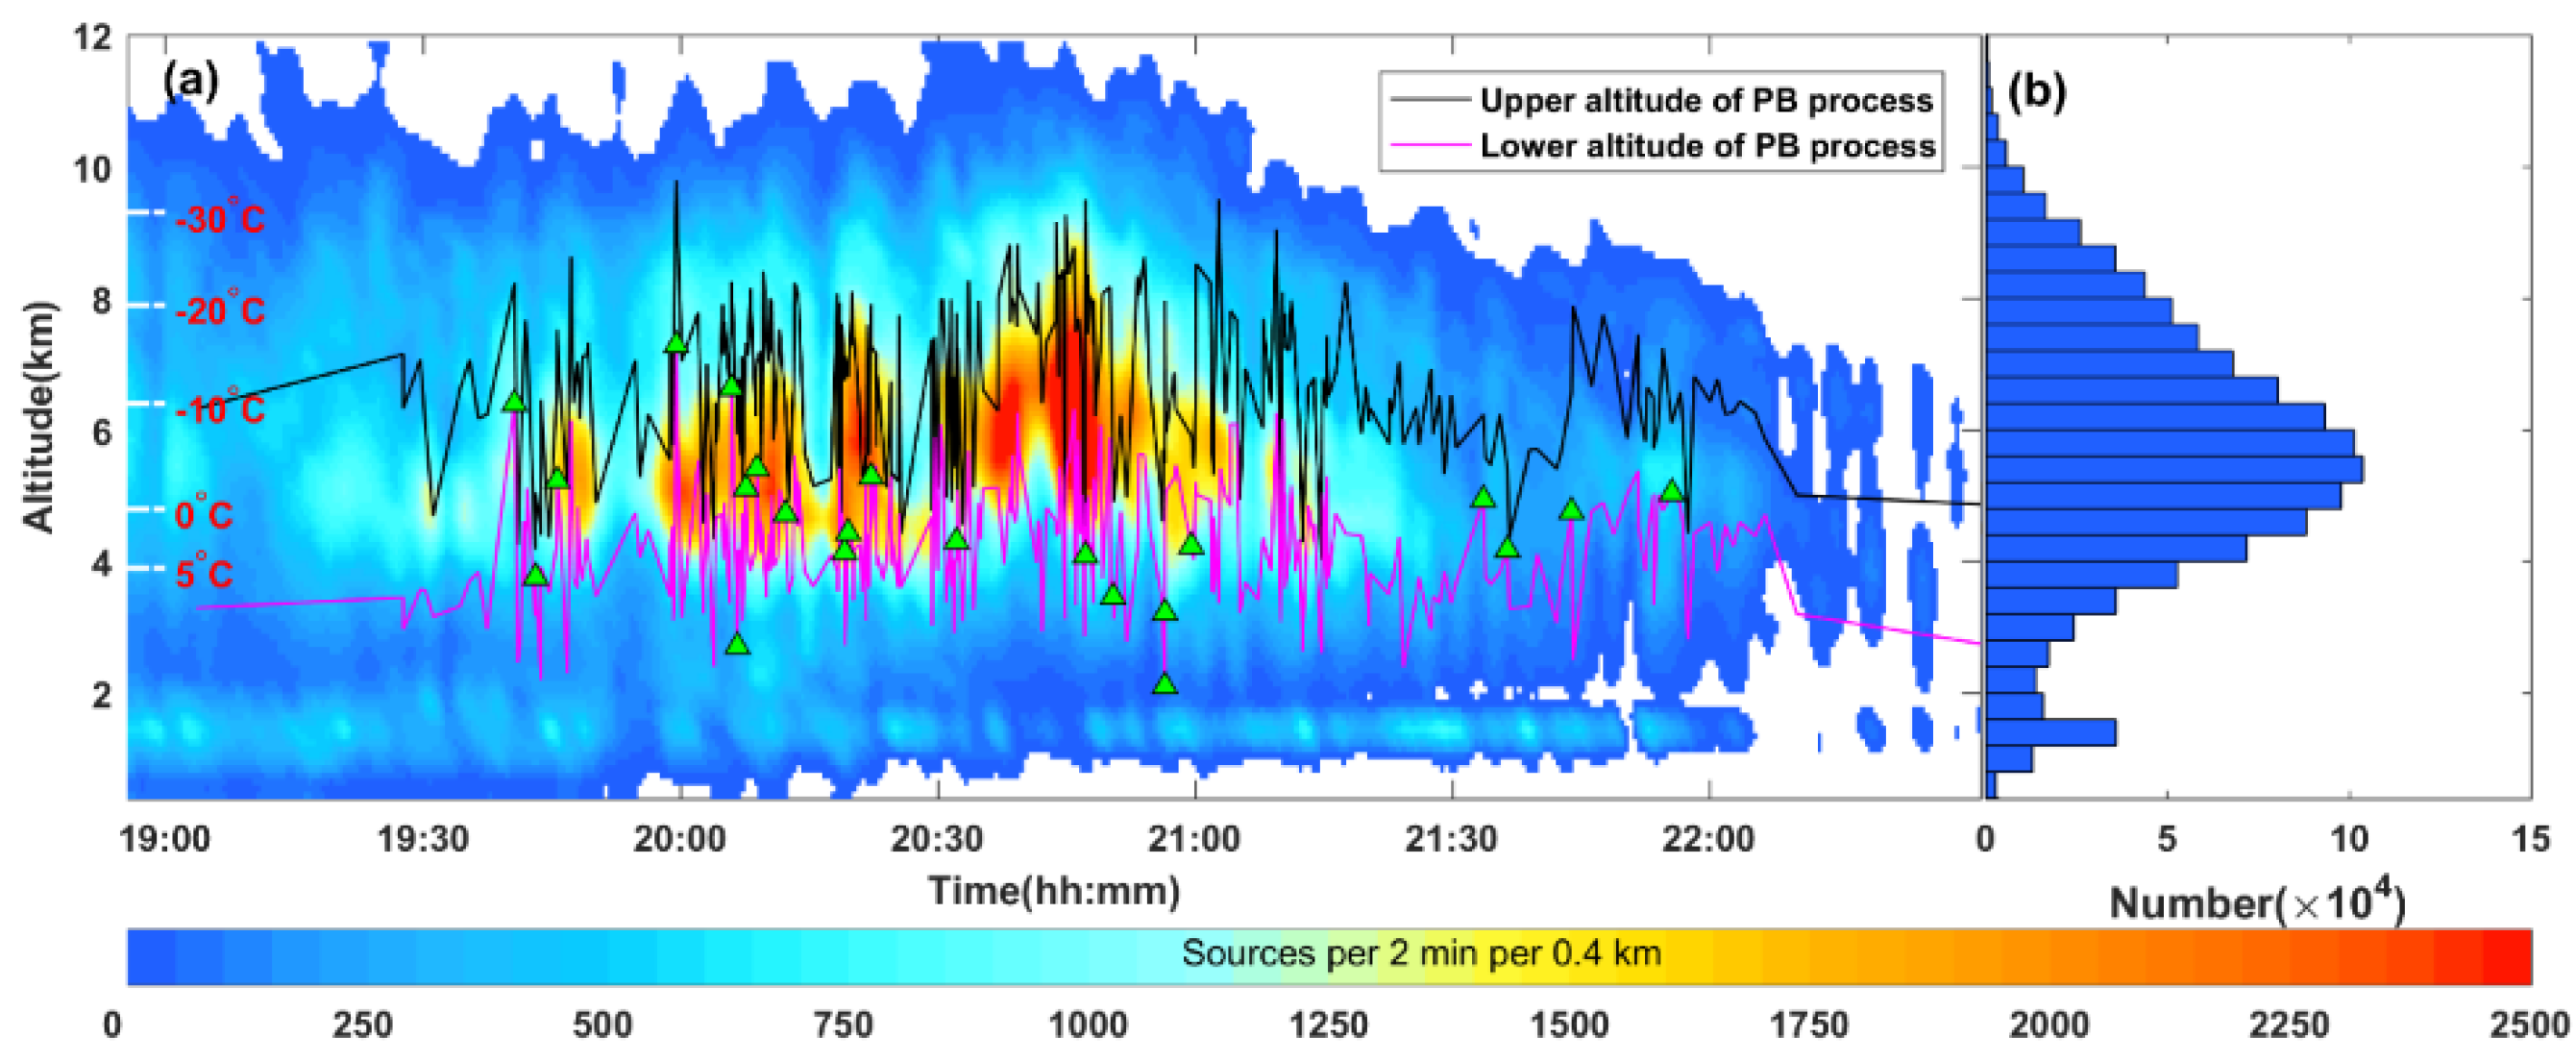
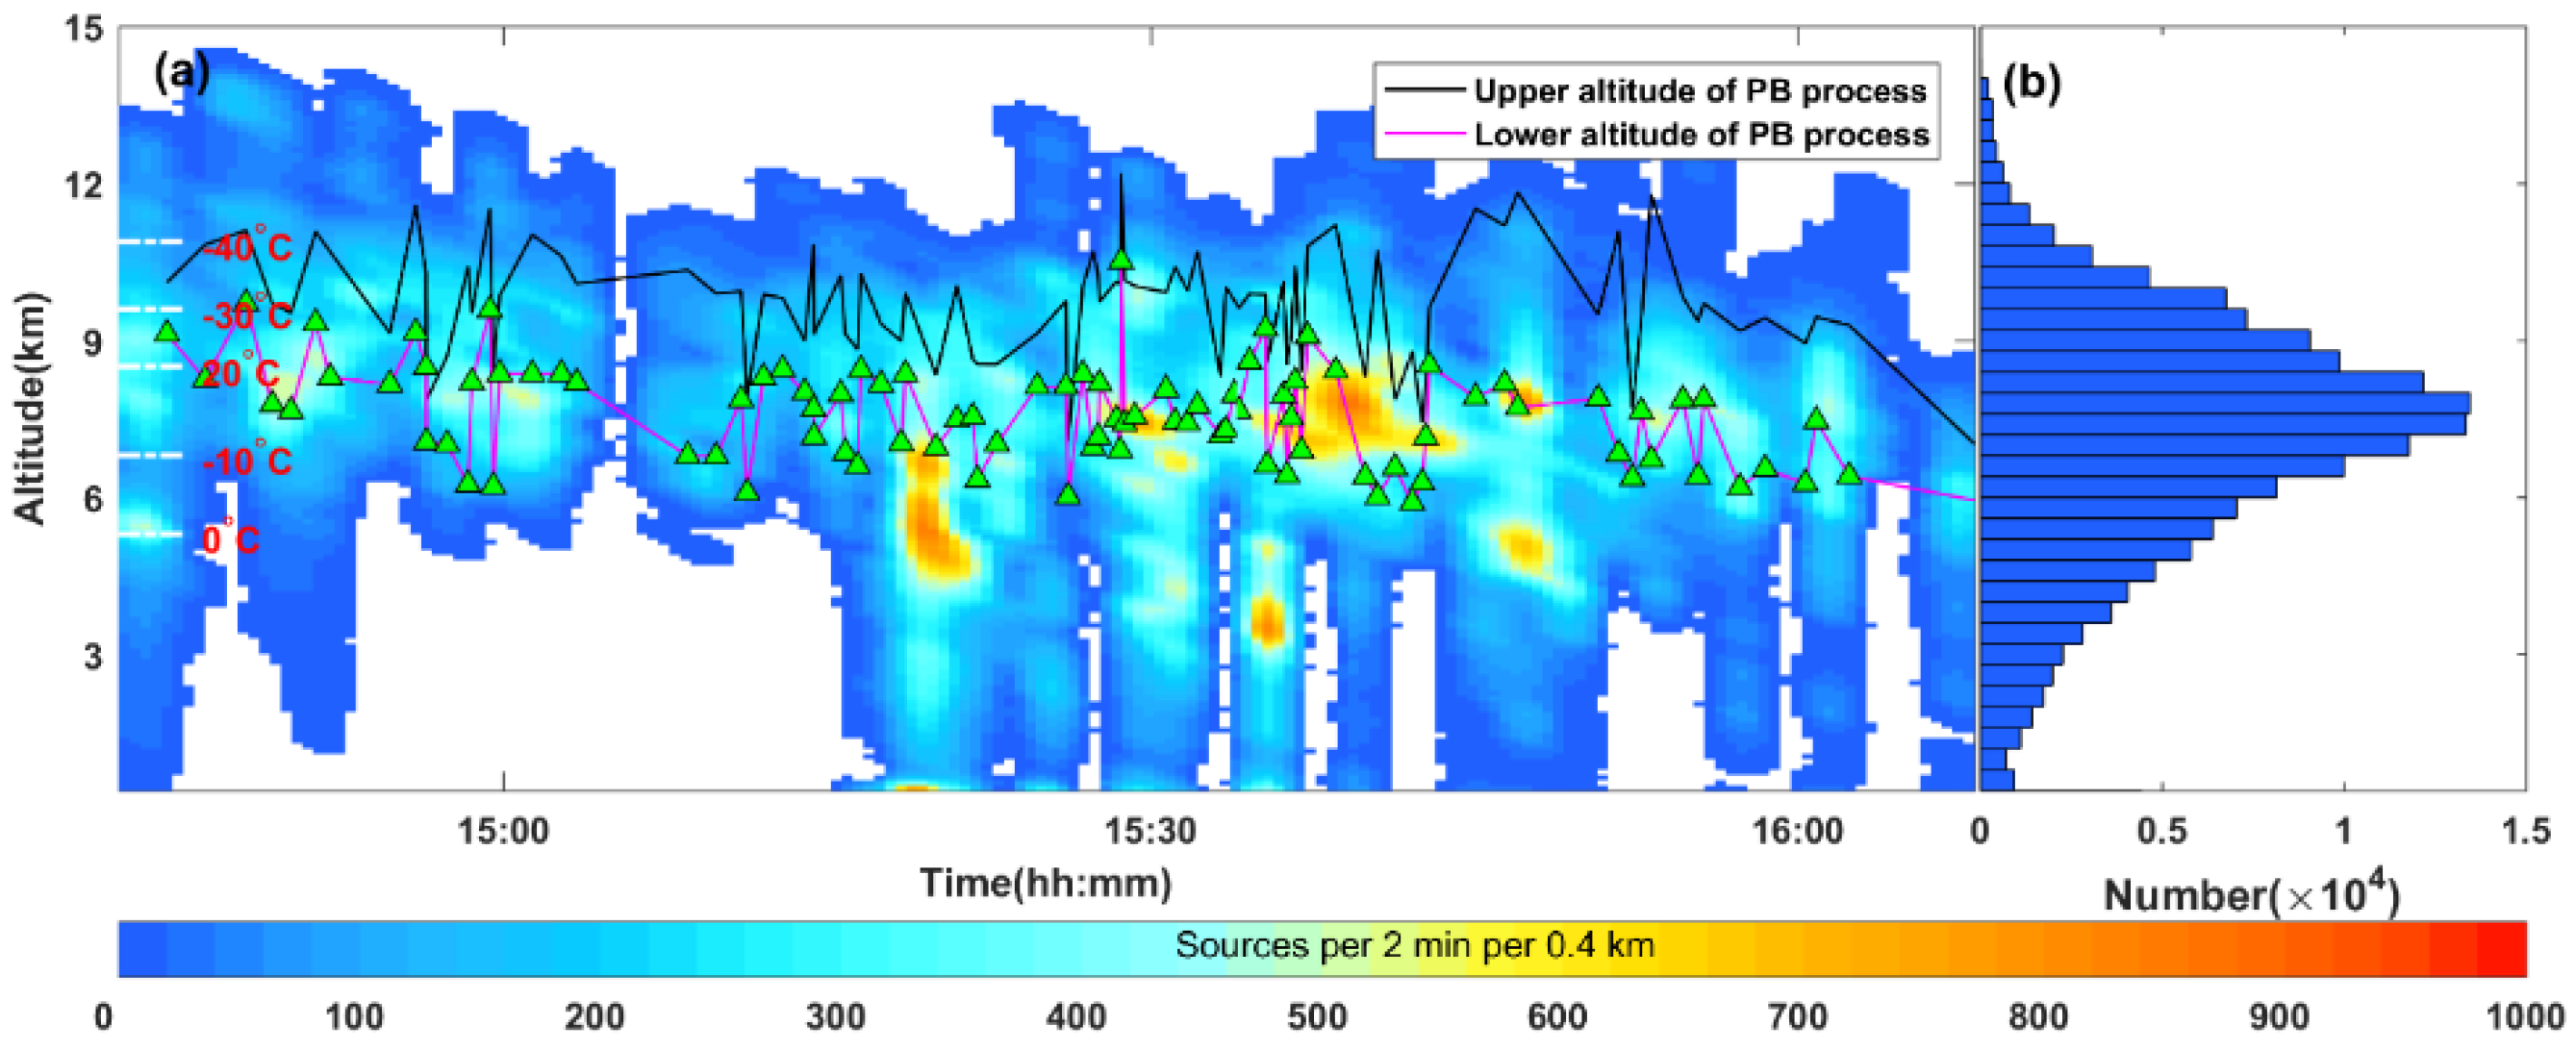
3.4. The Spatiotemporal Distributions of Discharge Sources and the Altitudes of Eell-Mapped PB Processes of the Two Largest Thunderstorms

For the two largest thunderstorms analyzed in Section 3.2, we performed 3D mapping for all discharge sources over the FALMA network and measured the upper and lower altitudes for all well-mapped PB processes, which included recognizable electric field pulses and continuous change in their source locations. Figure 11 shows the spatiotemporal distributions of all located sources, along with the upper and the lower altitudes of 310 well-mapped PB processes, for the thunderstorm on August 2nd. Out of the 310 well-mapped PB processes, positive CG, negative CG, normal IC and inverted IC flashes accounted for 0.3% (1/310), 0.3% (1/310), 6.8% (21/310) and 92.6% (287/310), respectively. For easy identification and comparison, the upper altitudes and the lower altitudes of PB processes are denoted with black and pink lines, respectively, and the temperature information is also included. The information on the temperature according to height was obtained from sounding data at the Yinchuan site of the China Meteorological Administration.
As seen in Figure 11a, during the three-hour evolution of the thunderstorm from 19:00 to 22:00, the source density, measured as the source numbers per two minutes per 0.4 km in the x, y and z scales, varied significantly both in time and in altitude, perhaps reflecting the different stages of the storm. As seen in Figure 11b, most sources occurred at temperatures between 5 and −30 °C, with a peak number at around −10 °C. Since the ground level in Ningxia, China, is about 1250 m, the additional peak at an altitude of around 1.5 km in Figure 11b corresponded to sources produced by the leaders close to the ground.
We use green triangles on the pink line in Figure 11a to indicate that the corresponding PB processes propagated upward. All the remaining PB processes, without green triangles, propagated downward. Out of the 310 well-mapped PB processes, 288 (287 inverted IC flashes and 1 negative CG flash) were found to propagate downward towards around −10 °C from the average initiation height of 6.7 km. The remaining 22 processes (21 normal IC flashes and 1 positive CG flash) propagated upward from the average initiation height of 4.7 km.
Figure 12 shows the spatiotemporal distributions of all located sources, along with the upper and the lower heights of 332 well-mapped PB processes, for the thunderstorm on August 5th. All of these 332 PB processes were from IC flashes. Out of the 332 well-mapped PB processes, 96% (318/332) of PB processes from inverted IC flashes propagated downward, with a mean initiation height of 7.3 km. Only 4% (14/332) of PB processes from normal IC flashes propagated upward, with a mean initiation height of 5.3 km, as seen by the green triangles on the pink line. Like the thunderstorm on August 2nd, most sources occurred at temperatures between 5 and −30 °C, with a peak at around −10 °C.

3.5. Discussion on the Possible Charge Structure

The large observed percentage of the downward PB processes (August 2nd: 93%, 287/310; August 5th: 96%, 318/332) indicates that the charge structures of the thunderclouds were generally different from the ordinary summer thunderstorms in lowland areas (e.g., in [23,24]). To better understand such a difference, Figure 13 shows the spatiotemporal distributions of all located sources, along with the upper and the lower heights of 95 well-mapped PB processes, for an isolated summer thunderstorm observed also by FALMA in Gifu, Japan [17,23]. All the PB processes belonged to IC flashes and propagated upward with their lowest sources at the height of around −10 °C and highest sources at around −40 °C. As has been reported recently, PB processes are a type of negative leader (see, e.g., [23,24]); such types of upward PB progressions indicate that the main negative charge in the thundercloud is at a height of around −10 °C (at a lower height) and the main positive charge is at a height of around −40 °C (at an upper height). This is a typical charge structure for summer thunderstorms in lowland areas. If we compare Figure 13 with Figure 11 and Figure 12, we can see that main negative charge in the two thunderclouds observed in Ningxia, China, was at a height of around −15 to −25 °C (at an upper height) and the main positive charge was at a height of around 5 to 0 °C (at a lower height). The main charge structures in the two thunderclouds in Ningxia, China, were apparently upside down compared to the storm in Gifu, Japan, though at heights with different corresponding temperatures. In this sense, the main charge structures of the two storms in Ningxia can be treated as inverted in polarity compared to ordinary summer thunderstorms in lowland areas.
However, we should point out that, for an ordinary summer thunderstorm in lowland areas, a lower positive charge region at the height of 0 to −10 °C has also been often observed. One reviewer suggested that the charge structure observed in Ningxia is simply the lower dipole of a typical tri-polar charge structure and is not like the inverted charge structures observed in the United States, where the middle level of the positive charge is roughly at the height of −10 to −20 °C and the upper level of the negative charge is at a height of −40 to −50 °C [28]. If we compare the charge structures of the storms in Ningxia with the lower dipole of a typical tri-polar charge structure, we can see that the main negative charge in Ningxia is at a higher height, while the main positive charge is at a lower height. In addition, we can note that a few of the upward PB processes, like the ones around 21:00 on August 2nd in Figure 11, occurred at the very bottom of the thundercloud. These types of PB processes appeared to occur between the two regions of a lower negative charge and a middle positive charge and presumably indicated an inverted tri-polar charge structure during the corresponding periods. It seems that the charge structures of the thunderstorms in Ningxia, or more broadly in the Chinese inland plateau area, are very unique and definitely deserve more detailed study in the future.

4. Conclusions

We started a long-term continuous observation of lightning discharges in the Chinese inland plateau region using FALMA. Based on the observation data for 2019, we reported the following initial results.
(1) There were 25 thunderstorm days in Ningxia in 2019, mostly between July and September. In terms of space and time, the majority of lightning flashes in Ningxia were located in its northern region and occurred in the afternoon.
(2) For the two largest thunderstorms, which occurred on two different days, it was found that the percentages of CG flashes were 28.4% and 32.5%, respectively. All types of lightning discharges, including positive CG, negative CG, normal IC and inverted IC, were observed and their example 3D mappings were provided above.
(3) Most of the lightning discharge sources of the two largest thunderstorms occurred at temperatures between 5 and −30 °C, with a peak at around −10 °C. More than 90% of the corresponding well-mapped preliminary breakdown (PB) processes of IC flashes propagated downward. We inferred that the main negative charge for the two thunderstorms observed in Ningxia, China, was at a height of around −15 to −25 °C (7 to 9 km) and the main positive charge was at a height of around 5 to 0 °C (2 to 4 km).

Author Contributions

Conceptualization, P.G. and D.W.; methodology, P.G., T.W. and D.W.; software, T.W..; validation, P.G., T.W. and D.W.; formal analysis, P.G. and T.W.; investigation, P.G.; resources, P.G.; data curation, P.G. and T.W.; writing—original draft preparation, P.G.; writing—review and editing, D.W.; visualization, P.G. and T.W.; supervision, D.W.; project administration, P.G.; funding acquisition, P.G. All authors have read and agreed to the published version of the manuscript.

Funding

This research received no external funding.

Informed Consent Statement

Not applicable.

Data Availability Statement

Readers can obtain the data from the corresponding author (wang@gifu-u.ac.jp).

Acknowledgments

The authors would like to thank all the people who helped carry out the observation experiments in Ningxia. The authors also thank Dongdong Shi, Yangzhou University, China, for helping plot Figure 11, Figure 12 and Figure 13.

Conflicts of Interest

The authors declare no conflict of interest.

References

  1. Wang, C.; Chen, Q.; Liu, X. The electric field produced by the lower positive charge center of thunderstorm. Plateau Meteorol. 1987, 6, 65–74. (In Chinese) [Google Scholar]
  2. Liu, X.; Guo, C.; Wang, C. The surface electrostatic field-change produced by lightning flashes and the lower positive charge layer of the thunderstorm. Acta Meteorol. Sin. 1987, 45, 500–504. [Google Scholar]
  3. Shao, X.; Liu, X. A preliminary analysis of intracloud lightning flashes and lower positive charge of thunderclouds. Plateau Meteorol. 1987, 6, 317–325. (In Chinese) [Google Scholar]
  4. Liu, X.; Ye, Z.; Shao, X.; Wang, C.; Yan, M.; Guo, C. Intracloud lightning discharge in the lower part of thundercloud. Acta Meteorol. Sin. 1989, 3, 2. [Google Scholar]
  5. Wang, D.; Liu, X.; Wang, C. A preliminary analysis of the characteristics of ground discharges in thunderstorms near Zhongchuan, Gansu province. Plateau Meteorol. 1990, 9, 405–410. [Google Scholar]
  6. Qie, X.; Kong, X.; Zhang, G.; Zhang, T.; Yuan, T.; Zhou, Y.; Zhang, Y.; Wang, H.; Sun, A. The possible charge structure of thunderstorm and lightning discharges in northeastern verge of Qinghai–Tibetan Plateau. Atmospheric Res. 2005, 76, 231–246. [Google Scholar] [CrossRef]
  7. Qie, X.; Zhang, T.; Chen, C.; Zhang, G.; Zhang, T.; Wei, W. The lower positive charge center and its effect on lightning discharges on the Tibetan Plateau. Geophys. Res. Lett. 2005, 32, 1–4. [Google Scholar] [CrossRef] [Green Version]
  8. Cui, H.; Qie, X.; Zhang, Q.; Zhang, T.; Zhang, G.; Yang, J. Intracloud discharge and the correlated basic charge structure of a thunderstorm in Zhongchuan, a Chinese Inland Plateau region. Atmospheric Res. 2009, 91, 425–429. [Google Scholar] [CrossRef]
  9. Qie, X.; Zhang, T.; Zhang, G.; Zhang, T.; Kong, X. Electrical characteristics of thunderstorms in different plateau regions of China. Atmospheric Res. 2009, 91, 244–249. [Google Scholar] [CrossRef]
  10. Zhang, G.; Wang, Y.; Qie, X.; Zhang, T.; Zhao, Y.; Li, Y.; Cao, D. Using lightning locating system based on time-of-arrival technique to study three-dimensional lightning discharge processes. Sci. China Earth Sci. 2010, 53, 591–602. [Google Scholar] [CrossRef]
  11. Li, Y.; Zhang, G.; Wen, J.; Wang, D.; Wang, Y.; Zhang, T.; Fan, X.; Wu, B. Electrical structure of a Qinghai–Tibet Plateau thunderstorm based on three-dimensional lightning mapping. Atmospheric Res. 2013, 134, 137–149. [Google Scholar] [CrossRef]
  12. Li, Y.; Zhang, G.; Wang, Y.; Wu, B.; Li, J. Observation and analysis of electrical structure change and diversity in thunderstorms on the Qinghai-Tibet Plateau. Atmospheric Res. 2017, 194, 130–141. [Google Scholar] [CrossRef]
  13. Takeda, M.; Wang, D.; Takagi, N.; Watanabe, I.; Chen, M.; Ushio, T.; Kawasaki, Z.; Nakano, M.; Nakamura, K.; Liu, X.; et al. Some Results Of Investigation On Slow Front Of Return Stroke Electric Waveform. J. Atmospheric Electr. 1998, 18, 31–39. [Google Scholar] [CrossRef]
  14. Qie, X.; Guo, C.; Zhang, G.; Liu, X.; Watanabe, T.; Wang, D.; Kawasaki, Z.-I.; Nagano, M.; Nakamura, K.; Ushio, T. Radiation electric field of return stroke and attachment process near the ground. Plateau Meteorol. 1998, 17, 44–54. [Google Scholar]
  15. Qie, X.; Yu, Y.; Wang, D.; Wang, H.; Chu, R. Characteristics of Cloud-to-Ground Lightning in Chinese Inland Plateau. J. Meteorol. Soc. Jpn. 2002, 80, 745–754. [Google Scholar] [CrossRef] [Green Version]
  16. Wang, D.; Takagi, N.; Watanabe, T.; Tie, Y.; Qie, X.; Zhang, Y. Observed characteristics of lightning occurred in Lhasa city, Tibet plateau region of China. J. Atmos. Electr. 2007, 27, 1–7. [Google Scholar]
  17. Wu, T.; Wang, D.; Takagi, N. Lightning Mapping With an Array of Fast Antennas. Geophys. Res. Lett. 2018, 45, 3698–3705. [Google Scholar] [CrossRef]
  18. Wang, D.; Wu, T.; Takagi, N. Practical Features of 3D Lightning Mapping System FALMA. In Proceedings of the 2019 11th Asia-Pacific International Conference on Lightning (APL), Hong Kong, China, 12–14 June 2019. [Google Scholar]
  19. Gao, P.; Wang, D.; Shi, D.; Wu, T.; Takagi, N. Characterization of Multitermination CG Flashes Using a 3D Lightning Mapping System (FALMA). Atmosphere 2019, 10, 625. [Google Scholar] [CrossRef] [Green Version]
  20. Wu, T.; Wang, D.; Takagi, N. Locating Preliminary Breakdown Pulses in Positive Cloud-to-Ground Lightning. J. Geophys. Res. Atmos. 2018, 123, 7989–7998. [Google Scholar] [CrossRef]
  21. Wu, T.; Wang, D.; Takagi, N. Intracloud Lightning Flashes Initiated at High Altitudes and Dominated by Downward Positive Leaders. J. Geophys. Res. Atmos. 2019, 124, 6982–6998. [Google Scholar] [CrossRef]
  22. Shi, D.; Wang, D.; Wu, T.; Takagi, N. Correlation Between the First Return Stroke of Negative CG Lightning and Its Preceding Discharge Processes. J. Geophys. Res. Atmos. 2019, 124, 8501–8510. [Google Scholar] [CrossRef]
  23. Shi, D.; Wang, D.; Wu, T.; Takagi, N. Temporal and Spatial Characteristics of Preliminary Breakdown Pulses in Intracloud Lightning Flashes. J. Geophys. Res. Atmos. 2019, 124, 12901–12914. [Google Scholar] [CrossRef]
  24. Shi, D.; Wang, D.; Wu, T.; Takagi, N. A Comparison on the E-change Pulses Occurring in the Bi-level Polarity-opposite Charge Regions of the Intra-Cloud Lightning Flashes. J. Geophys. Res. Atmos. 2020, 125, 125. [Google Scholar] [CrossRef]
  25. Hidayat, S.; Ishii, M. Diurnal variation of lightning characteristics around Java Island. J. Geophys. Res. Space Phys. 1999, 104, 24449–24454. [Google Scholar] [CrossRef] [Green Version]
  26. Chronis, T.G.; Cummins, K.L.; Said, R.K.; Koshak, W.J.; McCaul, E.W.; Williams, E.R.; Stano, G.T.; Grant, M.R. Climatological diurnal variation of negative CG lightning peak current over the continental United States. J. Geophys. Res. Atmos. 2015, 120, 582–589. [Google Scholar] [CrossRef]
  27. Wu, T.; Wang, D.; Takagi, N. Multiple-Stroke Positive Cloud-to-Ground Lightning Observed by the FALMA in Winter Thunderstorms in Japan. J. Geophys. Res. Atmos. 2020, 125, 1–17. [Google Scholar] [CrossRef]
  28. Rust, W.D.; MacGorman, D.R.; Bruning, E.C.; Weiss, S.A.; Krehbiel, P.R.; Thomas, R.J.; Rison, W.; Hamlin, T.; Harlin, J. Inverted-polarity electrical structures in thunderstorms in the Severe Thunderstorm Electrification and Precipitation Study (STEPS). Atmospheric Res. 2005, 76, 247–271. [Google Scholar] [CrossRef]
Figure 1. Geographical distribution of 25 FALMA sites in Ningxia. The latitude and longitude of the site at (0, 0) is (38.43° N, 106.17° E).
Atmosphere 12 00514 g001
Figure 2. The number of lightning sources for different thunderstorm days in 2019.
Atmosphere 12 00514 g002
Figure 3. The spatial distribution of lightning sources.
Atmosphere 12 00514 g003
Figure 4. Diurnal distribution of lightning sources.
Atmosphere 12 00514 g004
Figure 5. The temporal and spatial evolutions of lightning sources in the thunderstorm on August 2nd. Source distributions of total lightning flashes (a), CG lightning flashes (b), and IC lightning flashes (c). The temporal evolutions of various types of lightning flashes are shown in (d).
Atmosphere 12 00514 g005
Figure 6. The temporal and spatial evolutions of lightning sources in the thunderstorm on August 5th. Source distributions of total lightning flashes (a), CG lightning flashes (b), and IC lightning flashes (c). The temporal evolutions of various types of lightning flashes are shown in (d).
Atmosphere 12 00514 g006
Figure 7. 3D mapping results for an inverted-polarity IC flash on August 2nd starting from 20:29:42. (a) E-change waveform following the atmospheric electricity sign convention; (b) source height versus time; (c) west–east vertical view; (d) source distribution along the height; (e) plan view; (f) south–north vertical view.
Atmosphere 12 00514 g007
Figure 8. 3D mapping results for a normal IC flash on August 5th starting from 10:07:01. (a) E-change waveform following the atmospheric electricity sign convention; (b) source height versus time; (c) west–east vertical view; (d) source distribution along the height; (e) plan view; (f) south–north vertical view.
Atmosphere 12 00514 g008
Figure 9. 3D mapping results for a positive CG flash on August 2nd starting from 21:26:36. Two return strokes are denoted with dark triangles. (a) E-change waveform following the atmospheric electricity sign convention; (b) source height versus time; (c) west–east vertical view; (d) source distribution along the height; (e) plan view; (f) south–north vertical view.
Atmosphere 12 00514 g009
Figure 10. 3D mapping results for a simple negative CG flash on July 28th starting from 19:46:10.1. The return stroke is denoted with a green triangle. (a) E-change waveform following the atmospheric electricity sign convention; (b) source height versus time; (c) west–east vertical view; (d) source distribution along the height; (e) plan view; (f) south–north vertical view.
Atmosphere 12 00514 g010
Figure 11. Spatiotemporal distributions of PB processes in lightning flashes on 2 August 2019. (a) Lightning source density as a function of altitude and time. The shaded area represents the source number counted in 2 min intervals and with a 0.4 km height bin, as shown by the bottom color bar. Black and pink curves indicate the upper and lower altitudes of PB sources in each flash. In particular, the initiation heights of upward PB processes are marked by green triangles. (b) Distribution of lightning sources with height.
Atmosphere 12 00514 g011
Figure 12. Spatiotemporal distributions of PB processes in lightning flashes on 5 August 2019. (a) The shaded area represents the source number counted in 2 min intervals and with a 0.4 km height bin, as shown by the bottom color bar. Black and pink curves indicate the upper and lower altitudes of PB sources in each flash. In particular, the initiation heights of upward PB processes are marked by green triangles. (b) Distribution of lightning sources with height.
Atmosphere 12 00514 g012
Figure 13. Spatiotemporal distributions of PB processes in lightning flashes in a thunderstorm that occurred in Gifu, Japan, on 13 July 2017. (a) The shaded area represents the source number counted in 2 min intervals and with a 0.4 km height bin, as shown by the bottom color bar. Black and pink curves indicate the upper and lower altitudes of PB sources in each flash. In particular, the initiation heights of upward PB processes are marked by green triangles. (b) Distribution of lightning sources with height.
Atmosphere 12 00514 g013
Table 1. The number of thunderstorm days in Ningxia in 2019.
MonthsMonthly CountSpecific Dates (Day)
April126
May116
June224, 25
July618, 21, 23, 26, 27, 28
August82, 5, 6, 8, 9, 26, 27, 31
September61, 7, 8, 9, 25, 26
November16
Total25
Publisher’s Note: MDPI stays neutral with regard to jurisdictional claims in published maps and institutional affiliations.

