
Exploring the Thermal Microcosms at the Forest Floor—A Case Study of a Temperate Forest

Working Group of Environmental Mineralogy and Environmental System Analysis, Institute of Applied Geosciences, Karlsruhe Institute of Technology, Adenauerring 20b, 76131 Karlsruhe, Germany
Atmosphere 2021, 12(4), 503; https://doi.org/10.3390/atmos12040503
Submission received: 1 March 2021
/
Revised: 22 March 2021
/
Accepted: 6 April 2021
/
Published: 16 April 2021
(This article belongs to the Special Issue Air Quality Assessment and Management)
Abstract
:With the expected changes in summer weather due to global warming, knowledge of the microclimatic variability at the forest floor dramatically increased in importance for silviculture, wildfire management and biodiversity issues. Thus, during the warm season in 2014, thermal aspects within a heterogeneous forest were recorded at nine sites and compared to data from a nearby weather station. It was found that soil (−5 cm) and near-surface (0–2 cm) temperatures under shaded conditions stayed remarkably cooler than temporarily or fully radiated spots inside and outside the forest; largest differences occurred in maxima (July: 22.5 °C to 53.5 °C). Solar radiation was found to be the main driver for the strong heating of near-surface microhabitats, which could be reinforced by the vegetation type (moss). The weather station widely reflected the average condition on forest floor, but lacks the biological meaningful temperature extremes. The measurement system (internal versus external sensor) resulted in differences of up to 6 K. The findings underline the importance of old or dense stands for maintaining cool microrefugia. However, also the need for careful selection and analysis of microclimatic measurements in forests, representative for specific microhabitats, under consideration of ground vegetation modifications.
1. Introduction
Global warming causes changes which pose major challenges to both science and society. In urban spaces, the stressful effects of the heat island will be exacerbated, increasing summer heat stress and health problems for urban residents [1]. Green spaces inside and outside the city, and especially larger forest areas, contribute to mitigating these stress effects through physical mitigation processes, which today are often denoted as ecosystem services [2,3,4].
However, the changes not only pose a challenge for forests and their management, but also for the biodiversity of microorganisms. Whereas spring frost damage has been a pressing problem up to now [5,6], the intensification of heat and drought periods in future summers will present silviculture with additional issues to consider [7,8,9,10]. One issue, for example, is the survival probability of juvenile stages under such extreme events [11]. However, severe damage is already occurring, even in mature forests of drought-adapted species composition [8]. Forests with dead trees are more vulnerable to fire hazards, which are expected to occur more often in Europe’s forests in future with related negative effects on local biodiversity for the widely non fire-adapted species [12]. Long-term shifts of species toward more warmth-adapted species was already observed [13]. Biodiversity research is now concerned about whether our forests can provide heat-sensitive species with cooler microrefugia in which they can survive despite overall warming [14,15,16,17]. Knowledge of the microcosm on the forest floor is therefore rapidly gaining in importance.
In view of the current state of research, however, it must be noted that studies on the thermal behavior of the near-surface microclimate in particular are largely lacking [16,18,19]. Instead, standardized weather stations are frequently used to answer forest-related questions—despite the large differences that exist between the open land measurements at 2 m height and on the forest floor [16,17,20,21,22]. In addition, the conditions on the forest floor itself are much more variable than in the field. Based on modeling results, Graae et al. (2012) described it as follows: the thermal within-site variation can be “as high as would be expected from a 300 m change in altitude or from a 4° change in latitude or a climate change scenario corresponding to warming of 1.6–3.8 °C” [17]. As consequence, more studies on the variability of the near-surface microclimate of forests are therefore needed to extend knowledge across different regions and gained with different measurement approaches—since below-canopy measurements are not yet standardized in research.
In this study, the diversity of thermal conditions of a heterogeneous, coniferous dominated forest was investigated over one growing season (April to September). The study year 2014 was the warmest, did not offer hot and dry weather extremes in the summer, but rather reflected cool and rainy conditions. However, typical of this region before the onset of climate change impacts.
The focus was on the top centimeters above the soil, i.e., the place of humus, leaf litter, bryophytes, and vascular plants, covering or even being the microhabitat of many organisms such as tree seedlings [23], various insects, decomposers such as collembola and oribatite mites [24,25,26], ticks [22,27], microbes [28], and many more. It is to be expected that grass and moss themselves heat up to different degrees and thus, in addition to the effects of shading and evaporation, influence the measured temperatures [5,29]. Small-scale climate phenomena are influenced by many different factors acting on different temporal and spatial scales. Based on existing definitions [21] but modified for the purpose of this work, the term microclimate is used to represent conditions tied to a specific microhabitat—for example, a small soil refugium, a specific layer within humus, or the soil surface under grass.
The investigations focus on the short-term variability inside a forest as well as the differences compared to standardized measurement set-ups outside a forest, thus focussing on relative statements at short time-scale. Of course, also local and long-term climatic effects at a larger scale such as land topography, exposition and slope [30], canopy related aspects [31], cold air pools, altitude or latitude of the locations, etc. [17,32,33], may impose an influence on absolute temperatures. To exclude such kind of superimposed effects on the investigations, a widely flat terrain was selected as study area with a maximum distance of 1 km between all measurement sites. In addition, regarding the weather situation, it can be plausibly assumed that almost all typical situations of clear, cloudy and rainy days have occurred during the (continuous) recording period from April to November.
A large influence on the variation of the thermal behavior of the forest floor is of course closely related to the structure of forest canopies. They highly modify external factors such as the amount of incoming solar radiation or outgoing nocturnal radiation, the amount and distribution of incoming precipitation and reduce wind speed, depending on, e.g., canopy density and gaps, tree species/crown structure, age, foliage characteristics such as the leaf area index (LAI) [5,6,31,34,35]. An often-described characteristic is the moderating effect of extremes, mainly temperature, wind and moisture, through forests [21,36,37]. An important driver for the temperature of the near-surface is the amount of incoming solar radiation, i.e., diffuse and beam radiation, and absorptivity of the irradiated medium, which converts the absorbed energy into latent heat fluxes (evaporation) or sensible heat-fluxes (heating) [21,38,39]. Each layer of vegetation, from the tree canopy to young trees, shrubs, and herbaceous vegetation, represents an insulating layer that affects incoming radiation through processes of reflection, absorption or transmission [5,6]. Furthermore, the amount of radiation reaching the forest floor is seasonally influenced by the height of the sun and is dominated by the irregular vegetation structure of the forest [40]. For evergreen tree species, greater amounts of radiation occur primarily in open areas; direct solar radiation in clearings are modified by the size of the clearing and its orientation to the sun. The larger the clearing, the greater the amount of incoming radiation, the higher the resulting temperature averages and maxima, but also the nighttime minima [34]. In dense and layer rich stands, the amount of beam radiation as well as diffuse radiation reaching the ground can be less than 10% compared to above-canopy conditions [40].
In order to reflect the thermal range at the floor of the forest under consideration, the measurement sites included clearings of different sizes, but also heavily shaded sites—below an old low-hanging coniferous tree and within a dense spruce woodland. A total of nine Micro-Loggers continuously recorded different thermal situations within the forest. A part of the Micro-Loggers was operated with internal sensors, a part with external sensors, to include potential device-dependent aspects. One of these sensors was placed under grass of a nearby meadow to record open-land conditions. Two micrometeorological stations were additionally operated at a small clearing in the forest to record also air (+50 cm) and soil (−5 cm) conditions as well as incoming solar radiation. One advantage of the study area was a nearby weather station operated by the German Weather Service. The station allowed a comparison of thermal conditions, but also recorded information on cloud cover, sunshine hours, rainfall, etc., useful for assessing the weather within the measurement period and in comparison to long-term averages.
Three main research questions arose from this approach:
- how can realistic surface temperature data be obtained, given the lack of standard measurement methods?
- how variable is the microclimatic situation on the forest floor? Or more precisely: to what extent can the thermal variability be detected with the operated measuring devices?
- how much does the near-surface situation in the forest deviate from the open-land and the nearby official weather station?
Based on these questions, it was hypothesized that (i) the external sensor system would record a slightly higher temperature than the internal sensor system (same location), (ii) solar radiation (especially beam radiation) affects the near-surface temperature stronger and faster than the air temperature and at least the soil temperature, (iii) forest patches characterized by a high density of canopy or spots located beneath a tree would be remarkably cooler than clearings or the open land; (iv) this moderating effect of forest canopy or single trees would be greater in high summer compared to spring, and greatest during warm and dry weather situations and on clear summer days, respectively; (v) compared to the nearby official weather station, conditions should be more moderated within the forest. In addition, it was expected that the individual factors would interact with each other, thus demonstrating the complexity of the below-canopy thermal cosmos and its relationship to the open-land microclimate. The results are discussed in terms of previous findings and their significance in the context of expected changes due to climate change.
The aim of the study was to record and compare the variety of thermal conditions on the forest floor. Since there are no standardized procedures for this, two different measurement systems were used, which made it possible to validate the data in certain respects. Another goal was to compare these results with the data of a nearby official weather station, to document the differences and identify systematic differences, as well as inferring the underlying physical relations.
2. Materials and Methods
2.1. Study Area and Measurement Set-Up
The study area is located on a small plateau of the low mountain range Schwäbische Alb at 48°06′ N 08°45′ E at about 1000 m a.s.l. near the town of Gosheim, Germany. Climatically, the long-term annual mean is 6.8 °C and 969 mm precipitation (1981–2010) [41,42]. This study area was selected for following reasons:
- –
- flat topography so solar radiation conditions were comparable (no exposition effects);
- –
- contiguous forest area with different areas in terms of tree species, age, stand structure and canopy density;
- –
- diverse types and density of forest understory.
i.e., a good balance between typical forest ecosystem complexity and still reasonable homogeneity for generalization of results.
The calcareous soil is shallow and rich in stones (regosol), the type of humus is moder. The microclimatic measurements were largely carried out within a contiguous forest area, comprising different areas in terms of tree species, age, stand structure, and density. Coniferous species such as spruce (Picea abies) and silver fir (Abies alba) dominate, in small parts beech (Fagus sylvatica) and occasionally other tree species such as birch (Betula spp.) or maple (Acer spp.). Dense stands of trees and pure woodland alternate with sparse stands and clearings of varying size. The forest understory is correspondingly diverse, characterized by moss and herbs in the shade of conifers, grasses and shrubs in larger clearings, and leaf litter under beech trees.
The measurement sites were selected to represent the typical local diversity of microhabitats. All stations and loggers in the forest were located at a maximum distance of 500 m from each other, so the sites can be considered similar in terms of macro- and mesoclimate, precipitation conditions and, to a limited extent, soil conditions. An overview of the area, the location of the individual loggers and the forest structure is provided by Figure 1. Air and soil measurements were carried out using climate stations (SS, MS), near-surface measurements using Micro-Loggers (ML). A brief description is given in Table 1.
In order to compare the ground conditions (instrument: micrologger) outside the forest with those in the forest directly, a logger (ML-6) was stationed on a directly adjacent meadow—maximum 700 m from the other Micro-Loggers (400 m from MS and SS). Close by (max. < 1 km distance, 500 m to MS and SS), the Klippeneck climate station (ID: 2638; 973 m a.s.l.) has been operated by the German Weather Service since 1946, data are freely available from the Climate Data Center.
The measured parameters and the different design of the measuring systems used is illustrated in Figure 2. The micrometeorological stations as well as the Micro-Loggers were specially designed and configured for the measurement task.
The micrometeorological stations (HOBO micro station data logger H21-002, by Onset, Bourne, Massachusetts) were operated in a hard plastic box with air dehumidifier, in order to prevent humidity-related damage (e.g., faster discharge of batteries). Air temperature and relative humidity were measured at 50 cm height (medium and small station) and in the litter (Medium Station) using Temperature and RH Smart Sensor STHB-M002 (resolution: ±0.02 °C/0.1%RH at 25 °C; accuracy: ±0.21 °C/2.5%RH). A white radiation shield or a protective casing covered with aluminum protects the sensors from direct sunlight and moisture (further information in Boehnke 2017). Soil temperature was measured with the Temperature Smart Sensor S-TMB-M002 (res.: ±0.03 °C at 0–50 °C; acc.: ±0.2 °C) at 5 cm soil depth or the Ah horizon of the soil, respectively. Mean values (10-sec log interval) were recorded every 10 min.
The low cost Micro-Loggers (ML) (Escort Mini 2000 Temperature Logger) are pure temperature loggers with an accuracy of 0.5 °C (res.: ±0.1 °C; acc.: ±0.5 °C) (Figure 2c). The loggers were calibrated before usage, devices with a deviation > 0.5 °C were excluded. In contrast to the measuring stations, the recorded value does not represent a mean value, but a singular measurement. All Micro-Loggers were sealed in plastic and protected from moisture by drying granules (Figure 2c). Pieces of wood or wire tagged with signal color marked the measurement sites of the (completely) covered MLs. Data were collected at 1 h (16-04-2014 to 06-06-2014) and 0.5 intervals (remaining time) from 01-04-2014 to 30-09-2014.
Originally, the sensor of the Micro-Logger was embedded in a white plastic encasement within a heat conductive paste (internal sensor, System-1, ML-1 to 6). In contrast to nonencased sensors of the DWD, MS and SS, which can detect air temperature changes directly and immediately, the temperature changes of the Micro-Loggers are bound to the casing, which is why a certain temporal inertia could be assumed. Through the contact of the casing with the medium (moss, leaf litter), the ambient temperature is (a) averaged over the total casing surface and (b) directly transferred from medium to casing. Sensors located in the air (DWD, MS, SS), in contrast, reflect the temperature of the ambient medium air directly, without time delay and transmission through a transfer medium (casing). In order to obtain data reflecting the special conditions near the ground surface without time delay and punctually, sensors (size: about 1 mm2) from four Micro-Loggers were relocated to the outside (external sensor, System-2, ML-7 to 10).
In the field, the Micro-Loggers (ML) were located on top of the soil (Ah horizon), i.e., within the overlying vegetation layer (moss, grass or leaf litter) and thus protected from direct sunlight. The external sensors were placed as close as possible to the surface (location of highest energy conversion during beam irradiation) but embedded in the vegetation layer to minimize overheating effects. The Micro-Loggers should reflect the conditions experienced by an organism (e.g., plant seedlings, amphibians, insects, arachnids, etc.) inhabiting the ground-near forest, i.e., moss, leaf litter, or grass. The grass microhabitat changed over the course of the year. The Micro-Loggers were covered primarily by dead biomass at the beginning of the measurements, then broken through by fresh grass and largely replaced by it by mid-summer (ML-1,5,6,7). The moss in the tree shade and in the spruce forest was protected from desiccation and thus much more voluminous (ML-2,3,8,10: 5–10 cm) than the moss in the clearing (ML-9: 2–4 cm).
2.2. Analysis
All data were processed and analyzed using Microsoft Excel 2016 or R version 3.5.2. [43]. The data were visually checked for outliers and missing values. Outliers were excluded from analysis. Single missing values were replaced by the average of the previous and subsequent data value and data gaps over several hours were not supplemented, but this only concerns some hours at 6 June. Single missing values were limited to the hour of manual data readout on a total of five days (16 April, 6 June, 27 June, 14 July, 10 September). Otherwise no data gaps occurred. Data from the Medium station were only included as of 17 April. For comparison reasons with the official weather station, data were calculated as hourly averages.
Data analyses were mainly based only visual observations, descriptive statistics as well as correlation and regression analysis, as presented in [44,45]. In order to filter out days with high radiation, promising days were first identified via the daily temperature curves and then plausibility was determined with the number of sunshine hours.
In order to identify possible deviations of the two measuring systems, both System-1 (internal sensor) and System-2 (external sensor) were simultaneously operated at two spots from 1–5 April. To evaluate as different radiation situations as possible, a large clearing (Figure 1f “wide clearing”, ML-1, ML-7) and a shaded spot under a large coniferous tree (Figure 1d “tree shadow”, ML-2, ML-8) were chosen. This part refers to measurements from April 1 to 15, a spring situation with seasonally reduced irradiance, comprising parallel recordings at two sites. The Micro-Loggers were installed under grass (“wide clearing”) or moss (“tree shadow”). To enable comparisons over the entire study period, two Micro-Loggers (ML-1, ML-7) were operated in parallel at “wide clearance” from April to September. It was expected that the system with an internal sensor (S1) would have a lower amplitude and lower max and min values than the system with an external sensor (S2). Differences should be greatest when energy input to the system is high, i.e., on days with high radiation, but should be much smaller on cloudy days. Following the same logic, conditions in the clearing (clear) should be significantly warmer than in the tree shade (shad).
According to the Shapiro–Wilk test, the data distributions of the hourly values were not normally distributed in every case; therefore, statistical tests recommended for non-normal distributions were used. To test for similarity between time series, correlations analyses were operated using Spearman’s rank correlation coefficient [46]. Linear regression models were calculated to test for relationships and systematic deviations. Results were considered significant when p < 0.05 (p < 0.05 *, p < 0.01 ** and p < 0.001 ***.
To get an impression about the thermal conditions at the forest floor in comparison with the nearby station “Klippeneck” but also other official weather stations, accumulated temperature sums (hourly data, April 1st to Sept 30th) were used. Additional DWD stations were “Sigmaringen-Laiz” (580 m a.s.l., 48.07° N; 9.19° E), “Merklingen” (685 m a.s.l., 48.51° N; 9.76° E) and “Ellwangen-Rindelbach” (480 m a.s.l., 48.99° N; 10.13° E).
3. Results
3.1. Weather Situation
The study year 2014 was the hottest year in Germany since weather records began, with very hot and dry conditions in June and early July, but rather cool and rainy conditions in mid-summer month of late July and August [47]. The characteristics of the study period, which were measured at the Weather Station “Klippeneck” near the study area, are summarized in Table 2.
As can be seen, April and June were remarkably warm and sunny, yet also few cold and rainy days occurred. The hot period of June extended into July and was then replaced by very cool conditions, which is not covered by monthly averages. In contrast, late July and August were cool and cloudy most of the time, with some rain. Therefore, the results certainly do not cover the conditions that would occur under weather extremes, e.g., especially hot and dry summers (year 2003, 2015 or 2018).
In summary, this heterogeneity underlines that most typical short-term weather situations indeed appeared and have been recorded, although monthly averages may differ from the long-term climatic baseline (1981–2010) [41,42]. The particularly interesting fully radiation days appeared comparatively seldom at the Klippeneck station during the study period (data not shown). Long dry and warm/hot periods were present in April and June, but extreme mid-summer conditions did not occur.
3.2. Sensor-Version Comparison: System-1 Versus System-2
In general, the daily amplitude of temperature was evidently higher for external (S2) than for internal (S1) sensors (maxclear: +9.3 K, maxshad: +6.9 K; STDclear: +2.4 K, STDshad: +1.1 K) at both sites. Higher deviations of the two systems occurred (a) on days compared to nights, (b) on days with long sunshine durations and intensive beam radiation and (c) in the clearing compared to tree shade. These effects are illustrated on the basis of a 4-day period (Figure 3a).
The differences between the sites (Figure 3a, black and grey lines) were distinctly larger than the observed differences between the systems at one site (Figure 3a, red and blue lines). On average, “wide clearing” was 8.8 K (S1)/10.5 K(S2) warmer with a maximum of 16.1 K (S1)/20.6 K (S2) compared to “tree shadow”. At “tree shadow”, conditions were considerably cooler and less pronounced between systems.
Comparing only temperatures at daytime (08:00 to 17:00) at days with a high irradiance (2 April, 11–13 April) resulted in higher differences between both systems (meanclear: 3.3 K, meanshad: 1.5 K) compared to the total period from April 1 to 15 (meanclear: 0.6 K, meanshad: 0.3) (data not shown). During the day in the absence of direct sunlight (April 5) and at night, the differences between (a) the two systems and (b) the two sites were much smaller. On cloudy day, the external sensor system (S2) was warmer by 1.0 K (clear)/0.5 K (shad) on average and 4.9 K (clear)/1.9 K (shad) maximum compared to the internal sensor system (S1). Differences between sites were also similarly low at night.
The daily temperature difference curves are represented as monthly averages from April to September, to depict differences between the months (Figure 3b). While in April and May there was still a clear and changing system difference in the course of the day, in August and September there was hardly any difference between the two systems. With respect to the weather situation, the difference can be attributed to the monthly weather situation and partly confirms the findings of the first part: higher deviations of the two systems occurred (a) on days compared to nights, (b) in months with many clear and sunny days compared to rather cool, rainy months (compare Section 3.1).
It was striking that the situation was reversed in June, i.e., that the internal sensor system (S1/ML-1) recorded much higher temperatures than the external one (S2/ML-7). Compared to the temperature maxima of the other months, the S2 remained consistent, while S1 recorded suddenly and only in June significantly higher temperatures (data not shown). Thus, the June data from ML-1 were removed from further analysis.
In summary, the results suggest that sites with different systems are the most comparable,
- if they are generally heavily shaded (ML-2, ML-3, ML-8, ML-10);
- on cloudy days with minimal beam radiation;
- at night.
On days with high solar irradiance and especially at sites partially (ML-1, ML-4, ML-5, ML-7, ML-9) or completely (ML-6) exposed to it, however, high differences between the two systems were observed.
3.3. Effects of Tree Shading on Solar Radiation and Ground-Level Thermal Conditions
The effects of shading by trees on the temperature near the forest floor are illustrated by a sunny period in June (Figure 4).
Medium Station (MS) was located on a “small clearing” surrounded by tall conifers. The near-surface sensor (MS_Tli) was located on the soil surface, surrounded and slightly covered by organic matter (moss, leaves). Solar radiation measured at the station indicates that the trees largely prevented direct irradiation in June until about 10 a.m. and from 3 p.m. (MS_solrad < 100 W/m2). In between, beam radiation nearly reached up to 800 W/m2. The diffuse radiation measured during the day in periods without beam radiation peaked at 4 pm with 126 W/m2.
A sudden drop of solar radiation is visible at 1 p.m. This effect also occurred throughout the study period from April to September (data not shown), solar radiation never reached values higher than 500 W/m2 at 1 p.m. Thus, this drop must be an effect of a tree (or group a trees) shading the station at that time.
It is clearly visible from the simultaneous drop in temperature that the temperature reacted immediately to this shading. The amount of solar radiation had a strong and direct effect on the measured near-surface temperatures Tli, and in weaker terms on the air Ta. Intermittent shading at 1 p.m. decreased Ta and Tli by an average of −2.9 K (−2.4 to −3.3 K) and −5.2 K (−3.0 to −8.0 K), respectively. The permanent shading from 3 p.m. had only a weakened and delayed effect on Ta (2 p.m. to 3 p.m., mean: −1.7 K), but a direct and noticeable effect on Tli (2 p.m. to 3 p.m., mean: −7.9 K). Beam radiation led to a direct temperature increase of 6.1/9.2 °C (min/max) from 10 a.m. to 11 a.m. both at 50 cm height and near-surface, but the air warmed distinctly less (2.1–3.5 °C) than Tli (6.2–14.6 °C) in subsequent hour from 11 a.m. to 12 a.m. on all three days. In total, the radiation-induced warming from 10 a.m. to 12 a.m. increased successively during the warm period at Tli, from 13.4 K on day 1 to 23.9 K on day 3.
Compared to the official weather station (DWD, 2 m, open land), the air temperature in the forest was several degrees cooler in times without beam radiation and more uniform in the course of a day. Under beam radiation, air temperatures in the forest were between 6 and 7 K higher than at the DWD station all three days. The surface-near temperature (MS_Tli) reached higher temperatures than the DWD station only under direct beam radiation, an effect which increased during the three days (12 a.m.: +4.7/6.8/13.1 K). This steady increase, which was not observed in the air (MS_Ta), is probably due to other environmental factors such as humidity (data not shown). Over the three days, soil moisture content at 5 cm depth decreased from 28% to 24% water content (m3/m3); relative humidity decreased from max/min = 100/94%, 100/73% to 97/53%. The data suggest that the decrease in ambient moisture during the sunny period amplified the heating near the soil surface. More detailed investigations of this are not part of this study.
In summary, the results indicated that
- at night and at low irradiation, the near-surface temperature was quite similar to the soil conditions (−5 cm);
- for diffuse radiation, the course of the near-surface temperature ranged between soil and air conditions (both in terms of time and value);
- beam solar radiation exerted a direct and strong influence on near-surface temperatures;
- and that the magnitude of warming increased as moisture content (soil moisture and relative humidity) decreased, though this needs to be examined in more detail in future.
Due to the strong and direct influence of the beam solar radiation on near-surface temperatures, the greatest differences between all spots are to be expected on clear days at daytime. The thermal comparison of the different spots in the following section was therefore carried out using clear days with high radiation.
3.4. Diurnal Thermal Patterns and Comparison of Near-Surface Temperatures
On the one hand, the greatest thermal differences between the microhabitats in the forest are to be expected during clear days (Section 3.3), although the analyses also showed that under these conditions S1 and S2 diverge most clearly (Section 3.2). Consequently, the following analyses are separated by Micro-Logger system.
The graphs of Figure 5a show the temperature curves of all Micro-Loggers on an intensive radiation day in July 2014. By showing the temperature course of the “open-land” ML-6 (S1, all-day insolation), the shading and associated temperature drop in the other ML becomes clearly visible in both graphs of Figure 5a,b. Beam radiation versus shading and associated temperature reactions differed considerably between sites in terms of time, duration, and effect size. Peak time differed between spots from 8 a.m. to 2 p.m., even two strong and/or several weaker peaks occurred at some spots.
Overall, a pronounced warming occurred only from 8 a.m. (S1) or 9 a.m. (S2) (except “open-land”: from 5 a.m.), indicating that the trees intercepted the radiation of the oblique sun to a large extent beforehand, and that radiation could penetrate to the forest floor especially when the sun reached higher elevations. All Micro-Loggers showed a strong temperature decrease from about 14 p.m. (S2) and 15 p.m. (S1), while the curve of the “open-land” reached nighttime values only from 20 p.m. onwards.
Noticeably high temperatures were recorded by ML-9, placed under moss at “small clearance” (1 a.m. = 54.8 °C, 3 a.m. = 51.4 °C). Since this was the external sensor system (S2), casing-related overheating is very unlikely; it can be assumed that these extreme temperatures actually occurred in this microhabitat.
As expected, temperature remained significantly cooler at sites with pronounced canopy shading ((a): ML-2, (b): ML-10) compared to more open sites. Temperature differences between ML reached up to 19.7 K (S1) and 19.5 K (36.2 K for ML-9) (S2), respectively. The two shaded ML also showed effects of direct beam radiation by temperature increases of max 5.2 °C (ML-2, S1) and 13 °C (ML-10, S2). The difference in increase is expected to be related mainly due to the different systems (the external sensor detected the radiative flux at the moss surface and associated temperature increase better) or probably differences in moisture (not recorded), since both sensors were placed in the same medium (moss).
Interestingly, at some spots temperatures were temporarily higher than at “open-land”, despite the shortened time of beam radiation. If this effect was attributed to the different types of vegetation cover, the following statements can be made: the dense grass of the meadow or large clearing (ML-6, ML-1) would have buffered beam radiation better (=lower maximum temperatures) than the herbaceous vegetation along the path (ML-5) or the (thin) beech leaf litter (ML-4) (Figure 5a). High peaks occurred in moss despite generally high shading (ML-10) and reached extremely high values of 54.8 °C at 1 p.m. and 51.4 °C at 3 p.m. in moss at “small clearance” (ML-9). Both were external sensor systems (S2), the high values thus reliable.
The comparison of the internal (S1, Figure 5a) and external (S2, Figure 5b) sensor system at “wide clearing” (ML-1,7, red lines) is in line with the results from Section 3.2: ML-7 recorded warmer temperatures than the internal sensor system ML-1, and detected the short phase of shading (due to vegetation) around 11 a.m., while ML-1 did not respond to the changes.
In contrast to the clear day, different spots showed much smaller temperature differences under full cloud cover (Figure 5b). This applied not only to the comparison of the ML, but also to soil, near-surface and air temperatures measured at meteorological stations (DWD, MS, SS). At “open-land” (ML-6) as well as at “wide clearing” (ML-7) and “small clearing” (ML-9), respectively, recorded temperatures were slightly warmer than the rest. This effect possibly occurred as a combination of a higher input of diffuse radiation on the clearings with more sensitive measurements (S2, external sensor), but this cannot be verified further.
The effects and observations described above also appeared in the daily course of the monthly mean (Figure 6). As averages of clear and cloudy days, however, values and deviations were smaller compared to a single clear day (compare Figure 5a). It is noticeable that intradifferences between the MLs and interdifferences to air and soil temperatures were more pronounced in June (early summer) than in August (mid-summer). According to results in Section 3.1., the two months differed considerably from long-term averages—while June was significantly warmer and sunny, the weather in August was exceptionally cool and wet.
Both the daily course of a single day and the monthly means reveal that the greatest difference between the sites existed on days (or month) with high radiation input, but that the thermal conditions largely converged at night or under cloudy and rainy weather conditions. In the following section, the individual spots are evaluated with respect to the nearby weather station.
3.5. Thermal Aspects Across Measurement Devices
3.5.1. Thermal Comparison of Sites (Hourly Mean Values)
Descriptive statistics of the near-surface and air temperature measures at the stations are given in Table 3. The situation at the forest floor, averaged over the entire period, was almost equal to the DWD station (12.5 °C vs. 12.4 °C), slightly warmer in the cooler months and slightly cooler in the warmer months of June and July. The air at 50 cm height in the forest was always cooler than the DWD, on average. However, larger thermal differences occurred between near-surface spots, especially in warm and dry summer months (June: Δmean 4.5 K) compared to cool and rainy weather (August: Δmean 1.7 K).
The largest intravariance (ML) as well as intervariance (ML vs. DWD/MS/SS) was found in the maximum values. In summer during warm periods, maxima differed between shaded spots and clearings/open-land between 20.2 and 24.1 K (shaded) and over 50 K (open). Maximum temperatures measured in 50 cm were more similar to the shaded spots.
Boxplots are useful to provide a comparative overview of the data distribution of the sites over the study period from Apr to Sep. As expected from the previous sections, site-specific differences were on average much smaller when comparing all data (day and night) or only nighttime data than during the day (Figure A1). As this study is particularly interested in differences, site-specific distributions of daytime data are shown for the spring (Apr), early summer (Jun) and mid-summer (Aug) situation (Figure 7).
The individual loggers are ordered according to their qualitative degree of shading, from very shaded (left, ML-2) to open-land (center, ML-6), followed by air temperatures (Ta), and finally soil temperatures (Ts). The coloration of the individual boxplots primarily reflects their degree of shading, from dark green (heavily shaded) to yellow (open-land). At the same time, the color serves to provide information about the type of organic matter in which the Micro-Loggers were embedded.
The coolest temperatures and smallest variance were recorded in the forest soil (MS_Ts/SS_Ts), as well as near-surface in moss under a large, spreading silver fir (ML-2, “tree shadow”) and in a dense “spruce woodland” (ML-10). By arranging the logger spots according to their subjective degree of shading (from left to right: very shady to full sun), the influence of shading on both mean and maximum values becomes visible. With decreasing shading, both higher median and maximum values occurred.
The similarity of the measurement sites was investigated using the Spearman correlation (see Figure A2). As expected, the highest similarity of the official weather station (air, Ta) was with air measurements in the forest (MS_Ta: 0.94, SS_Ta: 0.91), and was significantly lower for measurements near the ground (ML: 0.78–0.88). The two stations MS and SS, both located at “small clearing”, possessed the greatest similarity (Ta: 0.98, Ts: 0.97).
The intracorrelation between the Micro-Loggers reached values from 0.84 to 0.98, with only the two shadowed loggers ML-2 and ML-10 reaching values of < 0.90 compared to the other spots, the others were >0.91. The shadowed loggers were more similar to each other (0.96), as well as ML-2 (“tree shadow”) with the ground temperatures of the nearby Medium and Small stations (0.94 and 0.92, respectively). In general, however, the scatterplots (Figure A2, upper triangle) also show that the pairs of values differed considerably between the sites (wide scattering) and some pairs showed consistent temperature differences (“belly” to lower or higher values).
3.5.2. Thermal Comparison of Sites (Daily Mean Values)
Time averaging of data allows easier comparisons and generally leads to smaller differences, but is always associated with a loss of information.
The repeated correlation analysis according to Spearman proves the latter (Figure A3). The similarity between sites has increased across all measurement sites and systems (ML, DWD, MS and SS). The intra-logger correlation (ML-1 to ML-10) is now 0.91–0.99, the air temperatures (Ta) reach even higher similarity values between the three stations (0.98 to 1). The correlation of Ta measured at DWD and the Micro-Loggers resulted in values between 0.91 and 0.95. Soil measurements in the forest (MS_Ts, SS_Ts) were very similar to each other (0.99) and partly very similar to the shaded Micro-Loggers ML-2 and ML-10 (0.96, 0.98), but more different to the air values (Ta/Ts: 0.80 to 0.88) and the other Micro-Loggers (0.81–0.93). Especially the view on the scatterplots (App. B2, upper triangle) shows their similarity due to the clearly more linear structure of the measurement pairs; only the soil showed a higher scatter. The correlation results indicate that the daily mean values had a very similar course across sites and systems during the measuring period.
Regressions between mean daily air temperature measured at the nearby DWD station with Ta of the forest stations (MS, SS) and two shaded (ML-2, ML-10) as well as two open sites (ML-6 “Open land” and ML-7 “Wide clearing”) reveal the effects of medium (air versus organically bound) and degree of shading (Table 4).
As expected, the greatest similarity in the daily means was between the air temperature in the forest and the DWD station (MS, SS: R2: 0.98) (Table 4, top). The lowest similarity was found for particularly sun-exposed (ML-6, “open-land”, R2: 0.84) or particularly shaded (ML-2, “tree-shadow”, R2: 0.82) spots.
The “open-land” spot was more similar to the DWD ground measurement (−5 cm), which can be explained by the similar conditions of beam and diffuse solar radiation during the day. It is remarkable that all spots were warmer on average than the DWD station (b > 0), especially at cooler temperatures, but this effect decreased with increasing temperatures (a < 1) or even reversed at higher temperatures (visible in the scatterplots, Figure A3).
3.5.3. Comparison of the Temperature Sums of the Measurement Sites
A final analysis is based on temperature sums (Tsum) of the different measurement sites, comparing
- different media (air, soil, near-surface/organic bound);
- different measurement setups (Micro-Logger, forest stations (MS,SS), official weather stations (DWD));
- other official weather stations located at lower altitudes (m a.s.l.).
In contrast to mean values and differences, temperature totals reflect the development over time and are more meaningful for assessing the situation from the perspective of biological processes. Figure 8 is structured in three graphs, which are intended to illustrate the main findings.Strongly striking is the large thermic difference between soil temperatures at 5 cm depth between forest and open land (DWD) stations, describing the temperature extremes in comparison with all other sites and media. Hence, the well-known mitigating effect of the forest definitely applied to soil temperatures. In total, soil temperatures of the DWD station (down to a depth of 20 cm) achieved remarkably higher sums at all times compared to the other areas, only the ML “open-land” was close (comparable radiation situation outside the forest).
The air measures of the DWD station resulted in considerably higher values than soil and air measures in the forest (Figure 8a) and was in the medium to upper range compared to the conditions on the forest floor (ML) (Figure 8b). This is consistent with results from the last sections.
Warmer than the air measures of the DWD were, beside “open-land”, the Micro-Loggers at the clearings, which can partly be attributed to the more sensible measuring system (S2, ML-7 and ML-9). The latter was indicated in comparison of ML-1 and ML-7, which were both operated at the same spot “wide clearing” but show differing temperature sums, especially along the summer month (Figure 8b). The shaded spots (ML-2, ML-10) remained near as cool as the soil temperature in the forest (SS_Ts).
A new aspect is given by including air temperature data from additional official weather stations. Those data are widely used in ecological analyses, which is why the comparison of the thermal situation of one forest with different DWD stations offers particularly interesting insights. The warmest surface sites in the forest (ML-7, ML-9, both external sensor) were comparable to a DWD station located at 685 m a.s.l., i.e., about 300 m lower than the original study site. The surface measures at a nearby meadow (ML-6, open-land) resulted in a Tsum value ranging between DWD stations located 480 and 580 m a.s.l., i.e., about 450 m lower.
In summary, the largest thermal differences were observed in the soil at 5 cm depth, which was fully radiated outside the forest, but shaded by the canopy inside the forest. This cooling effect of shading resulted in comparably cool conditions in the soil and near surface, but only at highly shaded sites. In contrast, the warmest near-surface sites inside the forest were comparable with a DWD station located 300 m lower. The near-surface conditions at the open land (the standard situation of a DWD station) were comparable to DWD stations located about 450 m lower.
4. Discussion
The results of our microclimatic measurement concept support and extend previous studies indicating the strong differences between official weather data and conditions within a forest [20,48] or mapped the diversity of thermal conditions on the forest floor and related them to large-scale climate data [14,17,49]. By using Micro-Loggers at the soil surface as well as weather stations in the forest as a link to the nearby official weather station, the diverse thermal characteristics of different microhabitats could be depicted and compared on a fine granular scale. In addition, the formative influence of the change of shading and solar radiation in the forest could be shown.
In the following, insights into the measurement concept, implications of the results, and their significance for future research in forest floor microclimate are discussed.
4.1. A Concept to Explore the Thermal Microcosms at the Forest Floor
This study presents a case study in which the meteorologically rarely analyzed domain of the lowest organic layer, between the ground surface and the radiative transfer surface, was investigated. By choosing a study area with largely constant altitude and flat topography, respectively, thermal differences caused by topographical aspects and latitude were minimized [17,19,21,30,50,51,52]. Thermal differences should therefore be mainly due to canopy cover, and to a lesser extent due to differences in ground vegetation or soil moisture [6,21,22,51,53,54].
Since the largest range in temperatures is expected in summer compared to the other seasons [55], it can be assumed that the maximum differences between the sites could be mapped during the study period from April (spring) to September (fall). The midsummer of 2014 did not offer any extreme weather conditions (heat and drought), so that the conditions can be regarded as rather moderate. It can be concluded from this that the temperature maxima and mean values will certainly reach even higher values in extremely hot summers.
The meteorological stations Medium and Small Station served as reference stations between the official weather station “Klippeneck” outside the forest (Ta in +2 m, Ts) and the near-surface measurements (ML in +0–2 cm). By air (Ta in +50 cm), soil (Ts in −5 cm) and near surface (Tli in 0–2 cm) measurements they built the link to both measurement extremes. The Medium Station also recorded solar radiation, so that the influence of radiation on Ta, Ts and near surface was captured. Medium Station was located in a small clearing and surrounded by tall, old conifers (Figure 1d and Figure 2b). Recordings showed that already diffuse radiation (low solrad values) and/or rising air temperatures outside the forest caused a certain temperature rise in the morning, but only beam radiation resulted in strong temperature rises, which in turn led to a drop in temperature directly during temporary shading. The results are in line with previous studies showing the high importance of insolation for forests ground-near temperature but also the modifying influence of shading by vegetation [17,18,21,56].
It was found that the external sensor system (S2) responded more strongly and quickly to higher energy input (day) or output (night) and changing (air) temperatures within the microhabitat. The heating of the internal sensor system (S1), on the other hand, is mediated by the contact of the casing with the organics and soil, and thus reflects—temporally slightly delayed—an average value of the microhabitat. At “wide clearing”, both systems were operated over the entire measurement period giving an impression of the variation from spring to fall. Due to the increased solar radiation in summer, larger differences would be expected—however, data did not reflect this. This is most likely due to the unusual cool, cloudy and rainy conditions in July and especially August.
By chance, a source of measurement error in the internal sensor system was also identified. In June, S1 suddenly recorded much higher temperatures than the external system until the end of June. This phenomenon occurred exactly between the two readout dates (6.6. and 27.6.2014). Since the S1 sensor is connected to the casing via a heat-conducting paste, overheating occurred very likely due direct illumination. This indicates that the casing of ML-1 was no longer fully covered by the grass. It can be concluded from this that protection from direct sunlight is particularly relevant for the internal sensor system in order to exclude measurement type errors.
The measurement concept using only temperature loggers allows the investigation of the thermal variability on the forest floor—specifically within the organic matter, placed on the soil and near its surface to the air. However, without the additional measurements of solar radiation and other parameters at a station on a clearing, the strong temporary influence of beam radiation on the local near-surface temperature—as well as the cooling effect of shading by surrounding trees—could not have been clearly demonstrated. A factor that has not been investigated in detail is the effect of the near-surface moisture content. It can be assumed that the heating of the vegetation near the ground or the upper soil layer is influenced by an interplay of improved heat conduction but simultaneous evaporation or latent heat fluxes at moist sites versus dry sites [22]—but this was not investigated in detail. By choosing different media (grass, moss, beech leaves), differences in heating between the media could be illustrated, but these can only be sufficiently validated by more detailed surveys.
4.2. The Interplay of Direct Sunlight, Canopy Cover and Ground Vegetation
Results indicate that beam radiation was the main driver of large temperature increases (and decreases during tree shading) in the forest during the day, especially for near-surface and somewhat less for air temperature at 50 cm height, but only marginal for soil temperatures in 5 cm depth. Near-surface temperatures could reach higher maximum values than air temperatures within the forest when exposed to beam radiation even for a short time; at night, thermal conditions equaled the soil conditions.
Consistent with previous described solar radiation observations, thermal variability on the forest floor was most pronounced on clear days, in the middle of the day when the sun was highest (10 a.m. to 4 p.m.) and in warm and dry summer months, respectively [57]. On a clear day, differences in near-surface temperature of up to 20 K were detected between heavily shaded areas (forest) and open areas (clearing) for both systems (S1/2). These values are well above the maximum differences previously recorded between air-only temperature measurements (e.g., 2 m, 2.7 K [9]) or soil measurements (e.g., −5 cm, 5.9 K [9]) in the forest and open-land sites.
Near-surface temperature followed a systematic diurnal pattern, as a consequence of the interplay of canopy shading and direct beam radiation during the day. Time of peaks and extent was dependent on month (solar angle), weather (cloudiness) and of course vegetation characteristics and gap size influencing ground shading during the day—in line with previous studies on factors influencing forest microclimate. Thus, the sites differed markedly in times (between 10 a.m. to 4 p.m.) and extent of peak temperatures during the day. Such large differences were not necessarily observed; e.g., near-surface recordings at harvested versus control sites showed only temporally limited temperature differences (afternoon) with maximum differences of only 3.9 K [55]. As expected, due to the lower or missing irradiation, thermal variability and maxima values were considerably lower on cloudy days and at night, which was also described in former studies [30,56,58]
It was striking that not the “open-land” site on a meadow recorded the highest temperatures (even when only looking at S1-type loggers), but sites experiencing only a few hours of beam radiation. One difference was the medium in which the loggers were embedded. Grass (or the air cushion underneath it, respectively) seems to be a better insulator than directly exposed moss. The results indicate that moss provides comparatively cool conditions in places without direct sunlight, but heats up rapidly when exposed to beam radiation (ML-10/S2: around 13 °C). Extremely high temperatures (13:00 = 54.8 °C, 15:00 = 51.4 °C) were recorded on a clear day in July by ML-9, an external-logger system (S2) placed within moss at the “small clearing” near the medium station. Since the sensor was not bound to the casing, artificial overheating was very unlikely, these temperature extremes thus seem to have actually occurred. These results support existing knowledge that plants influence the microclimate of their immediate environment in a species-specific manner and can be largely decoupled from air temperatures [5,29].
The moss at ML-9 experienced more irradiation than the other moss-bound loggers (ML-2, ML-10) and the moss was occasionally dry during the summer. One possible explanation for the extreme temperatures is the absence of latent heat fluxes and the poor thermal conductivity of the medium, so that the absorbed radiation was largely converted into heat. Such effects occur, for example, in the insulation of houses, which, due to their poor thermal conductivity, reduce the heating of the building behind them, but reach high temperatures at the radiation conversion surface [38]. Thus, a plant seed located close to the moss surface (more mobile species may retreat to cooler microhabitats) is temporarily exposed to extremely high temperatures, which could adversely affect germination. Tree seedlings are much more sensitive and their survival depends strongly on the ground-near microclimate [23]; however, possible effects depend on the specific physiology of the plant and are therefore to be interpreted species-specifically [15,59].
At Medium Station, high radiation (600–800 W/m2) occurred only from 11 a.m. to 2 p.m. during the entire study period; the energy input of diffuse radiation before and after that was < 100 W/m2, even in midsummer. Results are comparable to measurements on solar radiation input conducted in an 70-yr old Douglas-fir forest [60]. It is likely that the large conifers surrounding the clearing blocked the solar radiation (diffuse and direct) until the sun reached near its highest point. The latter is supported by studies of Hutchison and Matt (1977), who showed that in summer in dense, understory-rich forests only a small fraction of diffuse but also beam radiation reaches the ground, but that the variability and maximum values of solar radiation are greatest around midday due to unimpeded beam radiation [40].
In combination with temperature recordings, results from MS clearly showed the effect of unimpeded beam radiation on the resulting temperature rise on the forest floor (near-surface > Ta >> Ts). Of course, solar radiation is expected to be the main driver for thermal differences on clear days and the ability of trees or, in urban areas, anthropogenic infrastructure to block or impede incoming radiation is mandatory for creating cooler spots on the ground [2].
The influence of the weather on the thermal variability of the microsites became evident due to the particular weather conditions in the summer of 2014. The mean diurnal variation of temperatures in June (sunny, warm and dry) showed a distinct difference in the mean thermal situation (5–10 °C) between the spots during the day, while in August the thermal situation (often cloudy, unusually cool and rainy) varied much more weakly, also considerably lower maximum temperatures were obtained in August compared to June (compare Figure 7). The results are in agreement with, e.g., model results from Central Sweden, where solar radiation was found to significantly increase maximum temperatures only in months with many clear days, not in months with high cloud cover [19].
4.3. The Thermal Range of Conditions at the Forest Floor
The measurements taken to identify thermal differences on the forest floor revealed a broad range of thermal conditions and complex interactions of seasonal, weather and vegetation aspects.
Looking only at the near-surface conditions, the heavily shaded areas in the forest were considerably cooler on average and with respect to maximum values than the forest clearings or the open-land site. The largest differences existed in maximum values, but were also evident in the monthly means. In warm and sunny months (Jun, Jul), differences between the highly shaded and warmest sites were about 3 K (ΔTmax: 4.5°) and about 30 K in the maximum. The highest surface temperature was recorded on a clear summer day at the “small clearing” under moss: 54.8 °C.
Thus, results of the present study show that the well-known buffering effect of forests no longer applies to the forest floor as soon as beam radiation is included. Once radiation passes directly through the canopy and reaches the forest floor unimpeded, the temperature increased sharply, which also depends on the thermal properties of the ground cover (reflection vs. absorption and resulting sensible heat flows) and the moisture content (latent heat flows) [6,21]. Direct radiation is inhibited by abundant understory, but is more intense in woodlands without any understory. In a dense spruce stand without ground-near vegetation, an unexpectedly high temperature increase occurred between two measurements occasions (13 °C, ML-10)—while branches of a large conifer reaching near the ground buffered radiation much better (5 °C, ML-2). This difference between the spots, however, may be partly due to the different sensor type. Conclusively, future studies should more precisely examine the effect of the proximity of foliaged branches on ground temperature and moisture development to more accurately assess the suitability of particular forest structures for providing cooler microrefugia.
The Medium Station in the forest allowed comparisons between the media. At night, the near-surface temperature was comparable to the soil conditions (−5 cm). Under diffuse radiation at day, the course of the near-surface temperature ranged between soil and air conditions (both in terms of time and value). Beam solar radiation exerted a direct and strong influence on near-surface temperatures and, to a lesser extent, air temperature (50 cm). Additional moisture measures indicated that the magnitude of warming increased as moisture content (soil moisture and relative humidity) decreased. However, previous findings indicate that moisture can have opposite effects depending on canopy cover [61], so that the results from the MS station are not discussed in further detail. Maximum temperatures measured at a harvested lot in Massachusetts (MAS) and at the Medium Station (MS) on July 18 were very similar [55]. Soil values were lowest (MAS/MS: 27.6 °C/20.52 °C), followed by air temperature (MAS/MS: 36.6 °C/34.8 °C), and warmest was the near-surface spot (MAS/MS: 42.5 °C/41.2 °C). The comparatively large difference between the ground temperatures could be due to the long shading in MS (beam sun duration max 4 hr/day at MS), compared to the harvested lot of MAS.
Data from the nearby official weather station (DWD) were compared with forest data measured in the air (50 cm), the soil (−5 cm) and within the organic layer on top of the soil surface (ML, 2–3 cm). Of all measurement spots, soil temperatures differed the most on average inside and outside the forest. At the DWD station, soil temperatures reached higher averages and distinctively higher maximum values than air temperature measured at 2 m height. The latter is consistent with findings from a study comparing soil temperatures in a forest before (cooler) and after (warmer) thinning [54]. The cooling effect of canopy shading resulted in comparably cool conditions in the forest soil and also at the surface (ML), but only at highly shaded sites. Under beam radiation, the surface temperature reached considerably higher temperatures than would be expected from data of the nearby official weather station.
Looking at the accumulated temperature, the nearby DWD station was comparable to the thermal situation at the clearances (“wide” and “small”) in the forest, i.e., moderate to warm aspects of the within-site range. The warmest Micro-Loggers inside the forest (external sensor system) were comparable with a DWD station located 300 m lower. The near-surface conditions at the open-land (the standard situation of a DWD station) were comparable to DWD stations located about 450 m lower. Due to a lack of comparable DWD stations for the coolest sites, no comparisons to higher elevated DWD stations were possible. Nevertheless, these results suggest that the within-site thermal variation could be even larger than previously described [17]. Based on three surface loggers, Graae et al. (2012) described a thermal within-site variation comparable to a 300 m change in altitude—a temperature difference that was determined in this study by considering only the warmest location compared to local DWD station without considering the coldest sites.
4.4. Accounting for Methodological Aspects
The temporal averaging of the data reduces existing differences severely. In average over the entire measurement period (Apr–Sep 2014), the intradifferences of the near-surface spots were at maximum 2.8 K (11.4–14.2 °C) and very close to the official weather station DWD (12.4 vs. 12.5 °C, respectively). Air temperatures in the forest (Ta, 50 cm) were only slightly cooler than DWD (MS/SS: 12.2/11.6). Equally low Ta differences between comparison sites (cut vs. uncut) were found in a mixed forest in Massachusetts over 12 years (typically < 1 K), where soil and near-surface values differed more (cut vs. uncut) compared to air temperature [55]. This fits with our observations. At MS, the near-surface and soil temperatures were slightly warmer on average (Apr to Sep) than the air temperature of the site (Tli: 12.8 °C, Ts: 12.4, Ta:12.2 °C), with the night hours being the main factor for the comparatively high soil average. The minimum temperatures were close to each other (Δmax = 5 K), while the maximum values differed significantly from ground to air to near surface (max = 20.4 °C/34.8 °C/42.5 °C; Δmax = 22.1 K). The latter is consistent with findings from comparisons of cut versus uncut sites, where recorded differences were largest in maximum values [62].
In general, forests are expected to provide moderate conditions in terms of temperature, humidity, and wind compared to open land, which is mainly attributed to the protective effect of the canopy [2,35,36,37,61]. Accordingly, air temperature is cooler and more balanced (lower max, higher min) in the forest than in the open [30,31,36,54], especially in dense stands where the main radiative turnover takes place at the canopy. The latter could be confirmed for the air temperatures measured within the forest (MS/SS) compared to the DWD station (2 m) outside on average, but not with regard to the maximum values.
As described above, research also addresses the question to what extent the within-site thermal variability in forests may already exceed the expected warming due to climate change. In the long term or averaged over larger areas, modeling results implicated that the microrefugia provided by forests at present exceed other aspects leading to the conclusions that forests can buffer the expected changes due to climate change to a certain extent [17,49]. However, it has to be considered additionally, that averaged observations (e.g., 2 °C global warming) do not reflect local extremes—neither in the mean nor in the maximum [63,64] and that long dry phases can intensify the temperature extremes on the forest floor by lacking evaporative cooling [39].
However, with respect to cool, heavily shaded sites—which are considered refuges for heat-sensitive species—the data from our study clearly showed the importance of closed tree canopies and/or dense undergrowth in reducing radiation exposure to the soil surface and lowest organic layer, respectively. Therefore, natural and anthropogenic disturbances (e.g., forest management) that reduce canopy cover are to be critically evaluated regarding the ability of the forest to modulate the local microclimate. In addition, the buffering effect in this study can be attributed solely to effects of canopy, since the study area was widely flat. In areas where effects of topography are added, even stronger local thermal variations are to be expected [14].
The studied region in SW Germany was characterized by warm, rainy summers with rare periods of intense heat and drought during the last century. In the last decade, years with unusually hot and dry summers occurred more frequently, breaking temperature records of the last 100 years. Climate change models predict that summer heat and long dry spells will replace the previous normal [65]. Combined with the findings of the presented study, this suggests that thermal conditions on the forest floor will differentiate more significantly in future than has been the case in the past. Since thermal conditions on the forest floor are a major determinant for many organisms [13,20,23], including plant pests and disease vectors [22,66,67], corresponding changes in species composition and abundances are to be expected.
5. Conclusions
The conclusions refer mainly to the radiation absorbing medium near the ground (i.e., moss or grass), not solely to factors normally considered such as air and soil temperatures. The results indicate that beam radiation and the associated heating can cause temperatures above 50 °C near the forest surface, depending on the medium in which the logger was embedded. Such high temperatures raise the question of how ground-based organisms and tree seedlings cope, especially in the future, when summer drought further increases the conversion of radiant energy into heat (rather than evaporation). Only the soil temperatures in the forest (and shaded spots) were constantly and considerably cooler than in the field, while near-surface temperatures varied strongly between shaded and open spots. Thus, data from official weather stations may represent average conditions in the forest, but considerably lack maximum and minimum aspects. Since the study area was widely flat, even higher thermal variations are expected under more complex topographic conditions. Furthermore, the results show the importance of old and dense stands for maintaining cool microrefugia, which is particularly important with regard to future extreme weather events and forest management practices. In addition, results demonstrate the need for microclimatic measurements that reflect conditions in specific microhabitats in a more differentiated way to allow for better understanding and prediction.
Funding
The measurements were conducted during a project that was funded by the Ministry of the Environment, Climate Protection and the Energy Sector and its program BWPLUS, grant numbers BWZ 11001, 11005, 11006 and 11007 and by the Graduate School for Climate and Environment of the Karlsruhe Institute for Technology. I acknowledge support by the KIT-Publication Fund of the Karlsruhe Institute of Technology.
Institutional Review Board Statement
Not applicable.
Informed Consent Statement
Not applicable.
Data Availability Statement
Not applicable.
Acknowledgments
I am very grateful to Reiner Gebhardt for his technical assistance through microclimatic measurements and to Stefan Norra for his constant support.
Conflicts of Interest
The author declares no conflict of interest.
Appendix A
Figure A1.
Overview of the data distribution of all Micro-Loggers (ML1 to 10), the air and soil temperature of the Medium and Small Stations and the official weather station (DWD). The colors imply the grade of shading of the loggers and stations (dark green = very shaded/moss, yellow = open land/grass, beige = temporal shading/grass (ML-9 = moss), light green = temporal shading/leaf litter). The graph shows the data distribution of the total timespan (top), only at daytime (middle) and only nighttime (bottom). The ordinate depicts the temperature (°C), please note the different scales.

Appendix B
Figure A2.
Spearman correlation matrix of daily temperature averages including the surface-near measurements of the Micro-Logger (ML1 to ML10) and Medium Station (Tl), air temperature (Ta) of the Medium and Small Stations at “small clearing” and the official weather station (DWD) as well as soil temperature (Ts) in 5 cm depth. The lower triangle shows the coefficient of determination (R2), the upper triangle the scatterplots and linear regression fit lines (red) and the diagonal the histograms.

Figure A3.
Spearman correlation matrix of hourly temperature averages (MS, SS, DWD) and single records (ML), respectively, including the surface-near measurements of the Micro-Logger (ML1 to ML10) and Medium Station (Tl), air temperature (Ta) of the Medium and Small Stations at “small clearing” and the official weather station (DWD) as well as soil temperature (Ts) in 5 cm depth. The lower triangle shows the coefficient of determination (R2), the upper triangle the scatterplots and linear regression fit lines (red) and the diagonal the histograms.

References
- Luo, X.; Vahmani, P.; Hong, T.; Jones, A. City-Scale Building Anthropogenic Heating during Heat Waves. Atmosphere 2020, 11, 1206. [Google Scholar] [CrossRef]
- Lee, I.; Voogt, J.; Gillespie, T. Analysis and Comparison of Shading Strategies to Increase Human Thermal Comfort in Urban Areas. Atmosphere 2018, 9, 91. [Google Scholar] [CrossRef] [Green Version]
- Bowler, D.E.; Buyung-Ali, L.; Knight, T.M.; Pullin, A.S. Urban greening to cool towns and cities: A systematic review of the empirical evidence. Landsc. Urban Plan. 2010, 97, 147–155. [Google Scholar] [CrossRef]
- Zhou, W.; Cao, F.; Wang, G. Effects of Spatial Pattern of Forest Vegetation on Urban Cooling in a Compact Megacity. Forests 2019, 10, 282. [Google Scholar] [CrossRef] [Green Version]
- Otto, H.-J. Waldökologie; Eugen Ulmer Verlag: Stuttgart, Germany, 1994. [Google Scholar]
- Aussenac, G. Interactions between forest stands and microclimate: Ecophysiological aspects and consequences for silviculture. Ann. For. Sci. 2000, 57, 287–301. [Google Scholar] [CrossRef]
- Bolte, A.; Ammer, C.; Löf, M.; Madsen, P.; Nabuurs, G.-J.; Schall, P.; Spathelf, P.; Rock, J. Adaptive forest management in central Europe: Climate change impacts, strategies and integrative concept. Scand. J. For. Res. 2009, 24, 473–482. [Google Scholar] [CrossRef]
- Matusick, G.; Ruthrof, K.X.; Brouwers, N.C.; Dell, B.; Hardy, G.S.J. Sudden forest canopy collapse corresponding with extreme drought and heat in a mediterranean-type eucalypt forest in southwestern Australia. Eur. J. For. Res. 2013, 132, 497–510. [Google Scholar] [CrossRef] [Green Version]
- Merlin, M.; Perot, T.; Perret, S.; Korboulewsky, N.; Vallet, P. Effects of stand composition and tree size on resistance and resilience to drought in sessile oak and Scots pine. For. Ecol. Manag. 2015, 339, 22–33. [Google Scholar] [CrossRef] [Green Version]
- Williams, A.P.; Allen, C.D.; Macalady, A.K.; Griffin, D.; Woodhouse, C.A.; Meko, D.M.; Swetnam, T.W.; Rauscher, S.A.; Seager, R.; Grissino-Mayer, H.D.; et al. Temperature as a potent driver of regional forest drought stress and tree mortality. Nat. Clim. Chang. 2013, 3, 292–297. [Google Scholar] [CrossRef]
- Saccone, P.; Delzon, S.; Pagès, J.-P.; Brun, J.-J.; Michalet, R. The role of biotic interactions in altering tree seedling responses to an extreme climatic event. J. Veg. Sci. 2009, 20, 403–414. [Google Scholar] [CrossRef]
- De Rigo, D.; Libertà, G.; Durrant, T.H. Forest fire Danger Extremes in Europe Under Climate Change: Variability and Uncertainty: JRC Technical Reports, hal-02906196; Publications Office of the European Union: Luxembourg, 2017. [Google Scholar]
- De Frenne, P.; Rodríguez-Sánchez, F.; Coomes, D.A.; Baeten, L.; Verstraeten, G.; Vellend, M.; Bernhardt-Römermann, M.; Brown, C.D.; Brunet, J.; Cornelis, J.; et al. Microclimate moderates plant responses to macroclimate warming. Proc. Natl. Acad. Sci. USA 2013, 110, 18561–18565. [Google Scholar] [CrossRef] [PubMed] [Green Version]
- Lenoir, J.; Hattab, T.; Pierre, G. Climatic microrefugia under anthropogenic climate change: Implications for species redistribution. Ecography 2017, 40, 253–266. [Google Scholar] [CrossRef]
- Hylander, K.; Ehrlén, J.; Luoto, M.; Meineri, E. Microrefugia: Not for everyone. Ambio 2015, 44, 60–68. [Google Scholar] [CrossRef] [PubMed] [Green Version]
- Ashcroft, M.B.; Gollan, J.R. Moisture, thermal inertia, and the spatial distributions of near-surface soil and air temperatures: Understanding factors that promote microrefugia. Agric. For. Meteorol. 2013, 176, 77–89. [Google Scholar] [CrossRef] [Green Version]
- Graae, B.J.; De Frenne, P.; Kolb, A.; Brunet, J.; Chabrerie, O.; Verheyen, K.; Pepin, N.; Heinken, T.; Zobel, M.; Shevtsova, A.; et al. On the use of weather data in ecological studies along altitudinal and latitudinal gradients. Oikos 2011, 121, 3–19. [Google Scholar] [CrossRef]
- Greiser, C.; Meineri, E.; Luoto, M.; Ehrlén, J.; Hylander, K. Monthly microclimate models in a managed boreal forest landscape. Agric. For. Meteorol. 2018, 250-251, 147–158. [Google Scholar] [CrossRef]
- Vanwalleghem, T.; Meentemeyer, R.K. Predicting Forest Microclimate in Heterogeneous Landscapes. Ecosystems 2009, 12, 1158–1172. [Google Scholar] [CrossRef]
- Boehnke, D.; Gebhardt, R.; Petney, T.; Norra, S. On the complexity of measuring forests microclimate and interpreting its relevance in habitat ecology: The example of Ixodes ricinus ticks. Parasit. Vectors 2017, 10, 549. [Google Scholar] [CrossRef] [PubMed] [Green Version]
- Geiger, R.; Aron, R.H.; Todhunter, P. The Climate Near the Ground, 7th ed.; Rowman & Littlefield: Lanham, MD, USA, 2009; ISBN 978-0-7425-6654-5. [Google Scholar]
- Boehnke, D. Habitat Ecology and Microclimatic Influences on the Distribution of Ixodes Ricinus Ticks in Baden-Württemberg. Ph.D. Thesis, Karlsruher Institut für Technologie (KIT), Karlsruhe, Germany, 2016. [Google Scholar]
- Niinemets, Ü. Responses of forest trees to single and multiple environmental stresses from seedlings to mature plants: Past stress history, stress interactions, tolerance and acclimation. For. Ecol. Manag. 2010, 260, 1623–1639. [Google Scholar] [CrossRef]
- Amelung, W.; Blume, H.-P.; Fleige, H.; Horn, R.; Kandeler, E.; Kögel-Knabner, I.; Kretzschmar, R.; Stahr, K.; Wilke, B.-M. Scheffer/Schachtschabel Lehrbuch der Bodenkunde, 17., Überarbeitete und Ergänzte Auflage; Springer Spektrum: Berlin, Germany, 2018; ISBN 978-3662558706. [Google Scholar]
- Ponge, J.-F. Vertical distribution of Collembola (Hexapoda) and their food resources in organic horizons of beech forests. Biol. Fertil. Soils 2000, 32, 508–522. [Google Scholar] [CrossRef] [Green Version]
- Maraun, M.; Salamon, J.-A.; Schneider, K.; Schaefer, M.; Scheu, S. Oribatid mite and collembolan diversity, density and community structure in a moder beech forest (Fagus sylvatica): Effects of mechanical perturbations. Soil Biol. Biochem. 2003, 35, 1387–1394. [Google Scholar] [CrossRef]
- Boehnke, D.; Brugger, K.; Pfäffle, M.; Sebastian, P.; Norra, S.; Petney, T.; Oehme, R.; Littwin, N.; Lebl, K.; Raith, J.; et al. Estimating Ixodes ricinus densities on the landscape scale. Int. J. Health Geogr. 2015, 14, 23. [Google Scholar] [CrossRef] [PubMed] [Green Version]
- Ponge, J.-F. Humus forms in terrestrial ecosystems: A framework to biodiversity. Soil Biol. Biochem. 2003, 35, 935–945. [Google Scholar] [CrossRef] [Green Version]
- Liancourt, P.; Song, X.; Macek, M.; Santrucek, J.; Dolezal, J. Plant’s-eye view of temperature governs elevational distributions. Glob. Chang. Biol. 2020, 26, 4094–4103. [Google Scholar] [CrossRef] [PubMed]
- Holst, T.; Mayer, H.; Schindler, D. Microclimate within beech stands? Part II: Thermal conditions. Eur. J. For. Res. 2004, 123, 13–28. [Google Scholar] [CrossRef]
- Von Arx, G.; Dobbertin, M.; Rebetez, M. Spatio-temporal effects of forest canopy on understory microclimate in a long-term experiment in Switzerland. Agric. For. Meteorol. 2012, 166-167, 144–155. [Google Scholar] [CrossRef]
- Barry, R.G. Mountain Weather and Climate, 2nd ed.; Routledge: London, UK, 1992; ISBN 0-415-07112-7. [Google Scholar]
- Fridley, J.D. Downscaling climate over complex terrain: High finescale (<1000 m) spatial variation of near-ground temperatures in a montane forested landscape (Great Smoky Mountains). J. Appl. Meteorol. Climatol. 2009, 48, 1033–1049. [Google Scholar] [CrossRef] [Green Version]
- Carlson, D.W.; Groot, A. Microclimate of clear-cut, forest interior, and small openings in trembling aspen forest. Agric. For. Meteorol. 1997, 87, 313–329. [Google Scholar] [CrossRef]
- Latif, Z.A.; Blackburn, G.A. The effects of gap size on some microclimate variables during late summer and autumn in a temperate broadleaved deciduous forest. Int. J. Biometeorol. 2009, 54, 119–129. [Google Scholar] [CrossRef]
- Renaud, V.; Innes, J.L.; Dobbertin, M.; Rebetez, M. Comparison between open-site and below-canopy climatic conditions in Switzerland for different types of forests over 10 years (1998–2007). Theor. Appl. Clim. 2010, 105, 119–127. [Google Scholar] [CrossRef] [Green Version]
- Chen, J.; Franklin, J.F.; Spies, T.A. Contrasting microclimates among clearcut, edge, and interior of old-growth Douglas-fir forest. Agric. For. Meteorol. 1993, 63, 219–237. [Google Scholar] [CrossRef]
- Häupl, P.; Höfker, G.; Homann, M.; Kölzow, C.; Maas, A.; Nocke, C.; Riese, O.; Willems, W.M. Lehrbuch der Bauphysik; Springer Fachmedien: Wiesbaden, Germany, 2017; ISBN 978-3-658-16073-9. [Google Scholar]
- Zmarsly, E.; Kuttler, W.; Pethe, H. Meteorologisch-klimatologisches Grundwissen: Eine Einführung mit Übungen, Aufgaben und Lösungen; Ulmer: Stuttgart, Germany, 2007; ISBN 9783825222819. [Google Scholar]
- Hutchison, B.A.; Matt, D.R. The Distribution of Solar Radiation within a Deciduous Forest. Ecol. Monogr. 1977, 47, 185–207. [Google Scholar] [CrossRef]
- German Weather Service (DWD). Niederschlag: Vieljährige Mittelwerte 1981–2010. Available online: https://www.dwd.de/DE/leistungen/klimadatendeutschland/mittelwerte/nieder_8110_akt_html.html?view=nasPublication (accessed on 4 February 2021).
- German Weather Service (DWD). Temperatur: Vieljährige Mittelwerte 1981–2010. Available online: https://www.dwd.de/DE/leistungen/klimadatendeutschland/mittelwerte/temp_8110_akt_html.html?view=nasPublication&nn=16102 (accessed on 4 February 2021).
- Kronthaler, F.; Zöllner, S. Data Analysis with RStudio; Springer: Berlin/Heidelberg, Germany, 2021; ISBN 978-3-662-62517-0. [Google Scholar]
- Hennemuth, B.; Bender, S.; Bülow, K.; Dreier, N.; Keup-Thiel, E.; Krüger, O.; Mudersbach, C.; Radermacher, C.; Schoetter, R. Statistische Verfahren zur Auswertung von Klimadaten aus Modell und Beobachtung, eingesetzt in Projekten und Institutionen, die sich mit Klimafolgen und Anpassung befassen: CSC Report 13; Climate Service Center: Geesthacht, Germany, 2013. [Google Scholar]
- Teetor, P. R Cookbook; O’Reilly Media Inc.: Sebastopol, CA, USA, 2011; ISBN 978-0596809157. [Google Scholar]
- Shumway, R.H.; Stoffer, D.S. Time Series Analysis and Its Applications; Springer International Publishing: Cham, Switzerland, 2017; ISBN 978-3-319-52451-1. [Google Scholar]
- German Weather Service. Deutschlandwetter im Jahr 2014: Press Release 2015; Deutscher Wetterdienst: Offenbach, Germany, 2015. [Google Scholar]
- De Frenne, P.; Verheyen, K. Weather stations lack forest data. Science 2016, 351, 234. [Google Scholar] [CrossRef] [PubMed]
- Lenoir, J.; Graae, B.J.; Aarrestad, P.A.; Alsos, I.G.; Armbruster, W.S.; Austrheim, G.; Bergendorff, C.; Birks, H.J.B.; Bråthen, K.A.; Brunet, J.; et al. Local temperatures inferred from plant communities suggest strong spatial buffering of climate warming across Northern Europe. Glob. Chang. Biol. 2012, 19, 1470–1481. [Google Scholar] [CrossRef]
- Ferrez, J.; Davison, A.; Rebetez, M. Extreme temperature analysis under forest cover compared to an open field. Agric. For. Meteorol. 2011, 151, 992–1001. [Google Scholar] [CrossRef]
- Lookingbill, T. Spatial estimation of air temperature differences for landscape-scale studies in montane environments. Agric. For. Meteorol. 2003, 114, 141–151. [Google Scholar] [CrossRef]
- Ashcroft, M.B.; Gollan, J.R. The sensitivity of topoclimatic models to fine-scale microclimatic variability and the relevance for ecological studies. Theor. Appl. Clim. 2013, 114, 281–289. [Google Scholar] [CrossRef] [Green Version]
- Kovács, B.; Tinya, F.; Ódor, P. Stand structural drivers of microclimate in mature temperate mixed forests. Agric. For. Meteorol. 2017, 234-235, 11–21. [Google Scholar] [CrossRef] [Green Version]
- Ma, S.; Concilio, A.; Oakley, B.; North, M.; Chen, J. Spatial variability in microclimate in a mixed-conifer forest before and after thinning and burning treatments. For. Ecol. Manag. 2010, 259, 904–915. [Google Scholar] [CrossRef]
- Brooks, R.T.; Kyker-Snowman, T.D. Forest floor temperature and relative humidity following timber harvesting in southern New England, USA. For. Ecol. Manag. 2008, 254, 65–73. [Google Scholar] [CrossRef]
- Chen, J.; Franklin, J. Growing-season microclimate variability within an old-growth Douglas-fir forest. Clim. Res. 1997, 8, 21–34. [Google Scholar] [CrossRef] [Green Version]
- Baker, T.P.; Jordan, G.J.; Steel, E.A.; Fountain-Jones, N.M.; Wardlaw, T.J.; Baker, S.C. Microclimate through space and time: Microclimatic variation at the edge of regeneration forests over daily, yearly and decadal time scales. For. Ecol. Manag. 2014, 334, 174–184. [Google Scholar] [CrossRef]
- MacLean, I.M.D.; Suggitt, A.J.; Wilson, R.J.; Duffy, J.P.; Bennie, J.J. Fine-scale climate change: Modelling spatial variation in biologically meaningful rates of warming. Glob. Chang. Biol. 2016, 23, 256–268. [Google Scholar] [CrossRef] [PubMed]
- Christiansen, M.N. The Physiology of Plant Tolerance to Temperature Extremes. In Crop Tolerance to Suboptimal Land Conditions; Jung, G.A., Ed.; American Society of Agronomy, Crop Science Society of America, and Soil Science Society of America: Madison, WI, USA, 1978; pp. 173–191. ISBN 9780891182986. [Google Scholar]
- Chen, J.; Saunders, S.C.; Crow, T.R.; Naiman, R.J.; Brosofske, K.D.; Mroz, G.D.; Brookshire, B.L.; Franklin, J.F. Microclimate in Forest Ecosystem and Landscape Ecology. BioScience 1999, 49, 288–297. [Google Scholar] [CrossRef] [Green Version]
- Von Arx, G.; Pannatier, E.G.; Thimonier, A.; Rebetez, M. Microclimate in forests with varying leaf area index and soil moisture: Potential implications for seedling establishment in a changing climate. J. Ecol. 2013, 101, 1201–1213. [Google Scholar] [CrossRef]
- Potter, B.E.; Teclaw, R.M.; Zasada, J.C. The impact of forest structure on near-ground temperatures during two years of contrasting temperature extremes. Agric. For. Meteorol. 2001, 106, 331–336. [Google Scholar] [CrossRef]
- Graversen, R.G.; Mauritsen, T.; Tjernström, M.; Källén, E.; Svensson, G. Vertical structure of recent Arctic warming. Nat. Cell Biol. 2008, 451, 53–56. [Google Scholar] [CrossRef] [PubMed]
- Matthes, H.; Rinke, A.; Dethloff, K. Recent changes in Arctic temperature extremes: Warm and cold spells during winter and summer. Environ. Res. Lett. 2015, 10, 114020. [Google Scholar] [CrossRef]
- Wagner, A. Zukünftige Klimaentwicklungen in Baden-Württemberg: Perspektiven aus Regionalen Klimamodellen, Langfassung; Landesanstalt für Umwelt, Messungen und Naturschutz Baden-Württemberg: Karlsruhe, Germany, 2013; ISBN 978-3-88251-377-6. [Google Scholar]
- Netherer, S.; Pennerstorfer, J. Parameters Relevant for Modelling the Potential Development of Ips typographus (Coleoptera: Scolytidae). Integr. Pest Manag. Rev. 2001, 6, 177–184. [Google Scholar] [CrossRef]
- Wermelinger, B.; Seifert, M. Temperature-dependent reproduction of the spruce bark beetle Ips typographus, and analysis of the potential population growth. Ecol. Entomol. 1999, 24, 103–110. [Google Scholar] [CrossRef]
Figure 1.
Overview of the locations of the individual measuring spots of the DWD station (blue), micrometeorological stations (MS, SS), the Micro-Loggers of System-1 (white, ML-1 to ML-6) and System-2 (red, ML-7 to ML-10). The graphs give an aerial view (source: Google maps) from the forest (a), the adjoining open land to the north (b) as well as images of four diverse forest measurement spots (c–f).

Figure 2.
Features of the Micro-Loggers and climate stations in the forest (MS, SS) and the weather station of the German Weather Service (= Deutscher Wetterdienst, denoted as “DWD) (a,b); (c) illustrates the general measurement setup of the two Micro-Logger Systems 1 (internal sensor) and 2 (external sensor), which were located under moss (top) or grass (bottom).

Figure 3.
Temperature deviations between S1 and S2 (a) according to sensor system and location and (b) along the season. (a) Temperature differences of the two systems (S2 minus S1) at “wide clearing” (clear, in red) and “tree shadow” (shad, in blue) and differences between the locations looking at S1 (black) or S2 (grey) from April 2 to 5. Sunshine duration considerably decreased in the course of the days (h/day: 10.2, 3.1, 0, 0); (b) the lower graph depicts differences between S1 (ML-1) and S2 (ML-7) at “wide clearance” as hourly mean values from spring to autumn 2014.

Figure 4.
Diurnal radiation and temperature pattern during clear sky conditions over three days in June 2014. MS refers to the Medium Station at the “small clearing”, with Ta = air temperature (50 cm), Ts = soil temperature (−5 cm), Tli = near-surface temperature, solrad = solar radiation, and DWD_Ta air temperature (2 m) of the nearby official weather station.

Figure 5.
Diurnal temperature courses of the Micro-Loggers on a clear (a) and a cloudy (b) day in July 2014. On the clear day (July 18th), S1 and S2 are separately presented. The lower graph also shows the temperature situation recorded at the micrometeorological stations MS/SS and the DWD station to illustrate the low differences on cloudy days.

Figure 6.
Averaged diurnal temperature courses in June and August 2014. Data from Micro-Loggers of type S1, from the Small Station (SS) and DWD station are shown. In 2014, June was warm and sunny, while August was cool and rainy compared to the long-term average.
Figure 6.
Averaged diurnal temperature courses in June and August 2014. Data from Micro-Loggers of type S1, from the Small Station (SS) and DWD station are shown. In 2014, June was warm and sunny, while August was cool and rainy compared to the long-term average.

Figure 7.
Overview of the data distribution at daytime in April, June and August 2014. Again, the colors imply the grade of shading of the loggers and stations (dark green = very shaded/moss, yellow = open land/grass, beige = temporal shading/grass (ML-9 = moss), light green = temporal shading/leaf litter). The ordinate depicts the temperature (°C), please note the different scales.

Figure 8.
Accumulated temperature sum for the study period from April to September 2014. (a) Showing the nearby official weather station (DWD) and forest stations (Ts = soil, Ta = air, Tli = near-surface), (b) the Micro-Loggers (ML) and comparable measures of DWD and Small Station (SS) and (c) other official weather stations comparable to the warmest ML.


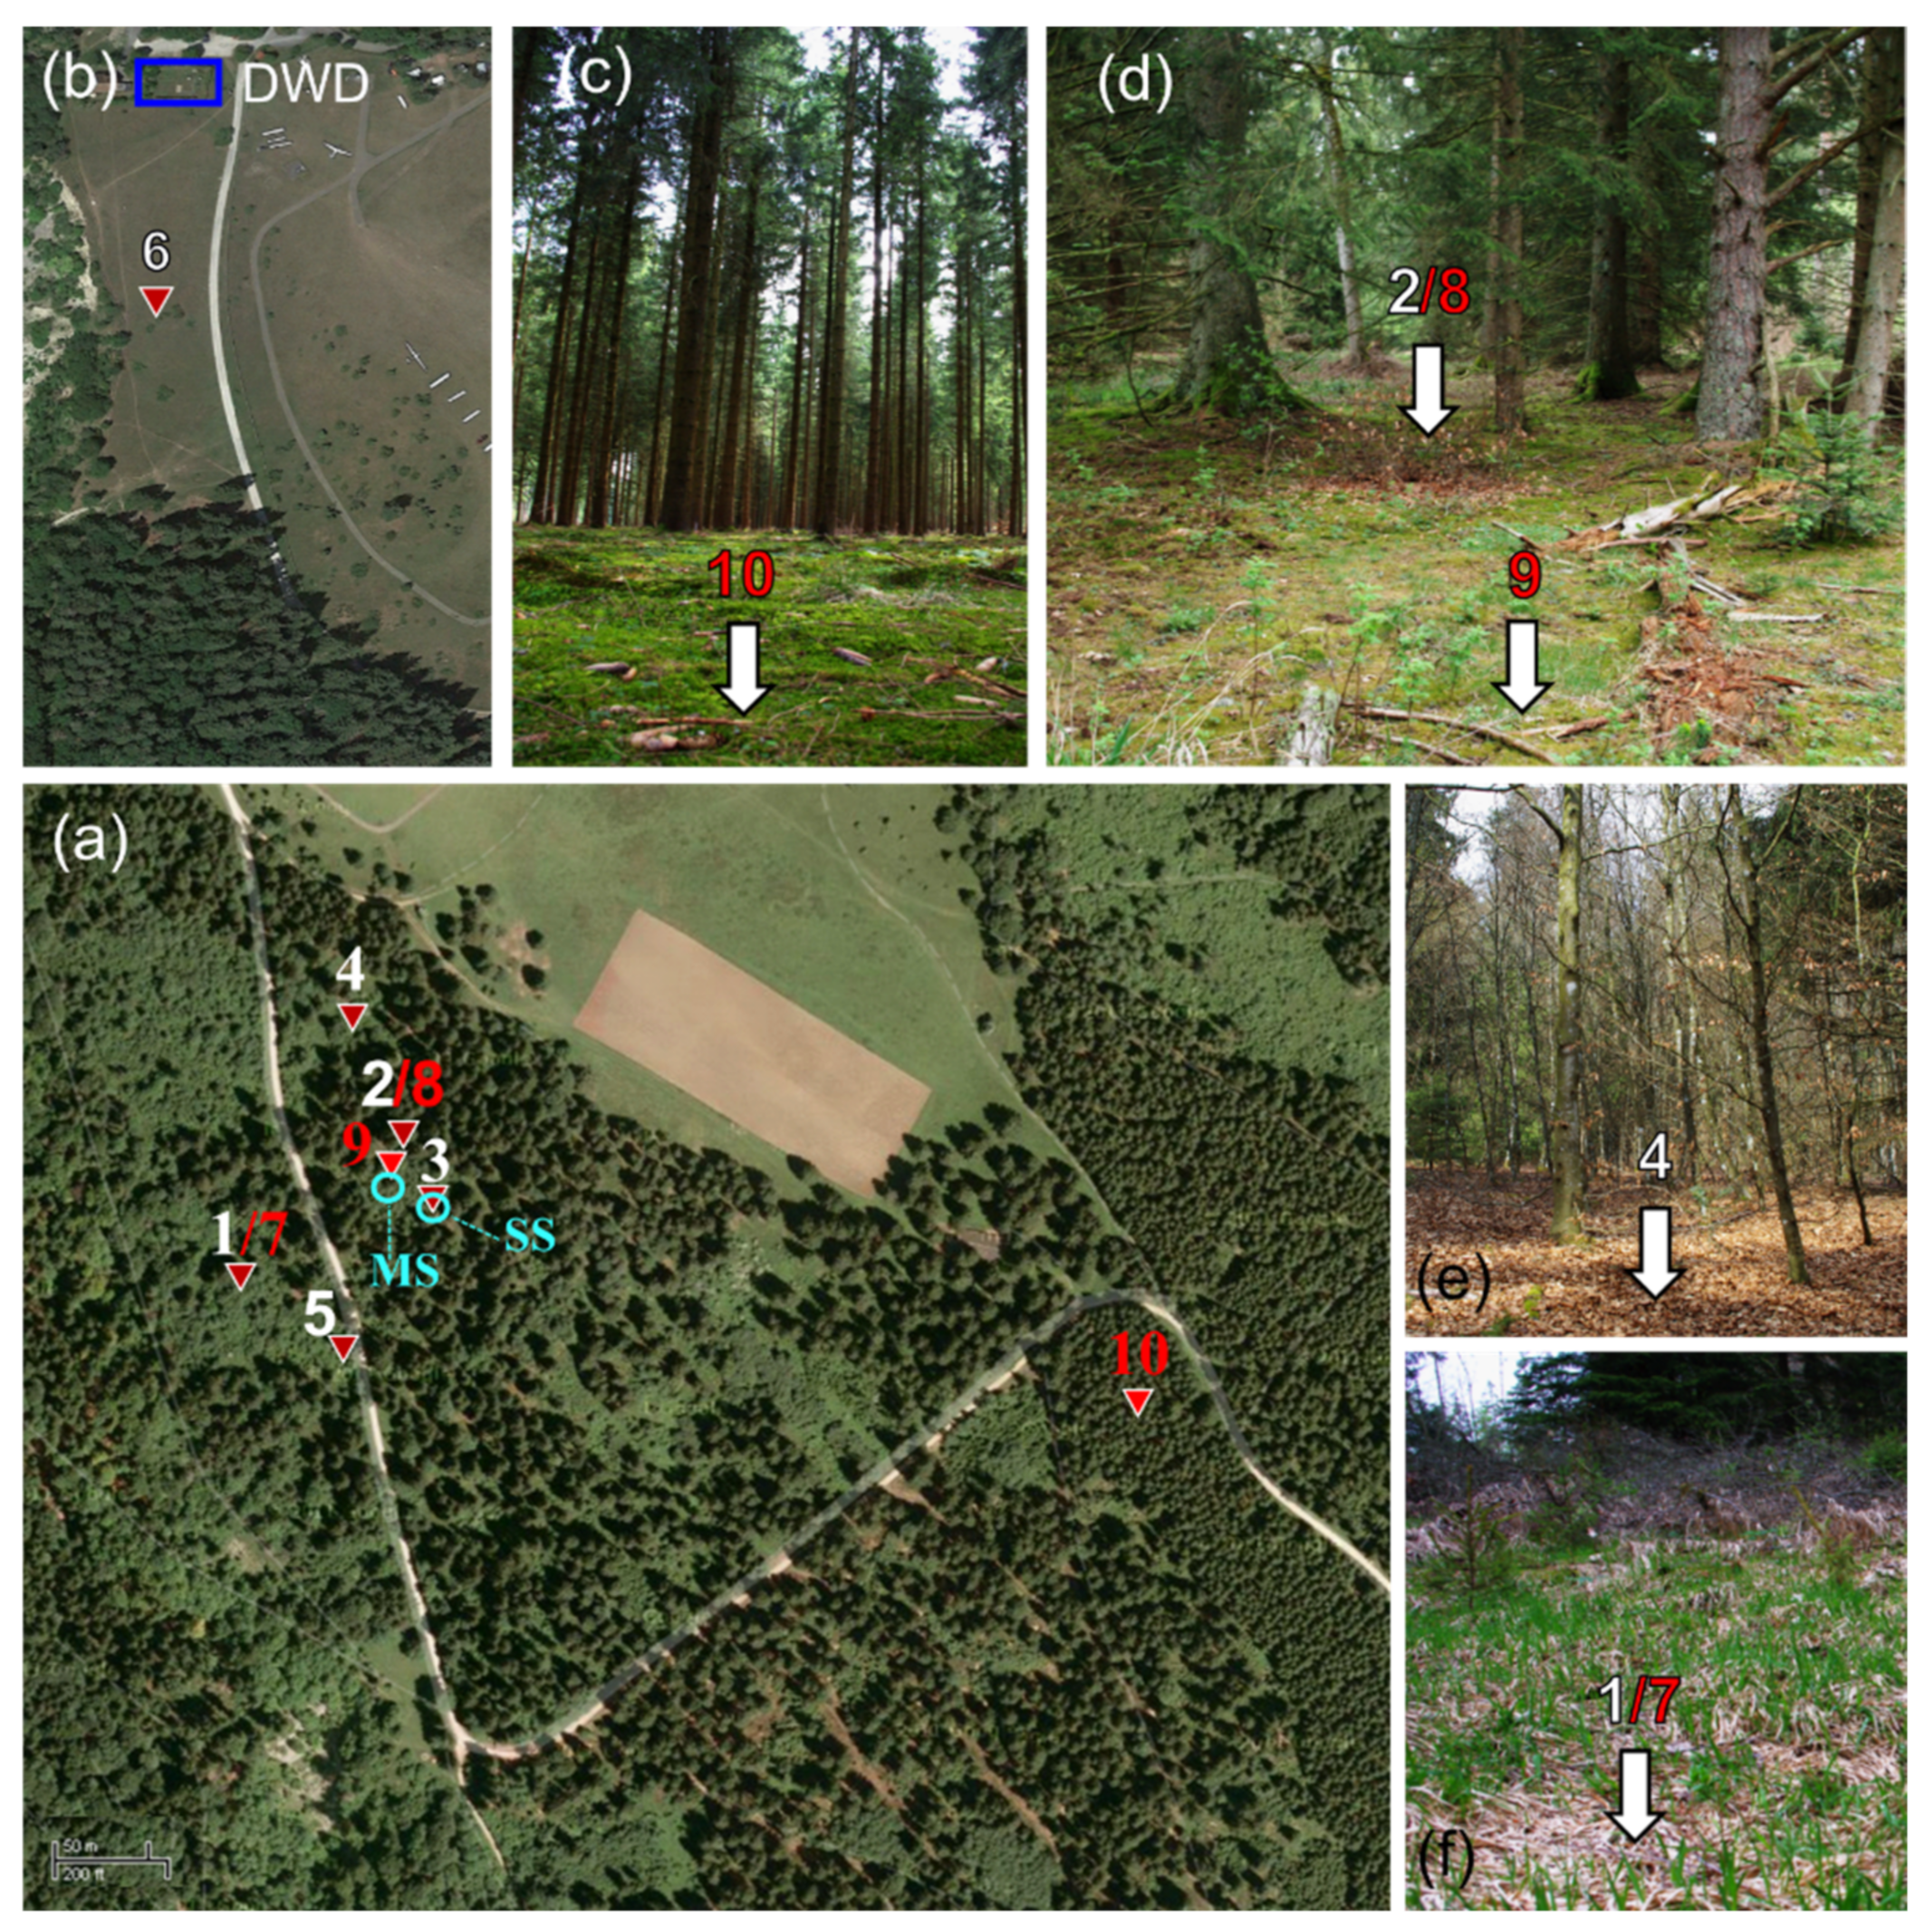
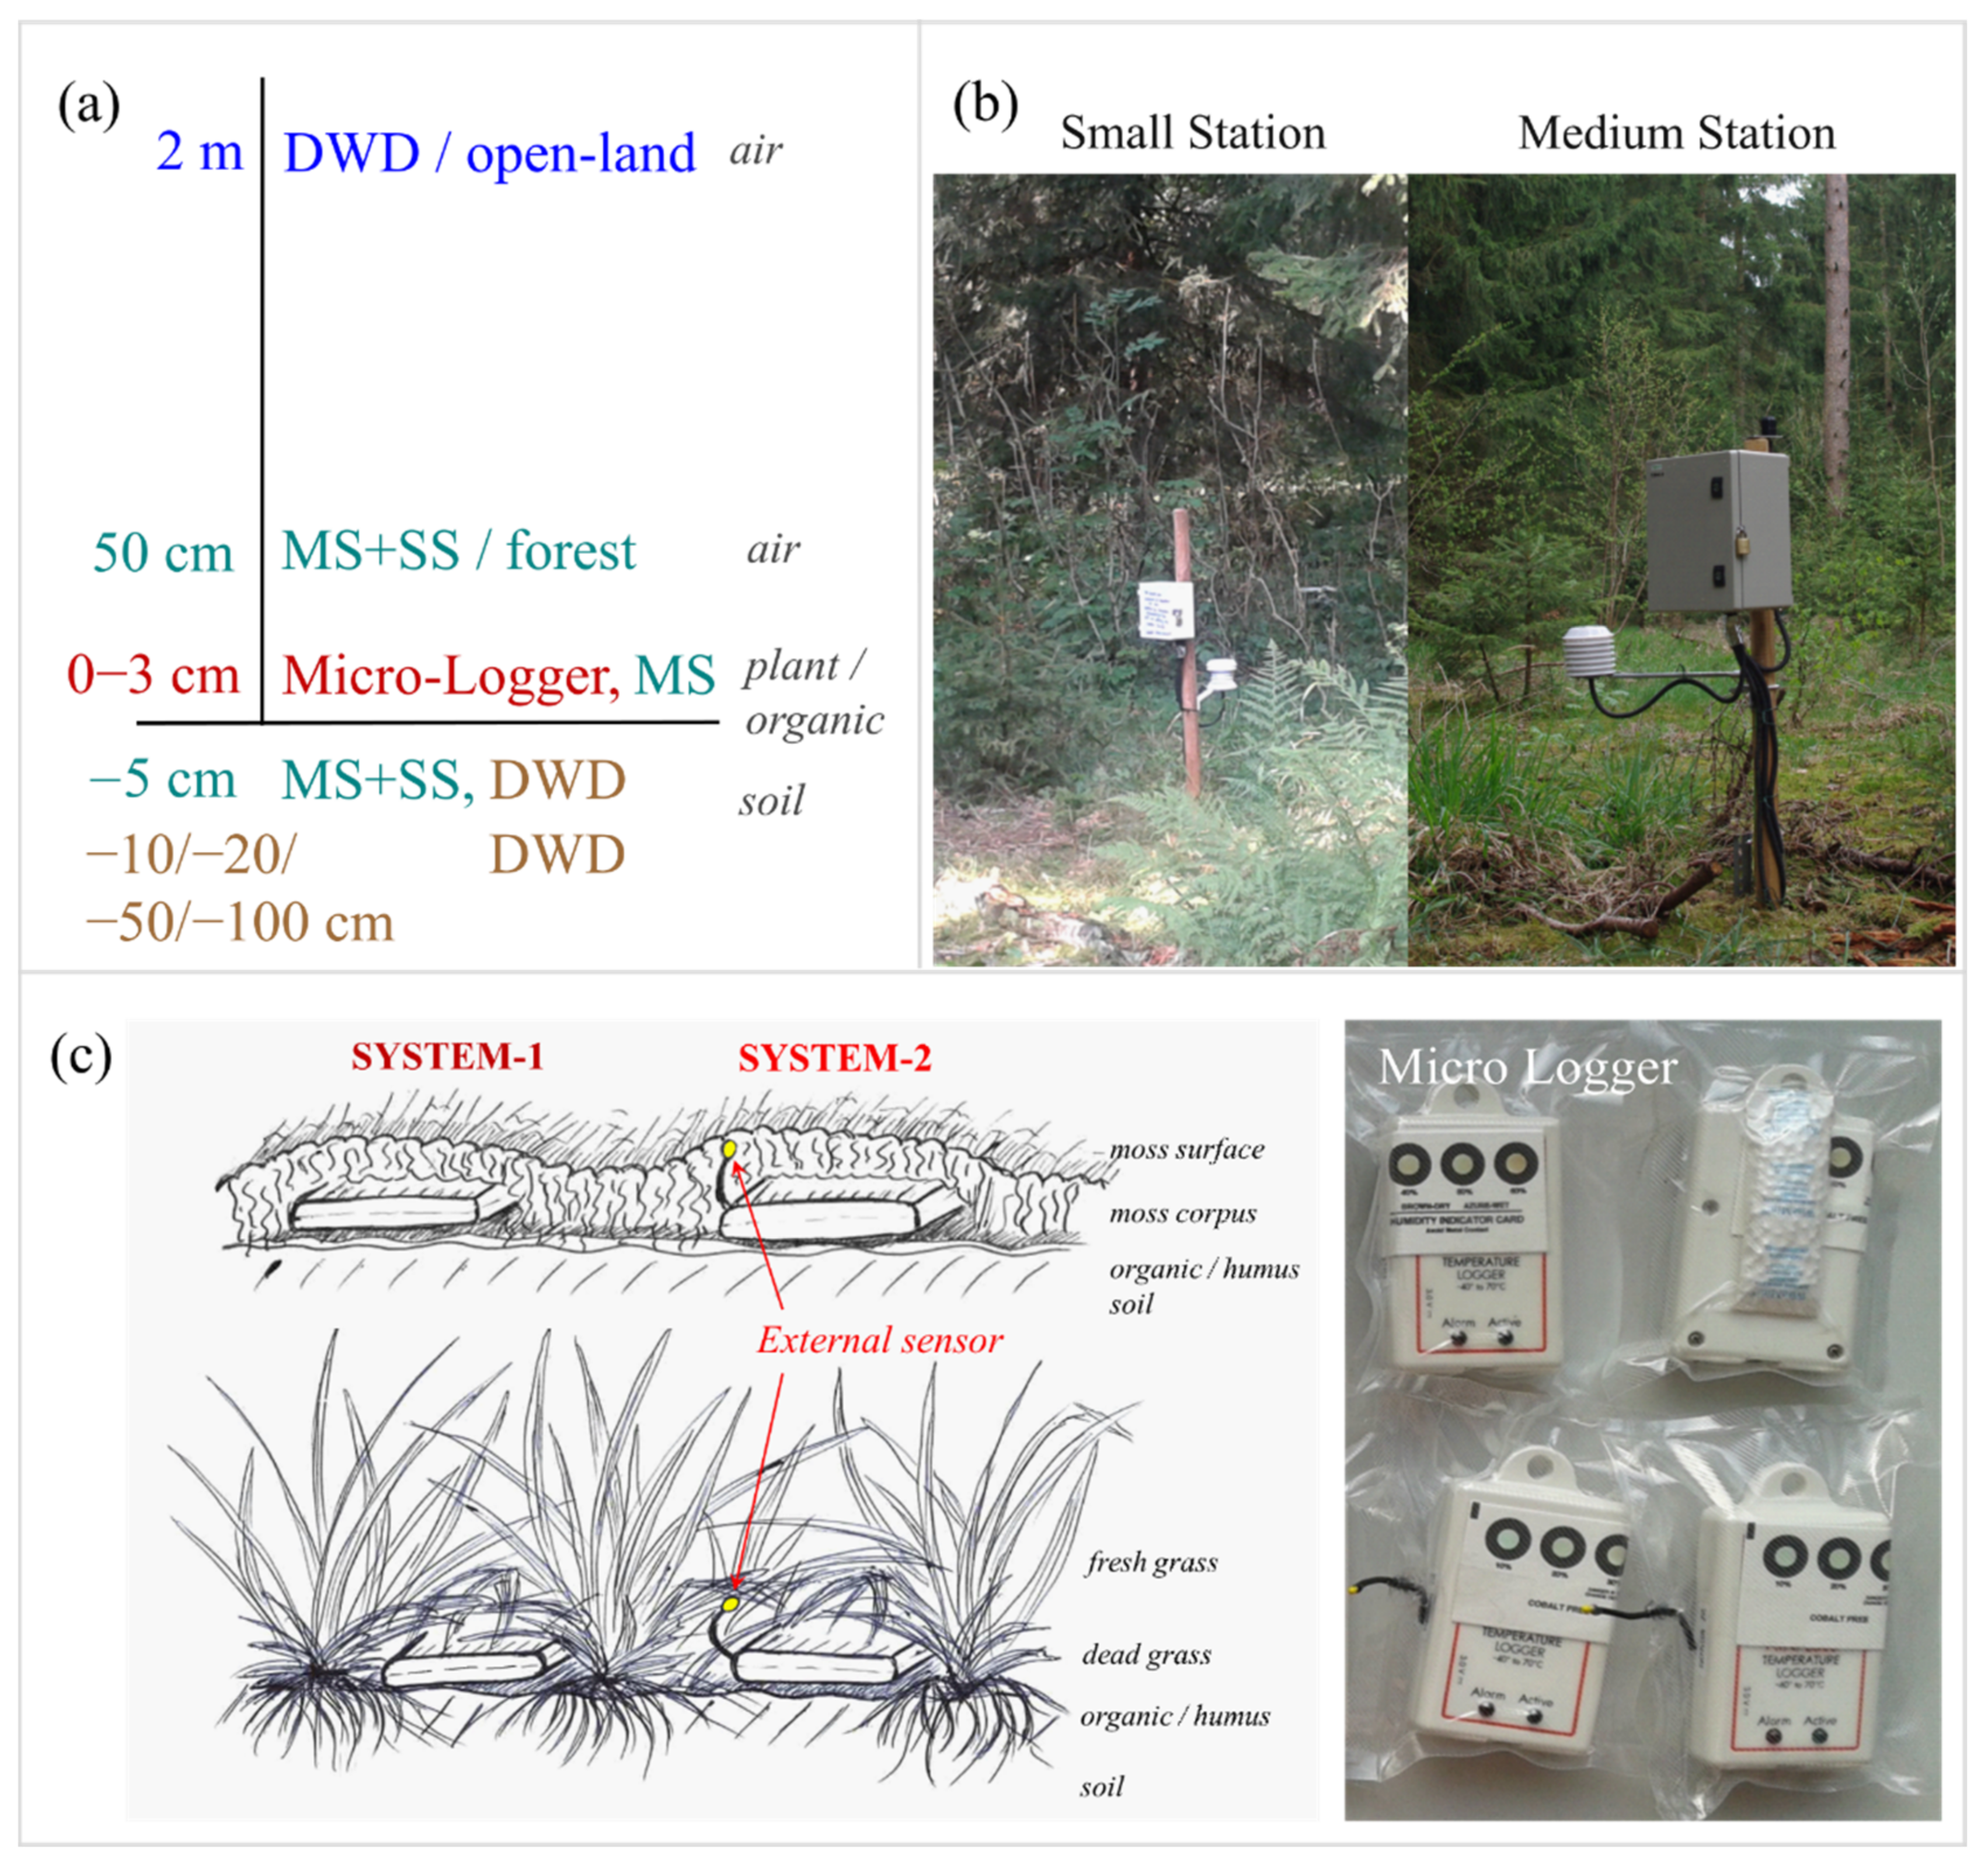
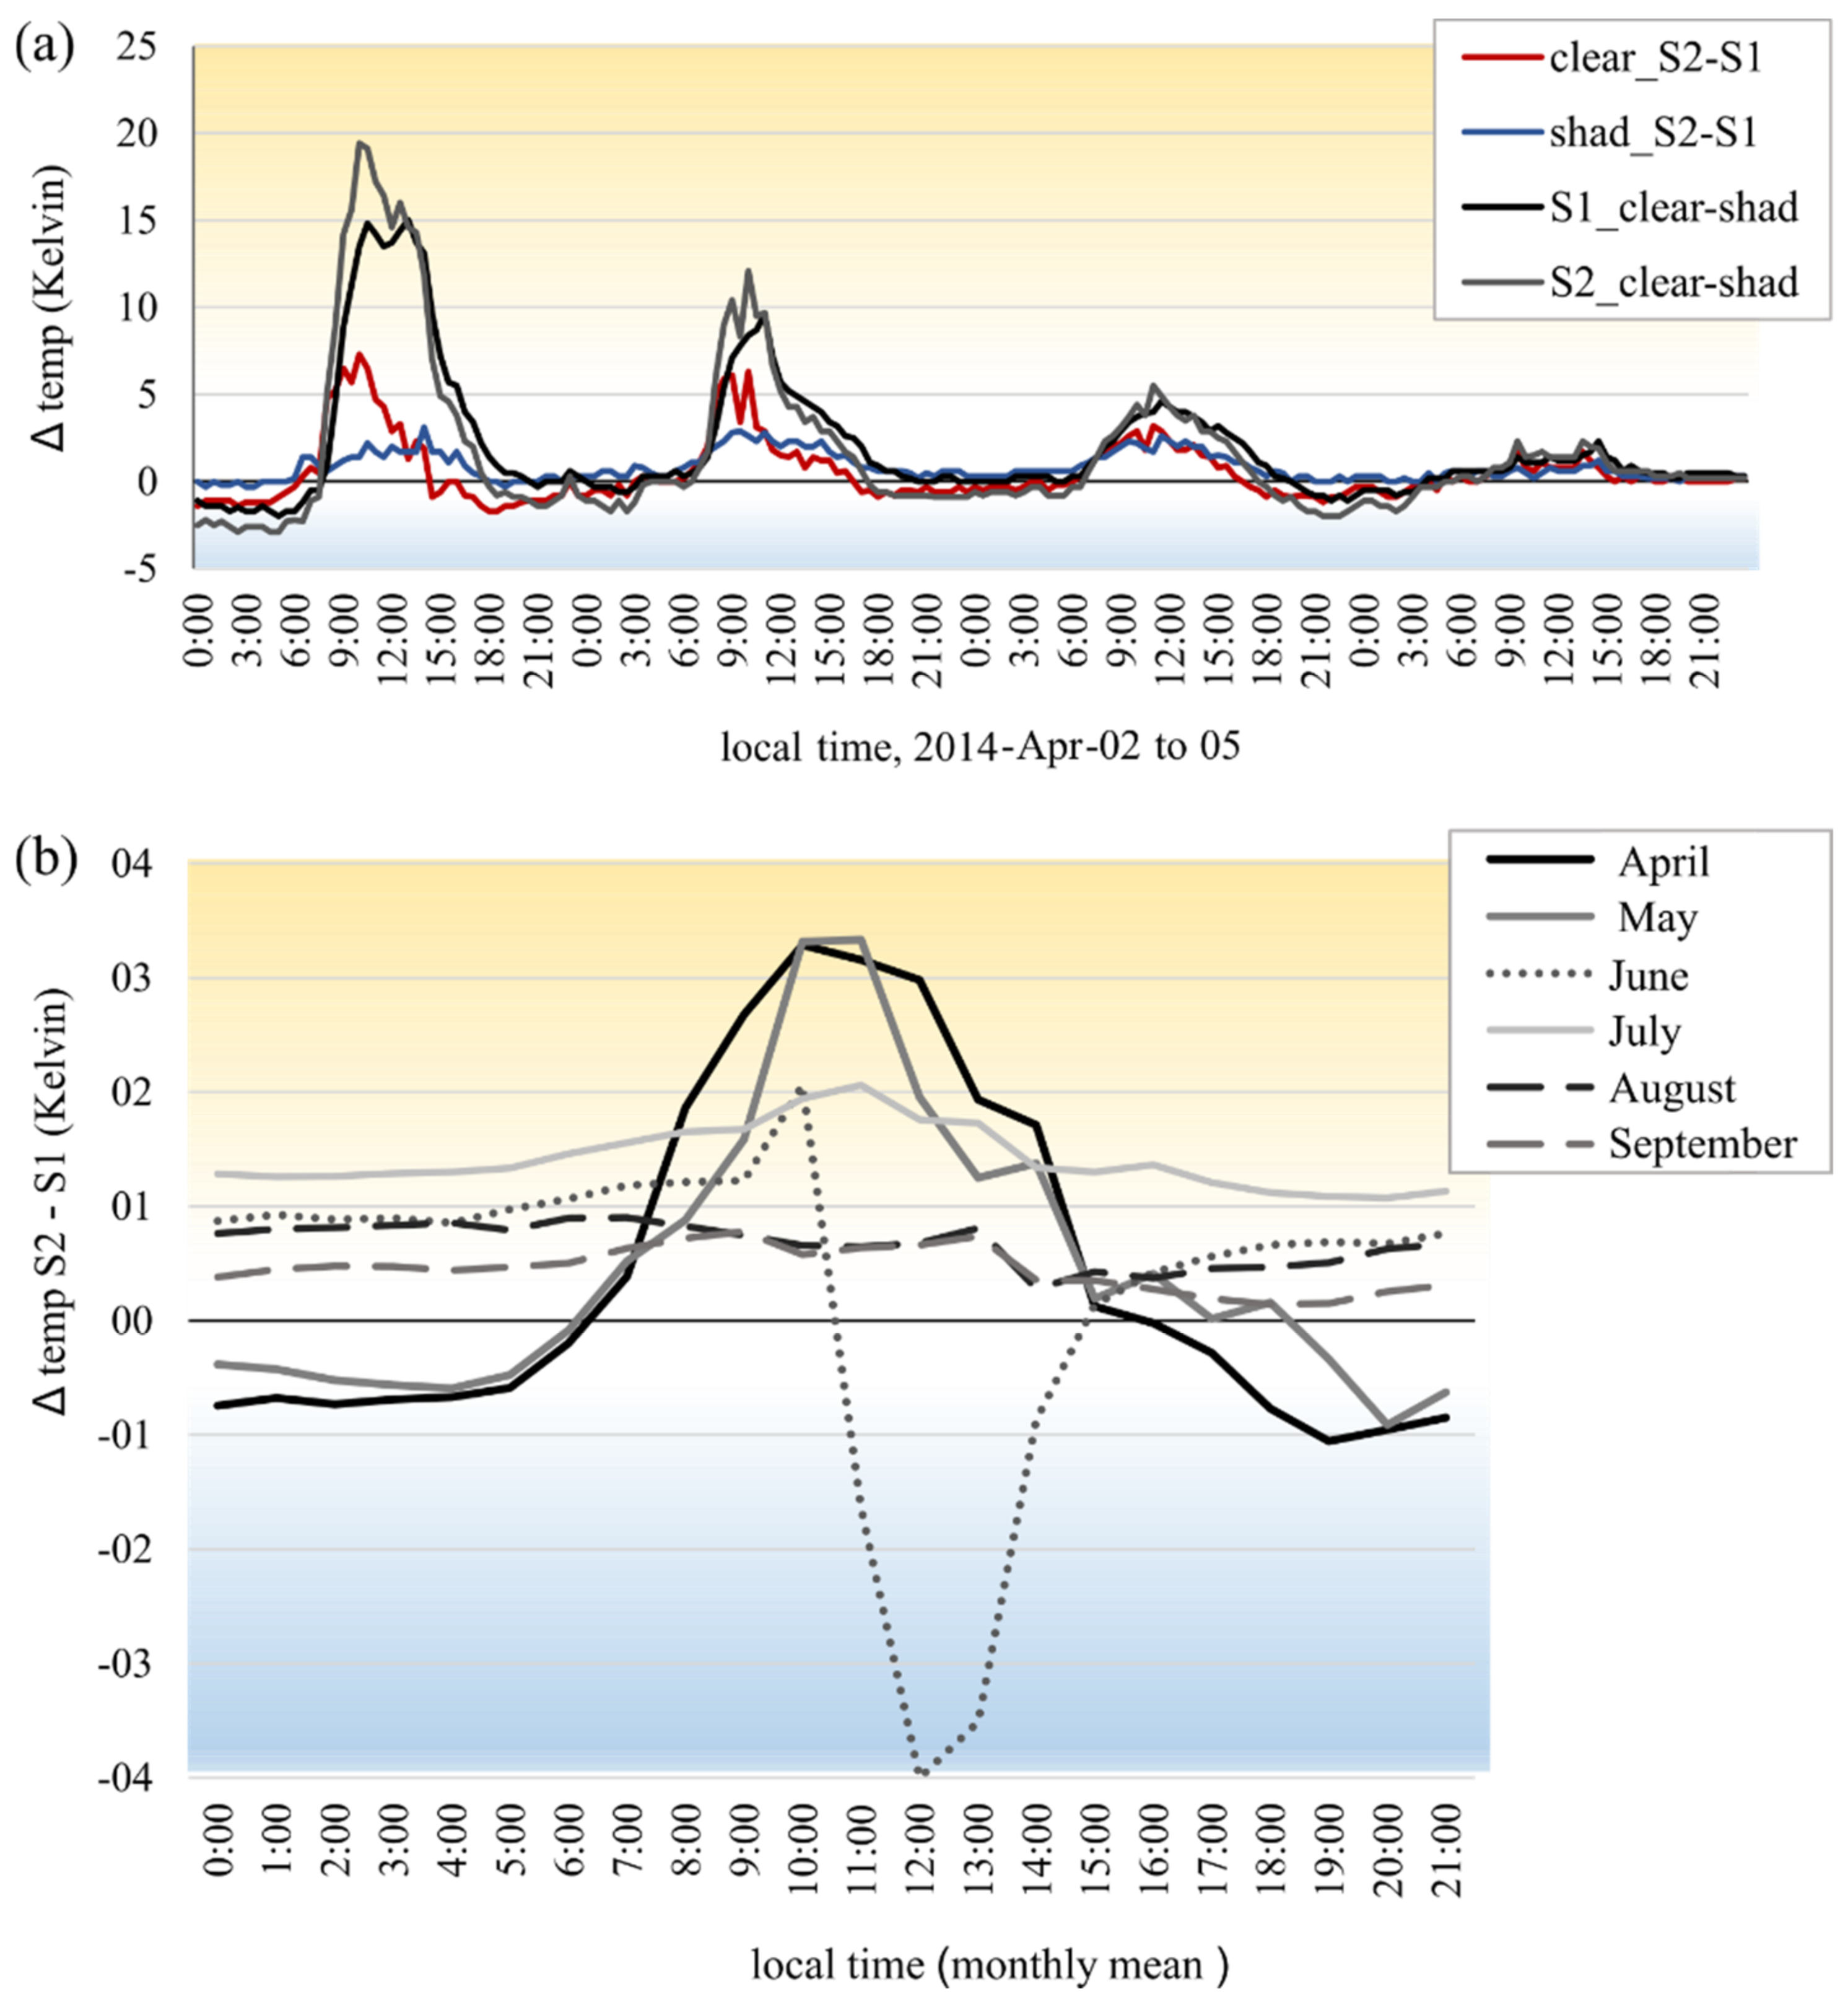
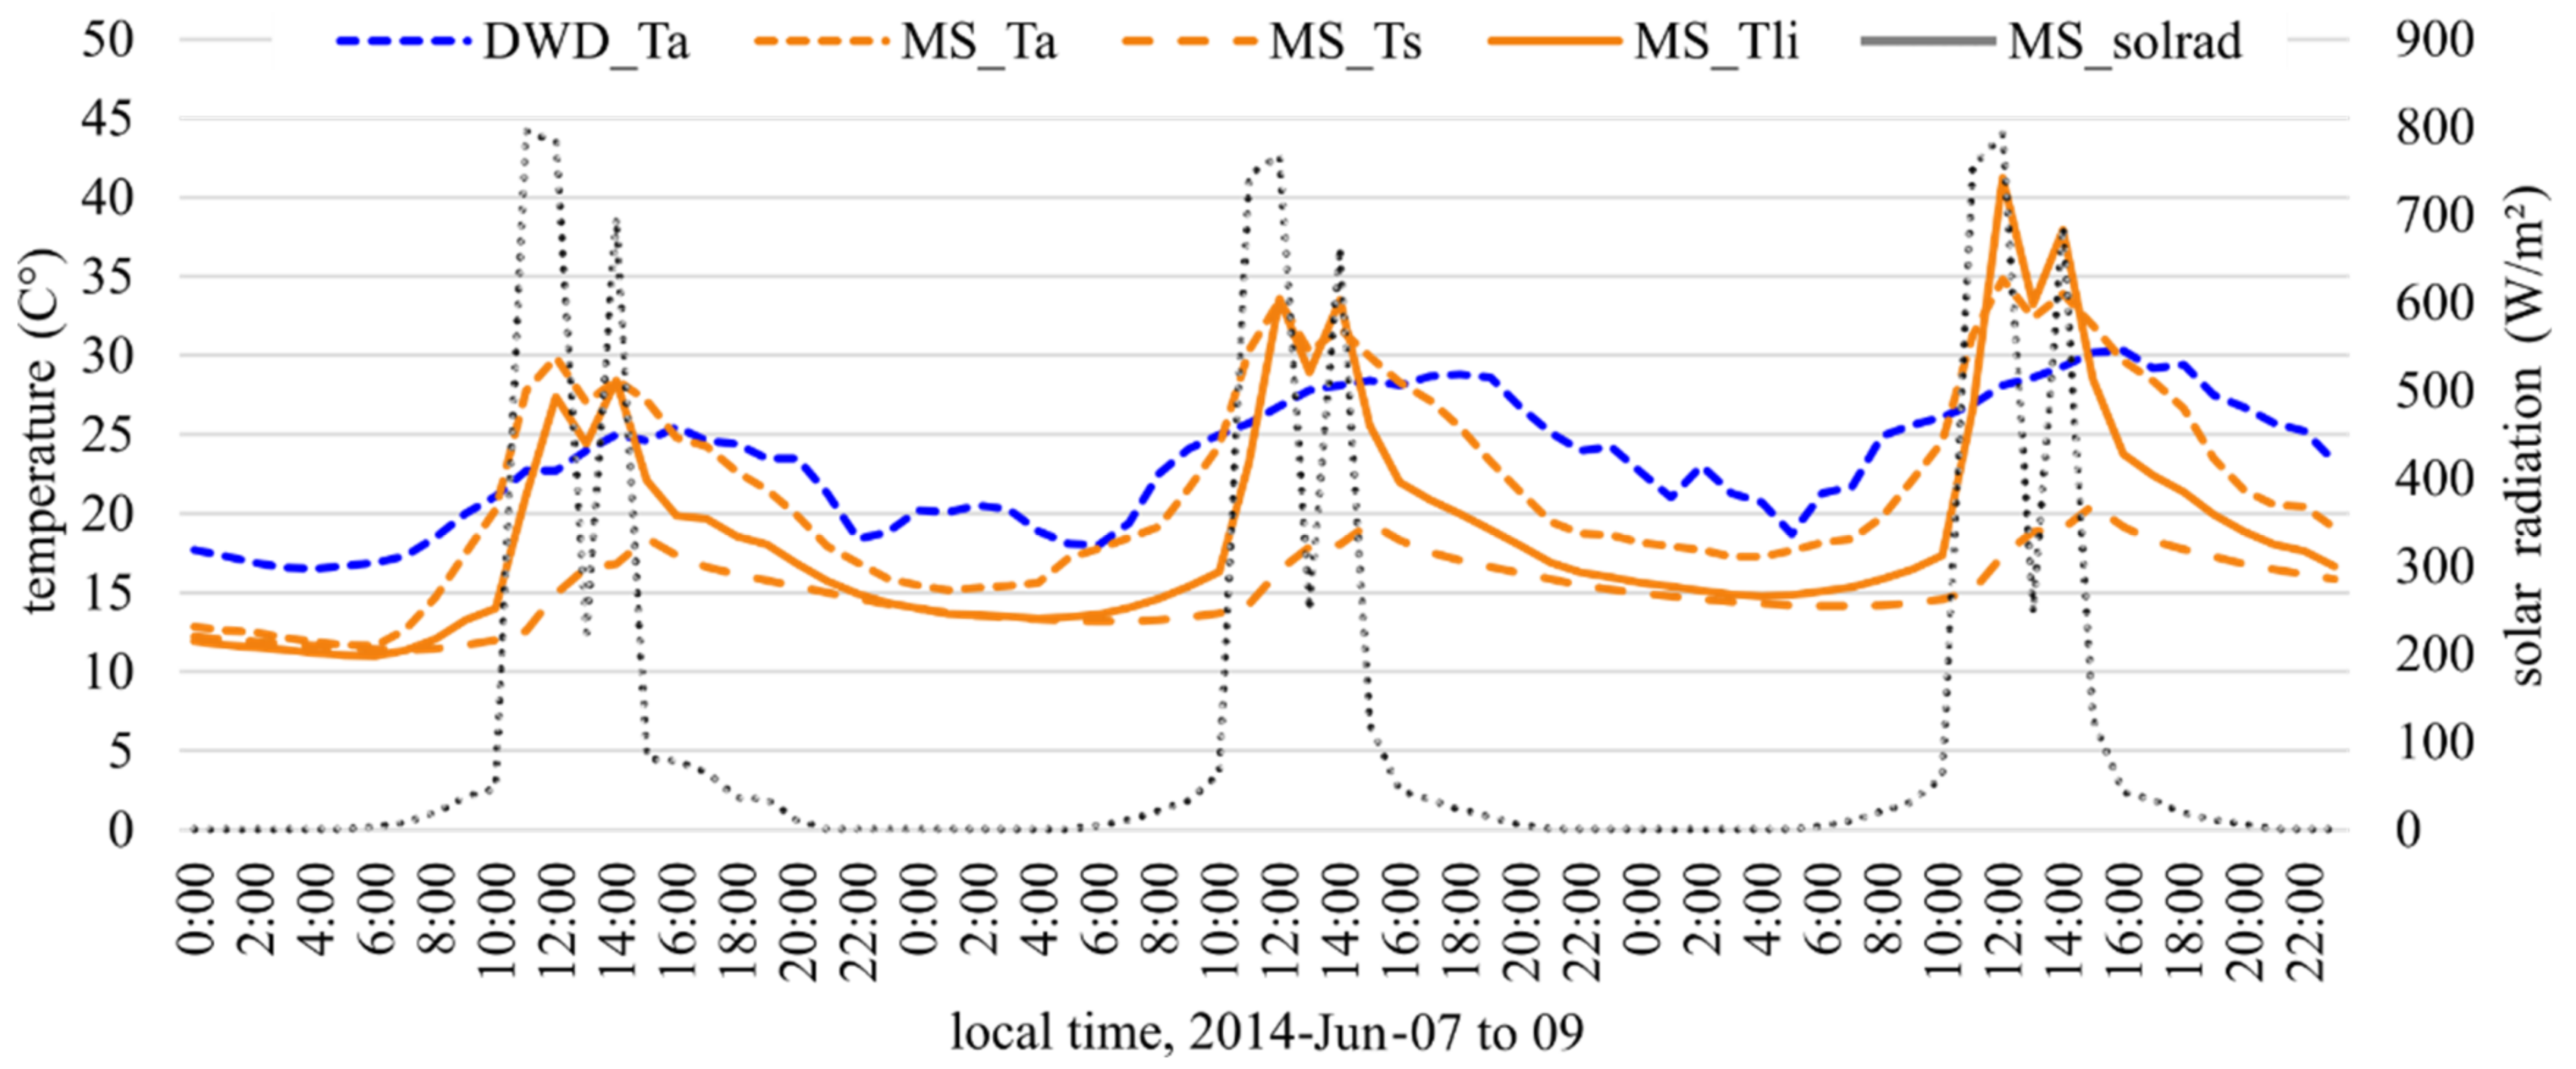
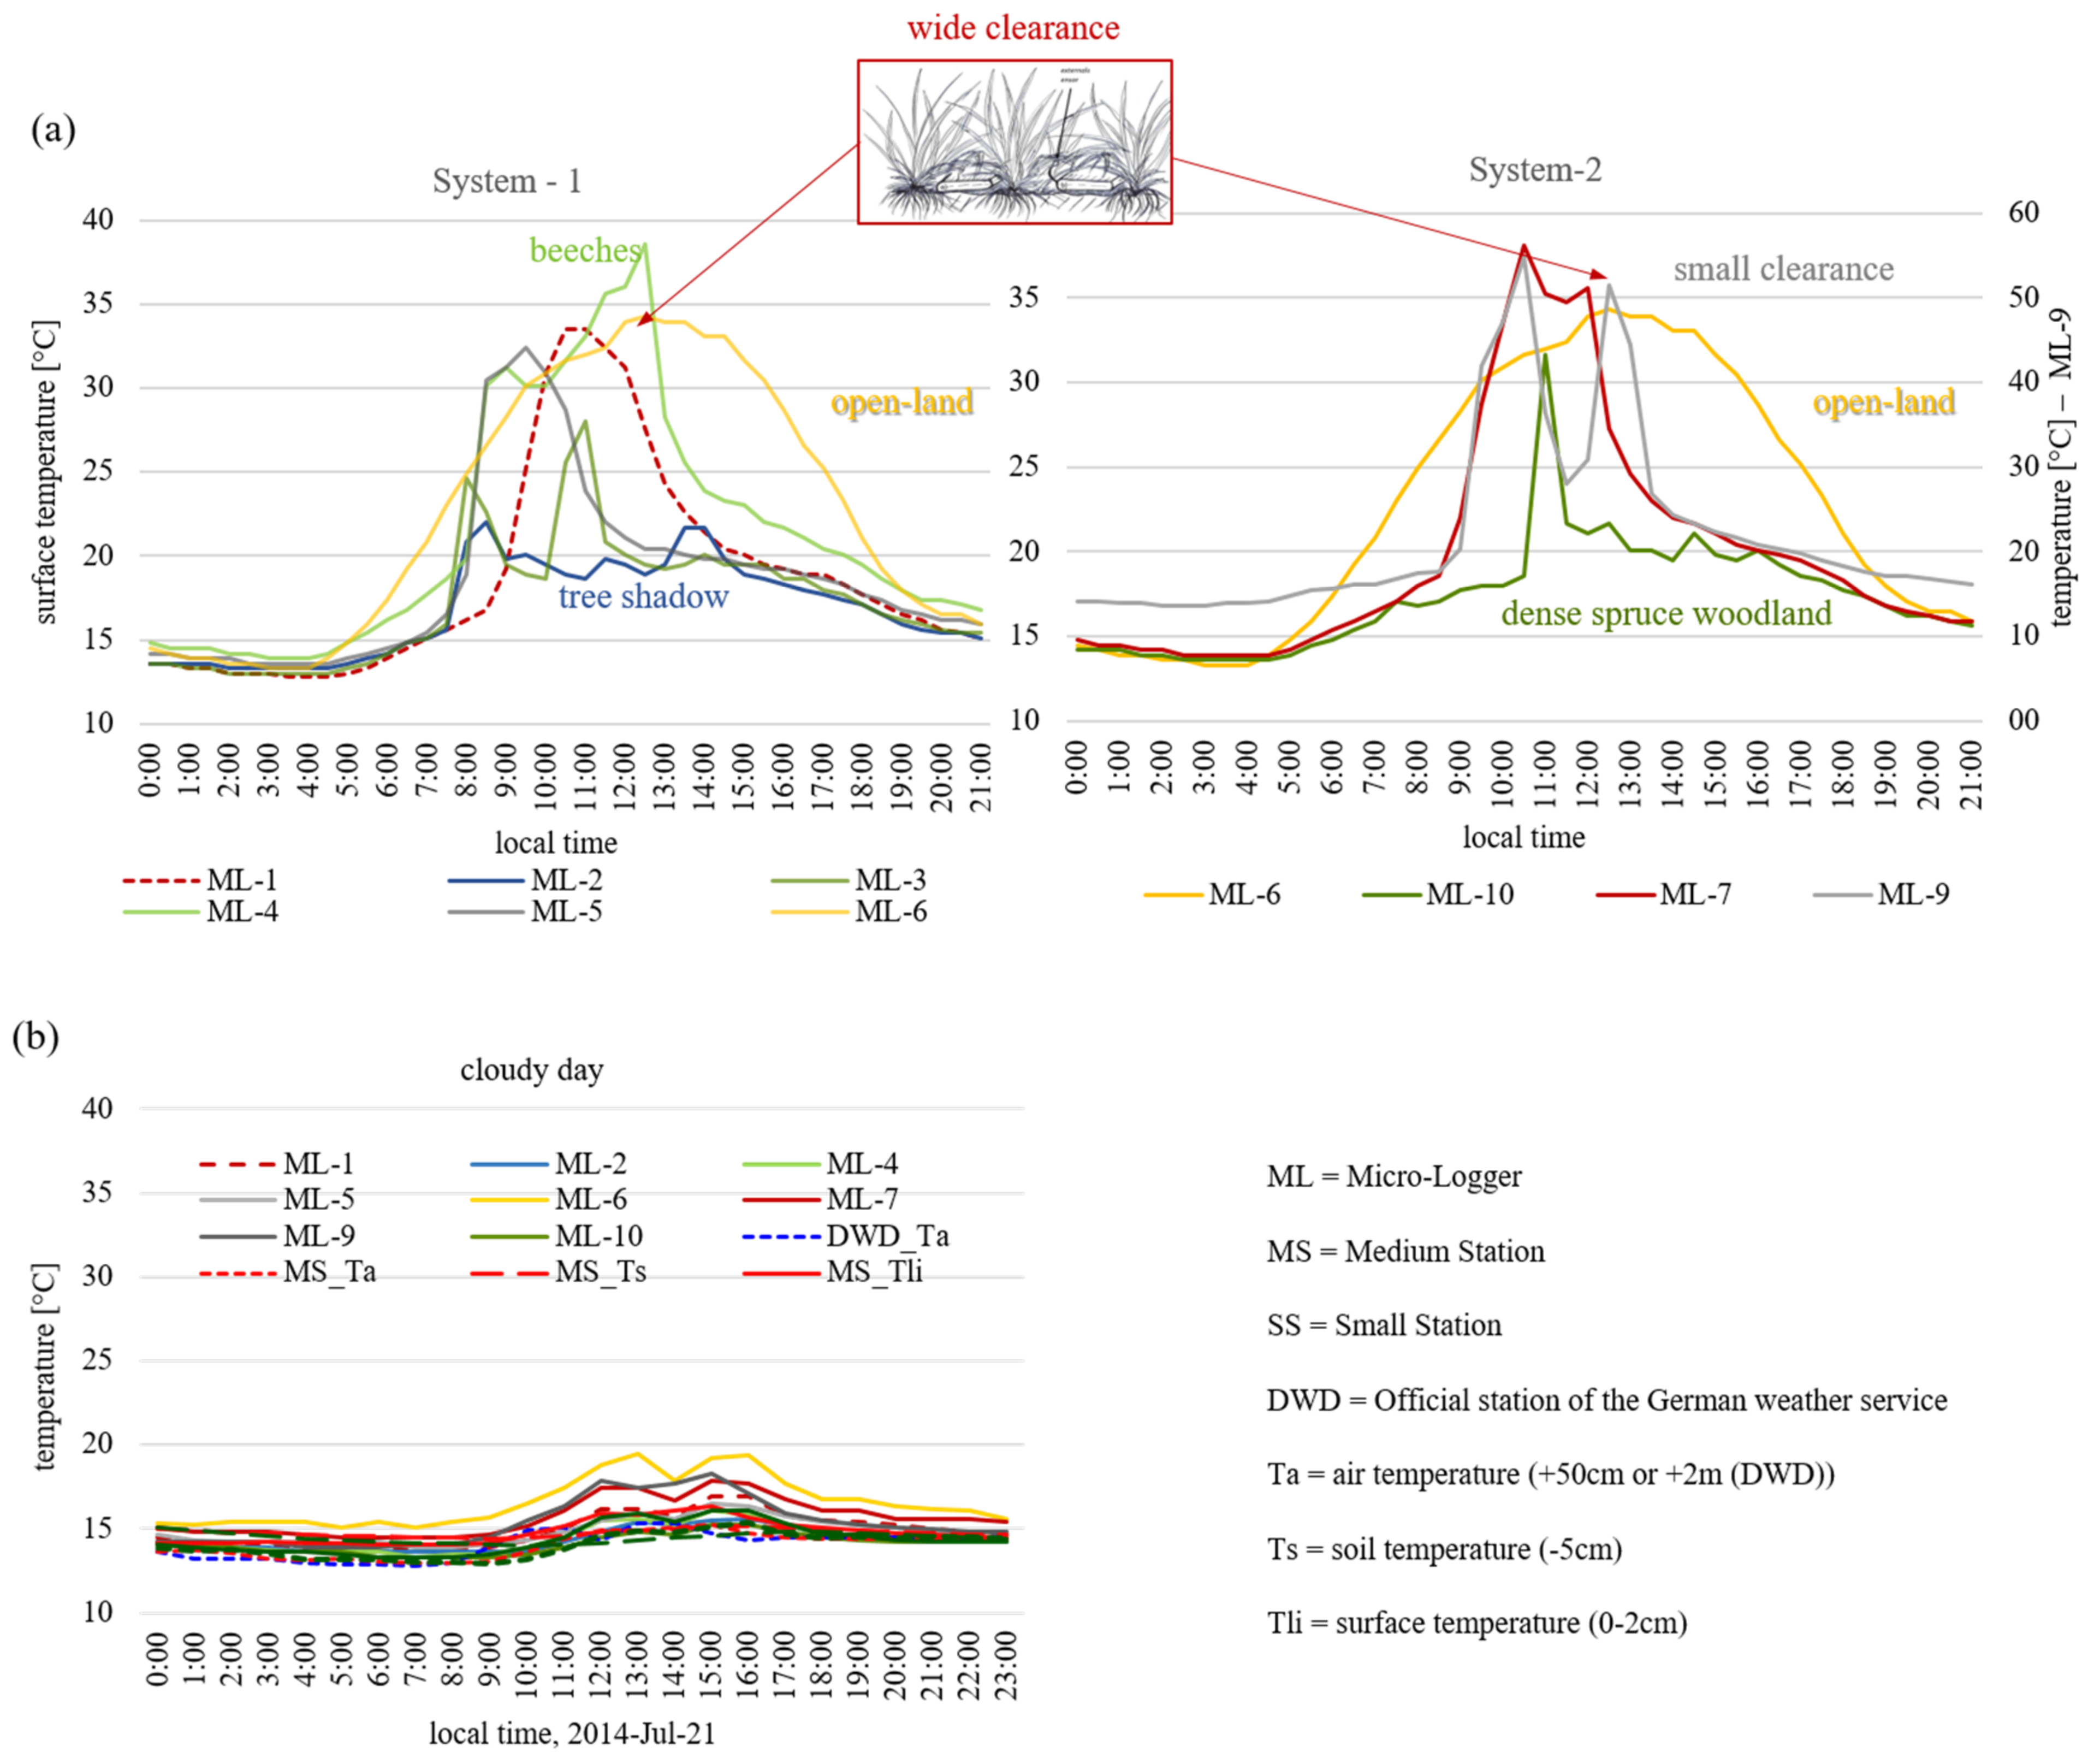
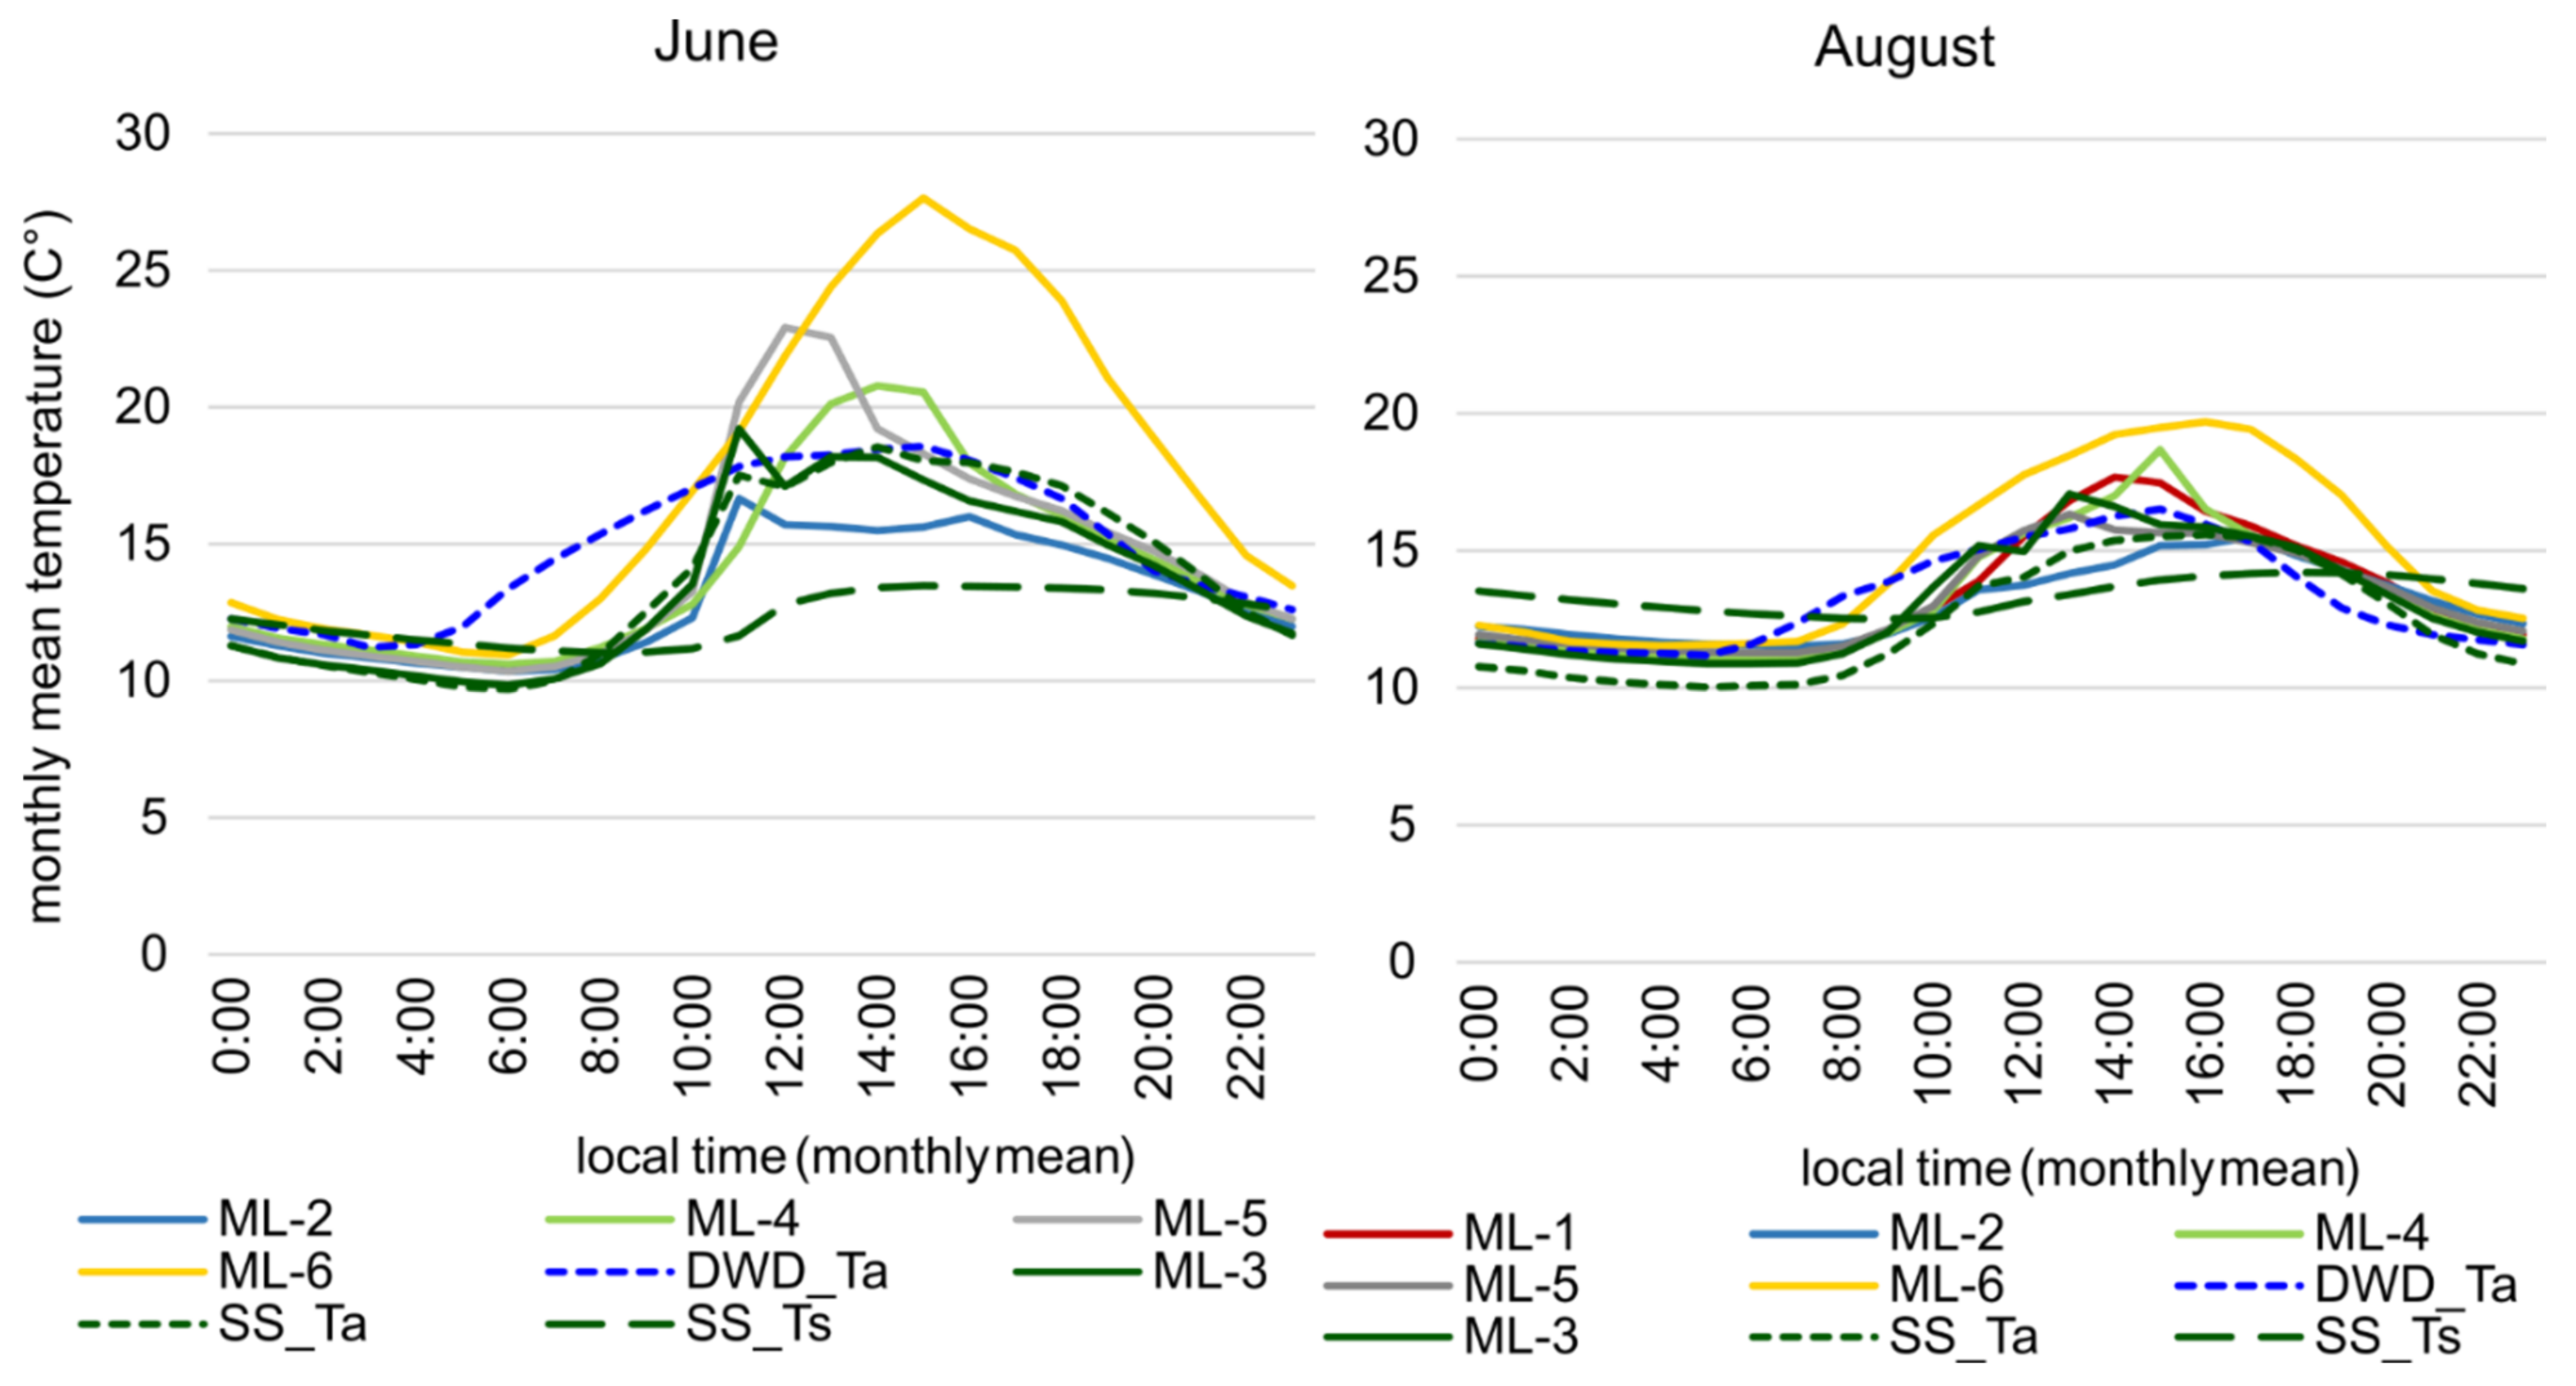
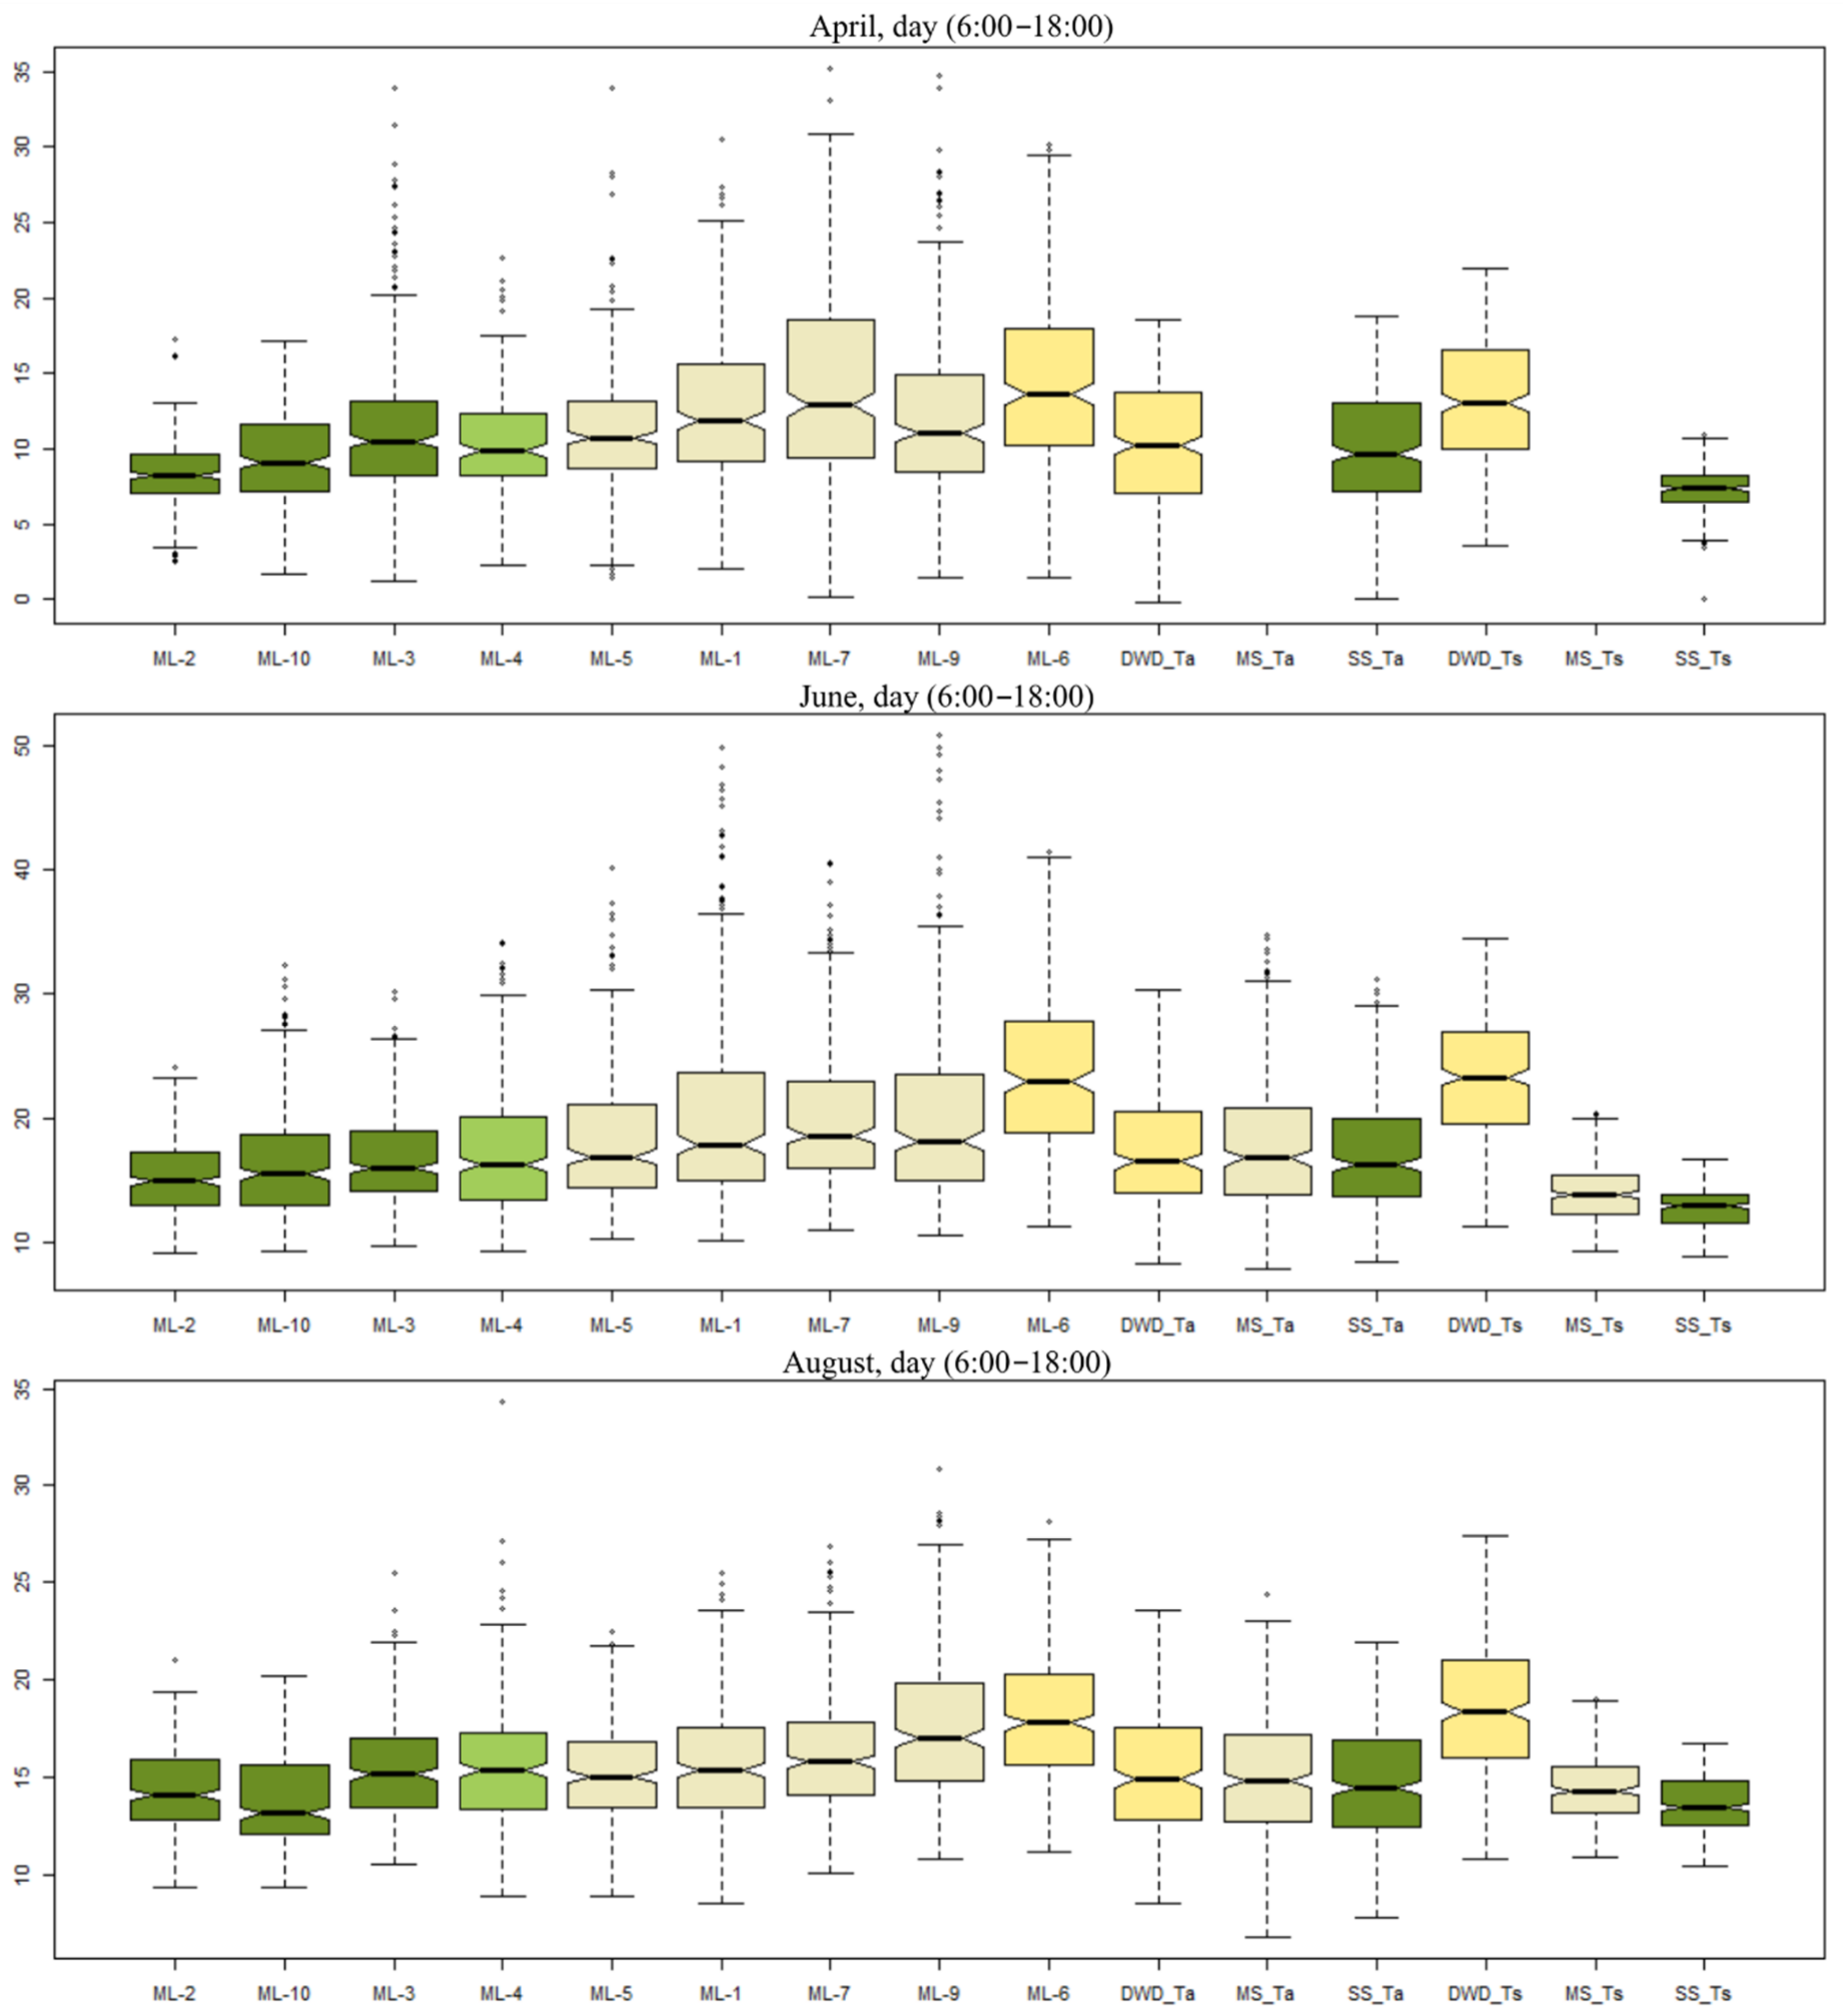
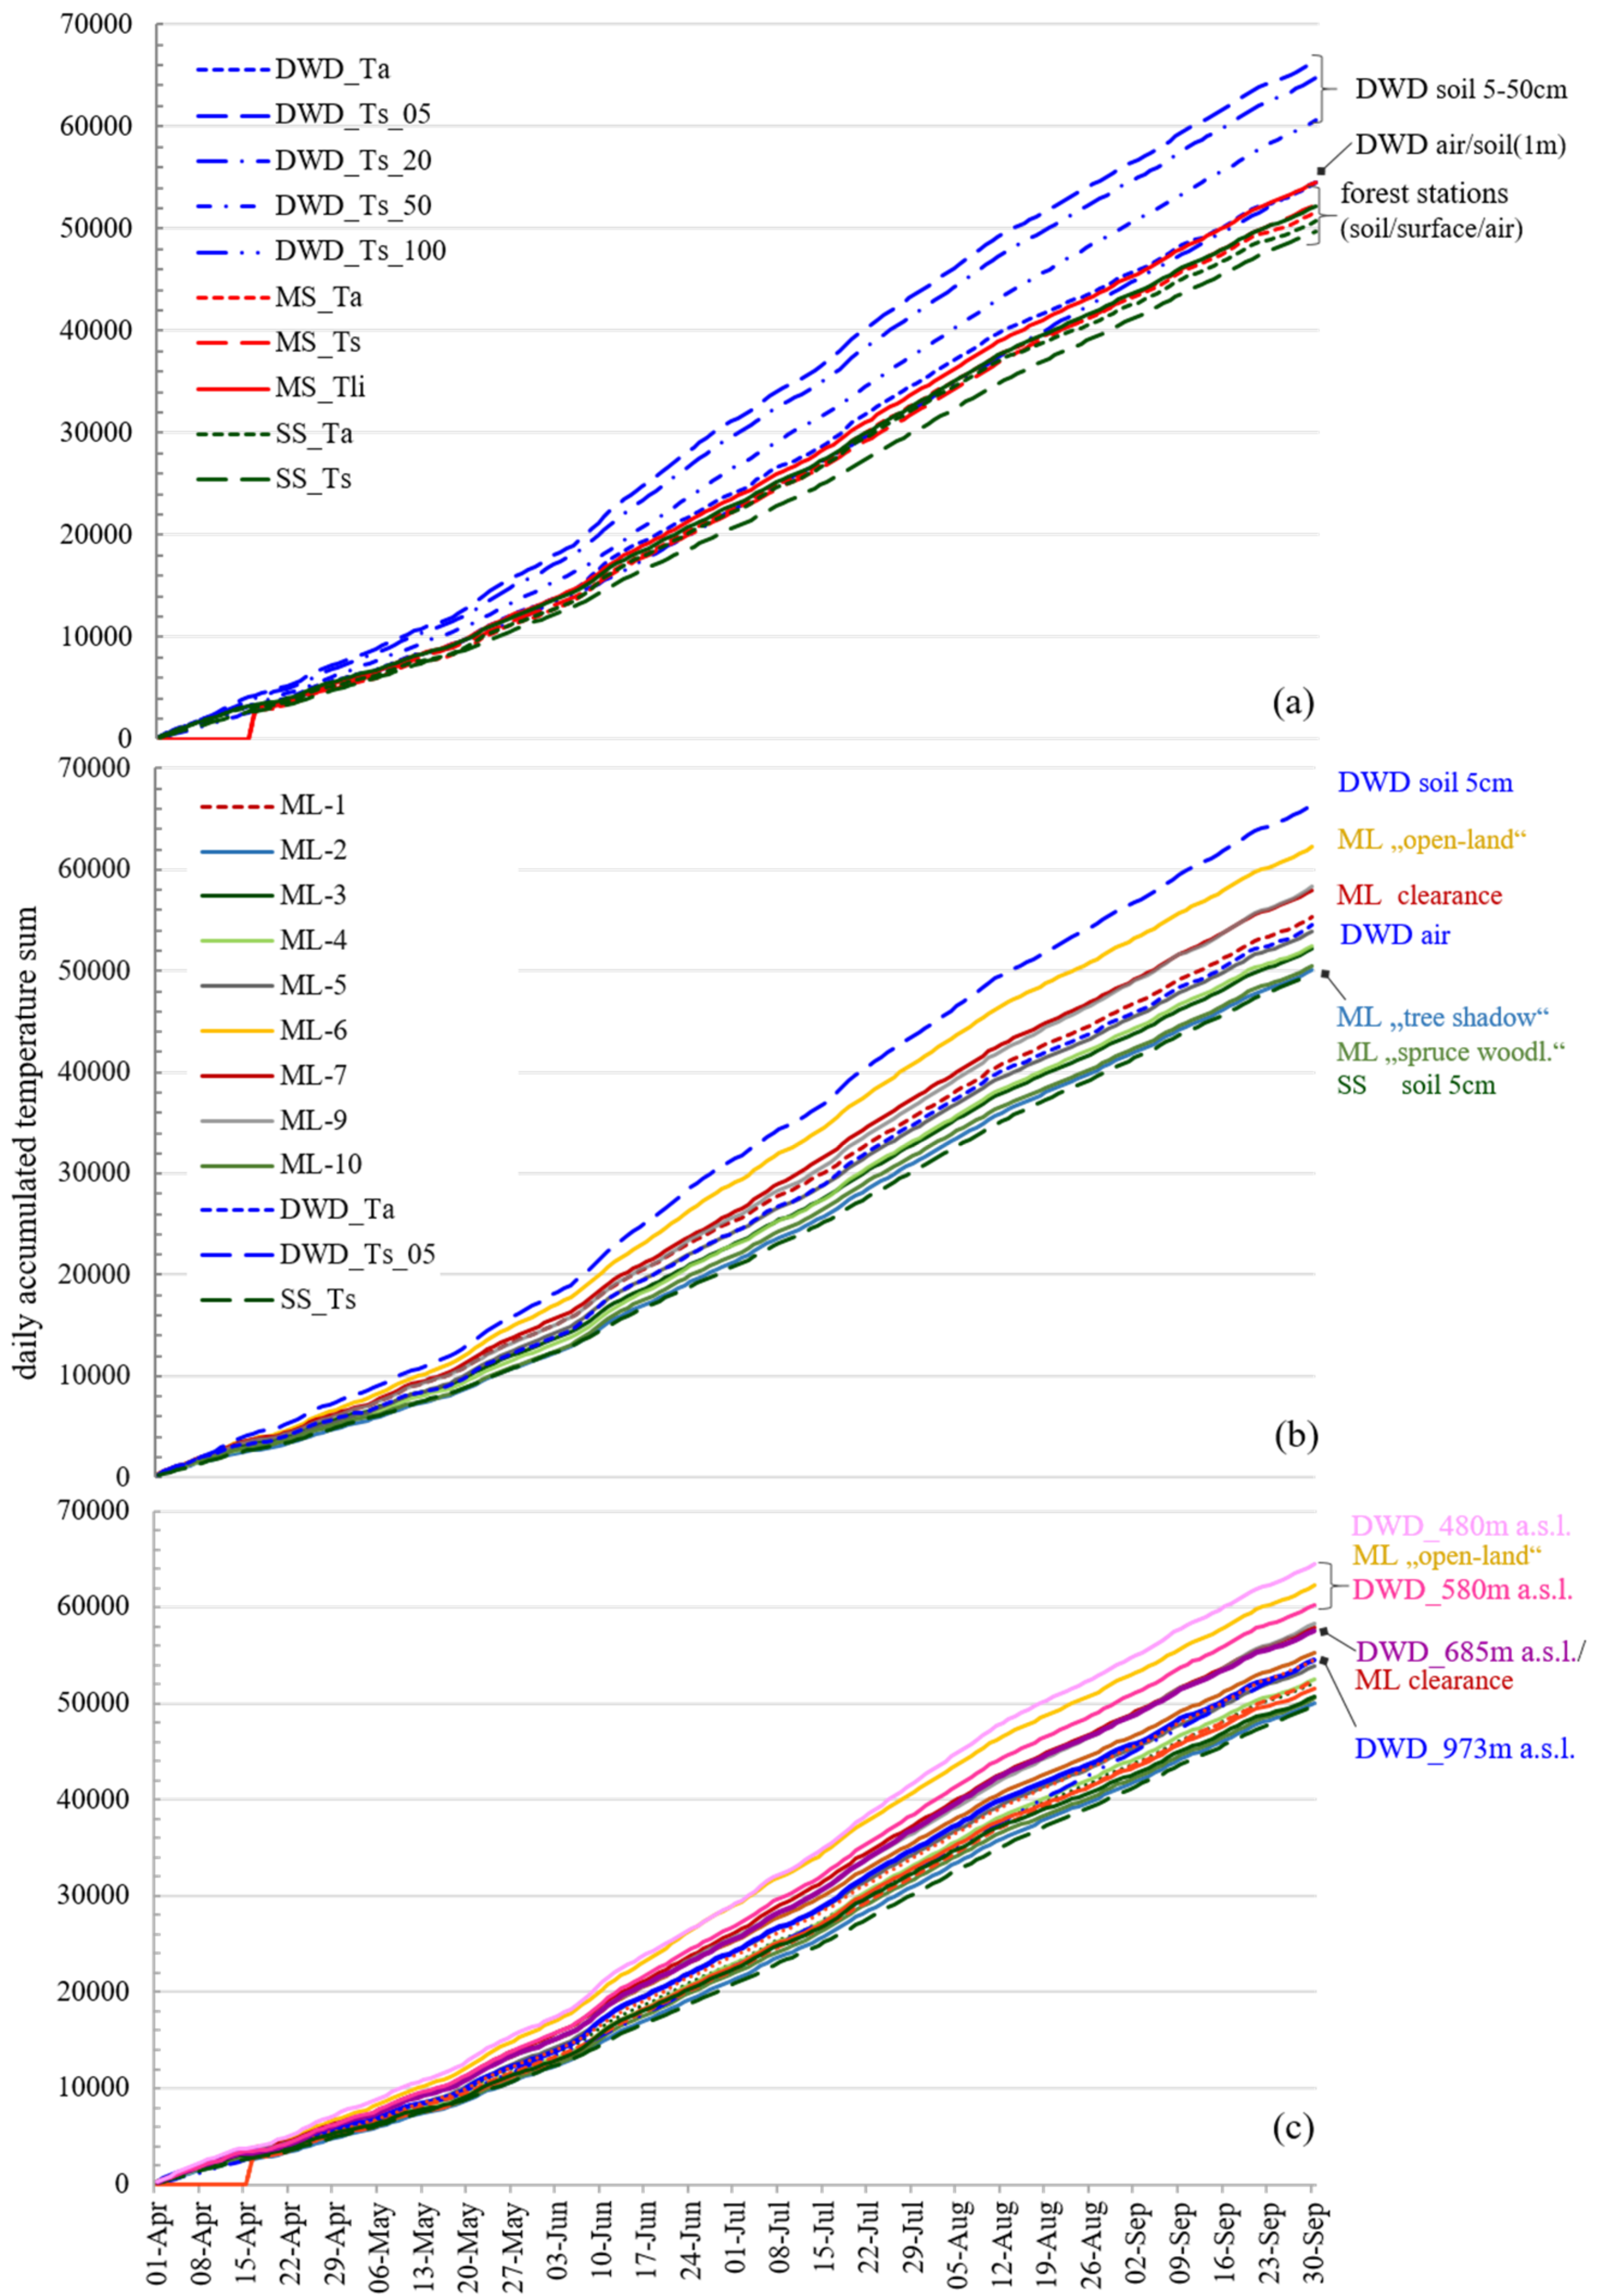
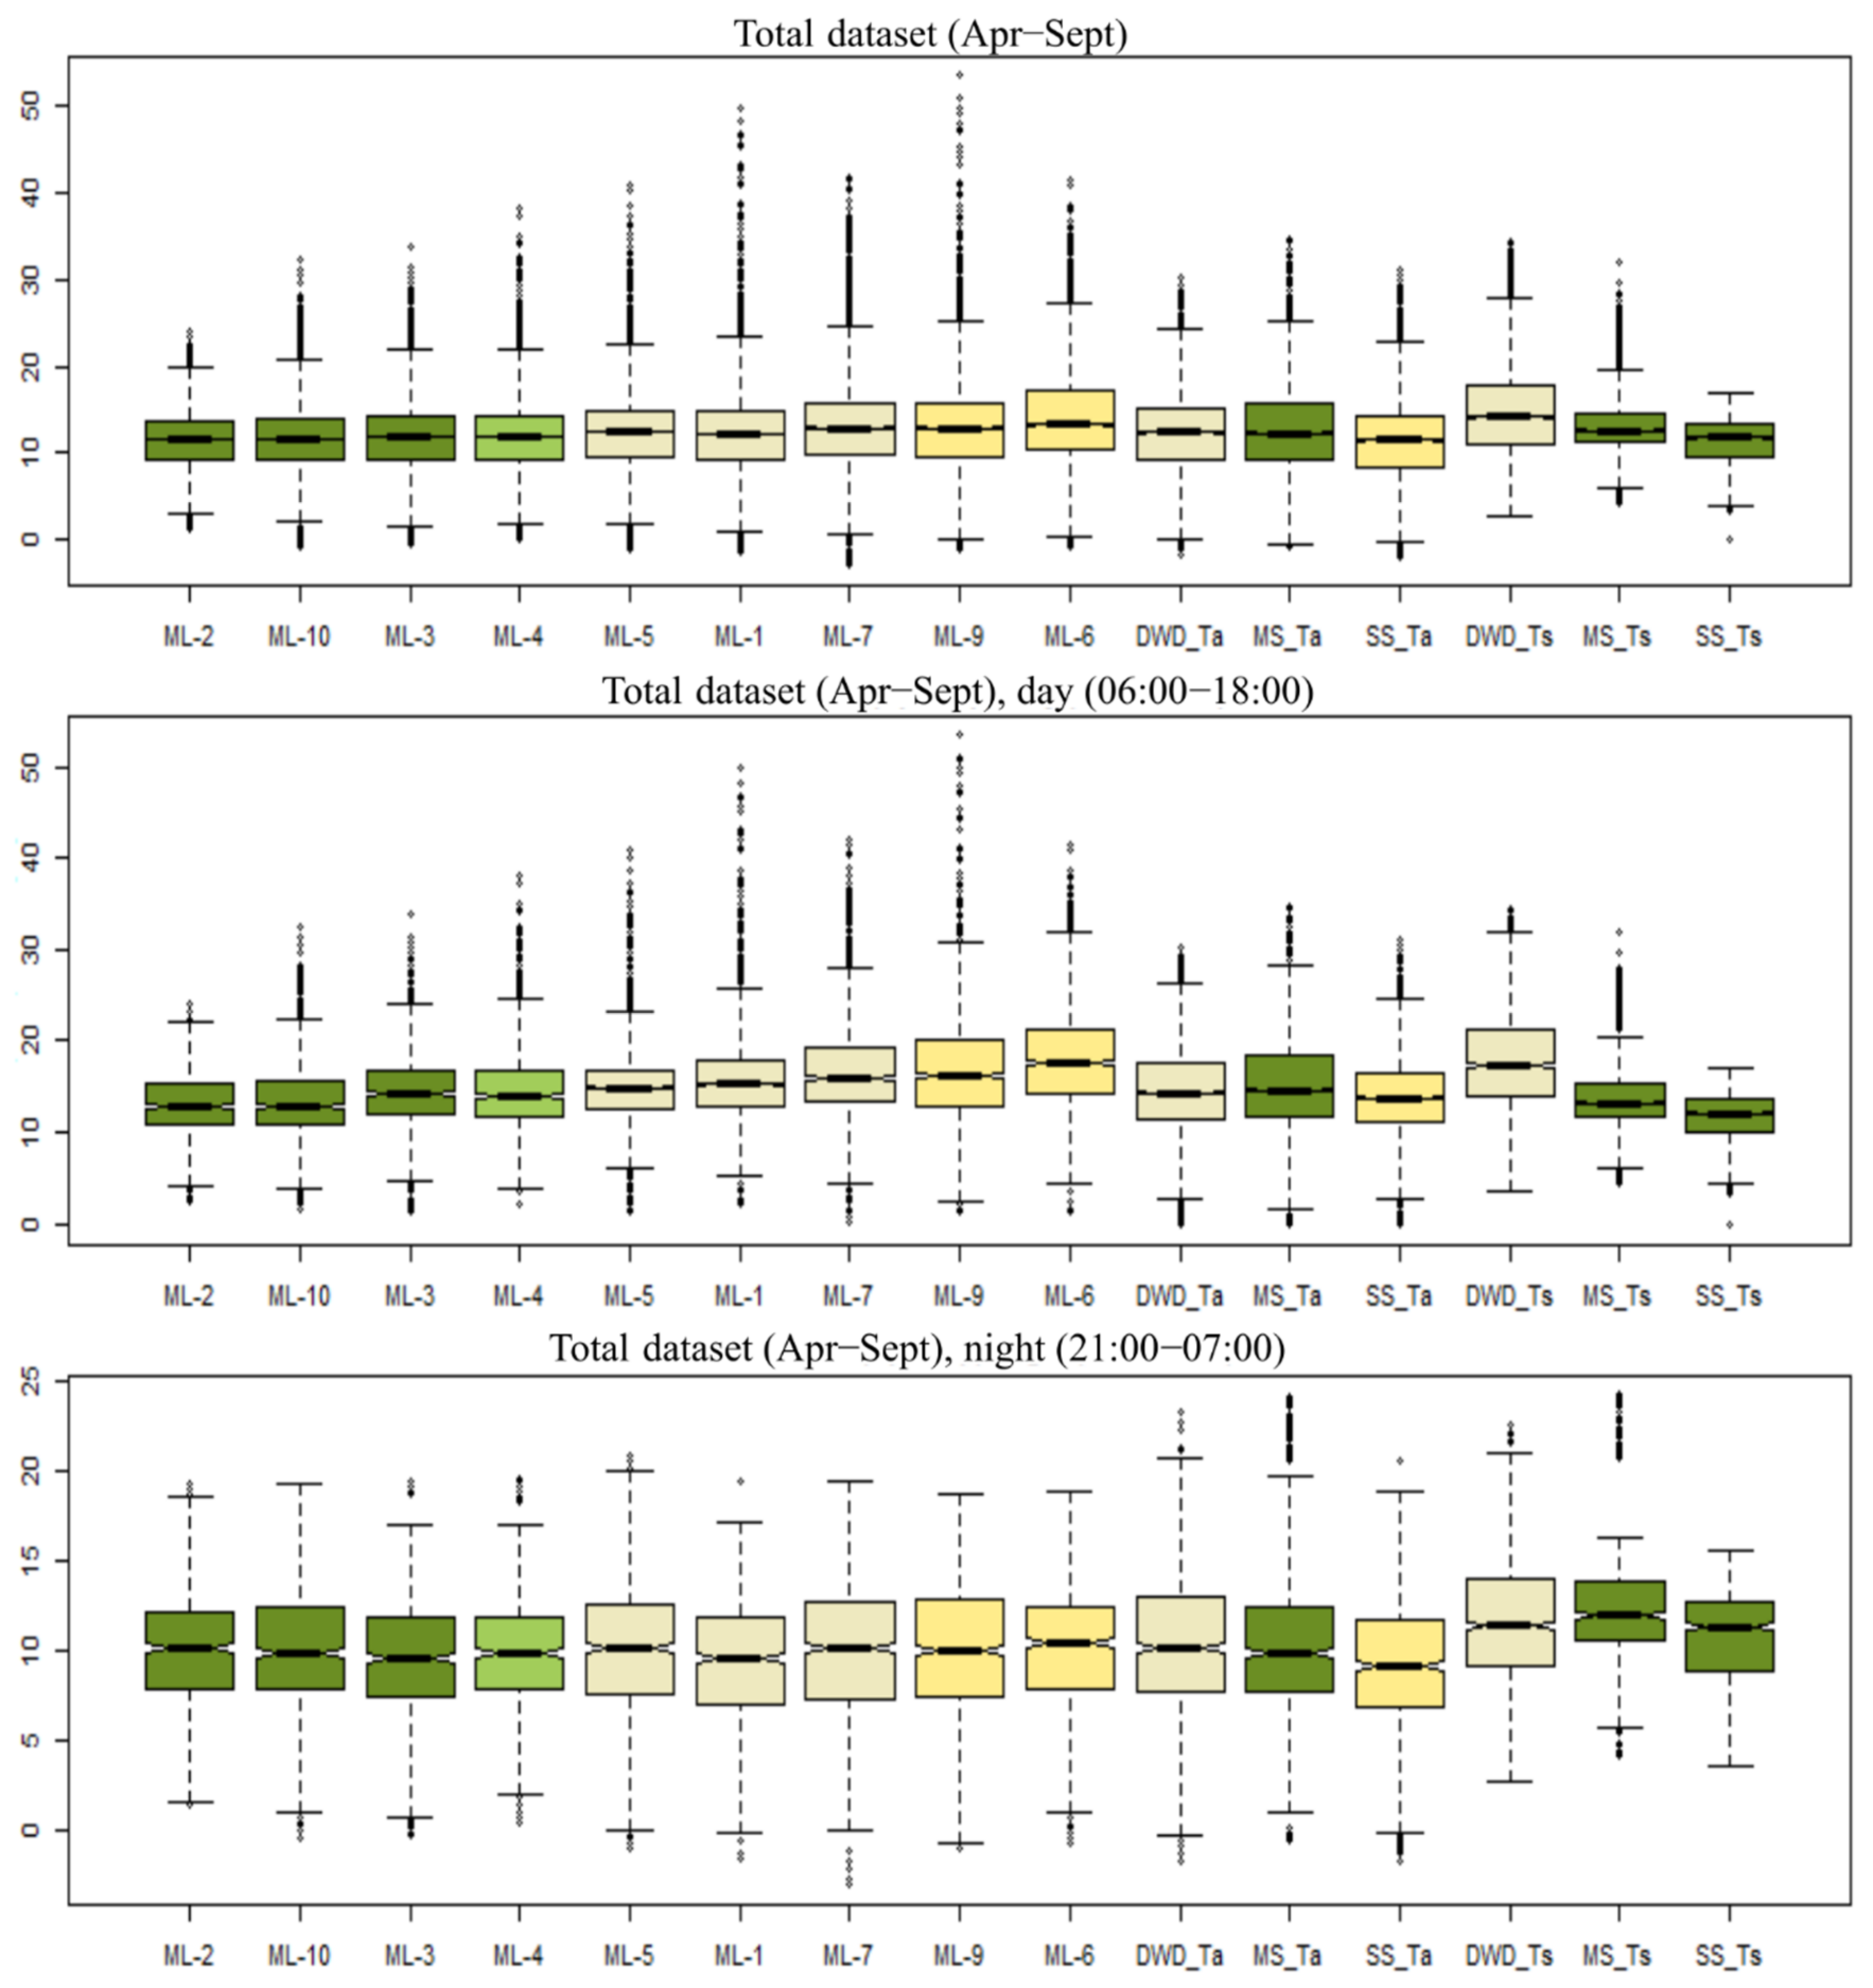
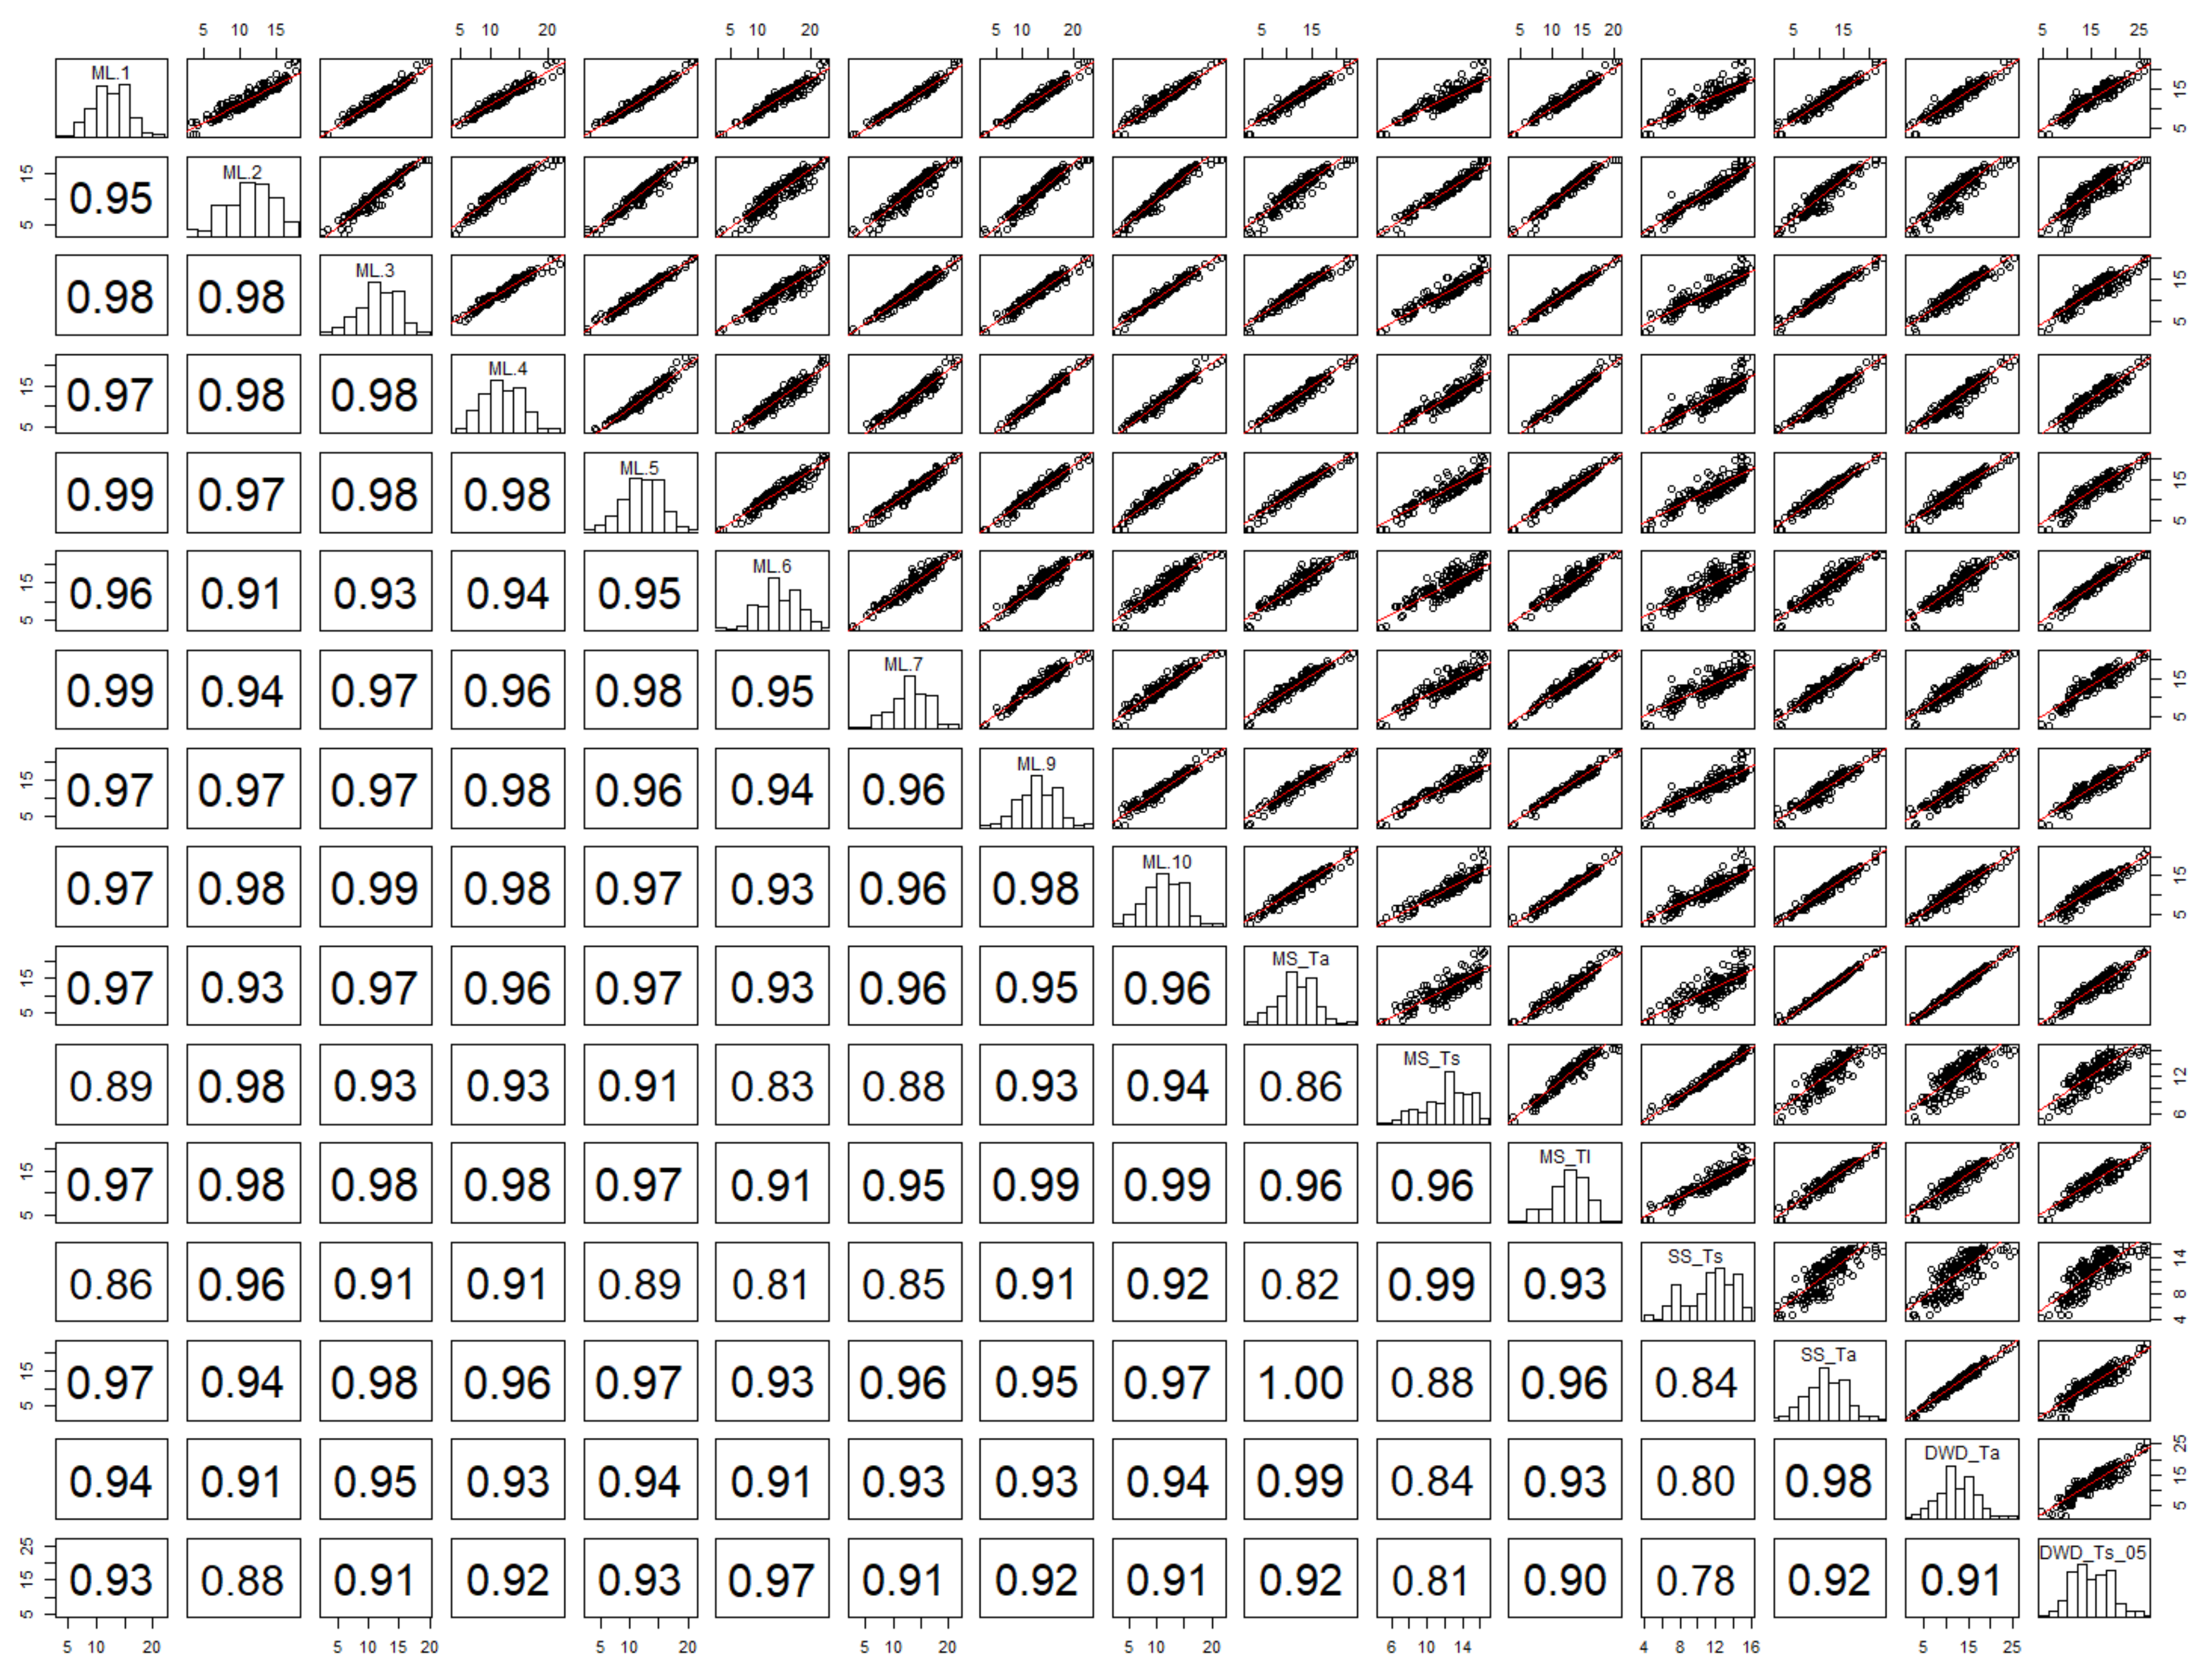
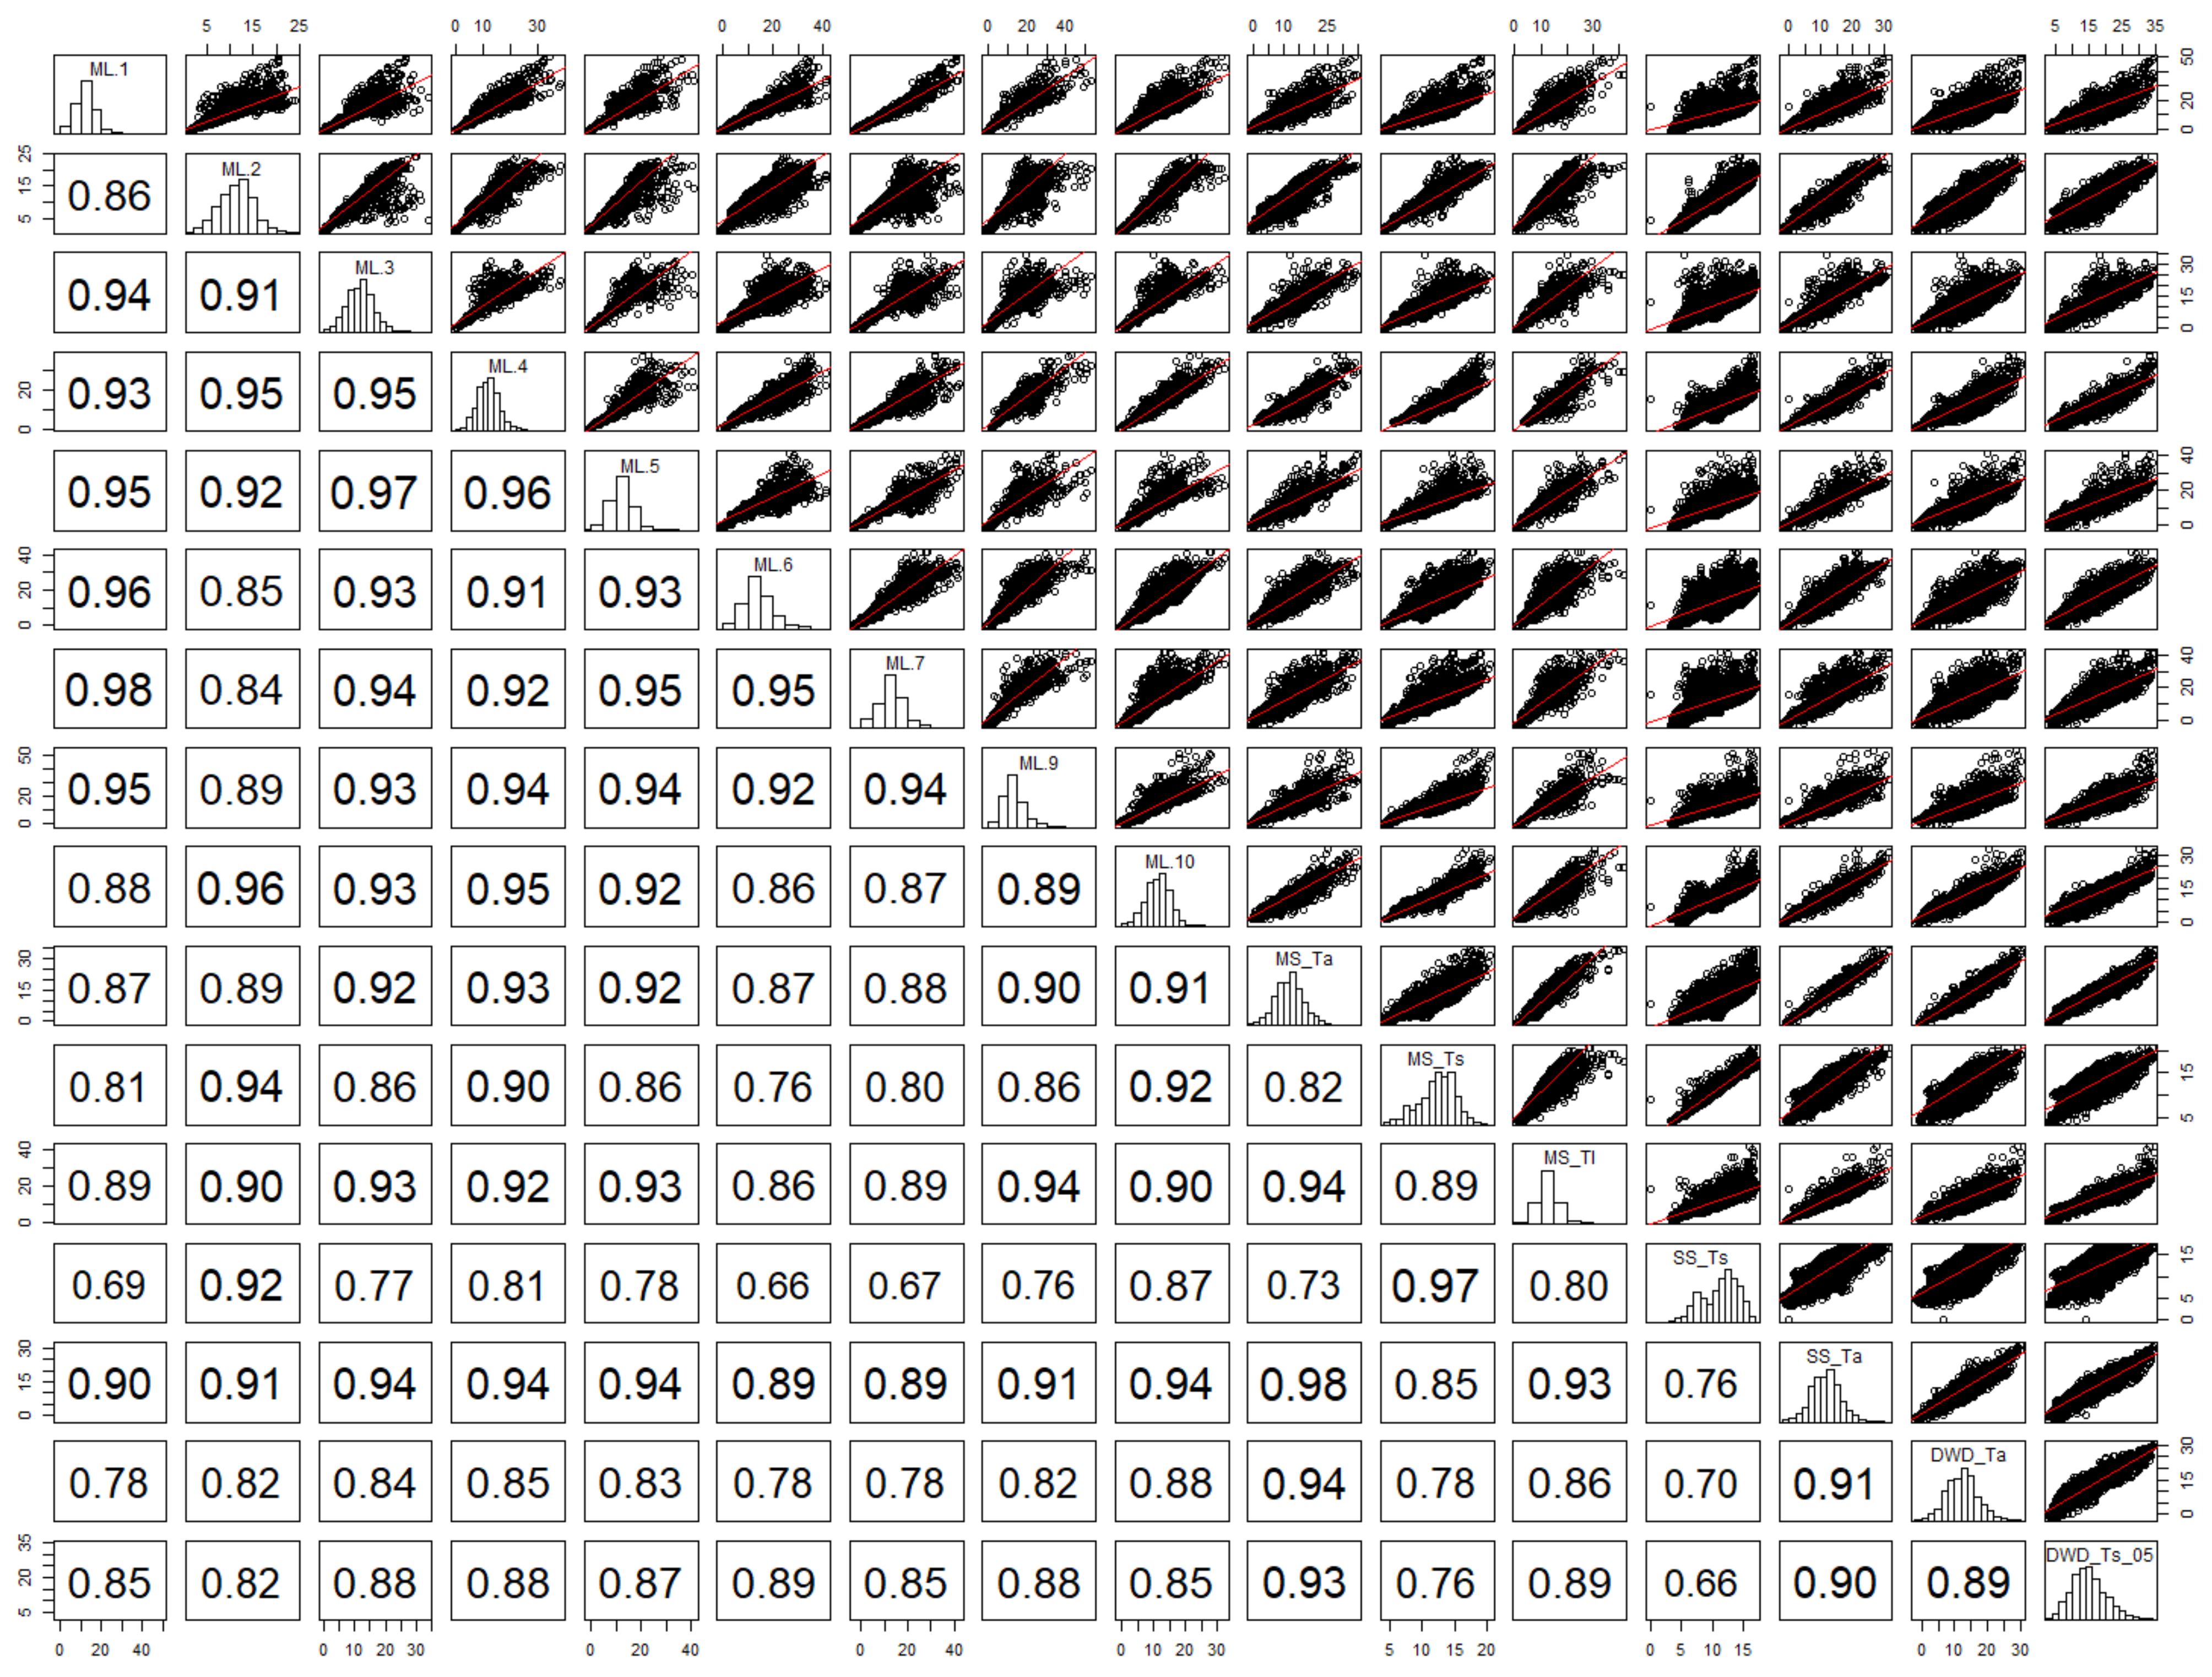
Table 1.
Description of the micro-meteorological stations (MS, SS) and near-surface Micro-Loggers (ML) within the forest.
Table 1.
Description of the micro-meteorological stations (MS, SS) and near-surface Micro-Loggers (ML) within the forest.
| Log-ID | Type | Medium | Location |
|---|---|---|---|
| Medium Station (MS) | Micrometerol. station | Air (50 cm) | “Small clearing”: a small oval-shaped clearing (~20 m W-E, 10 m N-S) in the forest, surrounded by tall conifers (spruce, fir; ~15–20 m) with trunk diameters up to 50 cm, and smaller trees (spruce, fir, beech). Station positioned centrally (N-S)/west. Thin leaf litter (~3 cm). |
| Soil (−5 cm) | |||
| Leaf litter | |||
| Small Station (SS) | Micrometeorol. station | Air (50 cm) | Same clearing as MS, but positioned in the southeastern area, directly in the tree shade of a large fir (=“N-exposed”). |
| Soil (−5 cm) | |||
| ML–1 | Micro-Logger System-1 | Grass | “Wide clearing”: clearing ca. 50 m diameter, station located central/north |
| ML–2 | Moss | “Tree shadow”: at the base of a large fir tree, adjacent to “small clearing” | |
| ML–3 | Moss | “Small Station”: extends the SS with a near-surface sensor | |
| ML–4 | Leaf litter | “Beeches”: a group of small beeches (3–4 m) near the “small clearing” | |
| ML–5 | Grass | “Wayside”: on the west side of a forest path | |
| ML–6 | Grass | “Open-land”: on a large meadow, between the forest and official weather station | |
| ML–7 | Micro-Logger System-2 | Grass | “Wide clearing”: directly next to ML-1 |
| ML–8 | Moss | “Tree shadow”: directly next to ML-2 (data from 1–15 Apr.) | |
| ML–9 | Moss | “Small clearing”: central, near Medium Station, afternoon sun | |
| ML–10 | Moss | “Spruce woodland”: homogeneous old spruce stand, about 15 m high, in narrow rows |
Table 2.
Monthly weather characteristics of the nearby DWD weather station “Klippeneck” in 2014. The deviation from the long-term average is given in Kelvin (K).
Table 2.
Monthly weather characteristics of the nearby DWD weather station “Klippeneck” in 2014. The deviation from the long-term average is given in Kelvin (K).
| Sun Dur (h) | Cloudiness | Rainy Days | Temp2014 (°C) | t2014–t1981–2010 (K) | |
|---|---|---|---|---|---|
| April | 153 | 5.6 | 37% | 8.32 | 2.62 |
| May | 173 | 5.8 | 48% | 9.7 | −0.5 |
| June | 256 | 4.7 | 37% | 14.95 | 1.75 |
| July | 157 | 5.8 | 65% | 15.53 | −0.27 |
| August | 140 | 6.2 | 52% | 13.28 | −1.92 |
| September | 140 | 5.5 | 37% | 12.66 | 0.86 |
Table 3.
Descriptive statistics of hourly temperature data measured near the soil surface at the Micro-Loggers (ML-1 to ML.-10), and in the air at the nearby official weather station (DWD_ta, 2 m) and at two stations within the forest (MS/SS_Ta, 50 cm).
Table 3.
Descriptive statistics of hourly temperature data measured near the soil surface at the Micro-Loggers (ML-1 to ML.-10), and in the air at the nearby official weather station (DWD_ta, 2 m) and at two stations within the forest (MS/SS_Ta, 50 cm).
| ML-1 to ML-10 | DWD_Ta, MS_Ta, SS_Ta | |||||
|---|---|---|---|---|---|---|
| Mean (Min to Max) | Max | Min | Mean | Max | Min | |
| Apr | 8.7 (6.9–9.6) | 17.1–35.2 | −3.0–1.4 | 8.3/—/7.6 | 18.6/29.3/18.8 | −1.8/−0.8/−2.0 |
| May | 10.3 (8.7–12.4) | 18.9–41.9 | −0.1–3.7 | 9.7/9.3/9.1 | 23.8/25.2/23.7 | 1.2/0.9/0.8 |
| Jun | 14.7 (13.0–17.5) | 24.1–50.9 | 5.7–7.4 | 15.0/14.2/13.8 | 30.3/34.8/31.2 | 6.1/4.9/4.8 |
| Jul | 14.9 (14.3–17.3) | 22.5–54.8 | 5.4–8.2 | 15.5/15.0/14.6 | 29.4/32.9/28.9 | 5.8/6.1/6.0 |
| Aug | 13.6 (13.1–14.8) | 20.2–34.4 | 4.7–8.7 | 13.3/12.6/12.4 | 23.6/24.4/21.9 | 5.8/5.3/5.1 |
| Sep | 14.8 (12.1–15.2) | 16.9–30.7 | 3.1–11.0 | 12.7/12.0/11.7 | 22.5/24.9/20.8 | 1.3/1.5/1.5 |
| Total | 12.5 (11.4–14.2) | 12.4/12.2/11.6 | ||||
Table 4.
Simple linear regressions (y = ax + b) for daily mean values of air (Ta), soil (Ts) and surface-near (ML) temperatures in Apr to Sep 2014 between the official weather station (DWD) and (1) stations inside the forest (MS, SS) or (2) Micro-Loggers inside (ML-2,7,10) and outside (ML-6) the forest. If R2 was higher for DWD_Ts instead of Ta, the model is shown in the table—otherwise not. Positive values for b indicate that the DWD station was, on average, cooler than the compared site.
| y | x | a | b | R2 | |
|---|---|---|---|---|---|
| Daily mean | Ta (MS) | Ta (DWD) | 0.92 | 0.41 | 0.98 *** |
| Ta (SS) | Ta (DWD) | 0.89 | 0.47 | 0.98 *** | |
| Tli (ML-6) | Ta (DWD) | 0.80 | 4.16 | 0.84 *** | |
| Tli (ML-6) | Ts (DWD) | 0.88 | 0.79 | 0.94 *** | |
| Tli (ML-7) | Ta (DWD) | 0.76 | 3.81 | 0.94 *** | |
| Tli (ML-10) | Ta (DWD) | 0.77 | 1.94 | 0.91 *** | |
| Tli (ML-2) | Ta (DWD) | 0.67 | 3.08 | 0.82 *** |
a,b = regression coefficients; R2 = coefficient of determination; *** level of significance = 0.
Publisher’s Note: MDPI stays neutral with regard to jurisdictional claims in published maps and institutional affiliations. |
© 2021 by the author. Licensee MDPI, Basel, Switzerland. This article is an open access article distributed under the terms and conditions of the Creative Commons Attribution (CC BY) license (https://creativecommons.org/licenses/by/4.0/).
Share and Cite
MDPI and ACS Style
Boehnke, D. Exploring the Thermal Microcosms at the Forest Floor—A Case Study of a Temperate Forest. Atmosphere 2021, 12, 503. https://doi.org/10.3390/atmos12040503
AMA Style
Boehnke D. Exploring the Thermal Microcosms at the Forest Floor—A Case Study of a Temperate Forest. Atmosphere. 2021; 12(4):503. https://doi.org/10.3390/atmos12040503
Chicago/Turabian StyleBoehnke, Denise. 2021. "Exploring the Thermal Microcosms at the Forest Floor—A Case Study of a Temperate Forest" Atmosphere 12, no. 4: 503. https://doi.org/10.3390/atmos12040503
Note that from the first issue of 2016, this journal uses article numbers instead of page numbers. See further details here.