
Impact Study of FY-3B MWRI Data Assimilation in WRFDA

Abstract
:1. Introduction
2. Model and Data
2.1. WRFDA System
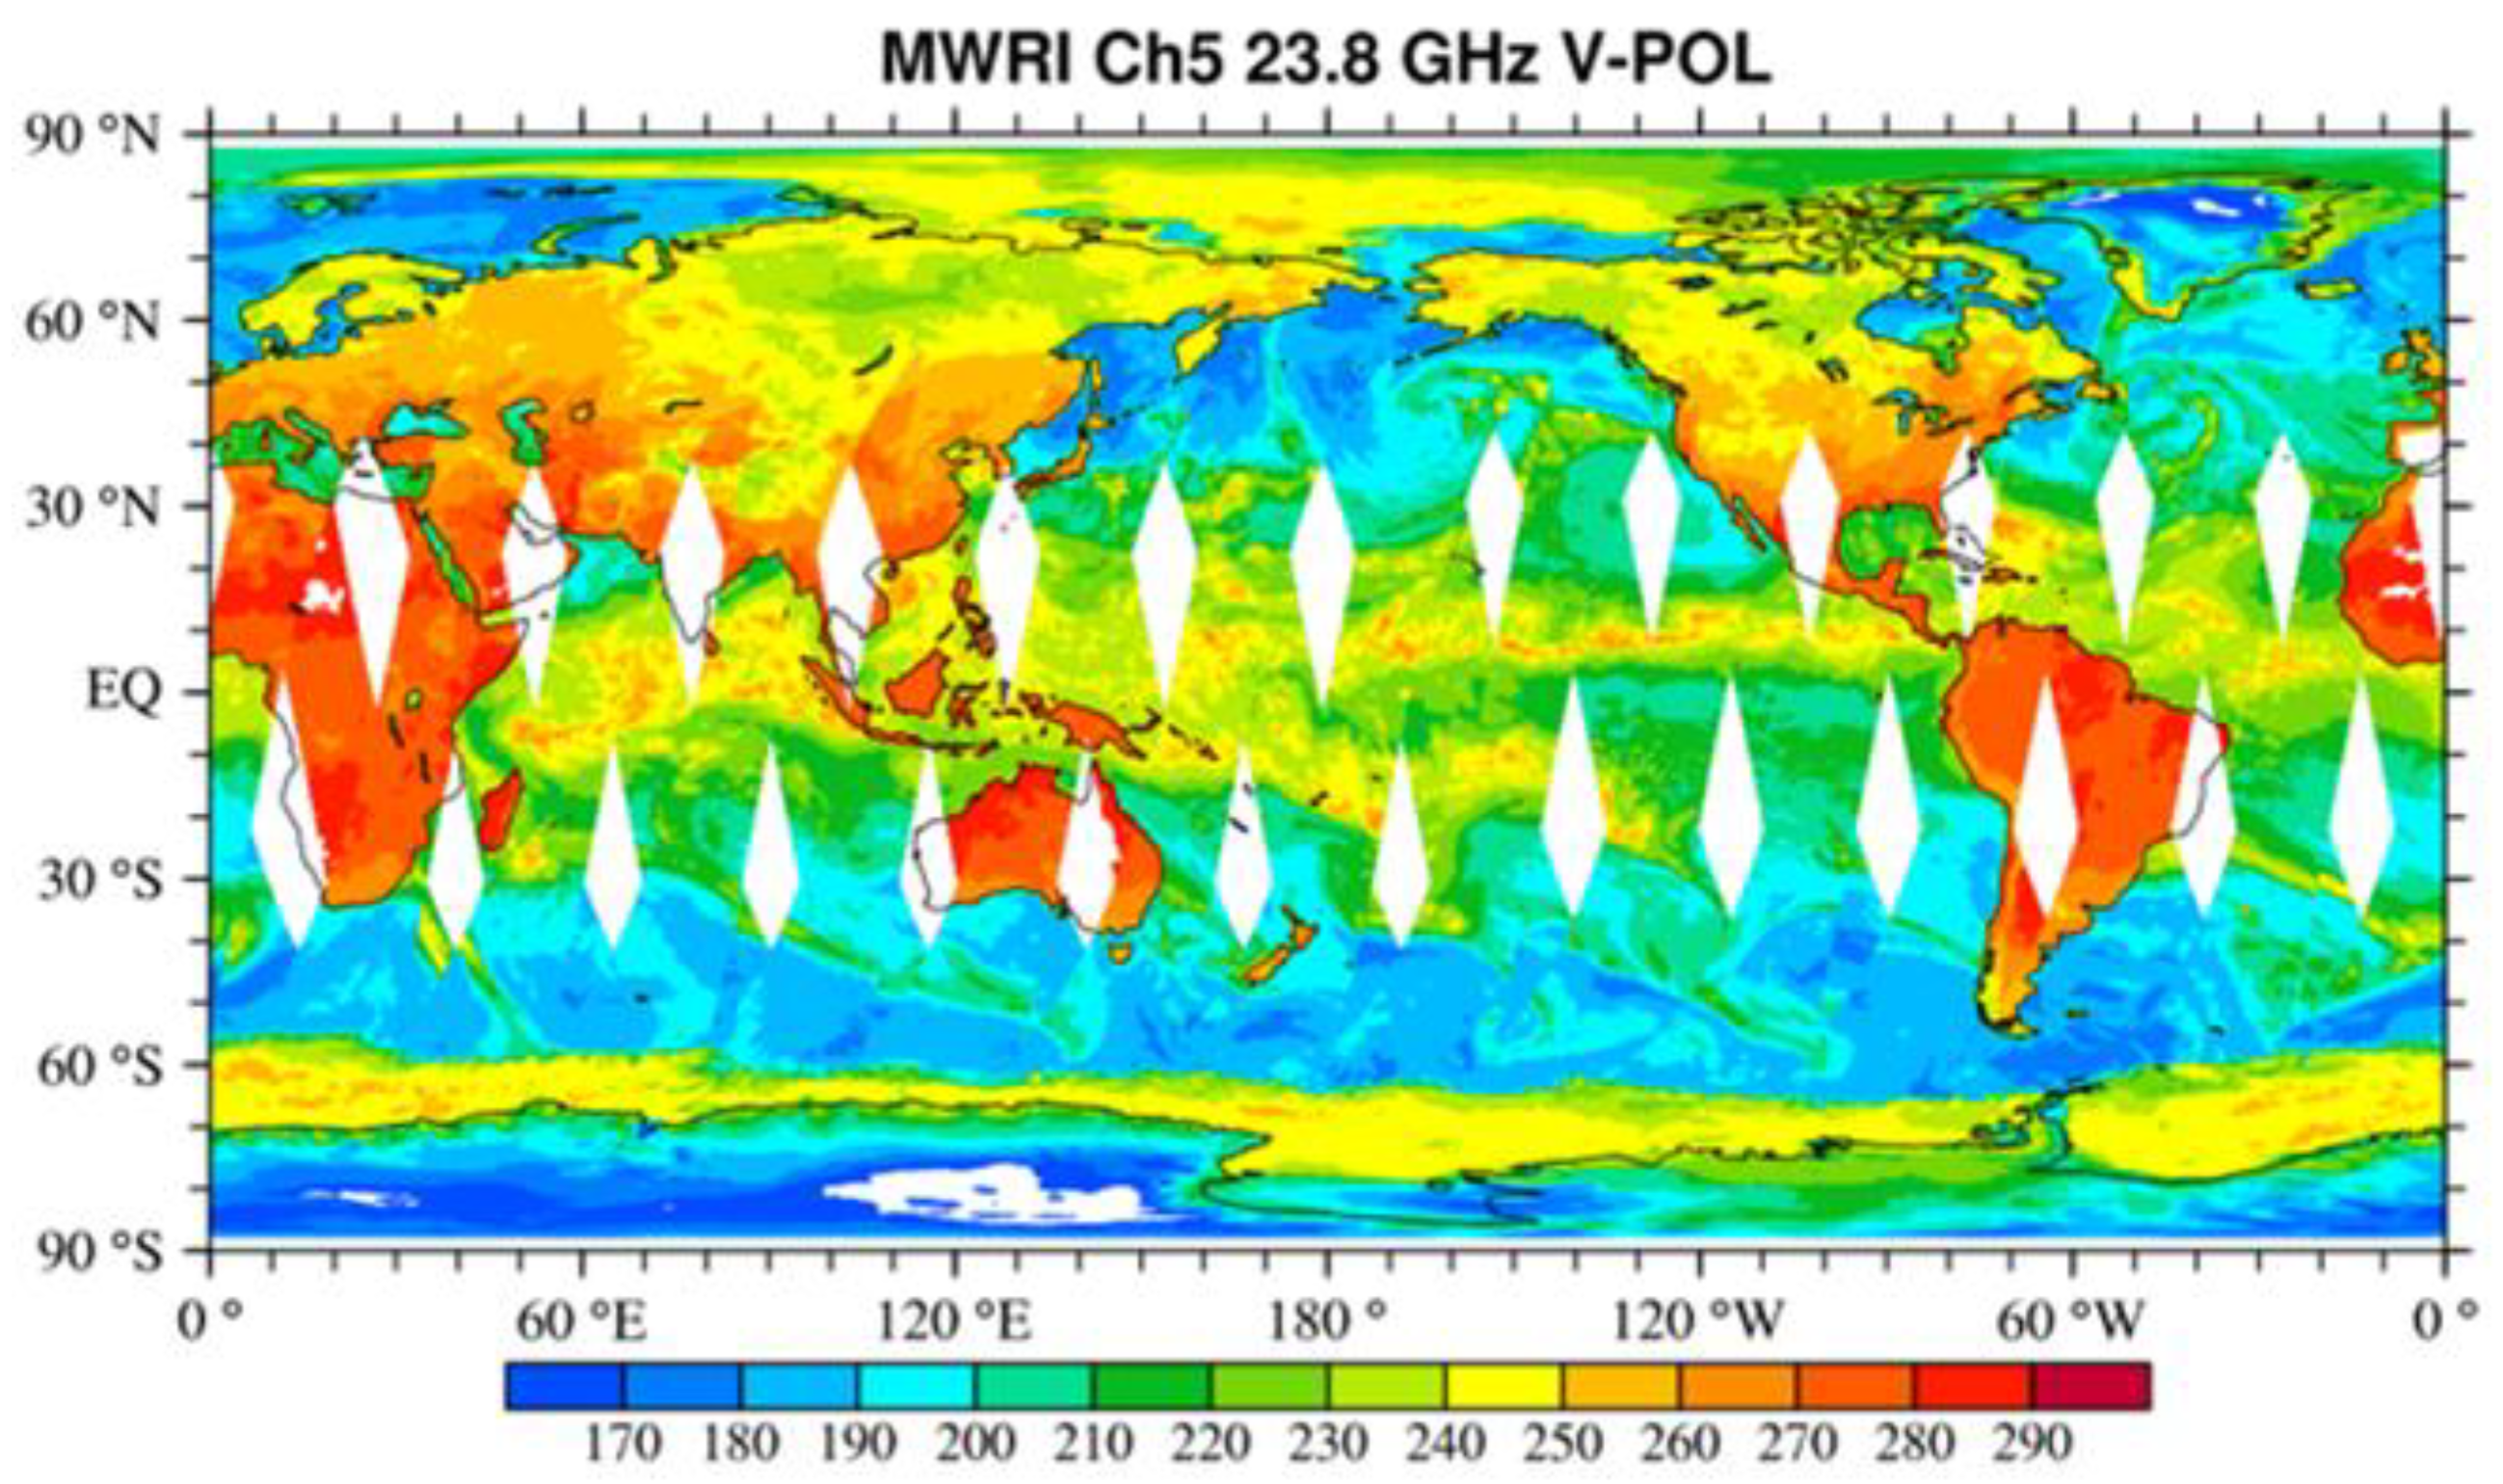
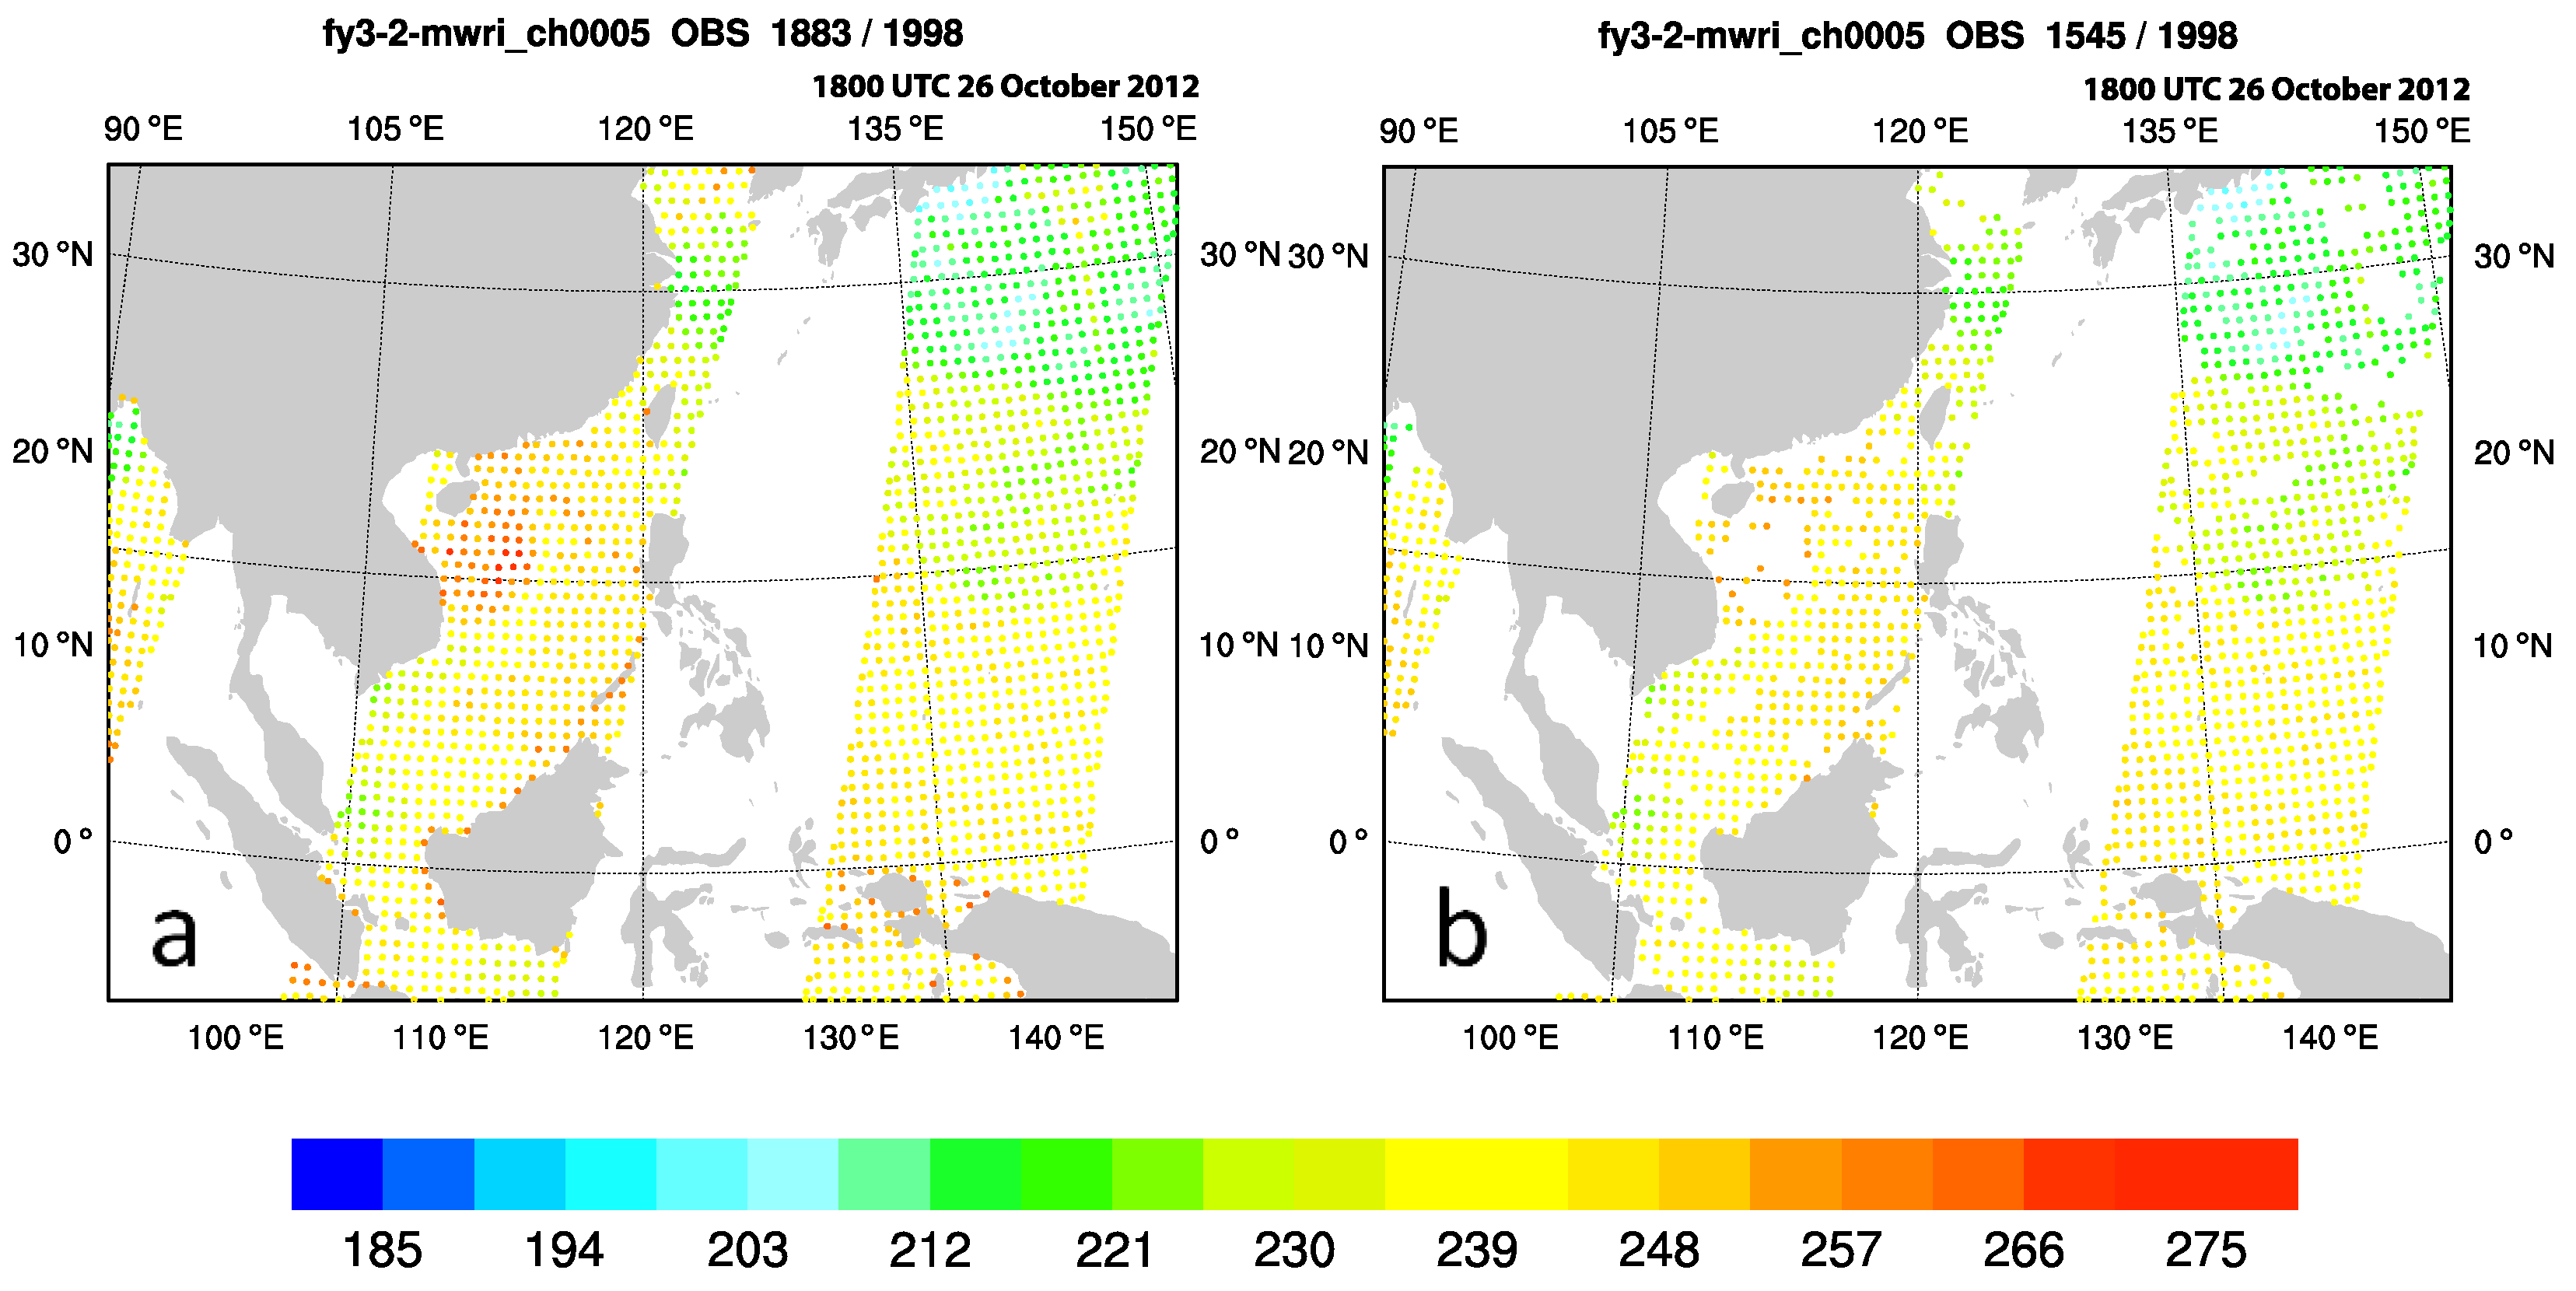
2.2. MWRI Data
2.3. Quality Control
3. Experimental Setup
- The control experiment (CTL), which only made a single forecast from the start time to the end with no data assimilation.
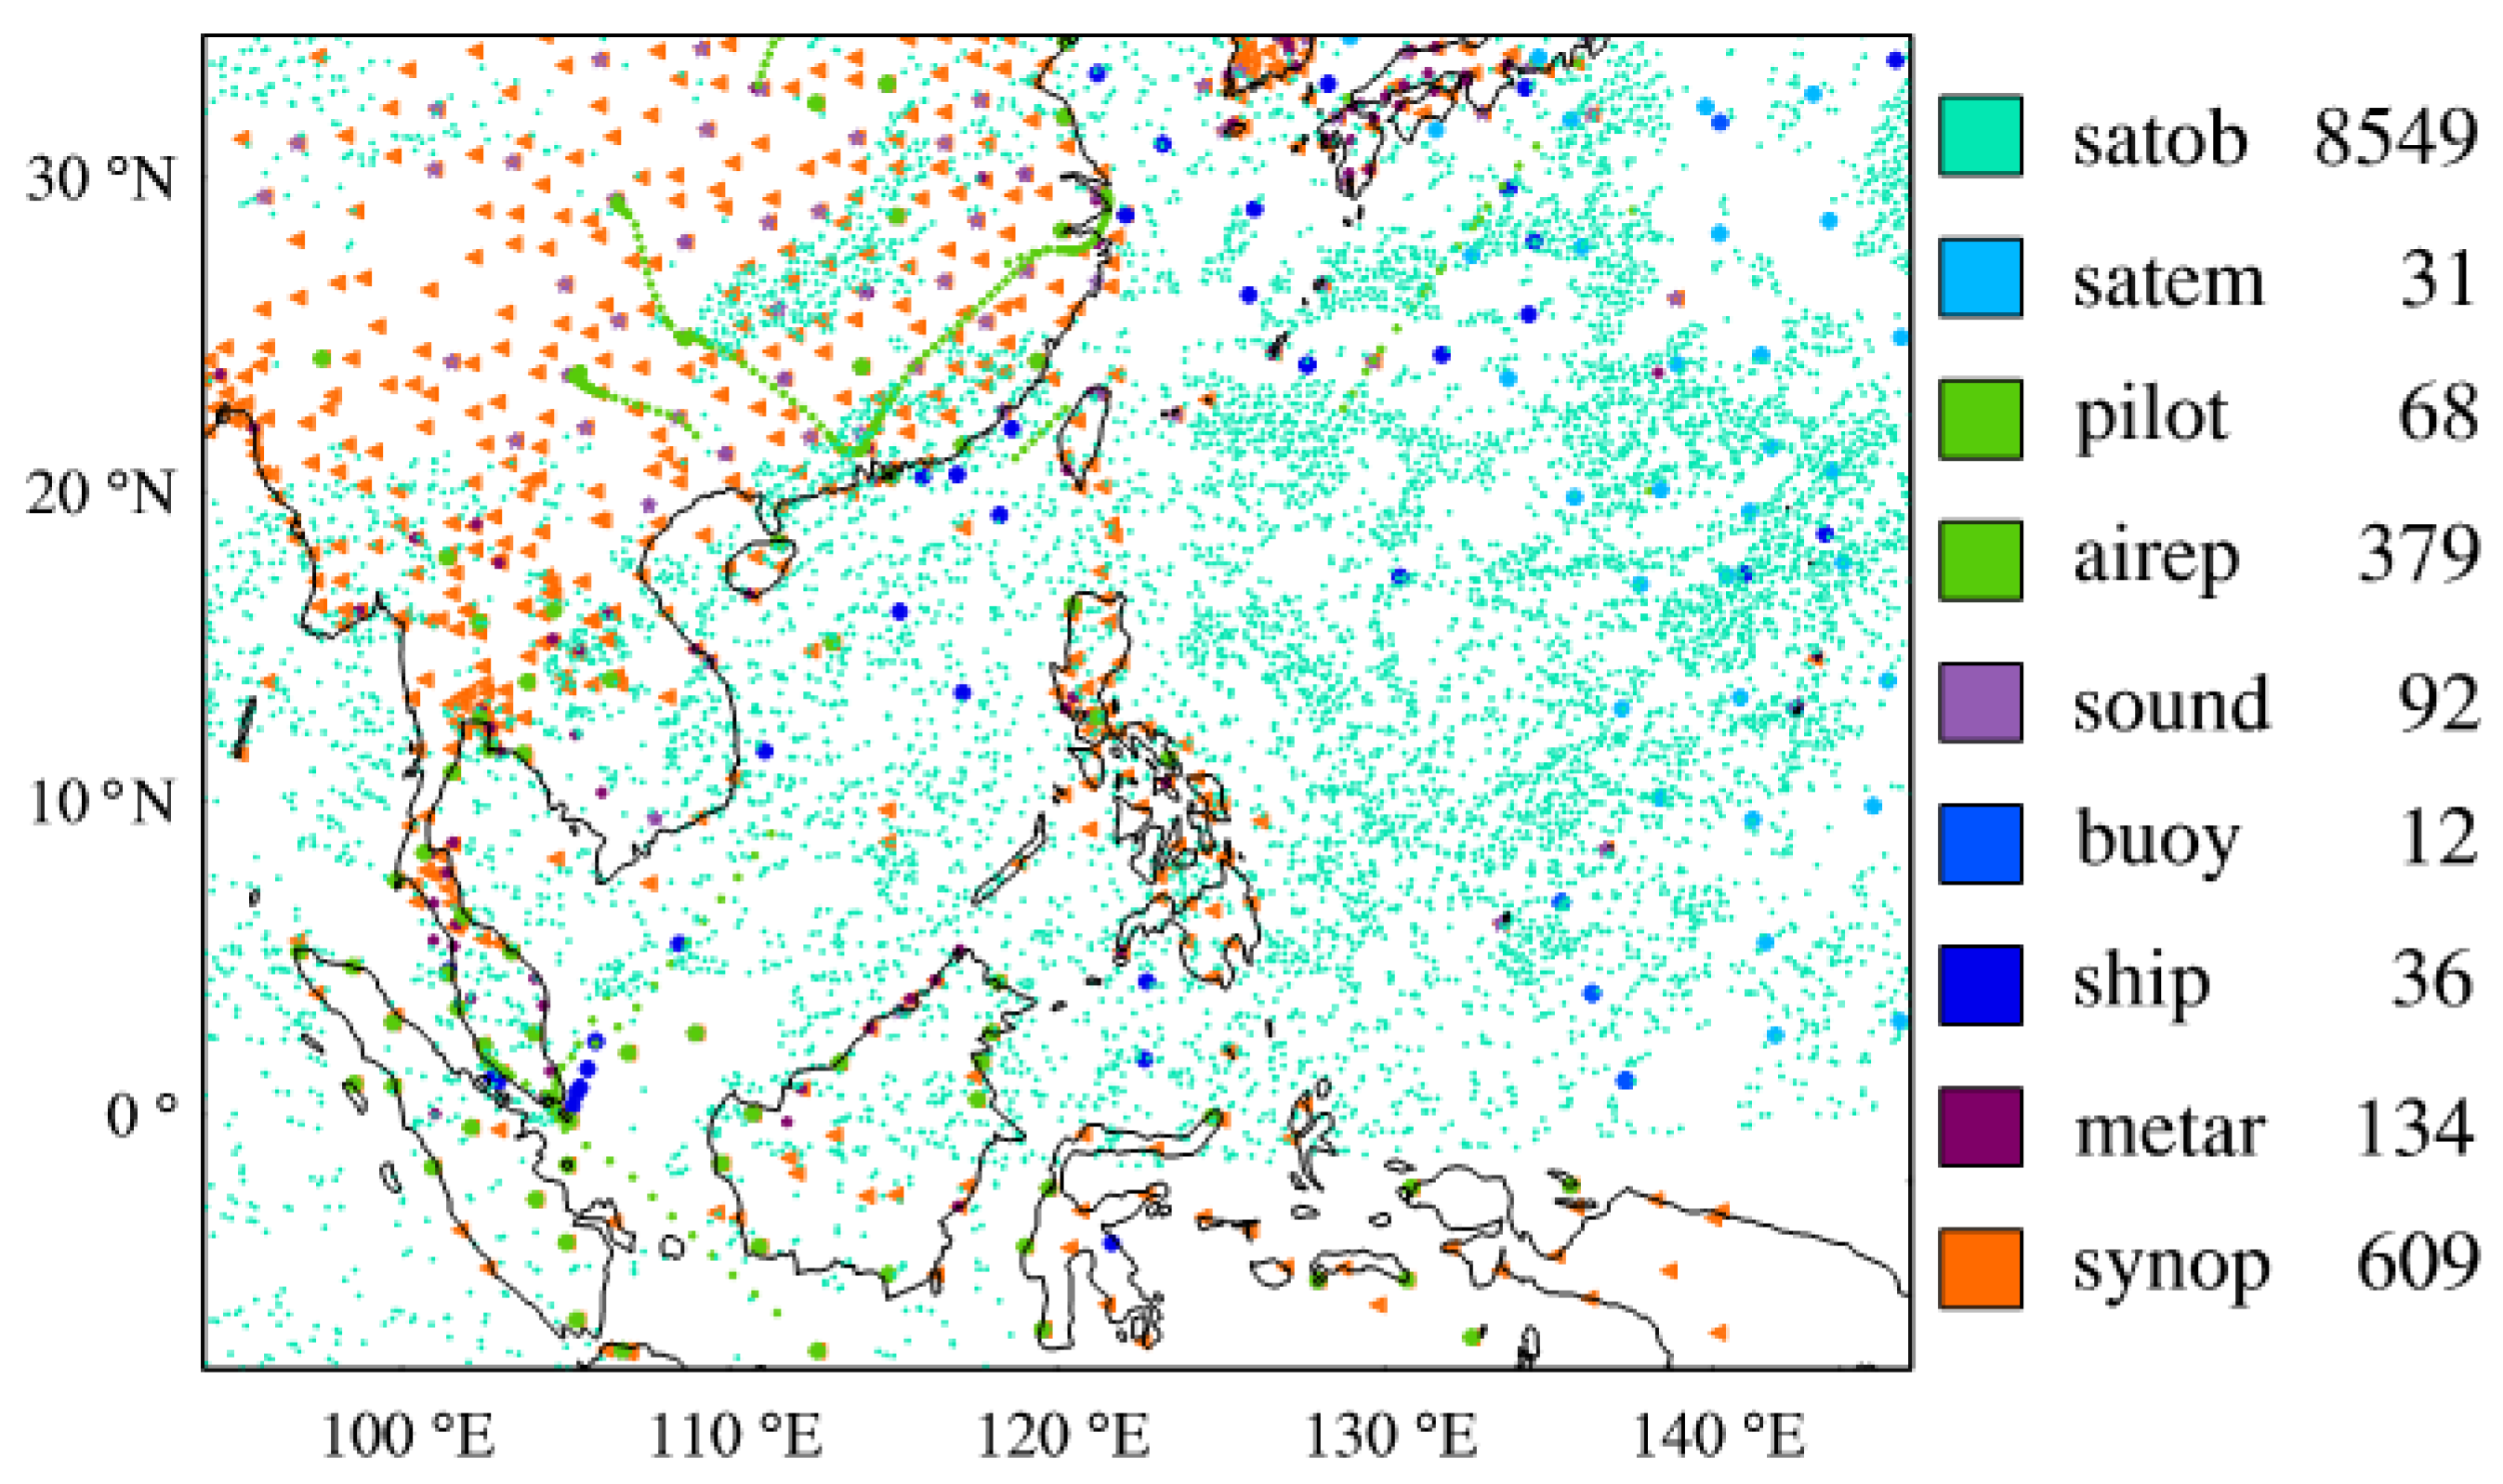
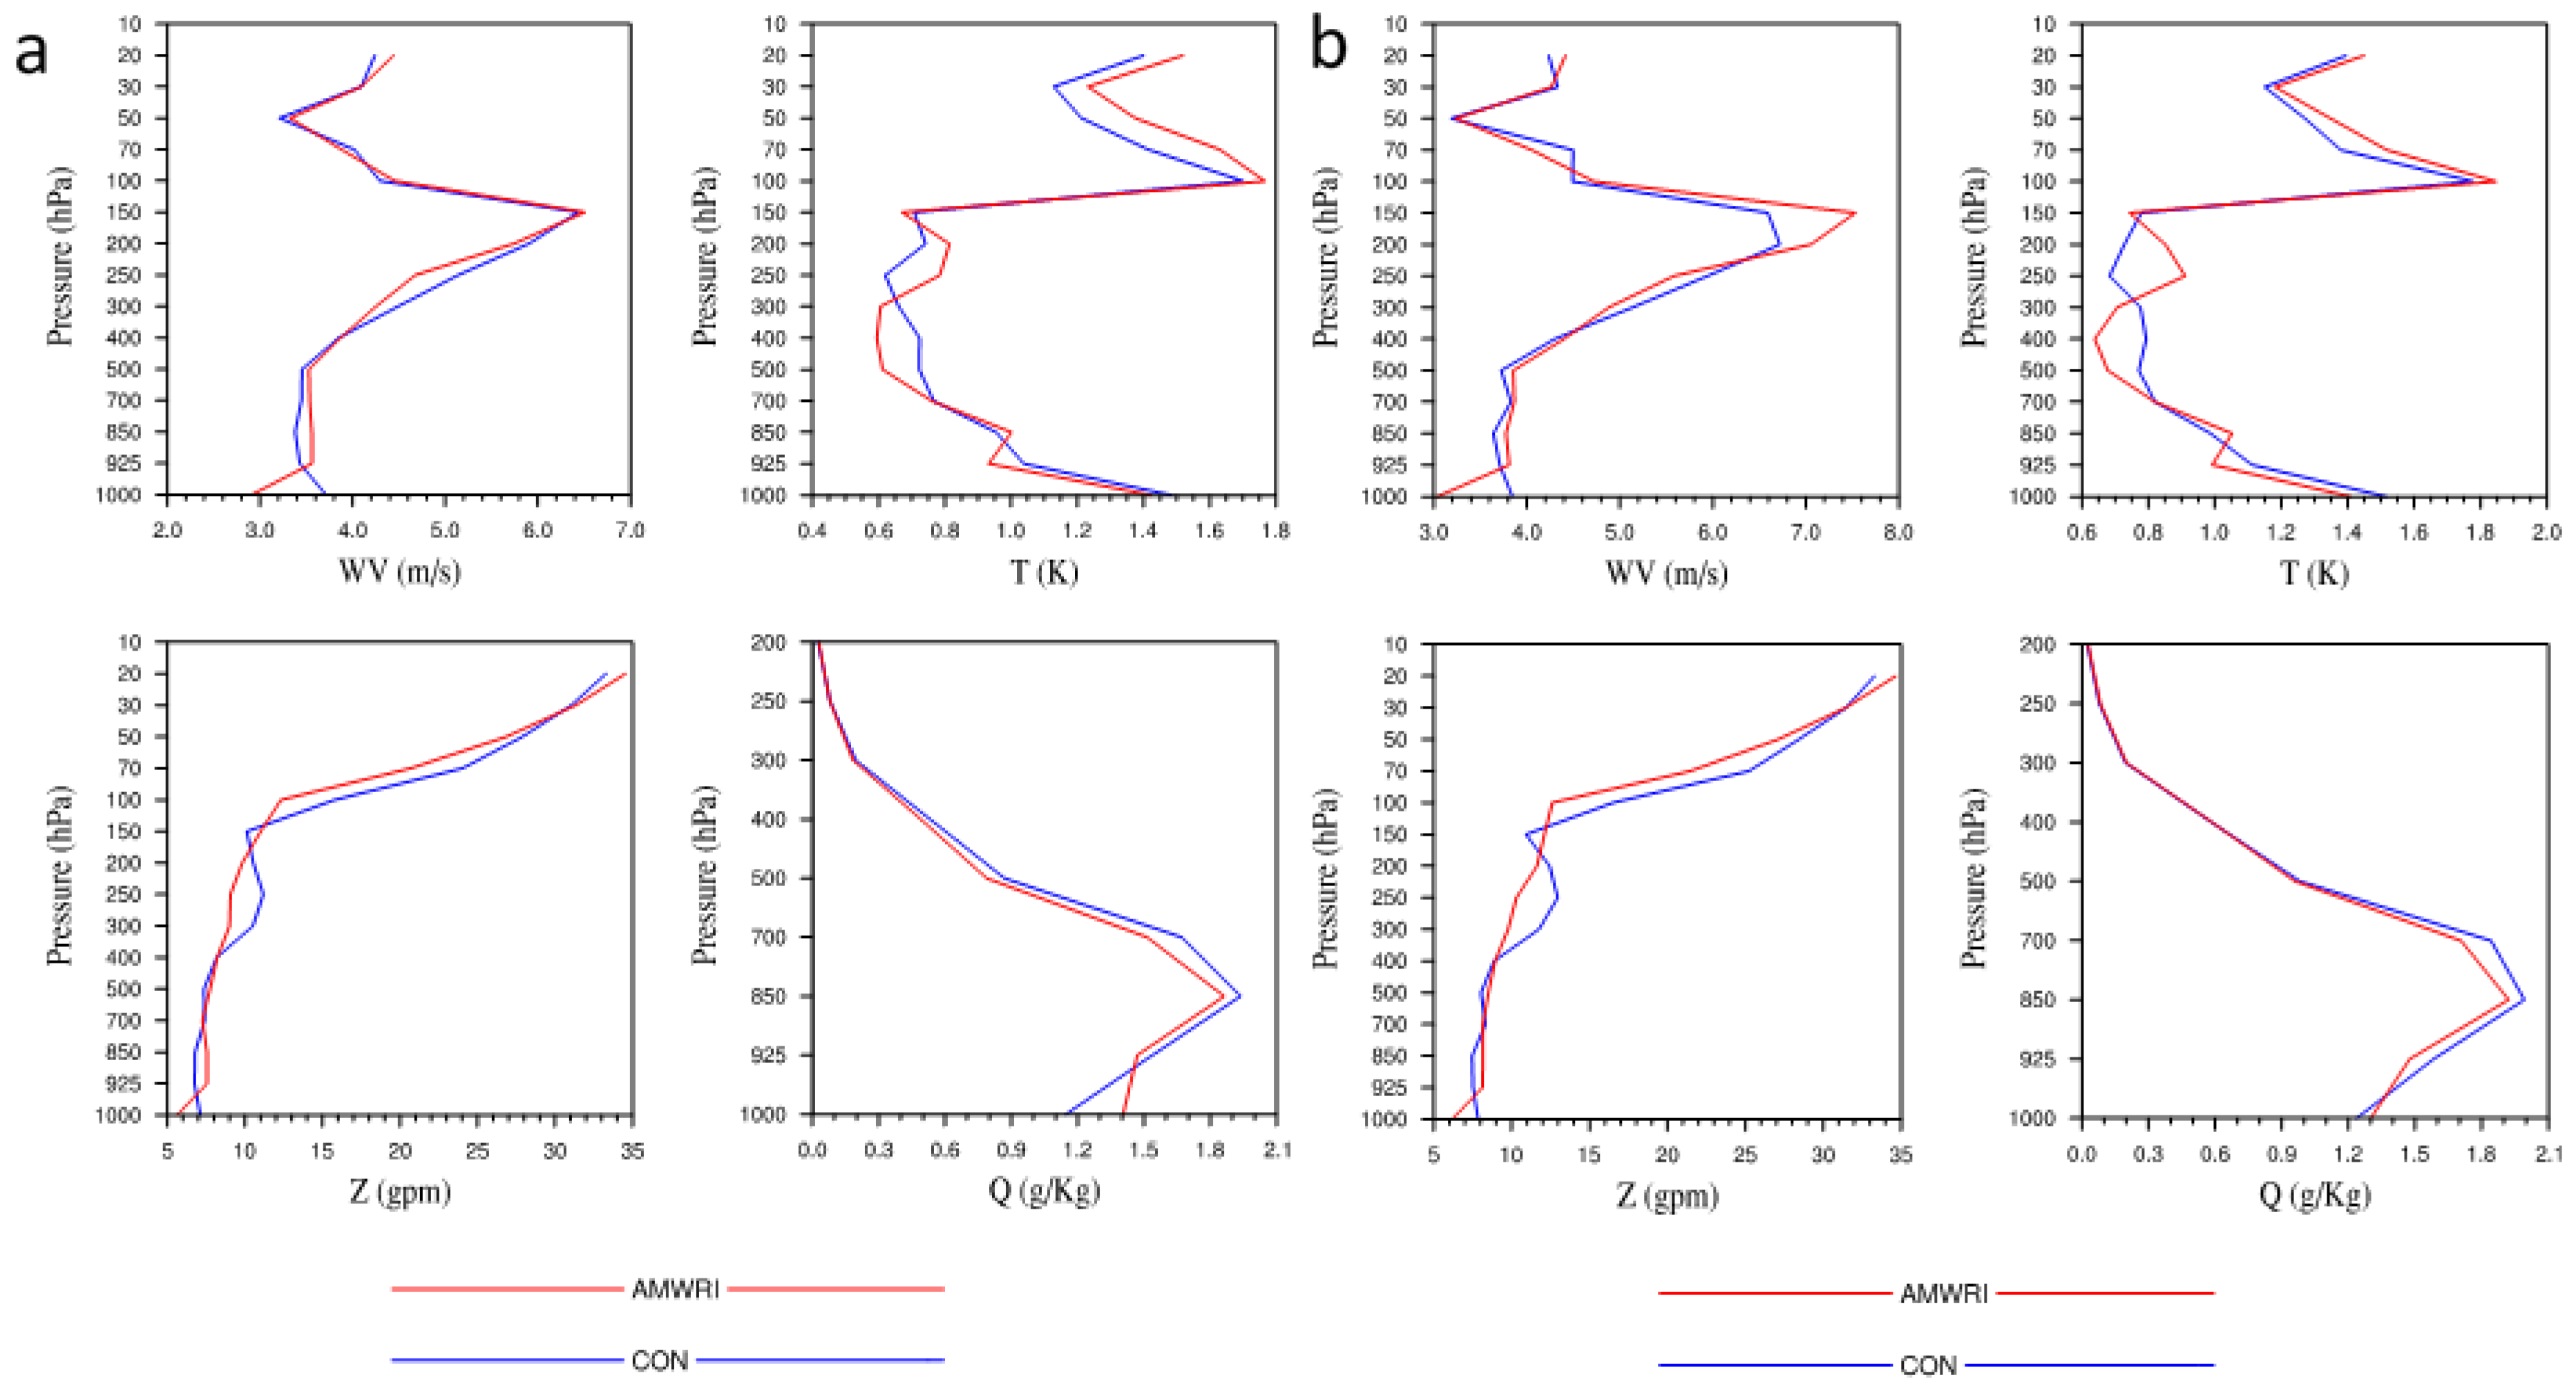
- The conventional assimilation experiment (CON), which assimilated conventional observations from radiosondes, aircraft, satellite-derived winds, land and oceanic surface stations, and GPS refractivity observations. These observations provided the information on temperature, wind, humidity, surface pressure, and so on. All types of data were assimilated at the analysis time with a 2 h assimilation time window, which meant the observations within ±1 h of the analysis times were assimilated at the analysis time together. More than 10,000 conventional observations were assimilated at a time.
- The MWRI assimilation experiment (AMWRI), which also assimilated conventional observation like CON, and additionally assimilated clear-sky MWRI radiance data. The assimilation time window of the satellite was 6 h. The thinning mesh of MWRI radiance data was an 80 km grid to avoid potential correlations between adjacent observations [33]. Because of the advantages of satellites, AMWRI could gain more accurate data over the typhoon region.
4. Results
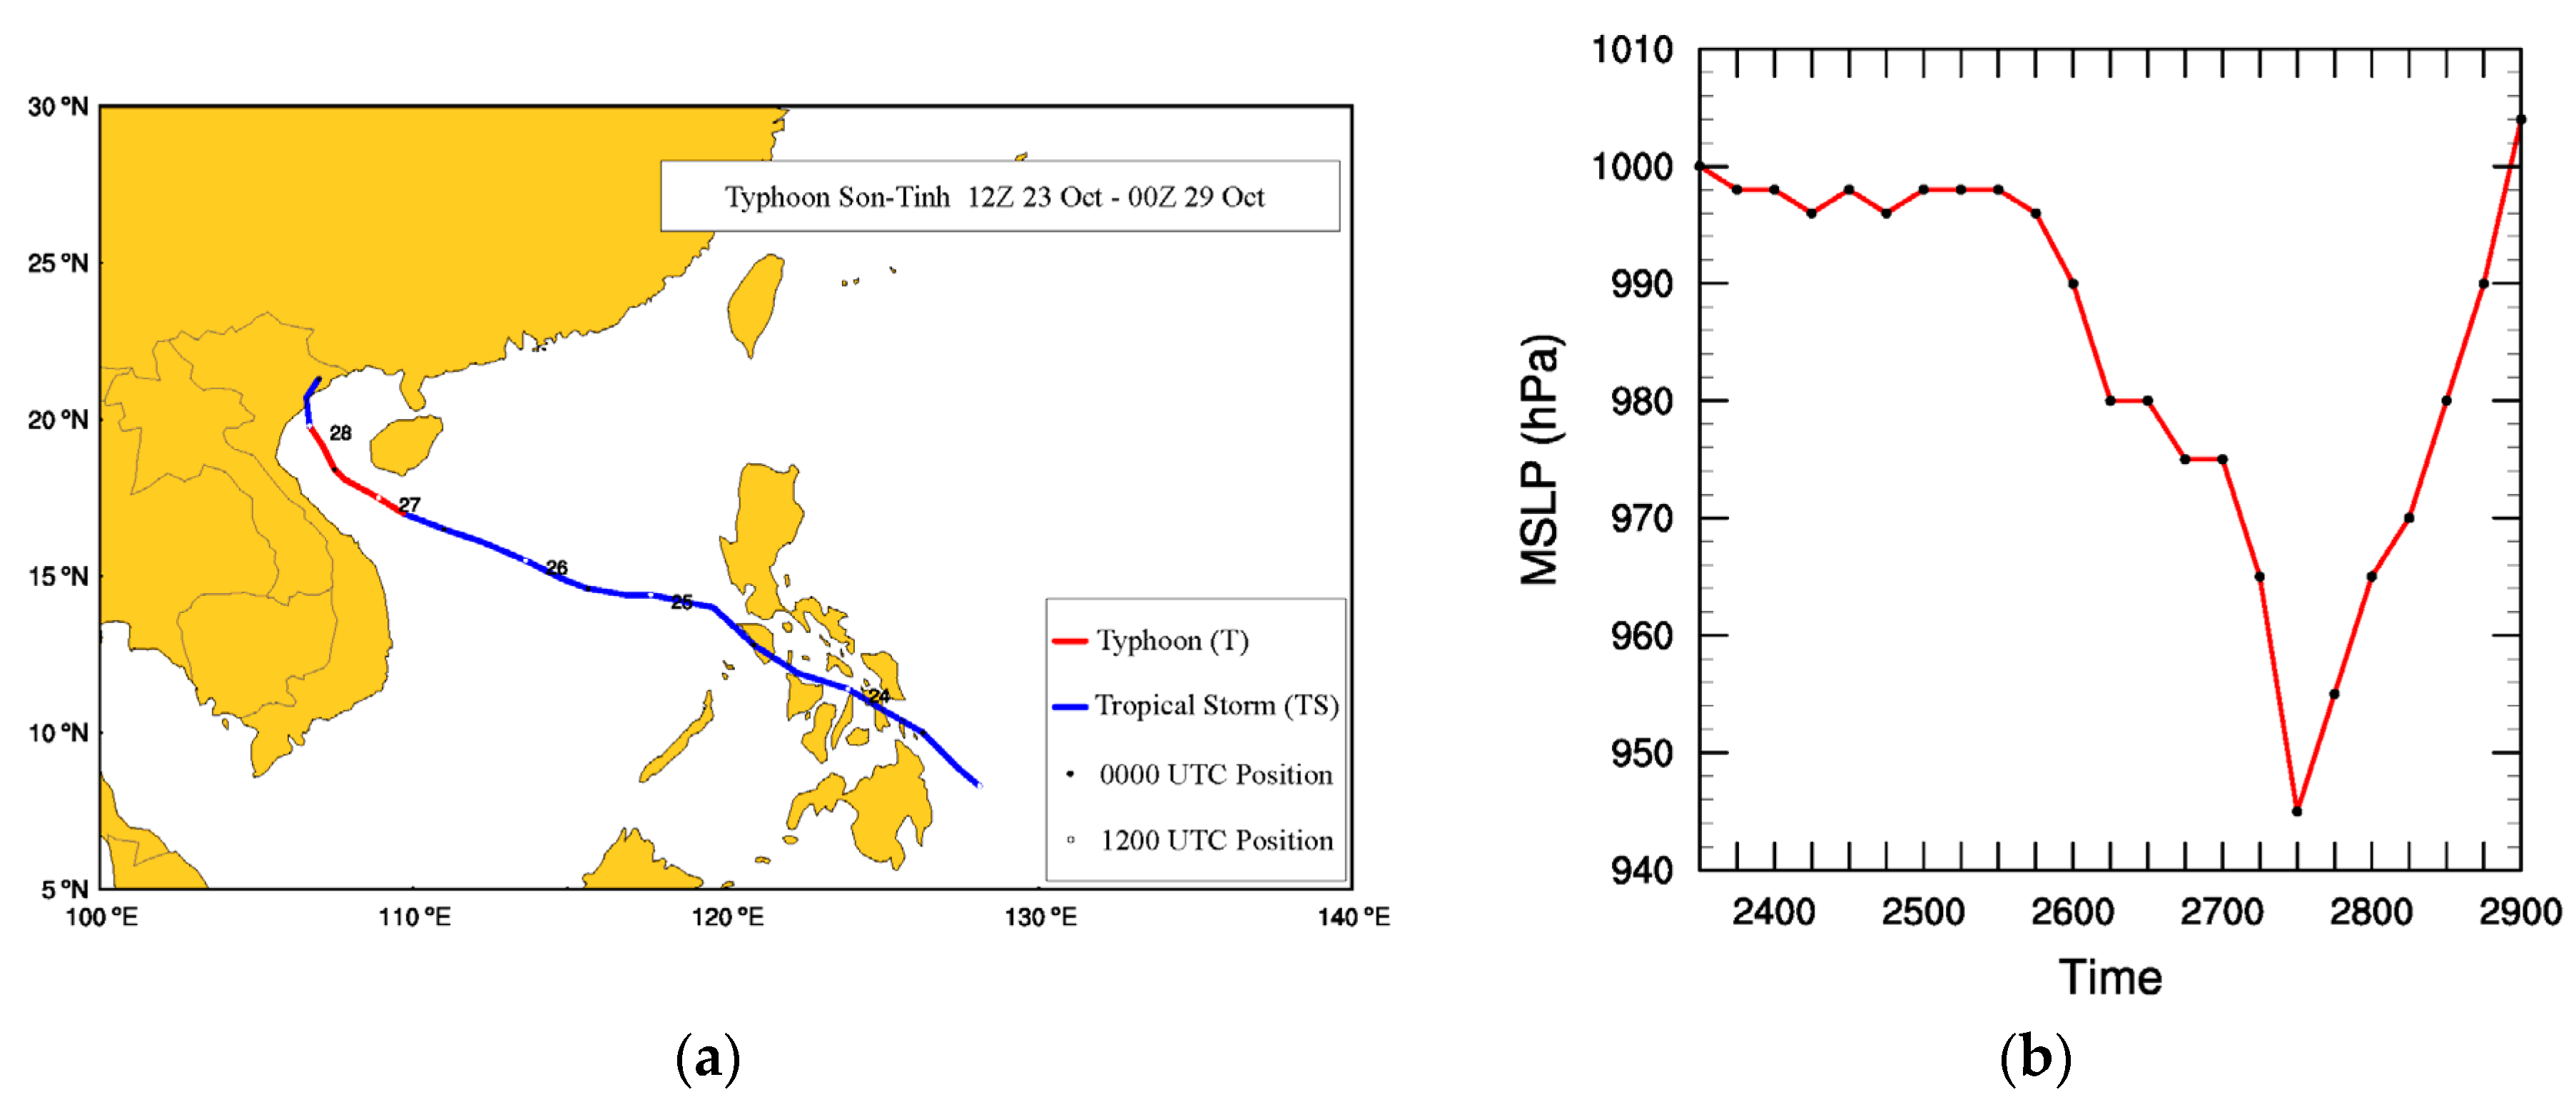
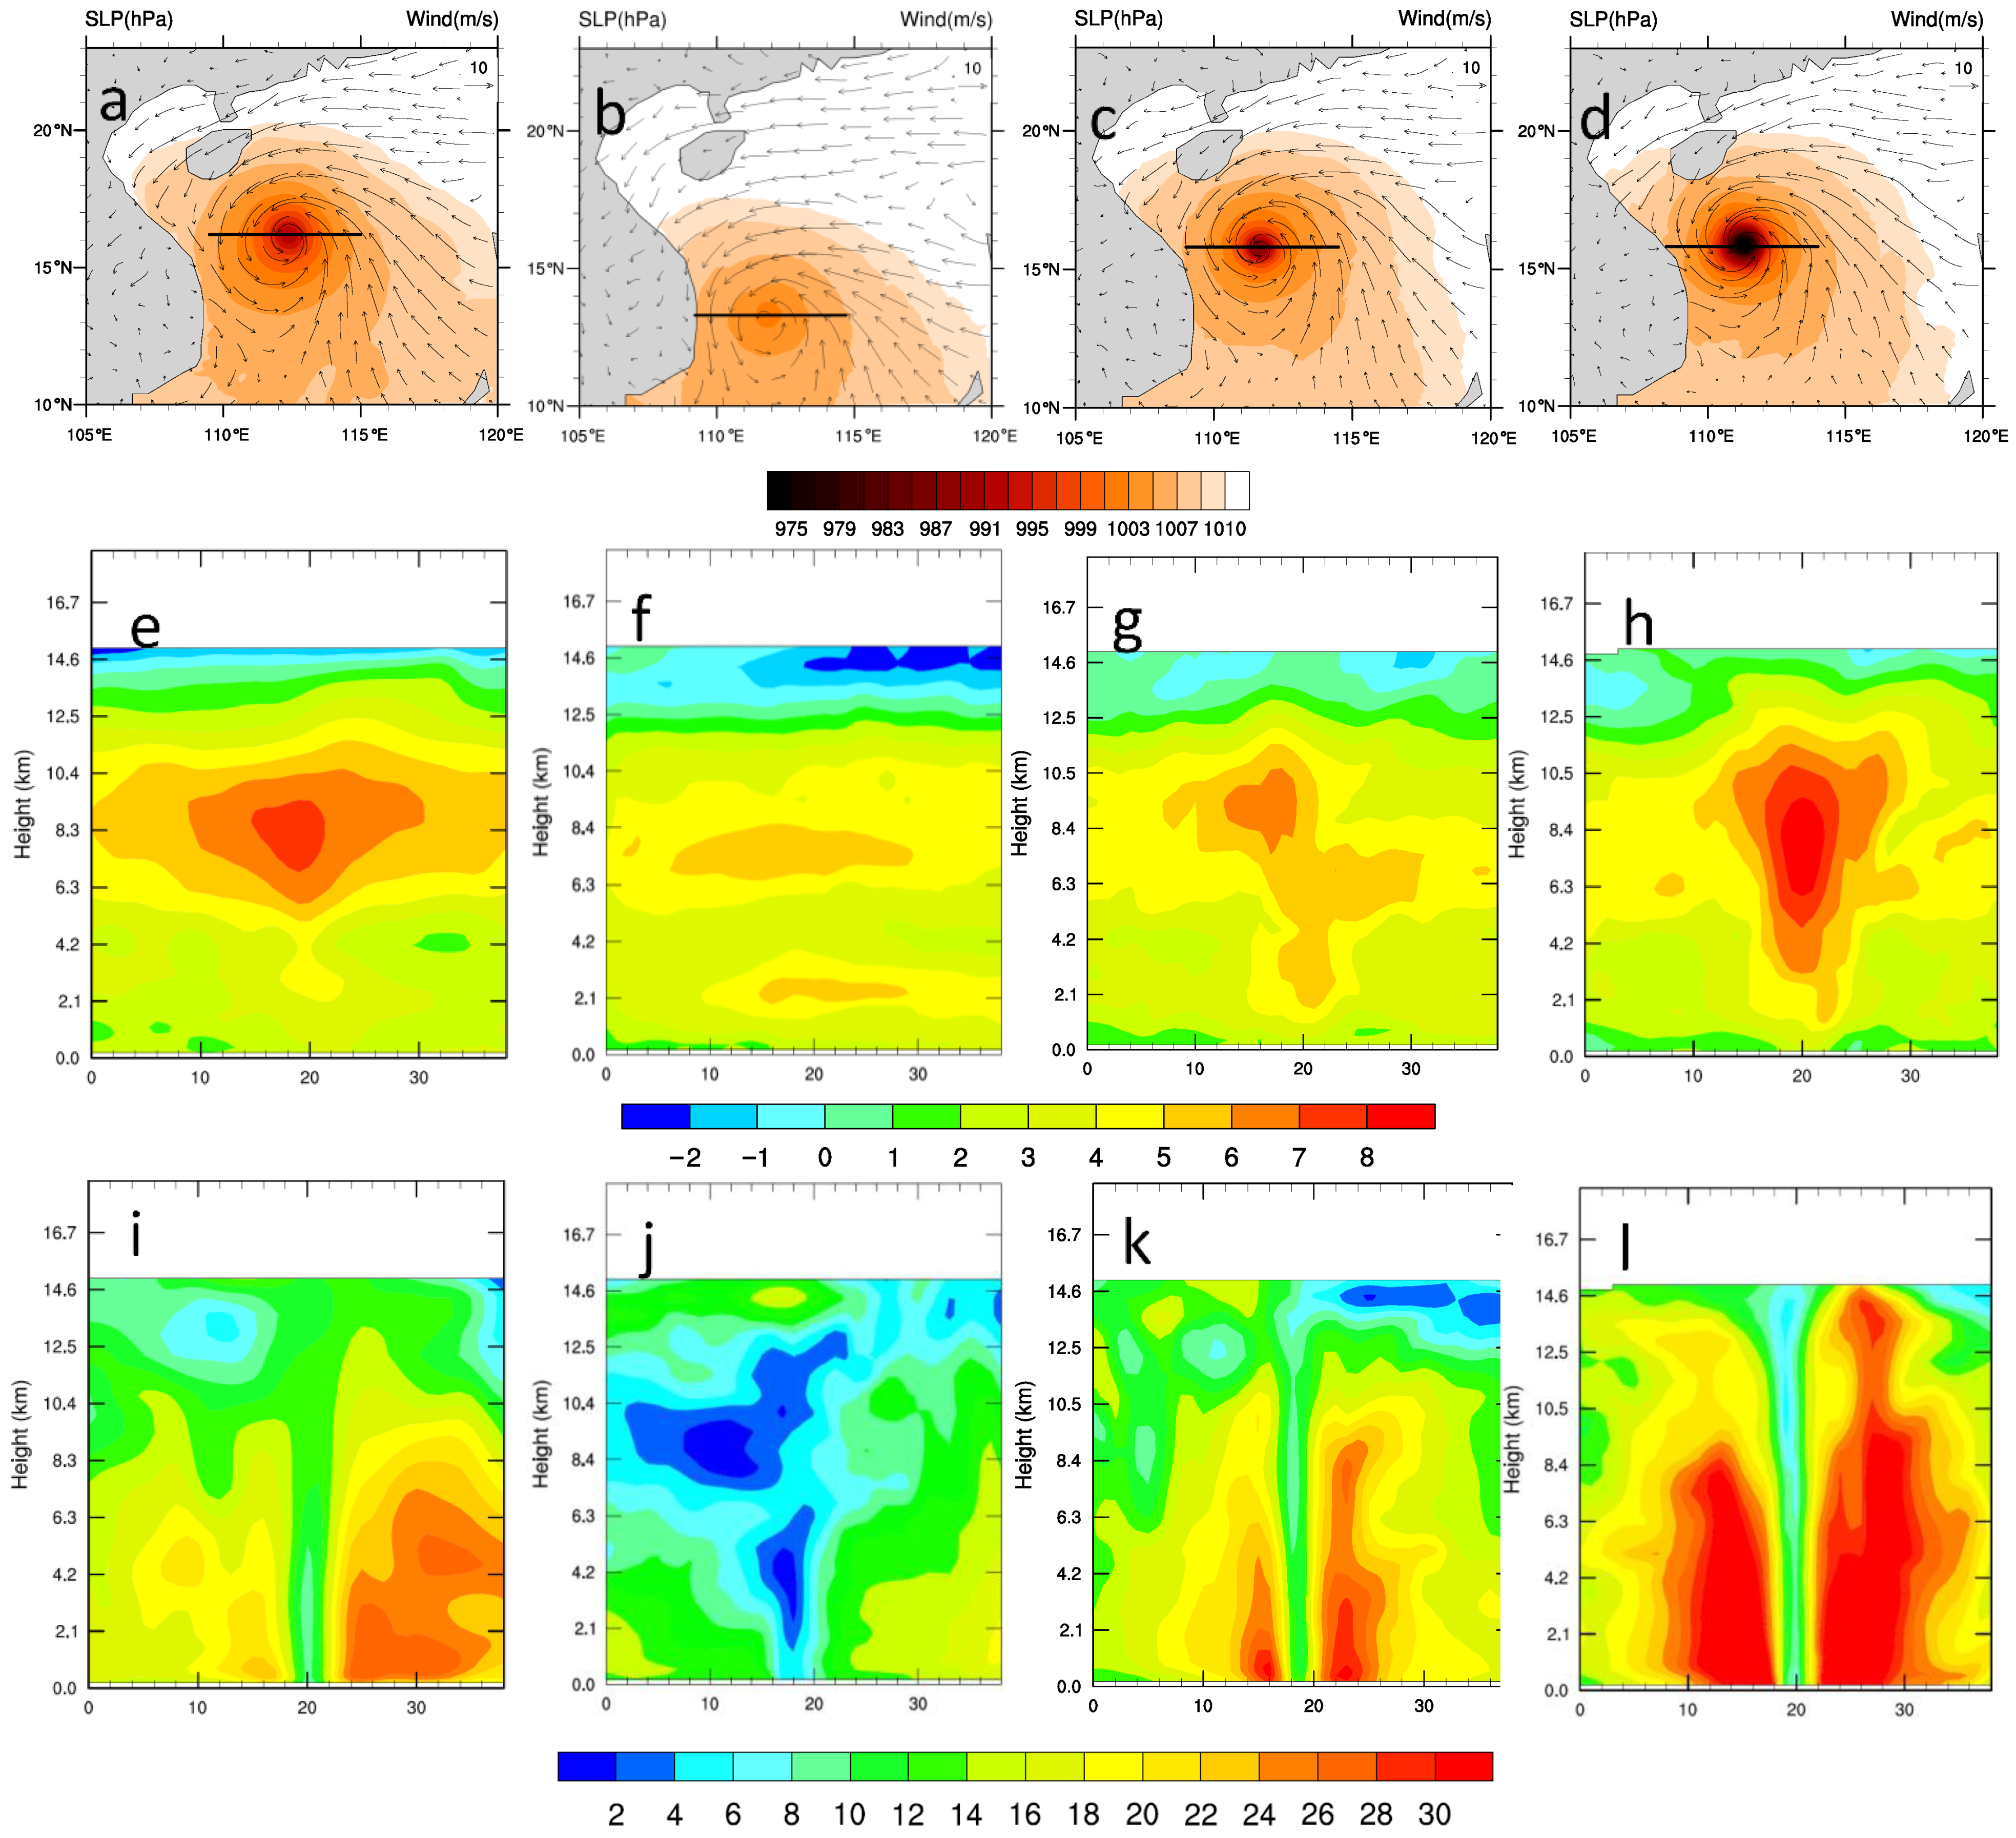
4.1. Impact on the Analysis of Son-Tinh
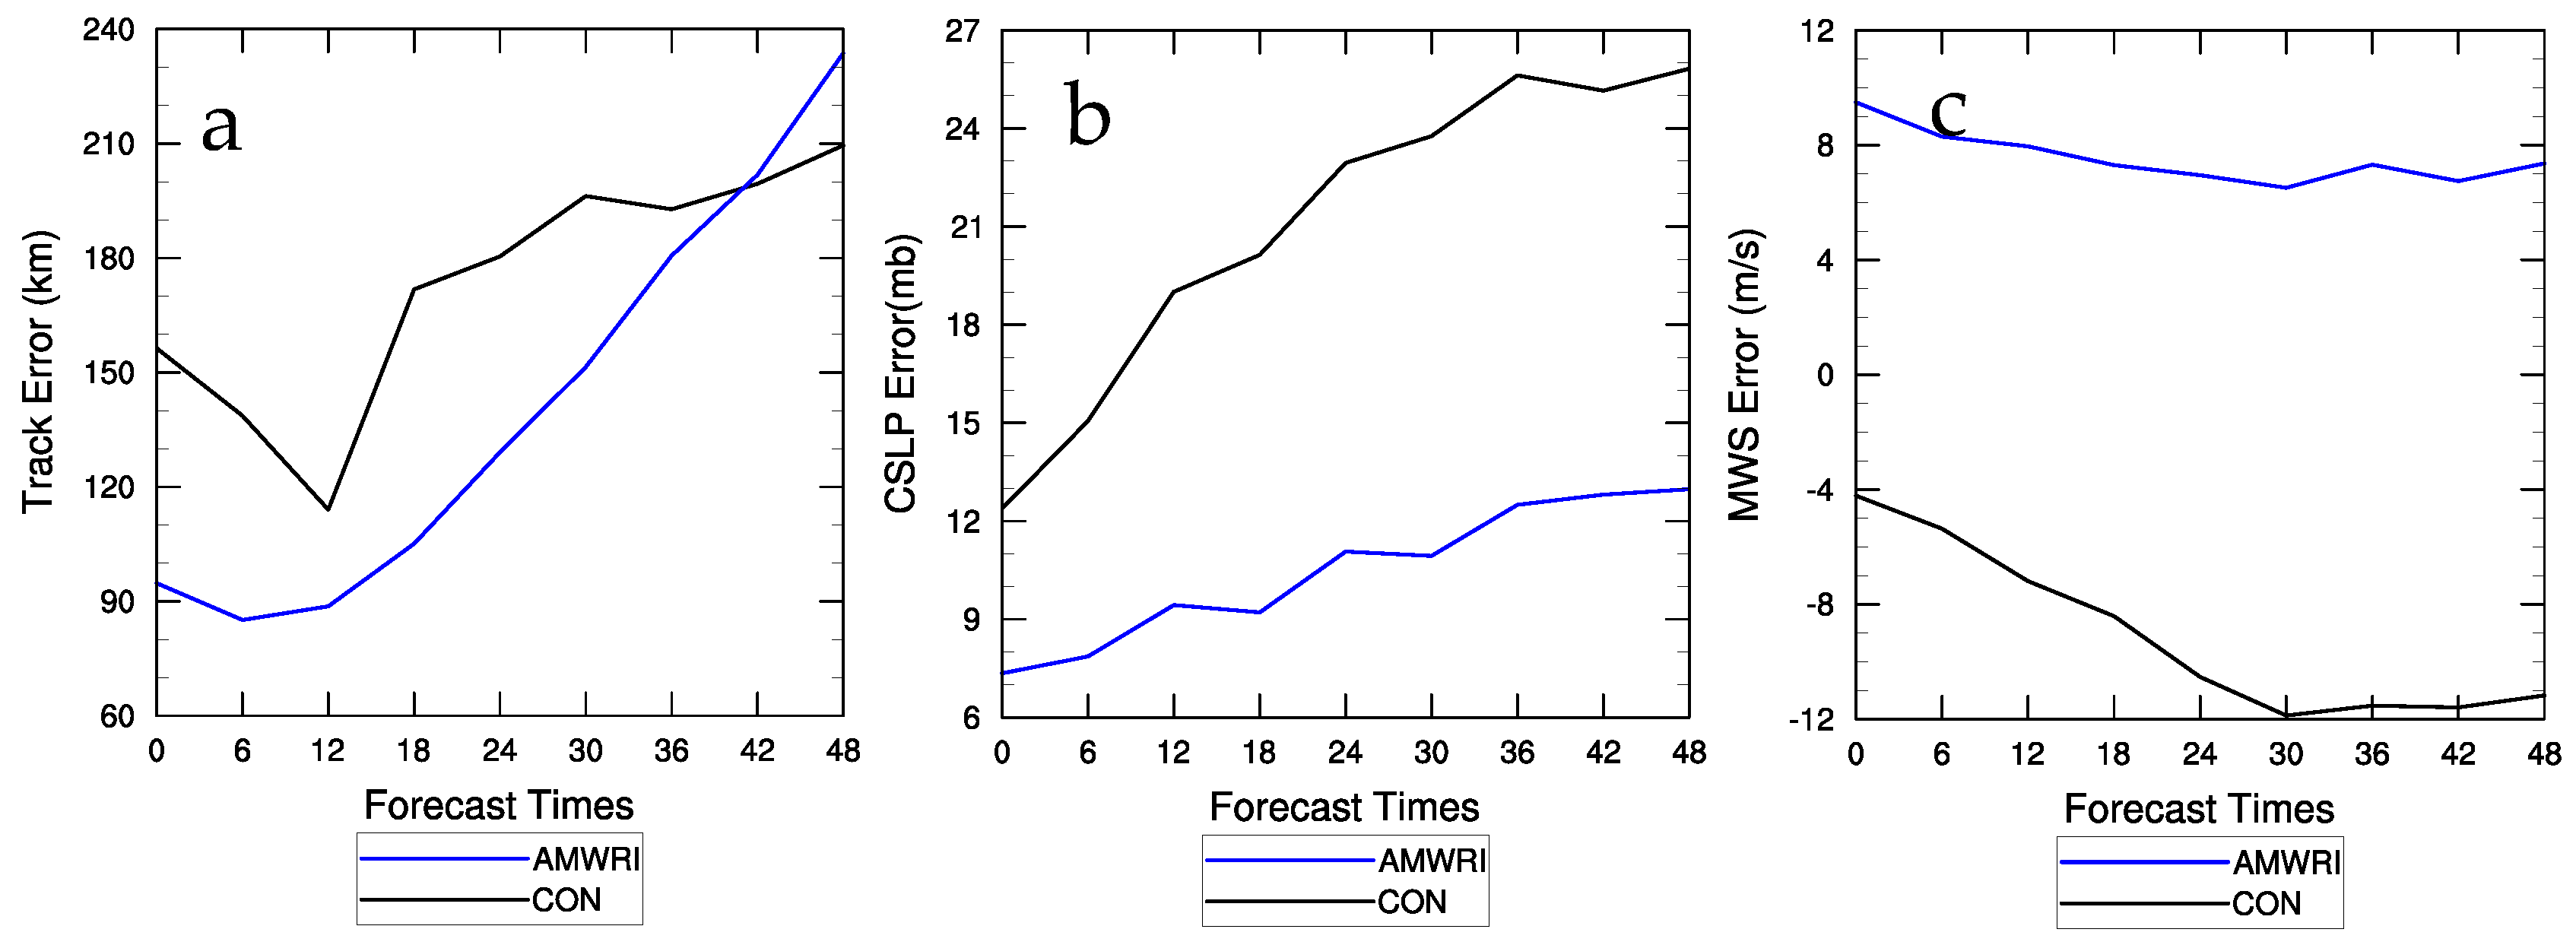
4.2. Impact on the Forecast of Son-Tinh
5. Discussion and Conclusions
Author Contributions
Funding
Institutional Review Board Statement
Informed Consent Statement
Data Availability Statement
Conflicts of Interest
References
- Kazumori, M.; Liu, Q.; Treadon, R.; Derber, J.C. Impact study of AMSR-E radiances in the NCEP global data assimilation system. Mon. Weather Rev. 2008, 136, 541–559. [Google Scholar] [CrossRef]
- Bauer, P.; Auligne´, T.; Bell, W.; Geer, A.J.; Guidard, V.; Heilliette, S.; Kazumori, M.; Kim, M.; Liu, E.H.; McNally, A.P.; et al. Satellite cloud and precipitation assimilation at operational NWP centres. Q. J. R. Meteorol. Soc. 2011, 137, 1934–1951. [Google Scholar] [CrossRef] [Green Version]
- Geer, A.J.; Bauer, P. Enhanced Use of All-Sky Microwave Observations Sensitive to Water Vapor, Cloud and Precipitation; Technical Memorandum; ECMWF: Reading, UK, 2010; Volume 620, p. 41. [Google Scholar]
- Kazumori, M. Satellite radiance assimilation in the JMA operational mesoscale 4DVAR system. Mon. Weather Rev. 2014, 142, 1361–1381. [Google Scholar] [CrossRef]
- Yang, C.; Liu, Z.; Bresch, J.; Rizvi, S.R.H.; Hang, X.; Min, J. AMSR2 all-sky radiance assimilation and its impact on the analysis and forecast of Hurricane Sandy with a limited-area data assimilation system. Tellus A 2016, 68, 30917. [Google Scholar] [CrossRef] [Green Version]
- Yang, C.; Liu, Z.; Gao, F.; Childs, P.P.; Min, J. Impact of assimilating GOES imager clear-sky radiance with a rapid refresh assimilation system for convection-permitting forecast over Mexico. J. Geo. Res. 2017, 122, 5472–5490. [Google Scholar] [CrossRef] [Green Version]
- Zhang, F.; Minamide, M.; Nystrom, R.G.; Chen, X.; Lin, S.; Harris, L.M. Improving Harvey Forecasts with Next-Generation Weather Satellites: Advanced Hurricane Analysis and Prediction with Assimilation of GOES-R All-Sky Radiances. Bull. Am. Meteorol. Soc. 2019, 100, 1217–1222. [Google Scholar] [CrossRef]
- Zhu, Y.; Gayno, G.; Purser, R.J.; Su, X.; Yang, R. Expansion of the All-Sky Radiance Assimilation to ATMS at NCEP. Mon. Weather Rev. 2019, 147, 2603–2620. [Google Scholar] [CrossRef]
- Yang, H.; Lv, L.; Xu, H.; He, J.; Wu, S. Evaluation of FY3B-MWRI instrument on-orbit calibration accuracy. In Proceedings of the IEEE International Geoscience and Remote Sensing Symposium, IGARSS 2011, Vancouver, BC, Canada, 24–29 July 2011; IEEE: Piscataway, NJ, USA, 2011. [Google Scholar]
- Xu, D.; Liu, Z.; Huang, X.; Min, J.; Wang, H. Impact of assimilation IASI radiance observations on forecasts of two tropical cyclones. Meteorol. Atmos. Phys. 2013, 122, 1–18. [Google Scholar] [CrossRef] [Green Version]
- Xu, D.; Min, J.; Shen, F.; Ban, J.; Chen, P. Assimilation of MWHS radiance data from the FY-3B satellite with the WRF Hybrid-3DVAR system for the forecasting of binary typhoons. J. Adv. Model. Earth Syst. 2016, 8, 1014–1102. [Google Scholar] [CrossRef] [Green Version]
- Bell, W.; Candy, B.; Atkinson, N.; Hilton, F.; Baker, N.; Bormann, N.; Kelly, G.; Kazumori, M.; Campbell, W.; Swadley, S. The assimilation of SSMIS radiances in numerical weather prediction models. IEEE Trans. Geosci. Remote Sens. 2008, 46, 884–900. [Google Scholar] [CrossRef]
- Kunkee, D.B.; Poe, G.A.; Boucher, D.J.; Swadley, S.D.; Hong, Y.; Wessel, J.E.; Uliana, E.A. Design and evaluation of the first Special Sensor Microwave Imager/Sounder. IEEE Trans. Geosci. Remote Sens. 2008, 46, 863–883. [Google Scholar] [CrossRef]
- Kawanishi, T.; Sezai, T.; Ito, Y.; Imaoka, K.; Takeshima, T.; Ishido, Y.; Shibata, A.; Miura, M.; Inahata, H.; Spencer, R. The Advanced Microwave Scanning Radiometer for the Earth Observing System (AMSR-E), NASDA’s contribution to the EOS for global energy and water cycle studies. IEEE Trans. Geosci. Remote Sens. 2003, 41, 184–194. [Google Scholar] [CrossRef]
- Kazumori, M.; Egawa, T. Assimilation of GCOM-W/AMSR2 radiance data in the JMA NWP systems. In WGNE Blue Book: Research Activities in Atmospheric and Ocean Modeling; WMO/Working Group on Numerical Experimentation: Geneva, Switzerland, 2014; Volume 1, pp. 7–8. [Google Scholar]
- Parinussa, R.M.; Wang, G.; Holmes, T.R.H.; Liu, Y.Y.; Dolman, A.J.; De Jeu, R.A.M.; Jiang, T.; Zhang, P.; Shi, J. Global surface soil moisture from the Microwave Radiation Imager onboard the Fengyun-3B satellite. Int. J. Remote Sens. 2014, 35, 7007–7029. [Google Scholar] [CrossRef]
- Cui, Y.; Long, D.; Hong, Y.; Zeng, C.; Zhou, J.; Han, Z.; Liu, R.; Wan, W. Validation and reconstruction of FY-3B/MWRI soil moisture using an artificial neural network based on reconstructed MODIS optical products over the Tibetan Plateau. J. Hydrol. 2016, 543, 242–254. [Google Scholar] [CrossRef]
- Yang, J.; Jiang, L.; Shi, J.; Wu, S.; Sun, R.; Yang, H. Monitoring snow cover using Chinese meteorological satellite data over China. Remote Sens. Environ. 2014, 143, 192–203. [Google Scholar] [CrossRef]
- Wu, L.; Li, X.; Zhao, K.; Zheng, X.M.; Dai, L.Y. Validation and Analysis of Snow Depth Inversion Algorithm in Northeast Typical Forest Based on the FY3B-MWRI Data. J. Geo-Inf. Sci. 2014, 16, 320–327. [Google Scholar]
- Xu, B.; Xie, P.; Xu, M.; Jiang, L.; Shi, C.; You, R. A Validation of Passive Microwave Rain-Rate Retrievals from the Chinese FengYun-3B Satellite. J. Hydrometeorol. 2015, 16, 1886–1905. [Google Scholar] [CrossRef]
- Barker, D.M.; Huang, X.; Liu, Z.; Auligné, T.; Zhang, X.; Rugg, S.; Ajjajj, R.; Bourgeois, A.; Bray, J.; Chen, Y.; et al. The weather research and forecasting (WRF) model’s community variational/ensemble data assimilation system: WRFDA. Bull. Am. Meteorol. Soc. 2012, 93, 831–843. [Google Scholar] [CrossRef] [Green Version]
- Weng, F. Advances in radiative transfer modeling in support of satellite data assimilation. J. Atmos. Sci. 2007, 64, 3799–3807. [Google Scholar] [CrossRef]
- Han, Y. JCSDA Community radiative Transfer Model (CRTM)—Version 1; NOAA Technical Report; NESDIS: Washington, DC, USA, 2006; Volume 122, p. 33. [Google Scholar]
- Skamarock, W.C.; Klemp, J.B.; Dudhia, J.; Gill, D.O.; Barker, D.M.; Wang, W.; Powers, J.G. A Description of the Advanced Research WRF Version 3; NCAR Technical Note NCAR/TN-475_STR; CiteSeerX: State College, PA, USA, 2008; p. 133. [Google Scholar]
- Hong, S.; Lim, J.J. The WRF Single-Moment 6-Class Microphysics Scheme (WSM6). J. Korean Meteor. Soc. 2006, 42, 129–151. [Google Scholar]
- Mlawer, E.J.; Taubman, S.J.; Brown, P.D.; Iacono, M.J.; Clough, S.A. Radiative transfer for inhomogeneous atmosphere: RRTM, a validated correlated-k model for the long-wave. J. Geophys. Res. 1997, 102, 16663–16682. [Google Scholar] [CrossRef] [Green Version]
- Iacono, M.J.; Delamere, J.S.; Mlawer, E.J.; Shephared, M.W.; Clough, S.A.; Collins, W.D. Radiative forcing by longlived greenhouse gases: Calculations with the AER radiative transfer models. J. Geophys. Res. 2008, 113, D13103. [Google Scholar] [CrossRef]
- Hong, S.; Noh, Y.; Dudhia, J. A new vertical diffusion package with an explicit treatment of entrainment processes. Mon. Weather Rev. 2006, 134, 2318–2341. [Google Scholar] [CrossRef] [Green Version]
- Monin, A.S.; Obukhov, A.M. Basic laws of turbulent mixing in the surface layer of the atmosphere. Contrib. Geophys. Inst. Slovak Acad. Sci. 1954, 24, 163–187. [Google Scholar]
- Chen, F.; Dudhia, J. Coupling an advanced land-surface/hydrology model with the Penn State/NCAR MM5 modeling system Part I: Model description and implementation. Mon. Weather Rev. 2001, 129, 569–585. [Google Scholar] [CrossRef] [Green Version]
- Tiedtke, M. A comprehensive mass flux scheme for cumulus parameterization in large-scale models. Mon. Weather Rev. 1989, 117, 1779–1800. [Google Scholar] [CrossRef] [Green Version]
- Zhang, C.; Wang, Y.; Hamiltion, K. Improved representation of boundary layer clouds over the southeast Pacific in ARW-WRF using a modified Tiedtke cumulus parameterization scheme. Mon. Weather Rev. 2011, 139, 3489–3513. [Google Scholar] [CrossRef] [Green Version]
- Liu, Z.; Rabier, F. The interaction between model resolution, observation resolution and observation density in data assimilation: A one-dimensional study. Q. J. R. Meteorol. Soc. 2002, 128, 1367–1386. [Google Scholar] [CrossRef] [Green Version]
- Parrish, D.F.; Derber, J.C. The National Meteorological Center’s spectral statistical interpolation analysis system. Mon. Weather Rev. 1992, 120, 1747–1763. [Google Scholar] [CrossRef]
- Moreau, E.; Lopez, P.; Bauer, P.; Tompkins, A.M.; Janiskova, M.; Chevallier, F. Variational retrieval of temperature and humidity profiles using rain rates versus microwave brightness temperatures. Q. J. R. Meteorol. Soc. 2004, 130, 617–628. [Google Scholar] [CrossRef]
- Caccamo, M.T.; Castorina, G.; Colombo, F.; Insinga, V.; Maiorana, E.; Mazagu, S. Weather forecast performances for complex orographic areas: Impact of different grid resolutions and of geographic data on heavy rainfall event simulations in Sicily. Atmos. Res. 2017, 198, 22–33. [Google Scholar] [CrossRef]


| Channel | Frequency (GHz) | Polarization | Sensitivity (K) | Resolution (km × km) |
|---|---|---|---|---|
| 1,2 | 10.65 | V, H | 0.5 | 51 × 85 |
| 3,4 | 18.7 | V, H | 0.5 | 51 × 85 |
| 5,6 | 23.8 | V, H | 0.8 | 27 × 45 |
| 7,8 | 36.5 | V, H | 1.0 | 18 × 30 |
| 9,10 | 89 | V, H | 1.3 | 18 × 30 |
| Physics Parameterization | Configuration |
|---|---|
| Microphysics scheme | WRF single-moment 6-class scheme (WSM6) [25] |
| Shortwave- and longwave-radiation schemes | Rapid Radiative Transfer Model for GCMs (RRTMG) [26,27] |
| Boundary-layer scheme | Yonsei University scheme (YSU) [28] |
| Surface-layer scheme | Monin–Obukhoy scheme [29] |
| Land-surface model | Unified NOAH land-surface model [30] |
| Cumulus-parameterization scheme | Tiedtke scheme [31,32] |
Publisher’s Note: MDPI stays neutral with regard to jurisdictional claims in published maps and institutional affiliations. |
© 2021 by the authors. Licensee MDPI, Basel, Switzerland. This article is an open access article distributed under the terms and conditions of the Creative Commons Attribution (CC BY) license (https://creativecommons.org/licenses/by/4.0/).
Share and Cite
Yang, C.; Zhu, L.; Min, J. Impact Study of FY-3B MWRI Data Assimilation in WRFDA. Atmosphere 2021, 12, 497. https://doi.org/10.3390/atmos12040497
Yang C, Zhu L, Min J. Impact Study of FY-3B MWRI Data Assimilation in WRFDA. Atmosphere. 2021; 12(4):497. https://doi.org/10.3390/atmos12040497
Chicago/Turabian StyleYang, Chun, Lijian Zhu, and Jinzhong Min. 2021. "Impact Study of FY-3B MWRI Data Assimilation in WRFDA" Atmosphere 12, no. 4: 497. https://doi.org/10.3390/atmos12040497