Article

PM2.5 Magnetic Properties in Relation to Urban Combustion Sources in Southern West Africa

by
Aruã da Silva Leite
1,*,
Jean-François Léon
2,
Melina Macouin
1,
Sonia Rousse
1,
Ricardo Ivan Ferreira da Trindade
3,
Arnaud Proietti
4,
Loïc Drigo
1,
Paul Yves Jean Antonio
3,
Aristide Barthélémy Akpo
5,
Véronique Yoboué
6 and
Cathy Liousse
2
1
Géosciences Environnement Toulouse, Université de Toulouse, CNES, CNRS, IRD, UPS, 31400 Toulouse, France
2
Laboratoire d’Aérologie, Université Paul Sabatier-Toulouse 3, CNRS, 31400 Toulouse, France
3
Instituto de Astronomia, Geofísica e Ciências Atmosféricas, Universidade de São Paulo, São Paulo 05508-090, Brazil
4
Centre De Microcaractérisation Raimond Castaing, 31400 Toulouse, France
5
Laboratoire de Physique du Rayonnement, Université d’Abomey Calavi, Cotonou 01 BP 526, Benin
6
Laboratoire de Physique de l’Atmosphère, Université Félix-Houphouët-Boigny, Abidjan 01 BPV 34, Ivory Coast
*
Author to whom correspondence should be addressed.
Atmosphere 2021, 12(4), 496; https://doi.org/10.3390/atmos12040496
Submission received: 25 March 2021 / Revised: 9 April 2021 / Accepted: 12 April 2021 / Published: 14 April 2021
(This article belongs to the Special Issue Environmental Magnetism Applied to the Study of Atmospheric Aerosols)

Abstract

:
The physico-chemical characteristics of particulate matter (PM) in African cities remain poorly known due to scarcity of observation networks. Magnetic parameters of PM are robust proxies for the emissions of Fe-bearing particles. This study reports the first magnetic investigation of PM2.5 (PM with aerodynamic size below 2.5 μm) in Africa performed on weekly PM2.5 filters collected in Abidjan (Ivory Coast) and Cotonou (Benin) between 2015 and 2017. The magnetic mineralogy is dominated by magnetite-like low coercivity minerals. Mass normalized SIRM are 1.65 × 10⁻² A m2 kg−1 and 2.28 × 10⁻² A m2 kg−1 for Abidjan and Cotonou respectively. Hard coercivity material (S-ratio = 0.96 and MDF = 33 mT) is observed during the dry dusty season. Wood burning emits less iron oxides by PM2.5 mass when compared to traffic sources. PM2.5 magnetic granulometry has a narrow range regardless of the site or season. The excellent correlation between the site-averaged element carbon concentrations and SIRM suggests that PM2.5 magnetic parameters are linked to primary particulate emission from combustion sources.

1. Introduction

Ambient Particulate Matter (PM) is a complex mixture of solid and liquid particles in suspension in the air [1]. The adverse health effect of PM has been established in epidemiological studies over recent decades [2,3,4,5]. In terms of hazardousness the finer fractions of PM are the ones most nocive to human health [2,6]. A common definition for the finer fraction of PM is particles with aerodynamic size inferior to 2.5 μm, known as PM2.5 [2]. PM2.5 was the fifth-ranking mortality risk factor in 2015 leading to 4.2 millions deaths worldwide [4]. Regional decreases in PM2.5 concentrations have been observed over the last decade in China [7] or in the USA, except in wildfire-prone areas [8]. Conversely, low and middle-income countries experience an increase in the emission of atmospheric pollutants, including PM2.5 due to population and economic growth [9]. The population of sub-Saharan Africa (SSA) is projected to double by 2050 [10] associated with growing urbanization [11] and rapid increase in energy consumption, making SSA a major hot spot of anthropogenic emissions in the near future. Liousse et al. [12] have estimated that Africa will contribute to half of the global emission of particulate organic carbon in 2030. Carbonaceous particles (elemental and organic carbon) are emitted by combustion due to transportation, the use of biofuels or agricultural waste for domestic cooking, and open-air waste burning [13]. Open biomass burning originating from agricultural practices and savanna burning also contributes to the urban PM2.5 burden in SSA [14,15]. SSA is largely impacted by mineral dust transported by the northeasterly Harmattan wind during the dry winter period [16]. Dust is a major contributor to PM all year long [17]. It is responsible for sharp increases in PM during outbreaks reaching the Gulf of Guinea [18,19].
Most of the urban areas in SSA lack an air quality network, leaving large, densely populated areas without PM observations. Our ability to fully understand and quantify the impact of PM levels in SSA cities is currently limited by the scarcity of monitoring data. The Dynamic Aerosol–Cloud–Chemistry Interaction in West Africa (DACCIWA) research program investigated the possible role of local air pollution in climate change in West Africa, providing an unprecedented set of observations on the PM concentrations and chemical composition in the South West African cities of Abidjan (Ivory Coast) and Cotonou (Benin) [20]. PM2.5 mass and carbonaceous fraction were measured on a weekly basis at both cities between 2015 and 2017 [18]. The measurements were targeted towards the characterisation of urban aerosols from specific combustion sources [17] and the assessment of personal exposure of nearby populations [21].
As an alternative to standard PM sampling, environmental magnetism has been proven to be a robust, quantitative technique for identifying ambient concentrations of anthropogenic PM [22,23]. Iron oxides contained in PM offer the possibility to investigate PM concentrations through their magnetic properties. Magnetic susceptibility, which relates to iron oxides concentration, may have a linear relationship with PM concentration [24,25]. Several studies conducted in European cities established that the magnetic fraction present in urban PM is mostly composed of ferrimagnetic soft coercive magnetite-like grains [24,26,27,28,29,30,31,32,33]. These iron oxides present in PM have natural and anthropogenic origin. Early works in environmental magnetism demonstrated the potential of magnetic methods to successfully differentiate these sources [34,35,36]. These methods enable to identify the magnetic minerals [29,30,37], the magnetic domain state which relates to grain size of the iron oxides [30,37], and concentration of magnetic carriers [24,25]. Iron oxides are often associated with nitrogen oxides [30,32] as well as heavy metals [31,32,37] known to be among the most harmful constituents of particulate matter [38]. Iron oxides have also been found among soot [39]. The magnetic fraction of traffic emission particles is generated by the combustion of fossil fuels and vehicle wear, especially by brake disk abrasion [24,30,31,34,40,41].
Natural origin of iron oxides in this region is due to aeolian dust sourced from lateritic desert zone soils. The iron oxides carried by the Harmattan wind include a mix of low coercivity (magnetite-like) and antiferromagnetic high coercivity minerals (hematite, goethite) [42]. The magnetic methods may be able to distinguish the origins of iron oxides from natural to anthropogenic, and thus allow the investigation of the seasonal and source influences in the PM from those distinct origins.
The objective of this study is to assess the potential of magnetic methods to track sources and emissions variations from different urban activities in West Africa in a context of geogenic iron oxides inputs from continental winds. We study PM2.5 filter samples collected through the DACCIWA research program in Africa between 2015 and 2017 to characterize the iron oxides in terms of concentration, grain size distribution and magnetic mineralogy. The data previously published in Djossou et al. [18] for the filters enable the comparison between the presence of magnetic particles and quantitative indicators of combustion like the carbonaceous fraction and also PM2.5 concentration.

2. Materials and Methods
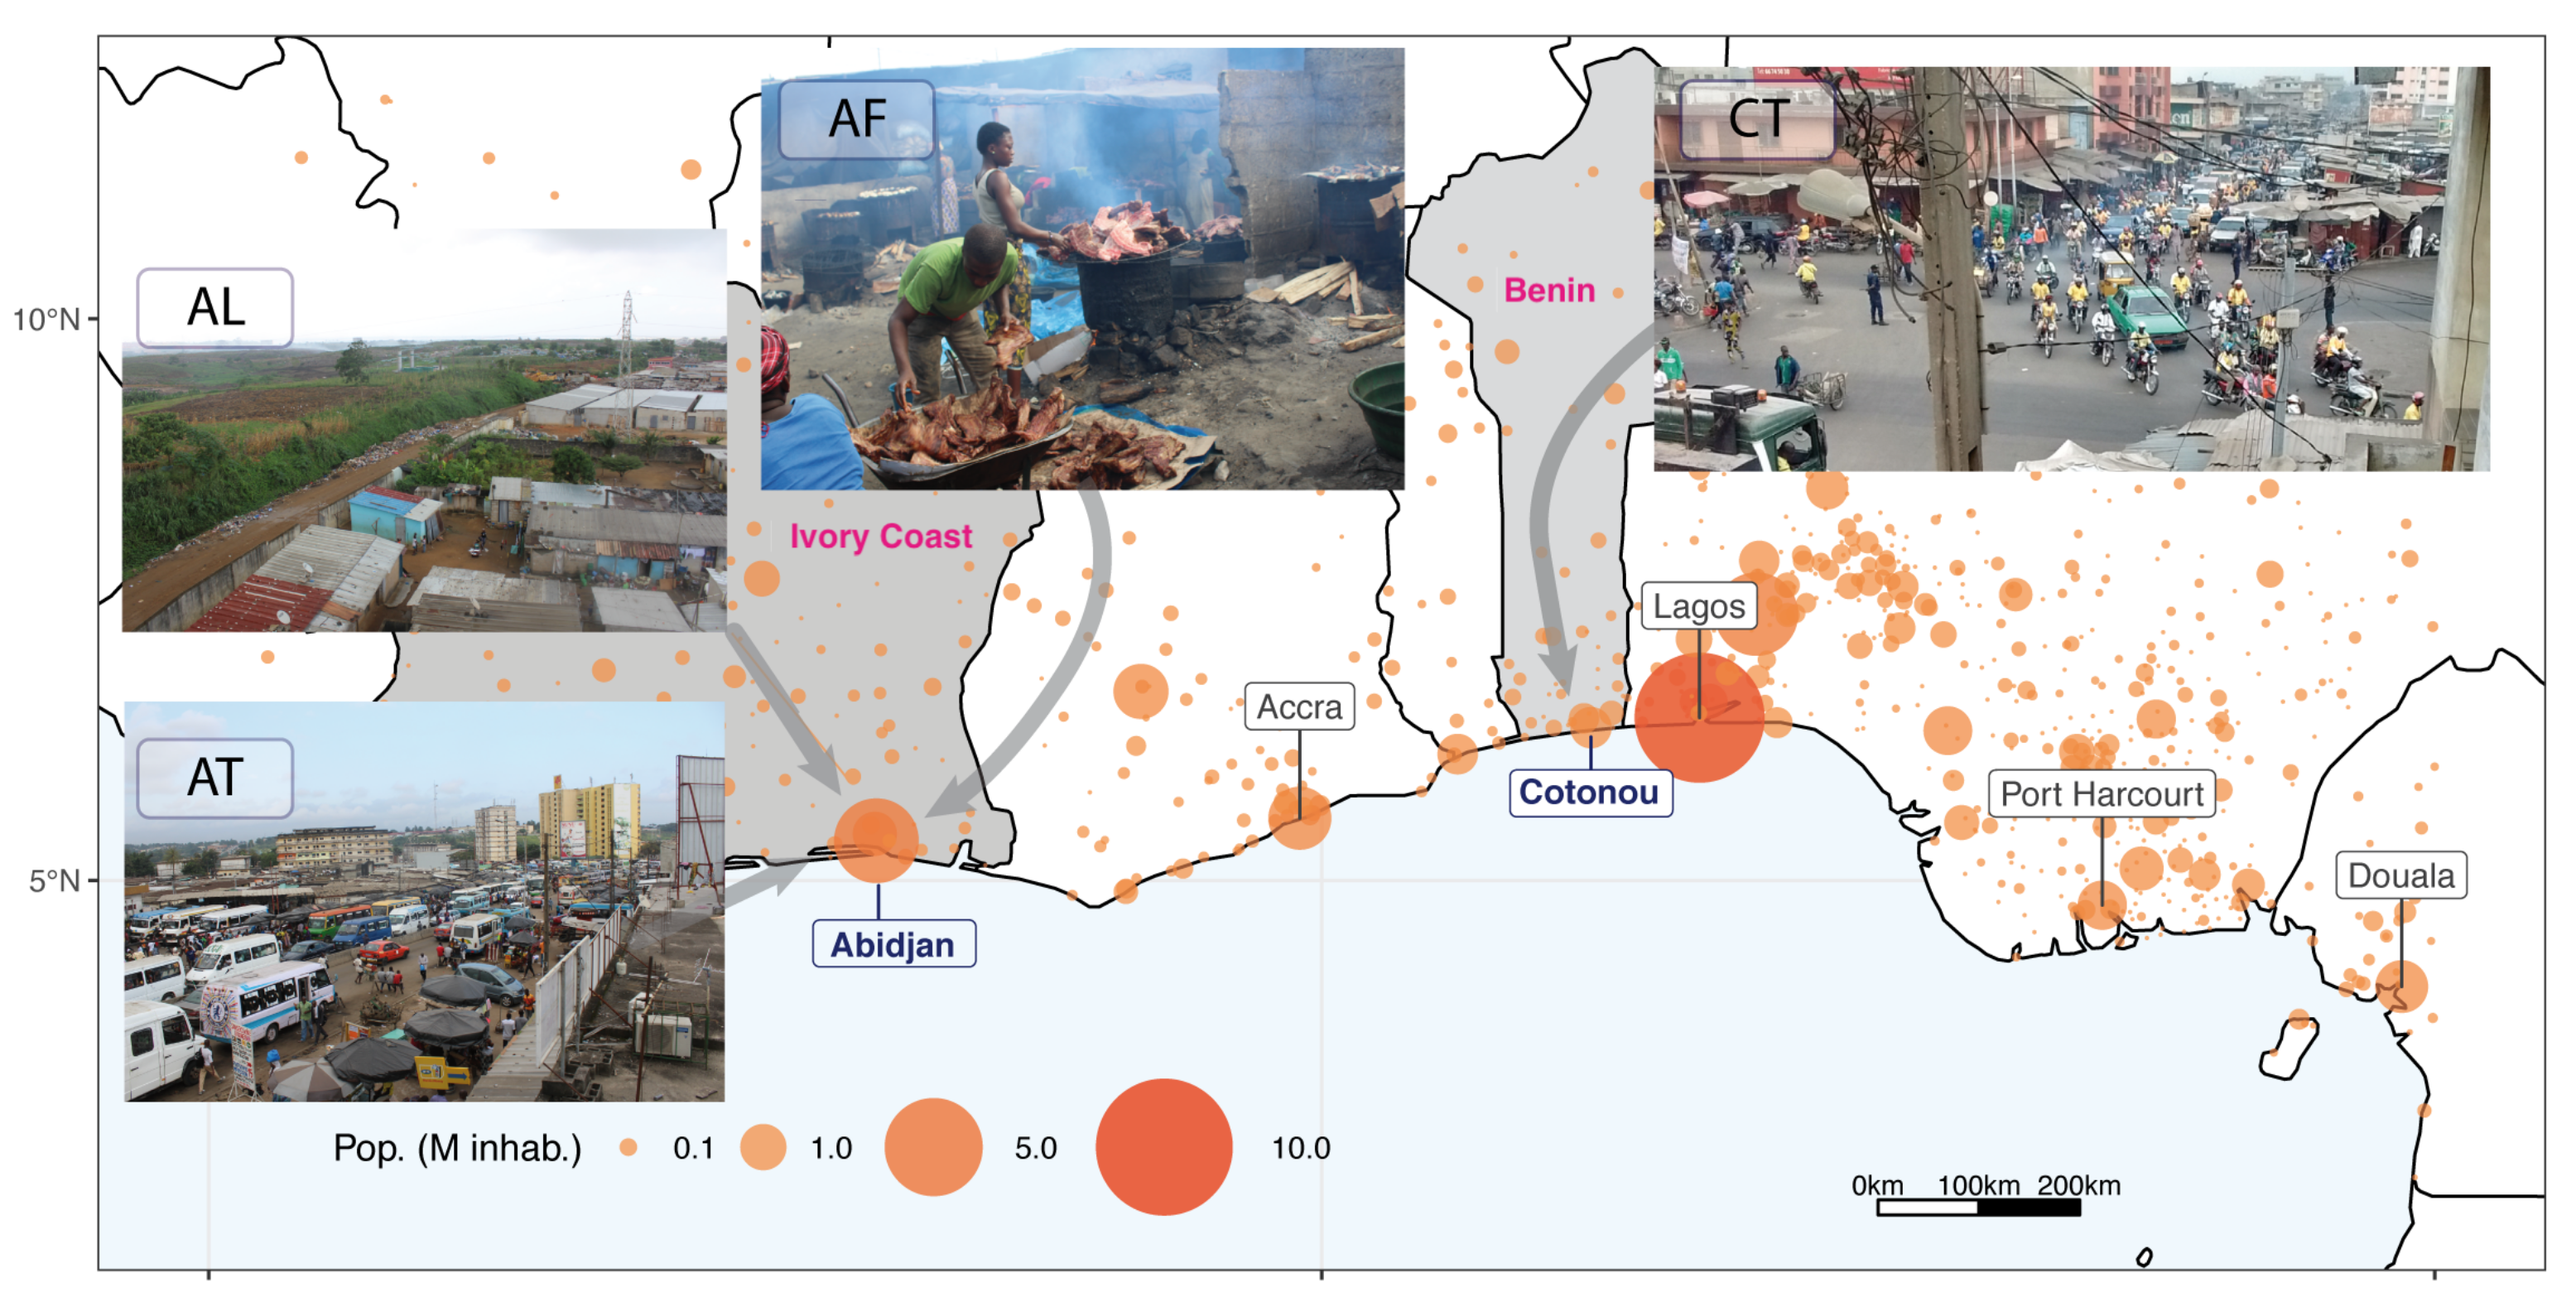
2.1. Sampling Sites

PM2.5 filters were sampled in Abidjan (Ivory Coast) and in Cotonou (Benin), between February 2015 and March 2017. These two cities are the main economic centers of their respective countries. The urban areas of Abidjan and Cotonou have a population of 5.2 and 2.5 million, respectively. They are both located on the northern shore of the Gulf of Guinea (Figure 1).
They benefit from a sub equatorial climate with two dry and two wet seasons. The long wet season stretches from April to July (Figure 2) and is dominated by Southwestern prevailing winds carrying humidity to the continent, and it is also known as the West African Monsoon [43]. The long wet season is followed by a short dry period from August to September, associated with the lowest temperatures and highest winds. The short wet period lasts for 2 months from October to November, characterized by a Southwestern wind from the Gulf of Guinea with a meridional component being higher in Cotonou than in Abidjan due its eastern position [44]. The long dry season stretches from the end of November to March, when the region is influenced by dry Northeasterly winds from the Sahel, also known as the Harmattan, that brings mineral dust from arid areas [45]. The drop in the meridional wind component (V) in the weekly time series (Figure 2) indicates the Harmattan period, although the V component is still largely influenced by the coastal sea breeze [46]. The Harmattan is usually associated with air temperature drop and dusty conditions. December and January are the most affected by the Harmattan regime, in particular during the 2015–2016 winter. During this period pollutants emitted by savanna and agricultural waste burning are also advected to the coast by continental outflow [47]. Air temperature variations in both cities are very similar, following closely the same trends (Figure 2). The air temperatures reach a maximum (30 °C) in April and a minimum (25 °C) in July or August.
To characterize different emissions sources, four sites were sampled: two traffic sites (Cotonou site CT and Abidjan site, AT) and in addition in Abidjan a waste burning site (AL) and domestic fires site (AF). The combustion sources investigated were targeted to transportation, food smoking and waste burning [18]. PM emissions in the African urban centers are derived from or are due to transportation but also from heavily polluting combustion sources, like charcoal making, food smoking and barbecue or open air waste burning [13,48].
The traffic site in Cotonou (CT) is located in the Dantokpa area, one the biggest markets in Africa. The transport sector in Cotonou is dominated by two-wheel vehicles with gasoline as the main fuel source. The sampler instrument is located on a 4 m high balcony, above a major cross-road (Figure 1). The traffic site in Abidjan (AT) is located in the Adjamé sector. The traffic in Abidjan is dominated by cars and small buses using diesel fuel. The sampler being located on the roof of a commercial building. The domestic fireplace site (AF) is located in the market courtyard of Yopougon-Lubafrique. There is heavy use of fireplaces to smoke meat and fish or roast peanuts, and the main fuel source is hevea wood, in a total of 25 fireplaces (Figure 1). The instrumentation in this case is located on a 3-meter height tower. The waste burning site (AL) is located near the public landfill of Abidjan, in the village of Akeoudo. The landfill of Abidjan was closed in 2019 and until then was collecting all the waste produced in the district of Abidjan for the last 50 years. The dump has received about 1M t of waste a year in the last years [49]. The dump is connected to the city by unpaved roads (Figure 1). The workers at the landfill burn waste for recycling mainly in the dry season. Also, during this season spontaneous ignition of the waste can also occur. The sampling instrument is located on a three-store building at roughly 12 m above ground and at a distance of about 500 m from the place where the trashes are burnt.

2.2. Sampling

The sampling was done with a mini Partisol PM2.5 inlet using an airflow of 5 L min−1 [18]. Samples were taken weekly (some weeks were not sampled due to technical issues), by pumping ambient air for 15 min every hour. A total of 440 samples were retrieved from February 2015 to March 2017. For each sample, two 47 mm diameter filters (PTFE and quartz filters ) were collected, thanks to two sampling lines running in parallel and equipped with NILU filter holders [18]. After the exposure, the filters were stored individually in petri dishes covered by aluminum foil. The quartz filters were used for carbonaceous aerosols analysis using a DRI thermo/optical carbon analyser [50,51,52,53] and following the IMPROVE protocol [54]. PTFE filters were used for gravimetric measurements using a microbalance Sartorius MC21S. The total volume of air sampled each week is measured using a Gallus-type G4 gas meter. The PM2.5 concentration and carbon species data are reported in Djossou et al. [18]. The 440 PTFE filters were cut in half with a ceramic scissor, with one half being used in this study. Observations are normalized by the corresponding surface. The filters were folded and put inside gelcaps to facilitate their handling. The gelcaps were placed inside of paleomagnetic sample plastic boxes for the measurements. Due to technical issues, only 356 were successfully analyzed. The AT and AF sites have missing magnetic data on the first half (from March 2015 to November 2015) and second half (from March 2016 to April 2017) of their time series respectively.

2.3. Magnetic Methods

The magnetic investigation of the 356 quartz filters was done in the Laboratory of Paleomagnetism and Rock magnetism of the University of Sao Paulo (USPMAG), Brazil. The measurement protocol started using an alternating field demagnetization (AF), followed by anhysteretic remanent magnetization acquisition (ARM) and isothermal remanent magnetization acquisition (IRM). The AF demagnetization, ARM acquisition and measurement and IRM measurements were performed with a 755–1.65 DC SQUID magnetometer (2G enterprises), with a precision of 10−9 emu, located in a magnetically shielded room with ambient field inferior to 500 nT. The IRM inductions were imparted on a pulse magnetizer (Magnetic Measurements Ltd., Lancs, UK).
All measurements are an average of three repeated measures of the magnetic moment. All samples were demagnetized along three axis in an AF peak field of 300 mT. After that, 94 samples were subject to progressive stepwise acquisition of the ARM under 30 μT bias field up to 300 mT, and AF demagnetization from 300 mT (demagnetization curve of the ARM following Egli [55]). The remaining samples (262) were given a one-step ARM in a bias field of 30 μT with superimposed AF of 100 mT. The susceptibility of the ARM (xARM) is calculated by dividing the magnetic moment in A m2 by the bias field in A/m. IRM’s were imparted by inducing fields of 1T (in this case considered as the saturation isothermal remanent magnetization, SIRM) and a back field of 300 mT (IRM-300mT). The SIRM parameter gives a qualitative concentration of the soft coercive magnetic carriers [56]. The mean destructive field (MDF) is determined from the intersection of the acquisition and demagnetization of the ARM curves, where half of the magnetization is lost. It gives information about the coercivity of the magnetic mineral, which is how hard it is for a mineral to lose its magnetization under demagnetisation conditions [57]. Low coercivity minerals could be ferrimagnetic magnetite-like, and high coercivity minerals could be hematite and goethite. The S ratio (defined by IRM-300mT/SIRM) is used to evaluate the proportion of high and low coercivity magnetic minerals in the sample [58]. Volume normalized SIRM (SIRMV) gives the concentration of iron oxides in air volume, in A m−1. Mass normalized SIRM (SIRMM) provides the magnetic content in PM2.5, expressed in A m2 kg−1. The same normalization was applied in the ARM values, with ARMV and ARMM for volume and mass normalizations respectively. The ratio between xARM/SIRM is a useful tool for discerning the size of ferrimagnetic magnetite- like minerals, and when plotted against the MDF of the ARM it will distinguish between fine and coarse grain sizes [59].

2.4. Scanning Electronic Microscopy

Morphology and size of the iron oxides in representative samples (4 filters) were characterized through Scanning Electronic Microscopy (SEM), using a JEOL JSM 7100F. For characterization of composition, EDS were performed with an Oxford Instrument Detector (XMAX = 80 mm2). All micro-characterizations were done at the Centre De Microcaractérisation Raimond Castaing (Toulouse, France). The samples (quartz filters) were pretreated with a carbon coating and using conductive silver adhesives.

3. Results

3.1. Magnetic Mineralogy

ARM acquisition curves display saturation varying from 1.88 × 10⁻⁵ to 2.15 × 10⁻⁴ A m2, at 80 mT. Mean MDF’s range from 33 mT to 35 mT.
S-ratio varies from 0.90 to 1.00 at the AF site, between 0.67 to 1.00 at the AL site, between 0.65 and 1.00 at the AT site and between 0.87 and 1.00 at the CT site. Mean values for S-ratio are above 0.96 for all sites (Table 1), pointing out to a dominance of low coercivity minerals for all sites and a mainly small component of high coercivity minerals like goethite and hematite.

3.2. Particulate Matter Magnetic Properties

Volume normalized SIRM (SIRMV) values range between 4.87 × 10⁻¹² A m−1 and 2.62 × 10⁻⁹ A m−1 with site means between (Table 1) 6.83 × 10⁻¹⁰ A m−1 (AF site) and 4.90 × 10⁻¹⁰ A m−1 (CT site).
Mass normalized SIRM (SIRMM) values evolve between 2.87 × 10⁻⁵ A m2 kg−1 to 7.55 × 10⁻² A m2 kg−1. Site means display similar values of 2.23 × 10⁻² A m2 kg−1, 2.28 × 10⁻² A m2 kg−1 and 2.21 × 10⁻² A m2 kg−1 for the AT, CT and AL sites respectively, whereas the AF site presents the lowest value (0.53 × 10⁻² A m2 kg−1).
The weekly xARM/SIRM ratio ranges from 8.06 × 10⁻⁵ to 7.02 × 10⁻³ m A−1. Mean ratios are between 6.57 × 10⁻⁴ and 7.32 × 10⁻⁴ m A−1 for CT and AT sites, respectively. Weekly values of SIRMV display moderate but significant correlations with PM2.5 concentration (Figure 3a), with Pearson correlation coefficients R values of 0.42, 0.44, 0.37 and 0.28 for the AT site, CT site, AL site and AF site respectively. Considering all the sites, the correlation coefficient is R = 0.40 (p < 0.01). The average SIRMV for each site is strongly correlated to the average EC concentrations (R = 0.94) (Figure 3b) while the R coefficient is 0.77 for the correlation with the PM2.5 concentration means.

3.3. Time Series of Concentration (Volume Normalized) Parameters

Both traffic (AT and CT) and AL sites present similar variations (Figure 4) in the concentration of PM2.5 and EC, having well marked peaks during the Harmattan periods in both years. The magnetic parameters (ARMV and SIRMV) also follow similar patterns in those sites, albeit with a stronger variability, especially in AL site.
The domestic fire site (AF) presents the opposite behavior compared to the other sites, displaying an increase in the concentrations of PM2.5 and EC in the first months of sampling. The AF site shows a large increase in the concentrations of EC and PM2.5 peaking in July of 2015, which can be also observed in the magnetic parameters. The mid seasons bring a decrease in the concentrations of EC and PM2.5 till the beginning of the Harmattan period in December. The magnetic parameters follow the trends of the PM2.5 and EC concentrations, with greater variability (Figure 4).
For the AL and CT sites (Figure 4), the time series starts in February 2015, at the end of the Harmattan wind period. The concentrations of PM2.5 and EC stagnate at low values till the end of the Monsoon season. In the mid seasons, from August of 2015 till November, there is an increasing trend in the PM2.5 and EC concentrations at the AL and CT sites. This is also observed in the magnetic parameters at CT site. The transition from the small wet period in November to the Harmattan period in December of 2015 in the AT, AL and CT sites (the AF site has no data after January of 2016) is marked by a large increase in the concentrations of EC and PM2.5, with concentrations multiplied by two to three times fold. Magnetic parameters show similar increases, especially at the traffic sites (AT and CT). As the Harmattan period progresses, the concentrations of EC and PM2.5 decrease till March of 2016, where they stay stable at the three sites (AT, CT and AL). The magnetic parameters display those same trends, especially at CT and AT sites. All parameters remain stable till the beginning of the Harmattan period, once again increasing the concentrations of EC and PM2.5 and magnetic parameters at the three sites (AL, CT and AT) (Figure 4).
We can observe a large influence of the wind on the PM2.5 concentration and the magnetics parameters, except for the AF site. The alternation of Monsoon and Harmattan regimes is well reflected by the meridional wind component (V) variation. The anti-correlation between PM2.5 and the meridional component of the wind reaches R = −0.75 for the AT site. Increase in the V component reflects the influence of clean marine air carried by the Monsoon flow towards the sites. Conversely, low V component indicates a Northeasterly Harmattan wind carrying continental aerosols to the sites and thus increasing the PM2.5 concentrations.The AF site is not affected by such a feature, however the rainfall may have an impact on emission during wood combustion [13,18].

3.4. Seasonal Influence of Harmattan Wind and West African Monsoon

To investigate the influence of the meteorological conditions (Figure 2), we selected the most characteristic periods, meaning the lowest values for pluviometry and Southwestern winds for the period influenced by the Harmattan wind (three first weeks on December 2015 and the two last weeks in January 2016), and the highest pluviometry and Southwestern wind for the monsoon period (June and July, of 2015 for AL, AF and CT sites and 2016 for AT site).
Seasonal SIRMV means (Figure 5) display higher values at the AT site in comparison to the CT site, in both seasons, with means ranging from 7.57 × 10⁻¹⁰ A m−1 to 6.76 × 10⁻¹⁰ A m−1 in the AT site and ranging from 6.13 × 10⁻¹⁰ A m−1 to 4.14 × 10¹⁰ A m−1 in the CT site during the Harmattan and Monsoon seasons respectively. The value of SIRMV at the AL site is higher during the dry period ( 5.94 × 10⁻¹⁰ A m−1) compared to the wet one (4.16 × 10⁻¹⁰ A m−1). The AF site has a lower mean value during the Harmattan season (5.50 × 10⁻¹⁰ A m−1) in comparison to the Monsoon season (9.81 × 10⁻¹⁰ A m−1).
The SIRMM means calculated for the traffic sites (AT, CT) and the AL site during both seasons display similar behaviors in being higher during the Monsoon than during the Harmattan period. Seasonal means during the Harmattan and Monsoon seasons are 1.37 × 10⁻² and 3.25 × 10⁻² A m2 kg−1 in the AT site, 1.72 × 10⁻² and 2.98 × 10⁻² A m2 kg−1 in the CT site, 1.24 × 10⁻² and 2.41 × 10⁻² A m2 kg−1 in the AL site, respectively. Conversely, the AF site has a smaller mean during the wet period (0.46 × 10⁻² A m2 kg−1) than during the Harmattan period (0.70 × 10⁻² A m2 kg−1).
S-ratio means (Table 1) of the four sites during the Harmattan period varies between 0.95 and 0.97. During the Monsoon, the S-ratio means range from 0.98 to 0.95 with the highest values in the AT site and the lowest at the AF site.
The Harmattan wind affects more the traffic sites and AL site, depicted by a mineral input from dust characterized by high coercivity minerals (hematite, goethite). The Harmattan wind also facilitates resuspension due to its drier characteristic, resulting in an increase in EC concentration in those sites. The AF site, on the other hand, is affected by the humidity of the Monsoon season, with enhanced values in EC concentration and volume normalized magnetic parameters (SIRMV and ARMV).

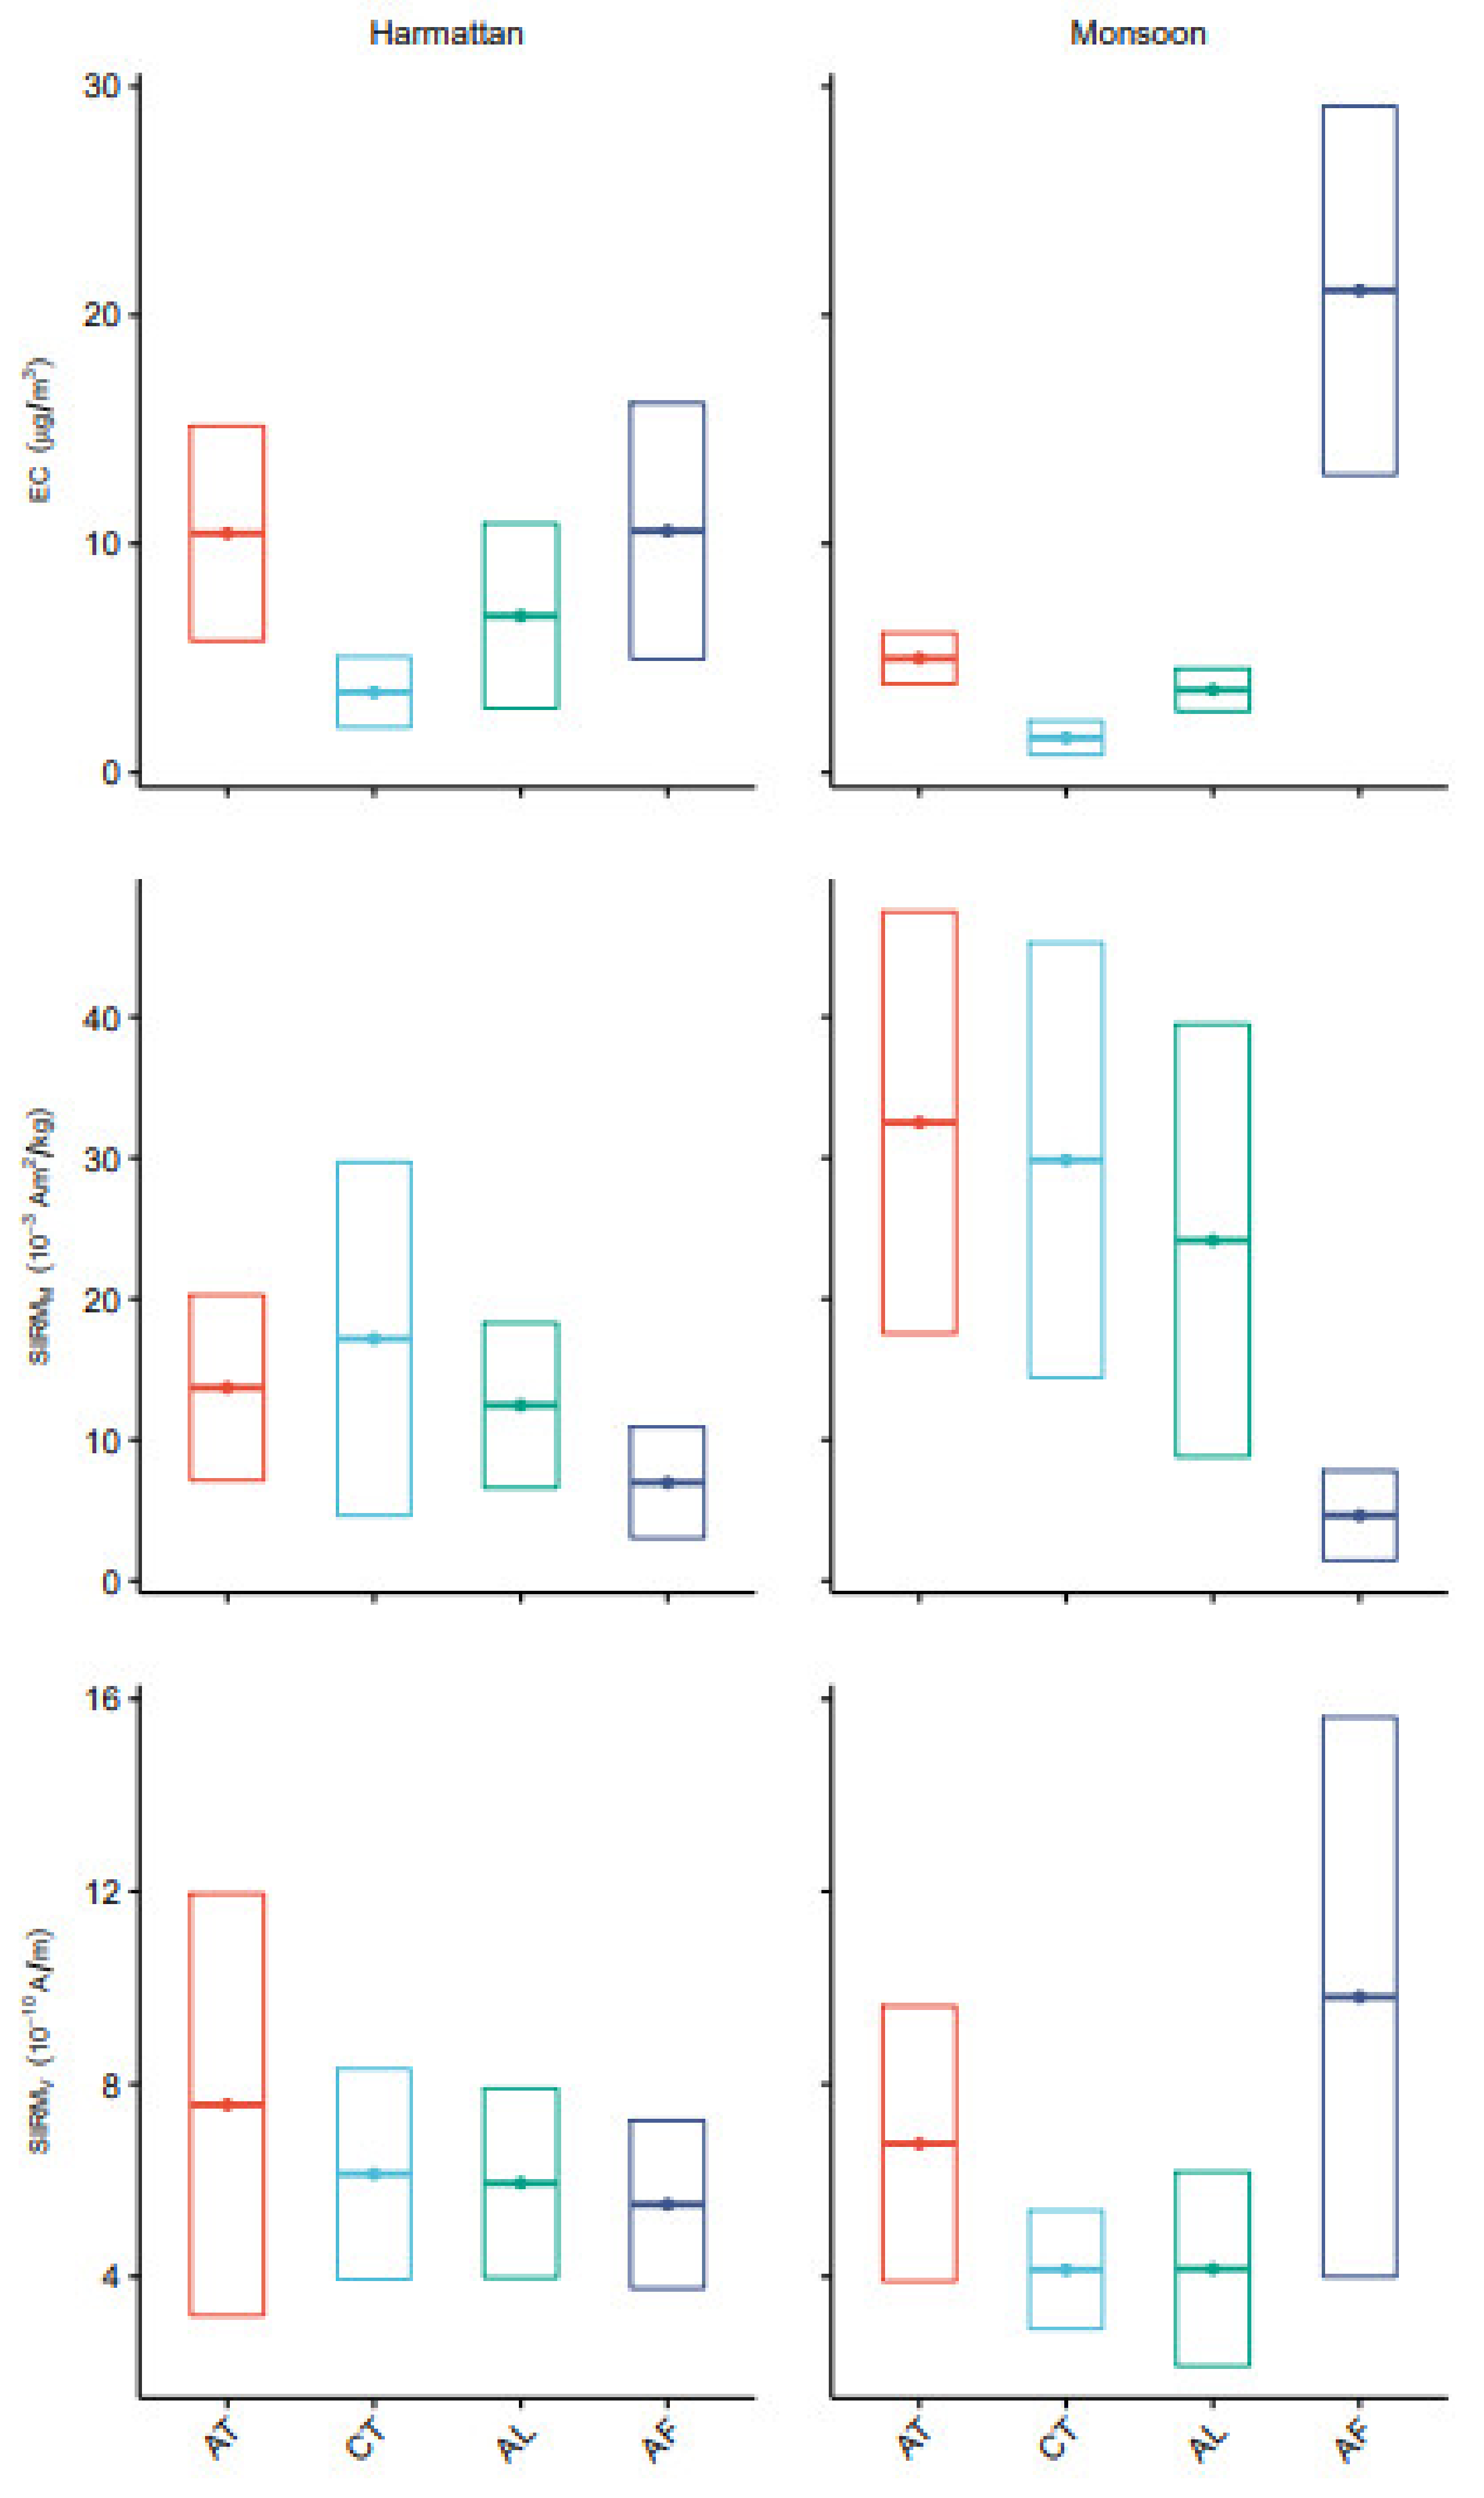
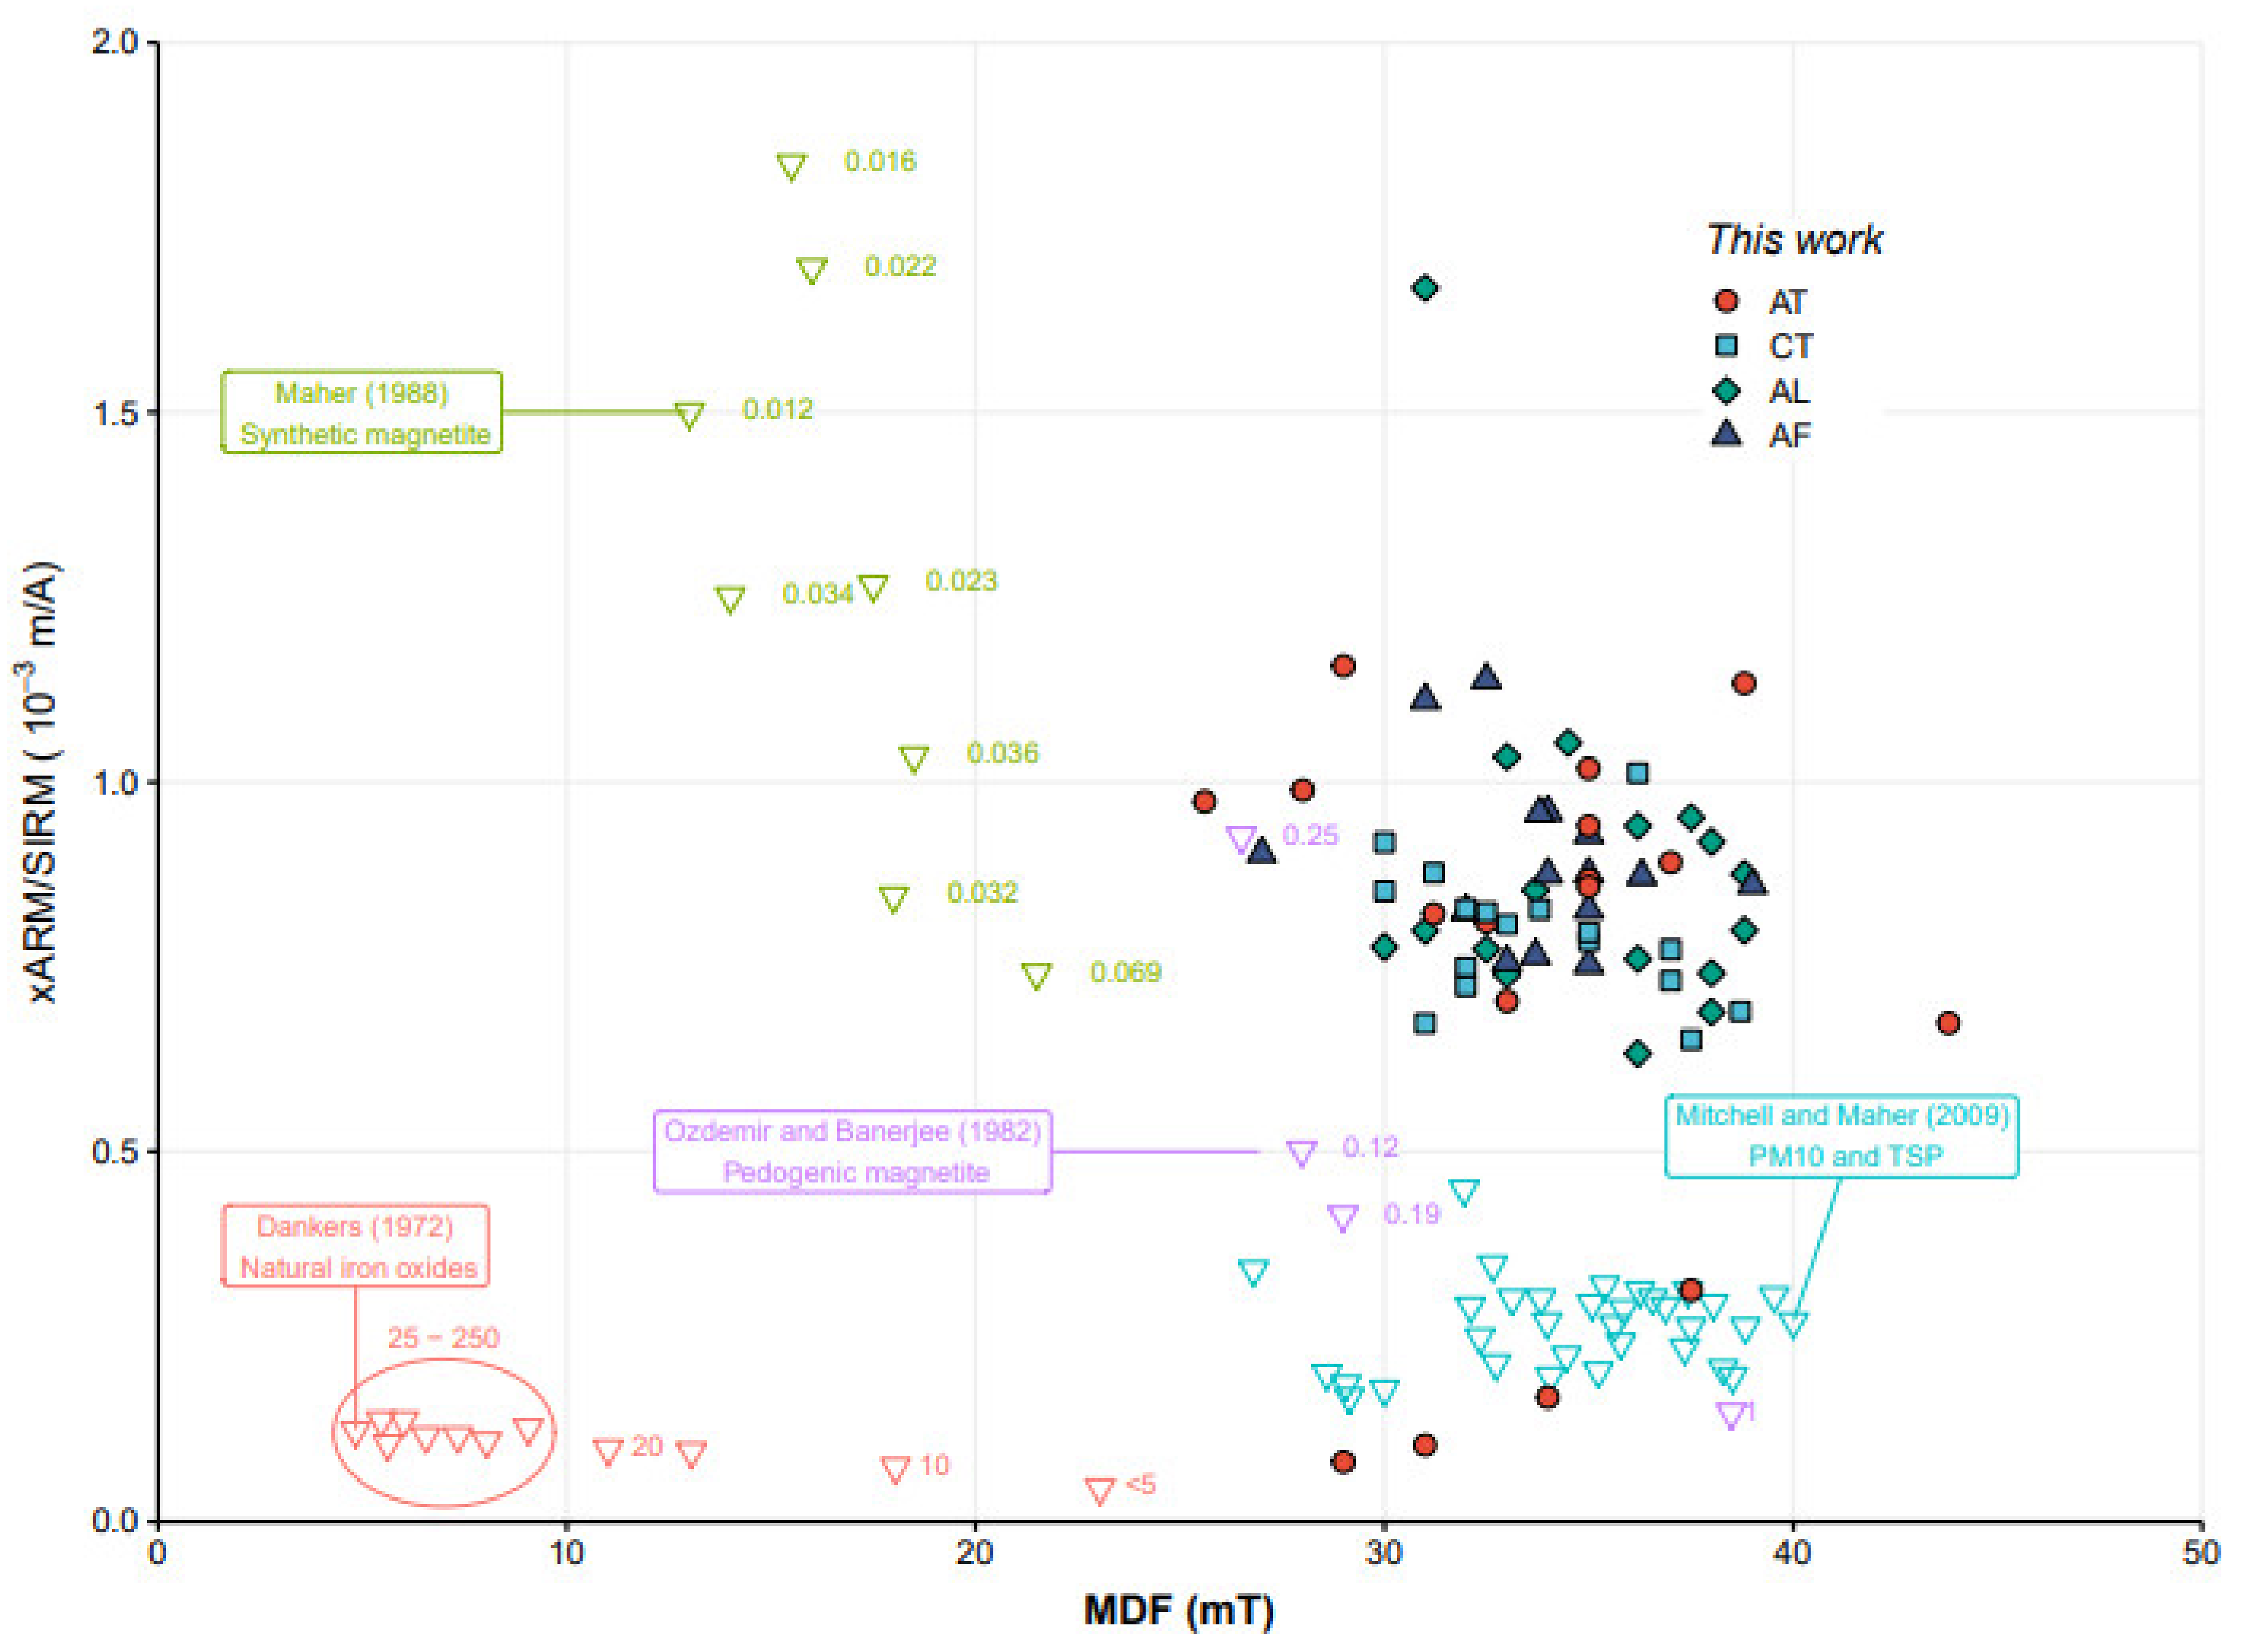
3.5. Grain Size Parameters

As the magnetic mineralogy is dominated by low coercivity minerals, assessment of grain size may be achieved with the ratio between xARM and SIRMM. In Figure 6, the xARM/SIRM ratio is plotted against the MDF. The samples presented in this study range in xARM/SIRM from 1.0 × 10⁻⁴ m A−1 to 1.7 × 10⁻³ m A−1. They are well-grouped without any distinctions regarding the site. Four samples from the AT site are located below the xARM/SIRM of 5.0 × 10⁻⁴ m A−1, and one sample from the AL site is located above 1.5 × 10⁻³ m A−1. These five samples lying outside the main group were all collected in December in both years.

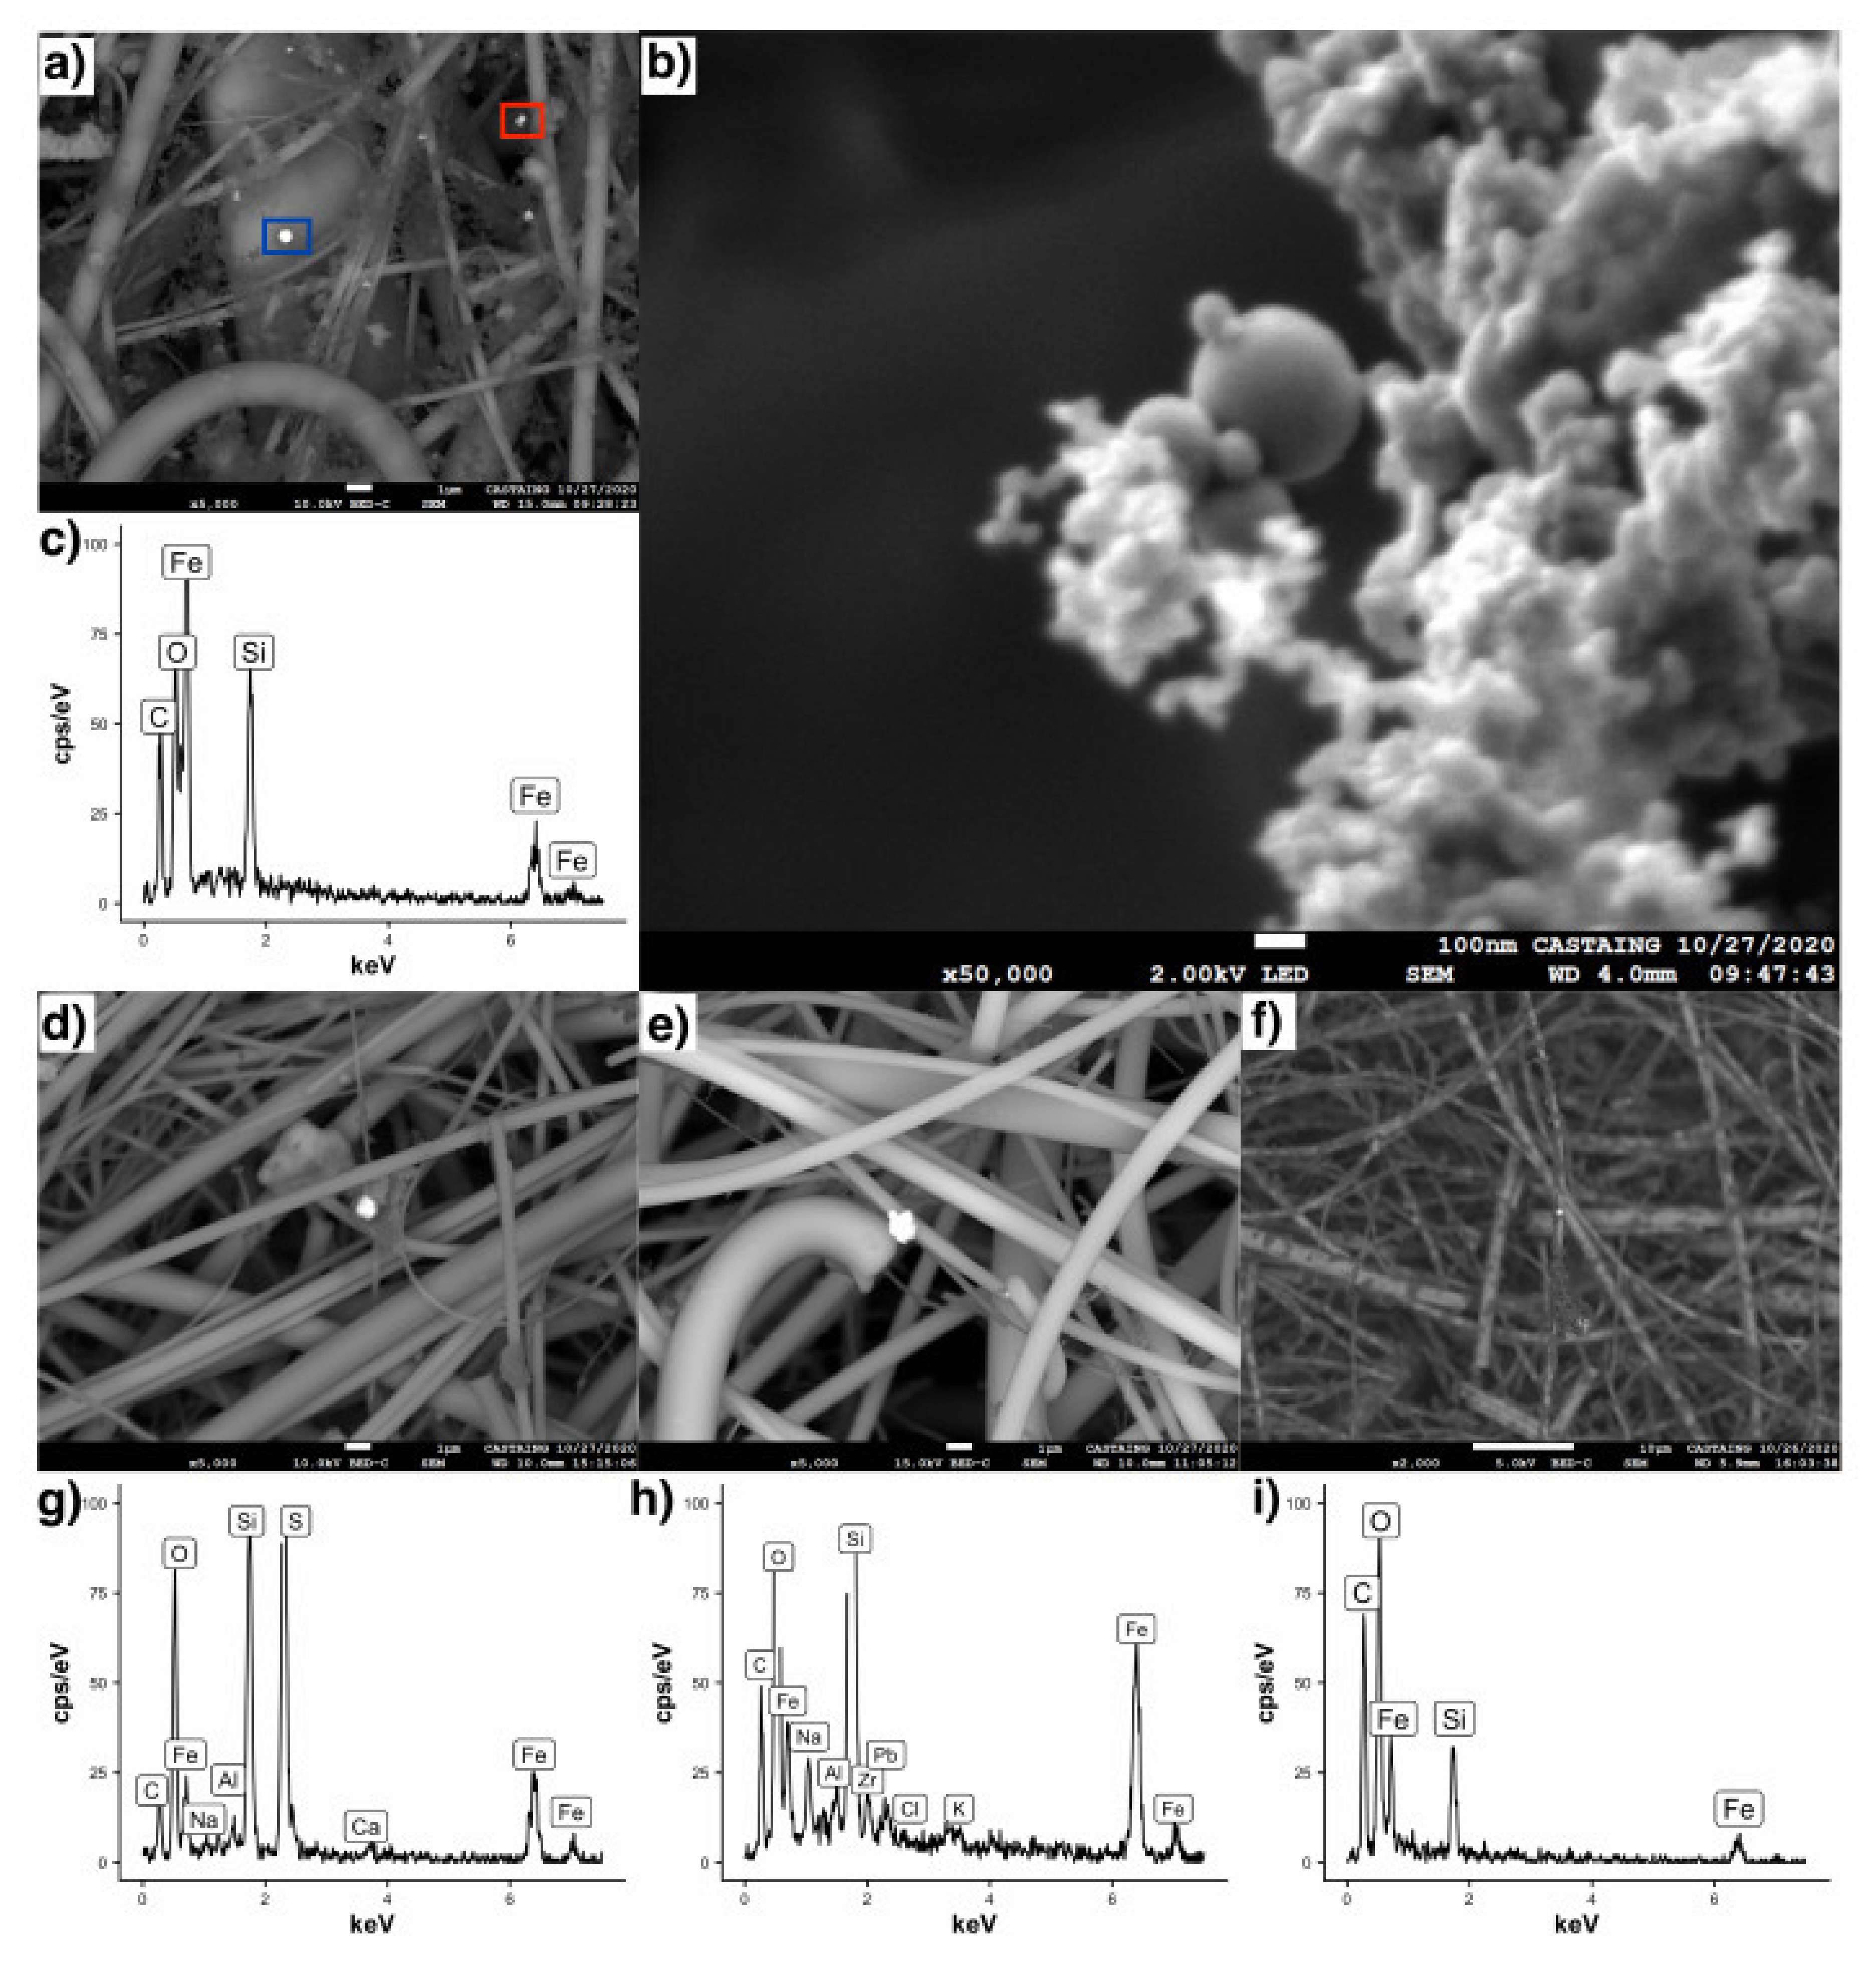
3.6. Scanning Electronic Microscopy

SEM observations indicate that the PM2.5 particles captured in the filters are a mix of carbon-rich chains, fluffy soot aggregates (Figure 7), iron oxides with different shapes (spherical fly ashes and irregular shapes, Figure 7), and aggregates containing different proportions of elements (including Al, Ca, S, PB, Si, K, Figure 7). The spherical fly ashes (iron oxide spherules) were found in all sites with the exception of the CT site. The AT site shows carbon fluffy aggregates trapped in the filter matrix (Figure 7a), with five sub-micron spherical fly ashes (with sizes ranging from 50 to 500 nm), composed of iron oxides (Figure 7c). Some of them are agglomerations of smaller spherules. Figure 7b illustrates such agglomeration displaying six spherules with sizes ranging from 50 to 300 nm, entrapped among the carbon chains. EDS spectra (see an example in Figure 7c) indicate that spherule compositions are dominated by iron and oxygen, with traces of C and Si. Si, present in all samples, may correspond to the matrix of the filter (Quartz).
The observations of the other sites (CT, AL, AF) are presented in Figure 7d–f and respective EDS spectra are presented in Figure 7g–i. We detected iron oxides in all sites. In the CT and AL sites, we observe bright irregular shaped particles at the center of the figures (Figure 7d,e, respectively). In Figure 7d, some carbon aggregates, with a bright particle at its center, points out to a heterogeneous composition. The bright particle has an irregular shape, with dimensions of 0.96 μm and 0.79 μm, composed mainly of Fe and O and traces of S, Ca, Al, Na and Si (Figure 7g). Figure 7e has almost no visible carbon aggregates and chains. The central bright particle is composed of Fe and O with traces of Pb, Zr, Cl, K, Al, Na, C and Si (Figure 7h) with a size of 1.33 μm in width. The filter from the AF site, (Figure 7f) is much more charged in carbon particles than the others, several carbon fluffy aggregates can be observed on one quartz fiber. The bright spherule is composed of Fe and O, with traces of C and Si (Figure 7i). It has a diameter of 0.75 μm.
The iron oxide spherules (or fly ash particles) found at the AT and AF sites (Figure 7a,f) have sub-micron size. They present mainly a Fe-rich composition with C, related to the carbon species released by the different combustion processes in those sites. Those elements point clearly to anthropogenic origin for those particles. The irregular iron oxides found at CT and AL sites (Figure 7d,e) are generally bigger than the spherules.

4. Discussion

The magnetic properties of the coarse PM fraction (PM10 and TSP) are largely influenced by non-exhaust vehicular emissions [24,41,62] that contain Fe-bearing particles and other transition metals. However, the finer fraction (PM2.5) and the influence of combustion emission on its magnetic properties has been less investigated. Iron oxides in urban PM2.5 consist of mixed Fe phases with variable morphologies, particle sizes, and aggregates [27,63]. Recently, Fe-bearing particles were found in association with carbonaceous material [39] and a wide variety of trace elements [64]. Here, for the first time in West Africa, iron oxides are reported in anthropogenicemissions of particulate material in air through the use of environmental magnetism methods.
All sites present iron oxides, among soot and/or aggregates containing crustal elements (Al, Ca, K, Zr), sea salt (Na, Cl) and elements from anthropogenic activities (S, Pb) [65] detected via magnetic and microscopic methods (Figure 7). The detected fly-ash spherules are a marker of anthropogenic combustion emissions, on the sub-micron size range (Figure 7).
The iron oxides detected in West Africa PM2.5 are a mix of ultrafine magnetite-like grains and high coercivity minerals (hematite, goethite). The presence of both ferrimagnetic magnetite-like grains and hard coercivity minerals is detected in all sites and seasons, with a greater influence of the hard coercivity minerals in the dry period.
The presence of soft coercivity magnetic carriers is illustrated by the fact that ARM saturation was achieved at 80 mT [27]. The dominance of magnetite-like minerals on the magnetic fraction seems to be the hallmark of urban PM emissions [66,67,68,69]. Indeed, this was reported in numerous cities (e.g., Mitchell and Maher [27] in Lancaster, UK, Muxworthy et al. [26] in Munich, Germany, Mantovani et al. [33] in Parma, Italy, Saragnese et al. [30] in Torino, Italy, Jordanova et al. [32] in Bulgaria, Castañeda-Miranda et al. [25] in Quéretaro, Mexico, Chaparro et al. [70] in Mar del Plata, Argentina and Shu et al. [37] in Shanghai, China). When reported, S-ratios are generally close to 1. Revuelta et al. [31] calculated S-Ratio of 0.99 on PM2.5 filters in Barcelona. Sagnotti et al. [24] obtained for the Latium region (Italy) a mean S-ratio = 1.00 for PM10 filters. Wang et al. [71] calculated for Nanjing a mean S-ratio = 0.97. The S-ratios reported here are mainly slightly lower, indicating the presence of high coercivity minerals. S-ratio means range between 0.97 (traffic sites AT, CT) and 0.96 (AL and AF sites), and MDF means are close to 33 mT in AT, CT and AF sites and 35 mT in AL site. Those values highlight the influence of the high coercivity minerals such as hematite and goethite in all sites. S-ratio values lower than 0.97 and MDF values above 30 mT have been shown by Frank and Nowaczyk [72] to be due to a mix of hematite and magnetite.
Seasonal variance plays an important role on the air quality, as weather characteristics, such as wind and rain, will change the carrying of continental pollutants and dust through long distances, and facilitate resuspension of local PM [18,73]. High coercivity minerals (goethite/hematite) could be expected in African cities due to intense laden-wind carrying minerals from lateritic soils [74,75]. The wind blows dust from arid areas in the SSA region. It has a magnetic composition of low (magnetite-like) and high coercivity carriers, such as hematite and goethite [42,76]. The Harmattan period, characterized by dry weather and northeasterly winds, displays a change in the magnetic mineral composition of the PM2.5 at both traffic sites and at AL site. This is further substantiated by lower S-ratio during this period in comparison to the Monsoon season indicating a higher contribution of high coercivity minerals (hematite, goethite). Evidently, during the Monsoon, the resuspension and carrying of wind blown dust is diminished, enhancing the influence of the main source of PM (traffic emissions for AT, CT and AL and wood burning for AF) in those sites. Moreover, at the AL site, burning of trash is done mainly during the dry season, increasing the output of emissions during this period [18]. The traffic sites (AT, CT) and AL site also exhibit peaks of concentration of PM2.5, EC and magnetic content in air (SIRMV) during this period, due to resuspension and long distance carrying of pollutants [18,73]. Conversely, the Monsoon season has a diminished influence from non-local sources.
In Abidjan and Cotonou, mean values for the concentration of iron oxides in PM2.5 (SIRMM) -meaning SIRM normalized by PM2.5 mass- equals to 1.65 × 10⁻² A m2 kg−1 and 2.28 × 10⁻² A m2 kg−1 respectively, close to the few magnetic results reported for PM2.5 collected in filters. SIRMM values reported from Barcelona [31] and Beijing [63] range from 2.53 × 10⁻² A m2 kg−1 to 4.56 × 10⁻³ A m2 kg−1 respectively. In both cities, the presence of iron oxides in PM has mainly anthropogenic origins due to traffic and urban emissions (at least in the absence of a strong crustal PM source with North African origin for Barcelona). Conversely, in Nanjing, Wang et al. [71] report (for PM2.5 samples taken twice a day) higher SIRMM values of 4.98 × 10⁻¹ A m2 kg−1 (winter) and 5.42 × 10⁻¹ A m2 kg−1 (summer). Such high values compared to our own and other studies are probably due to the highly industrialized context.
Magnetic content in air (SIRMV) corresponds to the concentration of iron oxides in air volume (SIRM normalized by air volume pumped in a filter). SIRMV values on PM2.5 are rarely reported in the bibliography. Shi et al. [63] found in Beijing a value for SIRMV of 4.31 × 10⁻¹⁰ A m−1, in the same order of magnitude to the values found in Abidjan and Cotonou. Magnetic content marked by SIRMV and ARMV are significantly higher in the AF site compared to traffic sites (Table 1). The high values of magnetic content (volume normalized) and high EC mean concentration in comparison with the traffic sites indicate a higher volume of emissions at the AF site.
SIRMV and ARMV time series are moderately correlated with PM2.5 mass concentrations. Revuelta et al. [31] found high correlation between the SIRM (normalized by filter area) and total PM with R = 0.89. Mitchell and Maher [27] reported a strong correlation between SIRM (normalized by filter area) of PM10 filters and its PM10 concentrations (R = 0.88). Mantovani et al. [33] obtained correlations with R = 0.34 between the area normalized SIRM for the PM10 filters and concentration of PM10 from a nearby weather station and R = 0.50 between the area normalized SIRM in PM10 filters in comparison to PM2.5 concentration from the same nearby weather station. The time series of the concentration parameters (EC and PM2.5) presented in this work displays some similar trends to the time series of the magnetic parameters in air (SIRMV and ARMV), although the magnetic parameters have a greater variability, with periods where they do not follow the concentration parameters. Nonetheless the site-average PM2.5 is reasonably correlated to the SIRMV when excluding the wood burning site (AF). Wood burning for smoking food leads to the largest concentrations of PM2.5. Combustion process is known to produce ashes with a distinct magnetic signal dominated by low coercivity magnetite-like minerals (e.g., McClean and Kean [77] in wood and Jordanova et al. [78] in cigarette ashes). The AF site displays a general higher PM emission than other sites with PM2.5 and EC concentrations one order of magnitude higher than the other sites. However, the PM2.5 magnetic content (SIRMM) is much lower in the AF site in comparison to the others. This implies that wood burning emits less iron oxides than traffic per unit of PM2.5 emitted during combustion.
The site-wise correlation between means SIRMV and EC concentration is better than between means SIRMV and PM2.5 concentration. This indicates that the iron oxides in PM2.5 detected by this method are mostly related to combustion sources, EC concentration being an indicator of primary emission by combustion.
Our sampling allows us to discern two types of sources: traffic (sites AL, CT and AT) and wood combustion (site AF). The AL site, although subject to waste burning emissions, presents a behavior closer to those of the traffic sites when considering the investigated parameters (magnetic properties and EC/OC ratio from Djossou et al. [18]). This could be explained by the location of the observation base, far from the source, favoring a greater impact of the traffic in the nearby road. Nonetheless, differences in PM sources are not reflected by the magnetic grain size parameters. The xARM/SIRM versus MDF plot displays a narrow distribution for the calculated parameters in all sites, regardless of the sources or the seasons (Figure 6). Outliers in our sample group consist of four samples from the AT site lying close to the PM10 and TSP in Mitchell and Maher [27], and one sample from the AL site plotting above our main group. Those outliers were all sampled in the month of December (both 2015 and 2016), during the dry period where the Harmattan wind is at its peak, blowing dust from arid areas and facilitating the resuspension of particles. Clearly, the Harmattan period brings other sources of iron oxides into the sites, carried in dust and from resuspension, making the source of anthropogenic emissions less clear. The main group of our PM2.5 filters in the Figure 6 correspond to sizes below 0.1 μm synthetic magnetite in terms of xARM/SIRM [59] agreeing to the nanometric size of the fly-ash spherules observed under microscope (Figure 7). However, larger irregular shaped iron oxides and fly ash spherules were also observed (0.3 μm–1.3 μm).
The two investigated traffic sites (AT and CT) show very similar levels of PM2.5 mass concentrations and magnetic parameters. Despite their close location to emission sources, the sampled air is largely affected by large scale transport as reflected by the high correlation with winds and the similarities in the time series while the sites are located 1000 km apart. The traffic from AT site is mostly dominated by diesel vehicles, resulting in an EC concentration that can reach four times fold the EC concentration recorded in CT (Table 1), where traffic is dominated by two-stroke gasoline vehicles. The OC/EC ratio reflects this difference, reaching a factor of two between those two traffic sites [18]. The OC/EC ratio is not reflected by the magnetic grain size of the PM2.5 fraction. The two sites display similar SIRMM but distinctive SIRMV. This indicates higher emissions of iron oxides in Abidjan per air volume agreeing with a higher EC concentration.
The smoking place site (AF) is less affected by regional scale transport. The increase in EC and PM2.5 concentrations during the Monsoon period is associated with an increase in the SIRMV data. This expresses an increase in the release of magnetic particles in the same proportion as EC concentrations. However the proportion of magnetic particles (SIRMM) and mineralogy (S-ratio) are changing from one season to the other. Wood type and humidity can affect the combustion temperature [79] and efficiency resulting in the emission of more organic material as it was observed on AF site. Nevertheless further investigation of the release of Fe-bearing particles by traditional smoking activities under varying conditions is required.

5. Conclusions

In this work we presented the magnetic investigation of the PM2.5 captured by air filters, previously sampled in a two year campaign on the western SSA.
  • Iron oxide spherules (fly-ash), among other particle shapes and compositions have been detected on PM2.5 pumped-air filters in Abidjan and Cotonou cities. This particular shape is an evidence of anthropogenic origin for the iron oxides that originate from the combustion sources (traffic and wood burning) in the vicinity of the sampling locations. The granulometry of the iron oxides in all sites has a narrow distribution, showing that the different sources of emissions are not selective for size in the PM2.5.
  • The magnetic mineralogy is composed of a mix of low (magnetite-like) and high coercivity minerals (hematite, goethite). The influence of the high coercivity minerals is stronger in the dry season in the traffic sites. The waste burning site has a stronger influence from dust since the observation is considerably further from the source of emission.
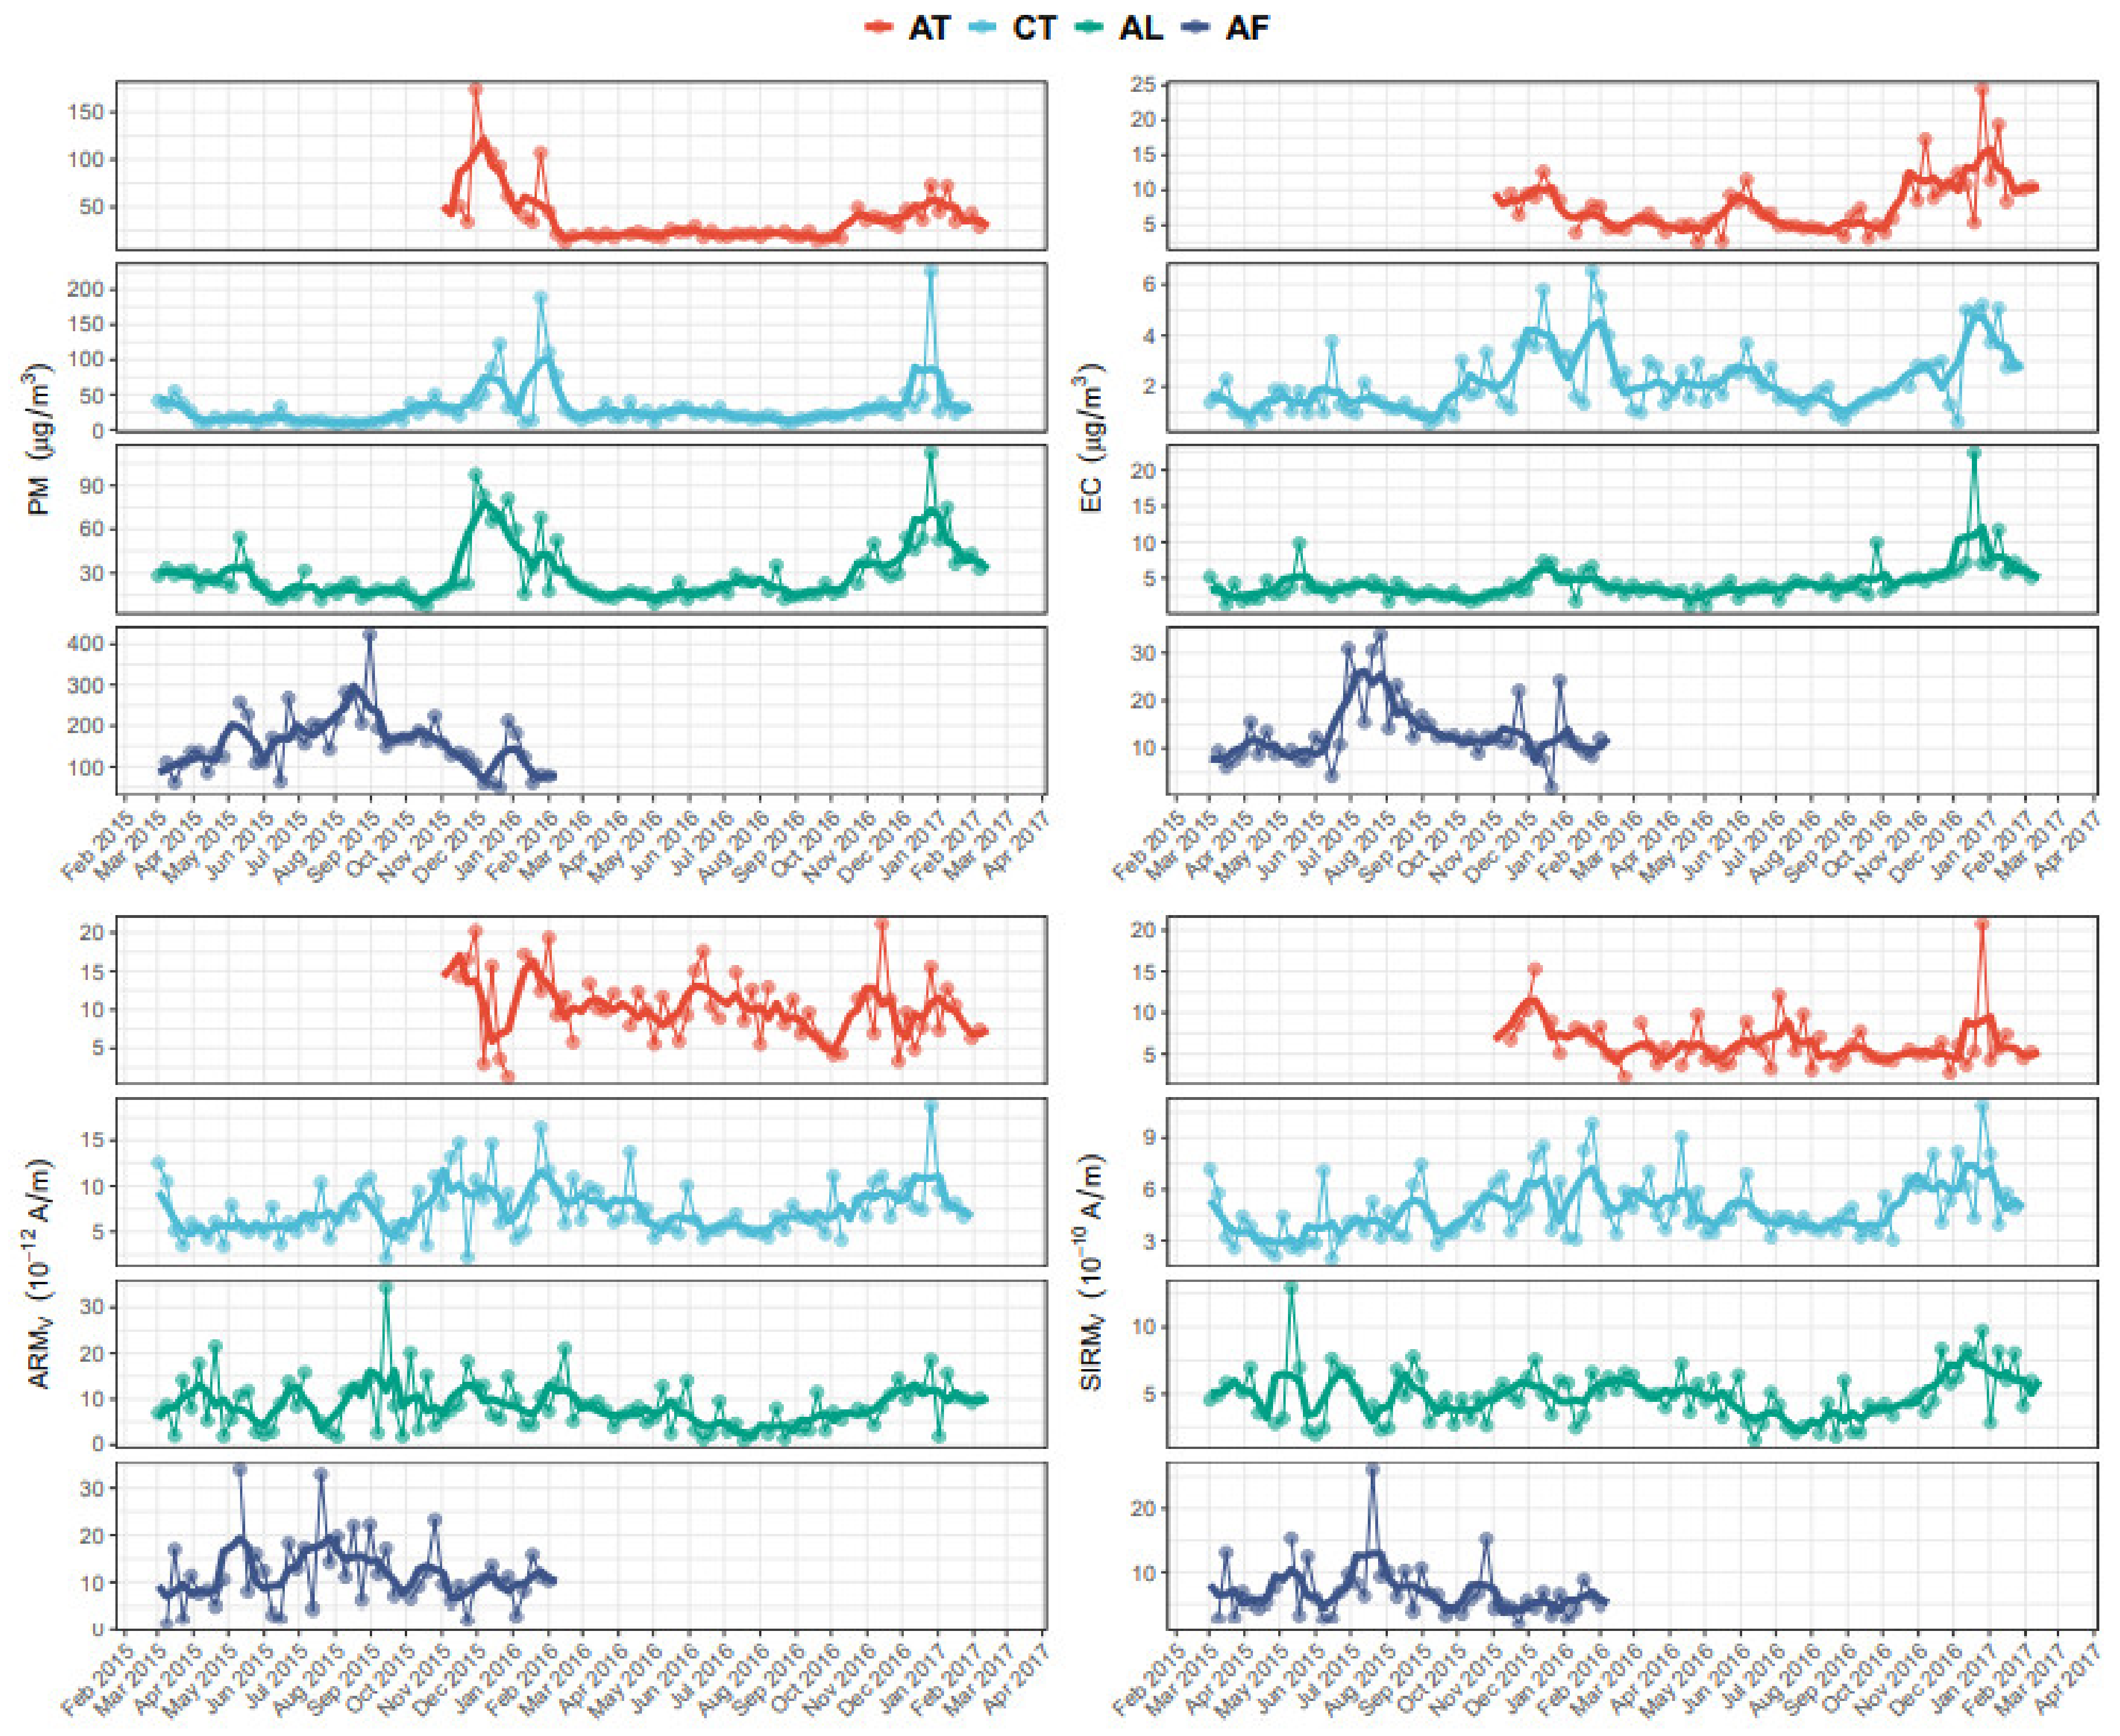
  • Weekly SIRMV and ARMV measured over a 2-years period follows the same seasonal pattern as the PM2.5 and EC (elemental carbon) mass concentrations although the correlation between the time series remains moderate. Both mass and volume SIRM for African cities are in a similar range as previously published values for Europe or Asia.
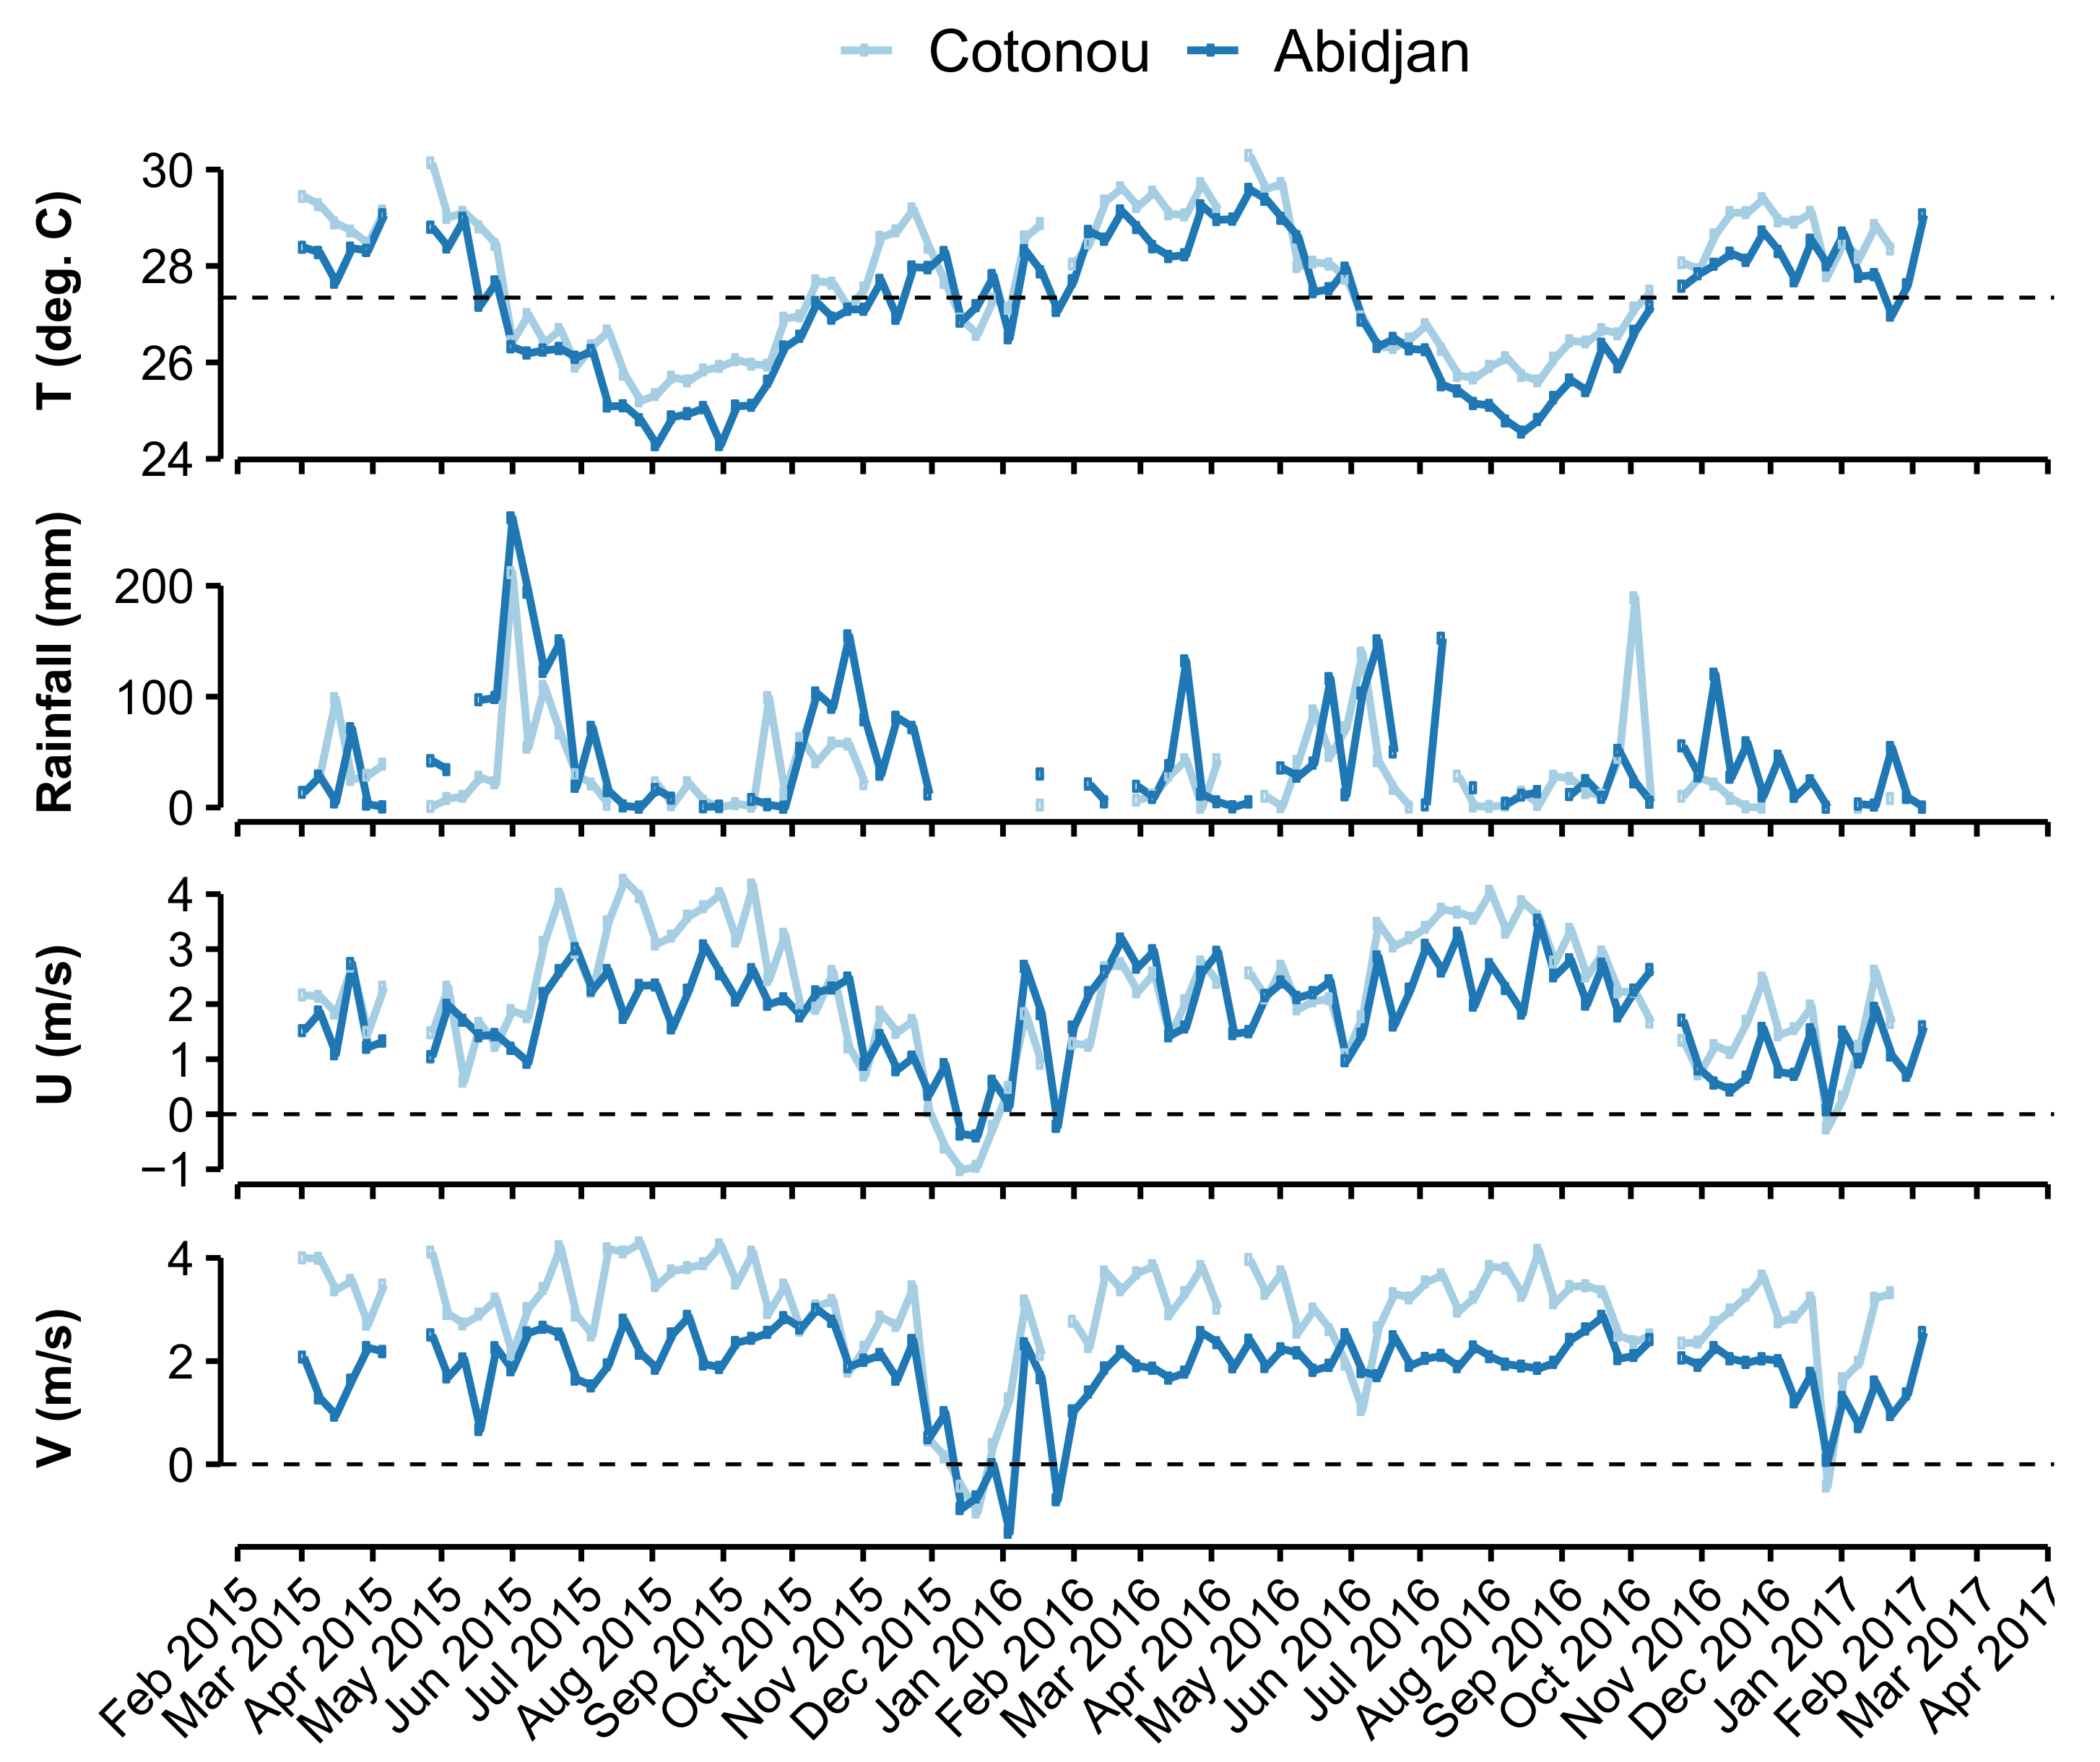
  • Although the samples were acquired in the vicinity of major combustion sources, the alternance of the northeasterly Harmattan wind and the southwesterly Monsoon flow has a significant impact on the magnetic properties. The Harmattan period shows a higher contribution of high coercivity material and increase in PM2.5 concentrations indicating a supply of aelian mineral dust. During the Monsoon, the local source has an enhanced effect in the PM2.5 composition.
  • SIRMM for wood burning activities are lower than for traffic due to the large emission of organic carbon during biomass combustion.
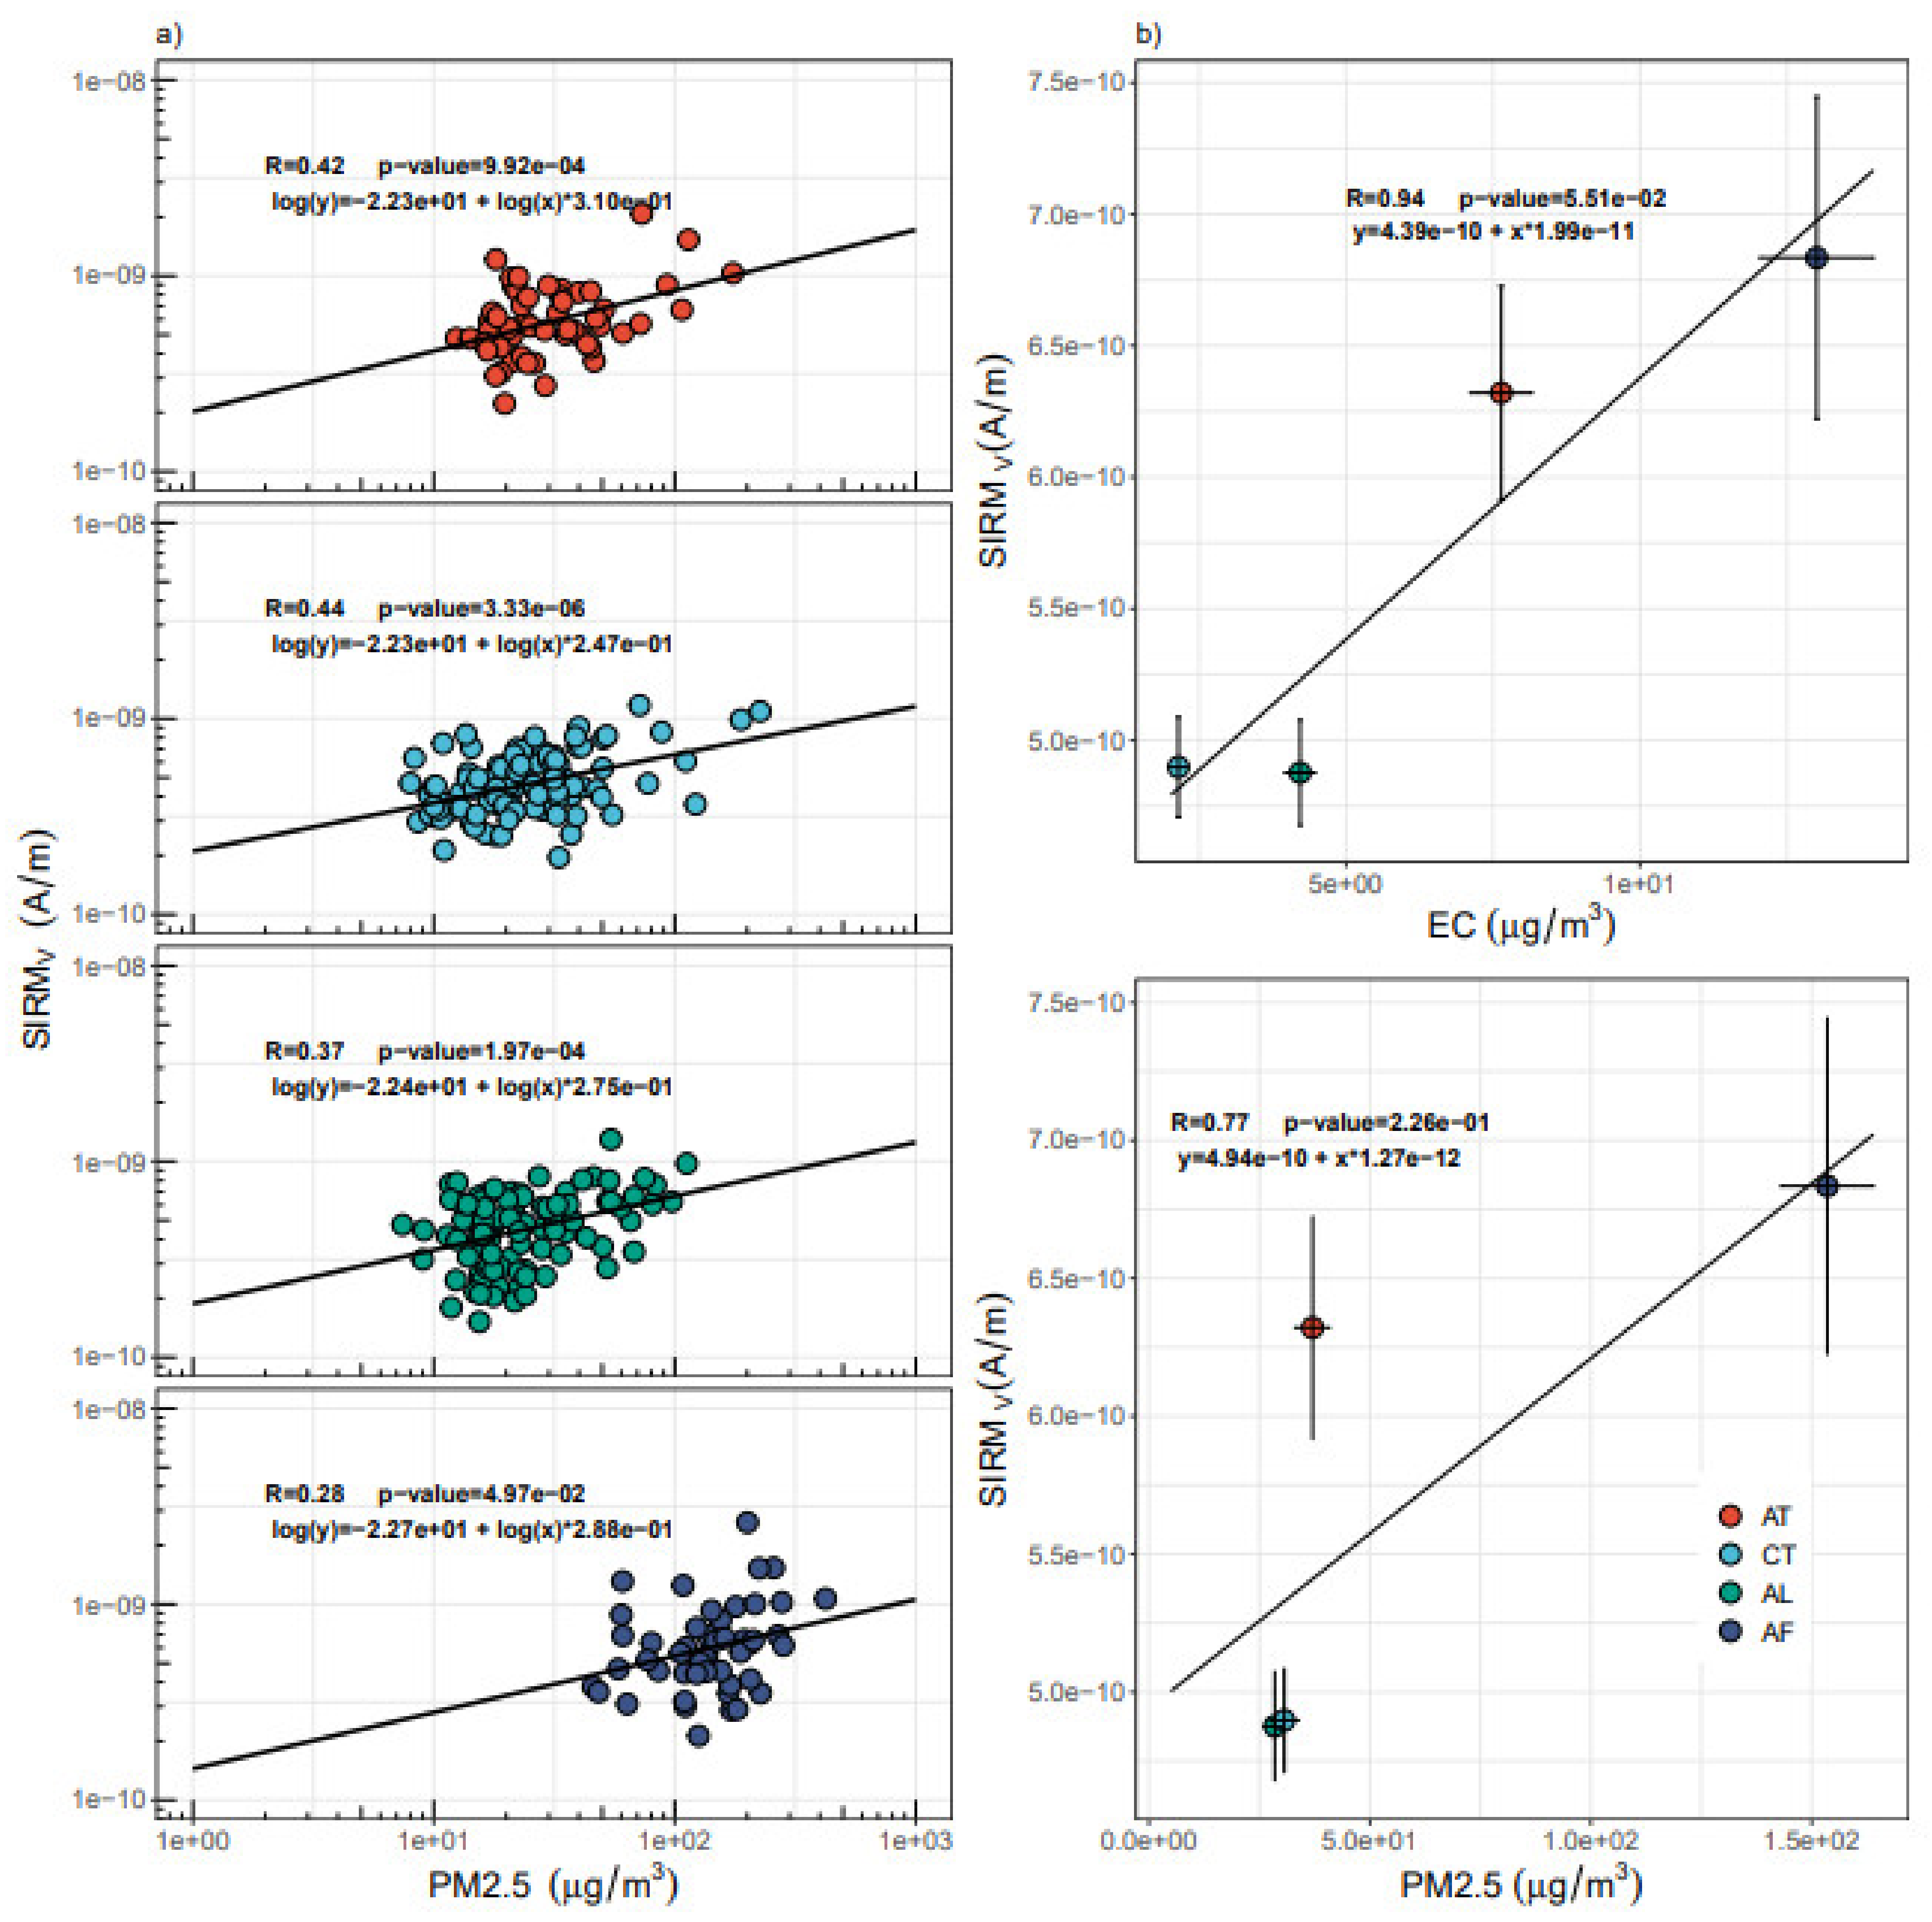
  • We found a robust correlation between elemental carbon mass concentrations and SIRMV and ARMV both for the traffic sites and for the domestic fire site.

Author Contributions

A.d.S.L. was responsible for methodology; validation; formal analysis; investigation; data curation; writing-original draft; writing-review and editing and visualization. J.-F.L. was responsible for conceptualization; methodology; data curation, resources; writing-review and editing; visualization and supervision. M.M. was responsible for conceptualization; methodology; resources; writing-review and editing; visualization; supervision; project administration and funding acquisition. S.R. was responsible for conceptualization; methodology; resources; writing-review and editing and funding acquisition. R.I.F.d.T. was responsible for methodology; resources and supervision. A.P. was responsible for investigation. L.D. was responsible for resources. P.Y.J.A. was responsible for writing-review and editing. A.B.A. was responsible for resources. V.Y. was responsible for resources. C.L. was responsible for resources and writing-review and editing. All authors have read and agreed to the published version of the manuscript.

Funding

This research was funded by the CNRS (Mission pour l’interdisciplinarité MITI-CNRS – Osez l’interdisciplinarité —NanoEnvi project) and of the ANR (BREATHE). A.d.S.L. was supported by a PhD fellowship from the French Ministère de l’Éducation nationale, de l’Enseignement supérieur et de la Recherche (MENESR).

Data Availability Statement

The data presented in this study are available on request from the corresponding author.

Acknowledgments

This work has been (partially) performed at USPMag lab at Instituto de Astronomia, Geofísica e Ciências Atmosféricas (IAG) at Universidade de São Paulo (USP) funded by CAPES/FAPESP/CNPQ.

Conflicts of Interest

The authors declare no conflict of interest.

References

  1. Seinfeld, J.; Pandis, S. Atmospheric Chemistry and Physics: From Air Pollution to Climate Change; Wiley: Hoboken, NJ, USA, 2016. [Google Scholar]
  2. Pope, C.A., III; Dockery, D.W. Health effects of fine particulate air pollution: Lines that connect. J. Air Waste Manag. Assoc. 2006, 56, 709–742. [Google Scholar] [CrossRef] [PubMed]
  3. Dockery, D.W.; Pope, C.A. Acute Respiratory Effects of Particulate Air Pollution. Annu. Rev. Public Health 1994, 15, 107–132. [Google Scholar] [CrossRef] [PubMed]
  4. Cohen, A.J.; Brauer, M.; Burnett, R.; Anderson, H.R.; Frostad, J.; Estep, K.; Balakrishnan, K.; Brunekreef, B.; Dandona, L.; Dandona, R.; et al. Estimates and 25-Year Trends of the Global Burden of Disease Attributable to Ambient Air Pollution: An Analysis of Data from the Global Burden of Diseases Study 2015. Lancet 2017, 389, 1907–1918. [Google Scholar] [CrossRef] [Green Version]
  5. Burnett, R.; Chen, H.; Szyszkowicz, M.; Fann, N.; Hubbell, B.; Pope, C.A.; Apte, J.S.; Brauer, M.; Cohen, A.; Weichenthal, S.; et al. Global Estimates of Mortality Associated with Long-Term Exposure to Outdoor Fine Particulate Matter. Proc. Natl. Acad. Sci. USA 2018, 9592–9597. [Google Scholar] [CrossRef] [Green Version]
  6. Martins, V.; Faria, T.; Diapouli, E.; Manousakas, M.I.; Eleftheriadis, K.; Viana, M.; Almeida, S.M. Relationship between indoor and outdoor size-fractionated particulate matter in urban microenvironments: Levels, chemical composition and sources. Environ. Res. 2020, 183, 109203. [Google Scholar] [CrossRef] [PubMed]
  7. Yin, P.; Brauer, M.; Cohen, A.J.; Wang, H.; Li, J.; Burnett, R.T.; Stanaway, J.D.; Causey, K.; Larson, S.; Godwin, W.; et al. The Effect of Air Pollution on Deaths, Disease Burden, and Life Expectancy across China and Its Provinces, 1990–2017: An Analysis for the Global Burden of Disease Study 2017. Lancet Planet. Health 2020, 4, e386–e398. [Google Scholar] [CrossRef]
  8. McClure, C.D.; Jaffe, D.A. US Particulate Matter Air Quality Improves except in Wildfire-Prone Areas. Proc. Natl. Acad. Sci. USA 2018, 115, 7901–7906. [Google Scholar] [CrossRef] [Green Version]
  9. Anenberg, S.C.; Achakulwisut, P.; Brauer, M.; Moran, D.; Apte, J.S.; Henze, D.K. Particulate Matter-Attributable Mortality and Relationships with Carbon Dioxide in 250 Urban Areas Worldwide. Sci. Rep. 2019, 9, 11552. [Google Scholar] [CrossRef]
  10. United Nations, Department of Economic and Social Affairs. World Population Prospects 2019: Ten Key Findings; Technical Report; United Nations: New York, NY, USA, 2019. [Google Scholar]
  11. United Nations, Department of Economic and Social Affairs. World Urbanization Prospects: The 2014 Revision: Highlights; United Nations: New York, NY, USA, 2014; Volume 32. [Google Scholar]
  12. Liousse, C.; Assamoi, E.; Criqui, P.; Granier, C.; Rosset, R. Explosive Growth in African Combustion Emissions from 2005 to 2030. Environ. Res. Lett. 2014, 9, 035003. [Google Scholar] [CrossRef]
  13. Keita, S.; Liousse, C.; Yoboué, V.; Dominutti, P.; Guinot, B.; Assamoi, E.M.; Borbon, A.; Haslett, S.L.; Bouvier, L.; Colomb, A.; et al. Particle and VOC Emission Factor Measurements for Anthropogenic Sources in West Africa. Atmos. Chem. Phys. 2018, 18, 7691–7708. [Google Scholar] [CrossRef] [Green Version]
  14. Junker, C.; Liousse, C. A global emission inventory of carbonaceous aerosol from historic records of fossil fuel and biofuel consumption for the period 1860–1997. Atmos. Chem. Phys. 2008, 8, 1195–1207. [Google Scholar] [CrossRef] [Green Version]
  15. Menut, L.; Flamant, C.; Turquety, S.; Deroubaix, A.; Chazette, P.; Meynadier, R. Impact of Biomass Burning on Pollutant Surface Concentrations in Megacities of the Gulf of Guinea. Atmos. Chem. Phys. 2018, 18, 2687–2707. [Google Scholar] [CrossRef] [Green Version]
  16. Afeti, G.M.; Resch, F.J. Physical Characteristics of Saharan Dust near the Gulf of Guinea. Atmos. Environ. 2000, 34, 1273–1279. [Google Scholar] [CrossRef]
  17. Adon, A.J.; Liousse, C.; Doumbia, E.T.; Baeza-Squiban, A.; Cachier, H.; Léon, J.F.; Yoboué, V.; Akpo, A.B.; Galy-Lacaux, C.; Guinot, B.; et al. Physico-Chemical Characterization of Urban Aerosols from Specific Combustion Sources in West Africa at Abidjan in Côte d’Ivoire and Cotonou in Benin in the Frame of the DACCIWA Program. Atmos. Chem. Phys. 2020, 20, 5327–5354. [Google Scholar] [CrossRef]
  18. Djossou, J.; Léon, J.F.; Akpo, A.B.; Liousse, C.; Yoboué, V.; Bedou, M.; Bodjrenou, M.; Chiron, C.; Galy-Lacaux, C.; Gardrat, E.; et al. Mass Concentration, Optical Depth and Carbon Composition of Particulate Matter in the Major Southern West African Cities of Cotonou (Benin) and Abidjan (Côte d’Ivoire). Atmos. Chem. Phys. 2018, 18, 6275–6291. [Google Scholar] [CrossRef] [Green Version]
  19. Léon, J.F.; Akpo, A.B.; Bedou, M.; Djossou, J.; Bodjrenou, M.; Yoboué, V.; Liousse, C. PM2.5 Surface Concentrations in Southern West African Urban Areas Based on Sun Photometer and Satellite Observations. Atmos. Chem. Phys. 2021, 21, 1815–1834. [Google Scholar] [CrossRef]
  20. Knippertz, P.; Coe, H.; Chiu, J.C.; Evans, M.J.; Fink, A.H.; Kalthoff, N.; Liousse, C.; Mari, C.; Allan, R.P.; Brooks, B.; et al. The DACCIWA Project: Dynamics–Aerosol–Chemistry–Cloud Interactions in West Africa. Bull. Am. Meteorol. Soc. 2015, 96, 1451–1460. [Google Scholar] [CrossRef] [Green Version]
  21. Xu, H.; Léon, J.F.; Liousse, C.; Guinot, B.; Yoboué, V.; Akpo, A.B.; Adon, J.; Ho, K.F.; Ho, S.S.H.; Li, L.; et al. Personal Exposure to PM2.5 Emitted from Typical Anthropogenic Sources in Southern West Africa: Chemical Characteristics and Associated Health Risks. Atmos. Chem. Phys. 2019, 19, 6637–6657. [Google Scholar] [CrossRef] [Green Version]
  22. Dekkers, M.J.; Evans, M.E.; Heller, F. Environmental Magnetism—Principles and Applications of Enviromagnetics; Academic Press: Cambridge, MA, USA, 2003; ISBN 0-12-243851- 5. [Google Scholar] [CrossRef] [Green Version]
  23. Hofman, J.; Maher, B.A.; Muxworthy, A.R.; Wuyts, K.; Castanheiro, A.; Samson, R. Biomagnetic Monitoring of Atmospheric Pollution: A Review of Magnetic Signatures from Biological Sensors. Environ. Sci. Technol. 2017, 51, 6648–6664. [Google Scholar] [CrossRef] [Green Version]
  24. Sagnotti, L.; Macrì, P.; Egli, R.; Mondinio, M. Magnetic properties of atmospheric particulate matter from automatic air sampler stations in Latium (Italy): Toward a definition of magnetic fingerprints for natural and anthropogenic PM10 sources. J. Geophys. Res. Solid Earth 2006, 111, 1–17. [Google Scholar] [CrossRef]
  25. Castañeda-Miranda, A.G.; Böhnel, H.N.; Molina-Garza, R.S.; Chaparro, M.A. Magnetic evaluation of TSP-filters for air quality monitoring. Atmos. Environ. 2014, 96, 163–174. [Google Scholar] [CrossRef]
  26. Muxworthy, A.R.; Matzka, J.; Petersen, N. Comparison of magnetic parameters of urban atmospheric particulate matter with pollution and meteorological data. Atmos. Environ. 2001, 35, 4379–4386. [Google Scholar] [CrossRef] [Green Version]
  27. Mitchell, R.; Maher, B.A. Evaluation and application of biomagnetic monitoring of traffic-derived particulate pollution. Atmos. Environ. 2009, 43, 2095–2103. [Google Scholar] [CrossRef]
  28. McIntosh, G.; Gómez-Paccard, M.; Osete, M.L. The magnetic properties of particles deposited on Platanus × hispanica leaves in Madrid, Spain, and their temporal and spatial variations. Sci. Total Environ. 2007, 382, 135–146. [Google Scholar] [CrossRef] [PubMed]
  29. Spassov, S.; Egli, R.; Heller, F.; Nourgaliev, D.K.; Hannam, J. Magnetic quantification of urban pollution sources in atmospheric particulate matter. Geophys. J. Int. 2004, 159, 555–564. [Google Scholar] [CrossRef] [Green Version]
  30. Saragnese, F.; Lanci, L.; Lanza, R. Nanometric-sized atmospheric particulate studied by magnetic analyses. Atmos. Environ. 2011, 45, 450–459. [Google Scholar] [CrossRef]
  31. Revuelta, M.A.; McIntosh, G.; Pey, J.; Pérez, N.; Querol, X.; Alastuey, A. Partitioning of magnetic particles in PM10, PM2.5 and PM1 aerosols in the urban atmosphere of Barcelona (Spain). Environ. Pollut. 2014, 188, 109–117. [Google Scholar] [CrossRef] [PubMed]
  32. Jordanova, D.; Jordanova, N.; Petrov, P. Magnetic susceptibility of road deposited sediments at a national scale—Relation to population size and urban pollution. Environ. Pollut. 2014, 189, 239–251. [Google Scholar] [CrossRef]
  33. Mantovani, L.; Tribaudino, M.; Solzi, M.; Barraco, V.; De Munari, E.; Pironi, C. Magnetic and SEM-EDS analyses of Tilia cordata leaves and PM10 filters as a complementary source of information on polluted air: Results from the city of Parma (Northern Italy). Environ. Pollut. 2018, 239, 777–787. [Google Scholar] [CrossRef] [PubMed]
  34. Hunt, A.; Jones, J.; Oldfield, F. Magnetic measurements and heavy metals in atmospheric particulates of anthropogenic origin. Sci. Total Environ. 1984, 33, 129–139. [Google Scholar] [CrossRef]
  35. Chester, R.; Sharples, E.J.; Sanders, G.; Oldfield, F. The distribution of natural and non-crustal ferrimagnetic minerals in soil-sized particulates from the Mediterranean atmosphere. Water Air Soil Pollut. 1984, 23, 25–35. [Google Scholar] [CrossRef]
  36. Hunt, A. The application of mineral magnetic methods to atmospheric aerosol discrimination. Phys. Earth Planet. Inter. 1986, 42, 10–21. [Google Scholar] [CrossRef]
  37. Shu, J.; Dearing, J.A.; Morse, A.P.; Yu, L.; Yuan, N. Determining the sources of atmospheric particles in Shanghai, China, from magnetic and geochemical properties. Atmos. Environ. 2001, 35, 2615–2625. [Google Scholar] [CrossRef]
  38. Di Gilio, A.; Farella, G.; Marzocca, A.; Giua, R.; Assennato, G.; Tutino, M.; De Gennaro, G. Indoor/outdoor air quality assessment at school near the steel plant in Taranto (Italy). Adv. Meteorol. 2017, 2017. [Google Scholar] [CrossRef] [Green Version]
  39. Shi, Y.; Ji, Y.; Sun, H.; Hui, F.; Hu, J.; Wu, Y.; Fang, J.; Lin, H.; Wang, J.; Duan, H.; et al. Nanoscale characterization of PM 2.5 airborne pollutants reveals high adhesiveness and aggregation capability of soot particles. Sci. Rep. 2015, 5, 1–11. [Google Scholar] [CrossRef]
  40. Hoffmann, V.; Knab, M.; Appel, E. Magnetic susceptibility mapping of roadside pollution. J. Geochem. Explor. 1999, 66, 313–326. [Google Scholar] [CrossRef]
  41. Sagnotti, L.; Winkler, A. On the magnetic characterization and quantification of the superparamagnetic fraction of traffic-related urban airborne PM in Rome, Italy. Atmos. Environ. 2012, 59, 131–140. [Google Scholar] [CrossRef]
  42. Maher, B. The magnetic properties of Quaternary aeolian dusts and sediments, and their palaeoclimatic significance. Aeolian Res. 2011, 3, 87–144. [Google Scholar] [CrossRef]
  43. Knippertz, P.; Evans, M.J.; Field, P.R.; Fink, A.H.; Liousse, C.; Marsham, J.H. The Possible Role of Local Air Pollution in Climate Change in West Africa. Nat. Clim. Chang. 2015, 5, 815–822. [Google Scholar] [CrossRef] [Green Version]
  44. Lélé, M.I.; Leslie, L.M.; Lamb, P.J. Analysis of Low-Level Atmospheric Moisture Transport Associated with the West African Monsoon. J. Clim. 2015, 28, 4414–4430. [Google Scholar] [CrossRef]
  45. Adetunji, J.; McGregor, J.; Ong, C.K. Harmattan Haze. Weather 1979, 34, 430–436. [Google Scholar] [CrossRef]
  46. Bajamgnigni Gbambie, A.S.; Steyn, D.G. Sea Breezes at Cotonou and Their Interaction with the West African Monsoon: SEA BREEZES AT COTONOU. Int. J. Climatol. 2013, 33, 2889–2899. [Google Scholar] [CrossRef]
  47. Marais, E.A.; Jacob, D.J.; Wecht, K.; Lerot, C.; Zhang, L.; Yu, K.; Kurosu, T.P.; Chance, K.; Sauvage, B. Anthropogenic Emissions in Nigeria and Implications for Atmospheric Ozone Pollution: A View from Space. Atmos. Environ. 2014, 99, 32–40. [Google Scholar] [CrossRef] [Green Version]
  48. Dominutti, P.; Keita, S.; Bahino, J.; Colomb, A.; Liousse, C.; Yoboué, V.; Galy-Lacaux, C.; Morris, E.; Bouvier, L.; Sauvage, S.; et al. Anthropogenic VOCs in Abidjan, Southern West Africa: From Source Quantification to Atmospheric Impacts. Atmos. Chem. Phys. 2019, 19, 11721–11741. [Google Scholar] [CrossRef] [Green Version]
  49. Adjiri, O.A.; Mafou, C.K.; Konan, P.K. Impact of Akouedo landfill (Abidjan - Côte d’Ivoire) on the populations: Socio-economic and environmental study. Int. J. Innov. Appl. Stud. 2015, 13, 979–989. [Google Scholar]
  50. Chow, J.C.; Watson, J.G.; Pritchett, L.C.; Pierson, W.R.; Frazier, C.A.; Purcell, R.G. The Dri Thermal/Optical Reflectance Carbon Analysis System: Description, Evaluation and Applications in U.S. Air Quality Studies. Atmos. Environ. Part A Gen. Top. 1993, 27, 1185–1201. [Google Scholar] [CrossRef]
  51. Chow, J.C.; Watson, J.G.; Fujita, E.M.; Lu, Z.; Lawson, D.R.; Ashbaugh, L.L. Temporal and Spatial Variations of PM2.5 and PM10 Aerosol in the Southern California Air Quality Study. Atmos. Environ. 1994, 28, 2061–2080. [Google Scholar] [CrossRef]
  52. Chow, J.C.; Watson, J.G.; Kuhns, H.; Etyemezian, V.; Lowenthal, D.H.; Crow, D.; Kohl, S.D.; Engelbrecht, J.P.; Green, M.C. Source Profiles for Industrial, Mobile, and Area Sources in the Big Bend Regional Aerosol Visibility and Observational Study. Chemosphere 2004, 54, 185–208. [Google Scholar] [CrossRef]
  53. Chow, J.C.; Chen, L.W.A.; Watson, J.G.; Lowenthal, D.H.; Magliano, K.A.; Turkiewicz, K.; Lehrman, D.E. PM2.5 Chemical Composition and Spatiotemporal Variability during the California Regional PM10/PM2.5 Air Quality Study (CRPAQS). J. Geophys. Res. Atmos. 2006, 111, D10S04. [Google Scholar] [CrossRef]
  54. Chiappini, L.; Verlhac, S.; Aujay, R.; Maenhaut, W.; Putaud, J.P.; Sciare, J.; Jaffrezo, J.L.; Liousse, C.; Galy-Lacaux, C.; Alleman, L.Y.; et al. Clues for a Standardised Thermal-Optical Protocol for the Assessment of Organic and Elemental Carbon within Ambient Air Particulate Matter. Atmos. Meas. Tech. 2014, 7, 1649–1661. [Google Scholar] [CrossRef] [Green Version]
  55. Egli, R. Characterization of individual rock magnetic components by analysis of remanence curves, 1. Unmixing natural sediments. Stud. Geophys. Geod. 2004, 48, 391–446. [Google Scholar] [CrossRef]
  56. Evans, M.E.; Heller, F. Environmental Magnetism; Academic Press: San Diego, CA, USA, 2003; Volume 11, p. 34. [Google Scholar] [CrossRef]
  57. Dankers, P. Relationship between median destructive field and remanent coercive forces for dispersed natural magnetite, titanomagnetite and hematite. Geophys. J. Int. 1981, 64, 447–461. [Google Scholar] [CrossRef] [Green Version]
  58. King, J.W.; Channell, J.E. Sedimentary Magnetism, Environmental Magnetism, and Magnetostrarigraphy. Rev. Geophys. 1991, 29, 358–370. [Google Scholar] [CrossRef]
  59. Maher, B.A. Magnetic properties of some synthetic sub-micron magnetites. Geophys. J. Int. 1988, 94, 83–96. [Google Scholar] [CrossRef]
  60. Dankers, P.H.M. Magnetic Properties of Dispersed Natural Iron-Oxides of Known Grain-Size. Ph.D. Thesis, University of Utrecht, Utrecht, The Netherlands, 1978. [Google Scholar]
  61. Özden, Ö.; Banerjee, S.K. A preliminary magnetic study of soil samples from west-central Minnesota. Earth Planet. Sci. Lett. 1982, 59, 393–403. [Google Scholar] [CrossRef]
  62. Sagnotti, L.; Taddeucci, J.; Winkler, A.; Cavallo, A. Compositional, morphological, and hysteresis characterization of magnetic airborne particulate matter in Rome, Italy. Geochem. Geophys. Geosyst. 2009, 10. [Google Scholar] [CrossRef]
  63. Shi, M.; Wu, H.; Zhang, S.; Li, H.; Yang, T.; Liu, W.; Liu, H. Weekly cycle of magnetic characteristics of the daily PM2.5 and PM2.5-10 in Beijing, China. Atmos. Environ. 2014, 98, 357–367. [Google Scholar] [CrossRef]
  64. Pattammattel, A.; Leppert, V.J.; Aronstein, P.; Robinson, M.; Mousavi, A.; Sioutas, C.; Forman, H.J.; O’Day, P.A. Iron speciation in particulate matter (PM2.5) from urban Los Angeles using spectro-microscopy methods. Atmos. Environ. 2021, 245, 117988. [Google Scholar] [CrossRef]
  65. Liu, H.; Yan, Y.; Chang, H.; Chen, H.; Liang, L.; Liu, X.; Qiang, X.; Sun, Y. Magnetic signatures of natural and anthropogenic sources of urban dust aerosol. Atmos. Chem. Phys. 2019, 19, 731–745. [Google Scholar] [CrossRef] [Green Version]
  66. Gonet, T.; Maher, B.A. Airborne, Vehicle-Derived Fe-Bearing Nanoparticles in the Urban Environment: A Review. Environ. Sci. Technol. 2019, 53, 9970–9991. [Google Scholar] [CrossRef]
  67. Gonet, T.; Maher, B.A.; Kukutschová, J. Source apportionment of magnetite particles in roadside airborne particulate matter. Sci. Total Environ. 2021, 752, 141828. [Google Scholar] [CrossRef]
  68. Liati, A.; Pandurangi, S.S.; Boulouchos, K.; Schreiber, D.; Arroyo Rojas Dasilva, Y. Metal nanoparticles in diesel exhaust derived by in-cylinder melting of detached engine fragments. Atmos. Environ. 2015, 101, 34–40. [Google Scholar] [CrossRef]
  69. Bardelli, F.; Cattaruzza, E.; Gonella, F.; Rampazzo, G.; Valotto, G. Characterization of road dust collected in Traforo del San Bernardo highway tunnel: Fe and Mn speciation. Atmos. Environ. 2011, 45, 6459–6468. [Google Scholar] [CrossRef]
  70. Chaparro, M.A.; Chaparro, M.A.; Castañeda-Miranda, A.G.; Marié, D.C.; Gargiulo, J.D.; Lavornia, J.M.; Natal, M.; Böhnel, H.N. Fine air pollution particles trapped by street tree barks: In situ magnetic biomonitoring. Environ. Pollut. 2020, 266, 115229. [Google Scholar] [CrossRef]
  71. Wang, J.; Li, S.; Li, H.; Qian, X.; Li, X.; Liu, X.; Lu, H.; Wang, C.; Sun, Y. Trace metals and magnetic particles in PM 2.5: Magnetic identification and its implications. Sci. Rep. 2017, 7, 1–11. [Google Scholar] [CrossRef] [Green Version]
  72. Frank, U.; Nowaczyk, N.R. Mineral magnetic properties of artificial samples systematically mixed from haematite and magnetite. Geophys. J. Int. 2008, 175, 449–461. [Google Scholar] [CrossRef] [Green Version]
  73. Yahi, H.; Marticorena, B.; Thiria, S.; Chatenet, B.; Schmechtig, C.; Rajot, J.L.; Crepon, M. Statistical relationship between surface PM10 concentration and aerosol optical depth over the Sahel as a function of weather type, using neural network methodology. J. Geophys. Res. Atmos. 2013, 118, 13,265–13,281. [Google Scholar] [CrossRef]
  74. Schroth, A.W.; Crusius, J.; Sholkovitz, E.R.; Bostick, B.C. Iron solubility driven by speciation in dust sources to the ocean. Nat. Geosci. 2009, 2, 337–340. [Google Scholar] [CrossRef]
  75. Formenti, P.; Caquineau, S.; Chevaillier, S.; Klaver, A.; Desboeufs, K.; Rajot, J.L.; Belin, S.; Briois, V. Dominance of goethite over hematite in iron oxides of mineral dust from Western Africa: Quantitative partitioning by X-ray absorption spectroscopy. J. Geophys. Res. Atmos. 2014, 119, 12,740–12,754. [Google Scholar] [CrossRef]
  76. Lyons, R.; Oldfield, F.; Williams, E. Mineral magnetic properties of surface soils and sands across four North African transects and links to climatic gradients. Geochem. Geophys. Geosyst. 2010, 11. [Google Scholar] [CrossRef]
  77. McClean, R.G.; Kean, W. Contributions of wood ash magnetism to archaeomagnetic properties of fire pits and hearths. Earth Planet. Sci. Lett. 1993, 119, 387–394. [Google Scholar] [CrossRef]
  78. Jordanova, N.; Jordanova, D.; Henry, B.; Le Goff, M.; Dimov, D.; Tsacheva, T. Magnetism of cigarette ashes. J. Magn. Magn. Mater. 2006, 301, 50–66. [Google Scholar] [CrossRef]
  79. Ghafghazi, S.; Sowlati, T.; Sokhansanj, S.; Bi, X.; Melin, S. Particulate matter emissions from combustion of wood in district heating applications. Renew. Sustain. Energy Rev. 2011, 15, 3019–3028. [Google Scholar] [CrossRef]
Figure 1. Localization of Abidjan and Cotonou in West Africa. Insets show the sampling sites (AT: Abidjan traffic, AL: Abidjan Landfill, AF: Abidjan fireplace and CT: Cotonou traffic).
Atmosphere 12 00496 g001
Figure 2. Weekly mean temperature, cumulative rainfall, mean zonal U (U > 0 indicates wind from the West) and meridional V (V > 0 indicates wind from the South) winds recorded in Abidjan (Felix Houphouet Boigny airport) and Cotonou (Cadjehoun airport) from February 2015 to March 2017.
Atmosphere 12 00496 g002
Figure 3. (a) Weekly values of SIRMV versus PM2.5 concentration for each site. (b) Correlation between SIRMV means and EC and PM2.5 concentrations means for the whole data series in each site. Error bars are the standard errors.
Atmosphere 12 00496 g003
Figure 4. Concentration parameters PM2.5, EC, ARMV (anhysteretic remanent magnetization volume normalized) and SIRMV. The lines are the monthly running means and points the individual weekly measurements.
Atmosphere 12 00496 g004
Figure 5. EC concentrations and magnetic content in air volume and PM (SIRMV and SIRMM, respectively) for the two characteristic weather events: the Harmattan period (dry season) and the monsoon season. Means (horizontal lines in the center of the square) and standard deviations (size of the square) are reported.
Atmosphere 12 00496 g005
Figure 6. xARM/SIRM versusMDF for selected samples in the four sites (circle-AT, square-CT, diamond-AL, triangle-AF, all filled) and data from Dankers [60], Özden Özdemir and Banerjee [61], Maher [59] and Mitchell and Maher [27] (open inverse triangles in salmon, purple, green and blue respectively). Iron oxides reported in Dankers [60], Özden Özdemir and Banerjee [61] and Maher [59] are all composed of synthetic magnetite or ferrimagnetic magnetite-like iron oxides, with known grain sizes (represented by the numbers above the symbols, in μm). Data from Mitchell and Maher [27] are measurements performed in PM10 filters and leaves (total suspended particles, TSP).
Atmosphere 12 00496 g006
Figure 7. SEM images for the four sites: (a) Abidjan traffic (AT) site showing five iron oxide agglomerations and individual spherules, with sizes ranging from 50 to 500 nm. (b) A detail from (a) of one of the agglomerations (marked in red in figure a), displaying six spherules with sizes ranging from 50 to 300 nm. (c) EDS spectrum of the central spherule marked in blue in figure (a), showing a composition of Fe, O, Si and C. (d) Cotonou traffic site (CT), showing a particle agglomeration with a central particle composed of Fe and S with low traces of Ca, Al, Na, O. The aggregate surrounding this particle has a composition of C, Ca and Al, and a maximum dimension of 3.22 μm. (e) Abidjan landfill site (AL) with a bright irregular shaped particle at the center, composed of Fe and O, and traces of Pb, Zr, Cl, K, Al, Na with dimension of 1.33 μm. (f) Abidjan domestic fire site (AF), with a central spherule of 0.75 μm in diameter, composed of Fe and O. (g) EDS spectrum for the central particle (marked in blue) from the CT site. (h) EDS spectrum from the central particle (marked in blue) from the AL site. (i) EDS spectrum from the spherule (marked in blue) from the AF site. All spectra have the presence of Si, related to the matrix of the filter.
Atmosphere 12 00496 g007
Table 1. Summary of calculated means and standard deviations for the magnetic parameters, concentrations of EC (elemental carbon) and PM2.5 (particulate matter with aerodynamic size below 2.5 μm), and organic and elemental carbon ratio (OC/EC). SIRM (saturation of the isothermal remanent magnetization) is presented as both mass and volume normalized (SIRMM and SIRMV, respectively) and MDF is the Mean Destructive Field. Stars indicate values from Djossou et al. [18].
Whole PeriodATCTALAF
SIRMV (10−10 A m−1)6.32 (±3.09)4.90 (±1.91)4.88 (±1.98 )6.83 (±4.24 )
SIRMM
(10−2 A m2 kg−1)
2.23 (±1.18)2.28 (±1.31)2.21 (±1.31)0.53 (±0.38)
S-ratio0.97 (±0.05)0.97 (±0.03)0.96 (±0.04)0.96 (±0.02 )
MDF (mT)33.55 (±4.46)33.76 (±2.76)35.08 (±2.95 )33.55 (±2.58 )
xARM/SIRM
(10−4 m A−1)
7.32 (±2.78)6.57 (±1.82)6.93 (±4.22)7.24 (±2.38)
EC (μg m−37.64 (±4.02)2.15 (±1.26)4.22 (±2.60 )13.01 (±6.77)
PM2.5 (μg m−337.01 (±29.70)30.64 (±32.01)28.44 (±19.79)153.55 (±73.29)
OC/EC ☆1.93 (±1.07)3.72 (±1.37 )2.54 (±1.49)6.00 (±2.66)
Harmattan period
SIRMV (10−10 A m−1)7.57 (±4.38)6.13 (±2.19)5.94 (±1.97)5.50 (±1.74)
SIRMM
(10−2 A m2 kg−1)
1.37 (±0.66)1.72 (±1.25)1.24 (±0.58)0.70 (±0.39)
S-ratio0.97 (±0.02)0.95 (±0.04)0.97 (±0.02)0.97 (±0.01)
EC (μg m−3) ☆10.45 (±4.69)3.51 (±1.54)6.84 (±4.04)10.56 (±5.59)
Monsoon season
SIRMV (10−10 A m−1)6.76 (±2.86)4.14 (±1.23)4.16 (±2.01)9.81 (±5.81)
SIRMM
(10−2 A m2 kg−1)
3.25 (±1.50)2.98 (±1.54)2.41 (±1.53)0.46 (±0.32)
S-ratio0.98 (±0.01)0.97 (±0.01)0.96 (±0.02)0.95 (±0.03)
EC (μg m−3) ☆4.99 (±1.12)1.52 (±0.74)3.61 (±0.93)21.08 (±8.06)
Publisher’s Note: MDPI stays neutral with regard to jurisdictional claims in published maps and institutional affiliations.

