Article

One-Year Real-Time Measurement of Black Carbon in the Rural Area of Qingdao, Northeastern China: Seasonal Variations, Meteorological Effects, and the COVID-19 Case Analysis

Jiangsu Key Laboratory of Atmospheric Environment Monitoring and Pollution Control, Collaborative Innovation Center of Atmospheric Environment and Equipment Technology, School of Environmental Sciences and Engineering, Nanjing University of Information Science and Technology, Nanjing 210044, China
*
Author to whom correspondence should be addressed.
Atmosphere 2021, 12(3), 394; https://doi.org/10.3390/atmos12030394
Submission received: 26 February 2021 / Revised: 11 March 2021 / Accepted: 16 March 2021 / Published: 18 March 2021

Abstract

:
In this paper, we report the results obtained from one year of real-time measurement (i.e., from December 2019 to November 2020) of atmospheric black carbon (BC) under a rural environment in Qingdao of Northeastern China. The annual average concentration of BC was 1.92 ± 1.89 μg m−3. The highest average concentration of BC was observed in winter (3.65 ± 2.66 μg m−3), followed by fall (1.73 ± 1.33 μg m−3), spring (1.53 ± 1.33 μg m−3), and summer (0.83 ± 0.56 μg m−3). A clear weekend effect was observed in winter, which was characterized by higher BC concentration (4.60 ± 2.86 μg m−3) during the weekend rather than that (3.22 ± 2.45 μg m−3) during weekdays. The influence of meteorological parameters, including surface horizontal wind speed, boundary layer height (BLH), and precipitation, on BC, was investigated. In particular, such BLH influence presented evidently seasonal dependence, while there was no significant seasonality for horizontal wind speed. These may reflect different roles of atmospheric vertical dilution on affecting BC in different seasons. The △BC/△CO ratio decreased with the increase of precipitation, indicative of the influence of below-cloud wet removal of BC, especially during summertime where rainfall events more frequently occurred than any of other seasons. The bivariate-polar-plot analysis showed that the high BC concentrations were mainly associated with low wind speed in all seasons, highlighting an important BC source originated from local emissions. By using concentration-weighted trajectory analysis, it was found that regional transports, especially from northeastern in winter, could not be negligible for contributing to BC pollution in rural Qingdao. In the coronavirus disease 2019 (COVID−19) case analysis, we observed an obvious increase in the BC/NO2 ratio during the COVID-19 lockdown, supporting the significant non-traffic source sector (such as residential coal combustion) for BC in rural Qingdao.

1. Introduction

Black carbon (BC), generated from incomplete combustion processes of biomass or fossil fuels, is an important component of atmospheric fine particulate matter (PM2.5, aerodynamic equivalent diameter less than 2.5 μm) [1,2,3]. BC not only directly absorbs solar radiation, generating direct radiative forcing, but it can also sever as cloud condensation nuclei (CCN) affecting cloud processes [4] and deposit on snow and ice surfaces, reducing their surface albedo [5], leading to indirect radiative forcing. Therefore, BC has a significant climate effect on both regional and global scales [6], which may be the second most important climate warmer only after carbon dioxide (CO2) [2]. Moreover, BC is an important environmental pollutant that influences the development of pollutants and thus changes weather conditions [7,8]. It has been proved that BC can play a key role in aerosol-planetary boundary layer (PBL) interactions and thereby affect air quality in high BC emission regions, like eastern China [9,10]. BC can also absorb some volatile toxic substances (such as polycyclic aromatic hydrocarbons PAHs) [11,12] and provide them with oxidation reaction sites to form more toxic PAHs oxidation derivatives [13,14]. On the other hand, the particle size distribution of BC generally ranges from 0.01 to 1.0 μm, which are more likely to be deposited in the human body and cause health effects to the public [15,16,17]. However, there is still unknown uncertainty obtained from climate and environment models to evaluate those BC impacts so far. It is essential to conduct long-term measurement of BC and thereby investigate its temporal variation characterization to improve our understanding of BC cycles in the atmosphere and to constrain modeling studies.
As indicated by previous studies, the concentration levels and variations of ambient BC could be affected by two major factors, i.e., source emissions and mereological conditions. The sources of BC could present significant regional dependence. For instance, vehicle and industrial emissions are the major sources of BC in urban and suburban areas [18,19,20], while the major source of BC in rural areas could be linked to biomass and biofuel combustion [21,22]. BC pollution in China also affects the downwind regions [23,24,25]. Meteorological conditions also play an important role in BC variations, for instance, planetary boundary layer and winds. Those meteorological can significantly affect the vertical dispersion and horizontal transport capacity of BC [26,27,28]. Regional transport can also enhance BC concentrations in urban and remote areas [29,30]. Typically BC is also subject to a reduction in concentration due to removal by wet deposition (rainfall and snowfall) [31]. The above results indicate that the variation of BC concentrations in different regions and the relative contribution of emission sources are influenced by geographical location, meteorological conditions, and source sector distributions. Thus, it is critical to understand the sources and influence of meteorological factors on BC, to better understand the sources and sinks of BC in the real atmosphere in different regions. To do so, the long-term and highly time-resolved measurements are basically required to provide a sufficiently observational dataset being used for the study in these aspects above.
As reported by emission inventory studies, BC emissions increased from 0.87 Tg in 1980 to 1.88 Tg in 2009 over China [32]. Although the relative contribution of residential sectors to the total BC emissions (82.03% in 1980) has been declining, this BC source sector is still the major contributor to BC in China (e.g., 42.33% in 2009) [32]. According to the new BC emissions inventory reported by Peking University, it was pointed out that residential coal combustion was the largest source sector of BC, followed by residential biofuel combustion, coke production, and diesel vehicles [33]. Winter heating in northern China generated large amounts of BC from coal combustion and biomass combustion, especially in rural areas in the north [29,34,35,36]. Interestingly, various short-term emission reduction measures can effectively reduce BC concentrations and improve air quality, such as the 2008 Beijing Olympics [37] and the 2014 Asia-Pacific Economic Cooperation (APEC) meeting [38]. Previous studies have shown that the reduction in vehicle emissions directly resulted in a noticeable BC decrease in urban areas [39,40]. For example, a 44% decrease in BC changes from 2.30 to 1.29 μg m−3 within the city of Hangzhou following the coronavirus disease 2019 (COVID-19) lockdown stage [40]. This observation period covers the period affected by the epidemic, which not only provides an opportunity to identify the source and composition of BC but also provides a unique scenario to evaluate anthropogenic emission reduction on ambient BC.
Qingdao is located on the Shandong Peninsula, part of the Bohai Sea Rim urban agglomeration, and is also one of the top ten container ports in the world. In recent years, particulate matter has been regarded as one of the main pollution problems in Qingdao, especially in winter [41,42,43]. High levels of SO2 and NO2 were also observed in Qingdao [44]. This is related to the fact that coal is the main energy source in Qingdao, consuming 12.83 million tons per year, as well as possessing 2.8 million vehicles. Reduced visibility and air quality are also important effects of BC [45]. The proportion of moderately or severely polluted days (visibility ≥ 5 km; aerosol optical depth (AOD) > 0.5) ranged from 10.77% to 32.79% from 2000 to 2010 [46]. Solid fuel (e.g., biomass fuel combustion) is an important source of BC for winter heating in the north of China [36,47,48]. Although clean heating has only been implemented in the rural areas of Qingdao, most areas have not yet completely adopted clean heating. In the present study, long-term observation of BC in the Qingdao area to identify its pollution sources and potential pollution areas will help formulate effective policies to control the quality of control while providing an effective basis for evaluating the effectiveness of clean heating policies and measures in rural areas. The objectives of this study are to (1) quantify the temporal characteristics and mass concentrations of BC; (2) investigate the influence of potential sources and meteorological conditions on BC; (3) assess feedbacks of BC variations on the COVID-19 lockdown measures.

2. Experiments

2.1. Sampling Sites and Instrumentation

The observation site is located in the northeastern coastal region of China, and the sampling equipment is deployed on the roof of Qingdao Blue Valley Venture Center (36.35° N, 120.68° E) (about 40 m in height, as shown in Figure S1). This observation site is surrounded by a large number of villages with farmland scattered around. Two busy and stable traffic-loaded highways are distributed to the west (900 m) and north (1200 m) of the sampling site. There are a few light industries located in the northwestern part of the site. One kilometer to the south of the site is AoShan Bay, where the Yellow Sea borders the mainland. Three kilometers west of the site is a scenic area, such as the Heshan scenic area. The sampling site represents a typical rural environment with multiple anthropogenic sources (such as residential, traffic, and industrial sources) in eastern China.
The sampling period was from 30 November 2019 to 30 November 2020. The mass concentration of BC in the size range of PM2.5 was measured using a multi-angle absorption photometer (MAAP) (model 5012, Thermo Scientific, USA) with a time resolution of 5 min [49]. Briefly, the basic principle of the instrument is to calculate the real-time BC aerosol concentration obtained by measuring the extinction of aerosols attached to the quartz filter. The sampling system was equipped with a PM2.5 cyclone cutter to remove coarse particles. Aerosols in ambient air enter the instrument system with a flow rate of 16.7 L min−1 and are deposited on the quartz fiber filter strip. A laser beam at 670 nm wavelength continuously irradiates the quartz filter strip of the deposited particles, and then the transmitted and refracted light signals are detected by optical detectors [50,51]. Compared to conventional BC instruments (e.g., aethalometer) that can only detect transmitted light, MAAP can detect both scattered and transmitted light from multiple angles [49] for monitoring BC aerosol concentration with less uncertainty. As quantification of the MAAP BC mass concentration is converted from light absorption coefficient measured by filter-based optical methods, we, therefore, note that the BC concentration in the present study was defined as equivalent BC mass concentration. This is consistent with the same consideration by previous studies using similar filter-based optical methods [52]. The instrument was maintained during the sampling period in strict accordance with the instrument operating instructions. Flow rate, temperature, and atmospheric pressure were calibrated monthly, cleaning of the cutting head was performed every two months, timely processing of data for backup, and timely replacement of the filter tape before it was running out. The flow rate was calibrated via the flow rate calibration submenu on the instrument panel in conjunction with the standard flow meter. The difference between the measured flow rate of the standard flow meter and the value measured by MAAP was within 10%. The difference between the measured value of the temperature sensor (air pressure sensor) for MAAP and the standard instrument value was within ± 2 °C (± 10 mm Hg). We are missing data from 11 February to 19 March 2020 and 3 June to 19 June 2020 due to instrument failure, COVID-19 pandemic effects, and equipment maintenance during the sampling period.
Hourly concentration data of other air pollutants, including carbon monoxide (CO), nitrogen dioxide (NO2), sulfur dioxide (SO2), and PM2.5, were accessed from the air quality monitoring site. Meteorological data, such as temperature (T), relative humidity (RH), wind speed (WS), wind direction (WD), visibility, and precipitation, were downloaded from the nearby National Meteorological Information Center (http://www.nmic.cn/, accessed on 18 March 2021). Boundary layer height data with 3 h resolution were obtained from NOAA’s reanalysis data processing (ftp://arlftp.arlhq.noaa.gov, accessed on 18 March 2021). Pronounced seasonal variations were observed for most meteorological parameters and general air pollutants.

2.2. Air Mass Back-Trajectory Analysis

To explore the potential geographic origins of BC at the receptor site, the hybrid single-particle Lagrangian integrated trajectory HYSPLIT model (version 4.9) was applied. Air mass trajectory data were obtained from the global data assimilation system (GDAS) with a horizontal resolution of 1° × 1° (ftp://arlftp.arlhq.noaa.gov/pub/archives/gdas1/, accessed on 18 March 2021). The 48 h backward trajectories at hourly intervals were plotted at an altitude of 50 m throughout the observation period. The concentration-weighted trajectory (CWT) analysis method is based on the identification of potential sources of BC and the weighted average of trajectories of relevant concentrations to identify the contribution of potential source regions to BC [53,54]. CWT was calculated with ZeFir, a programming plug-in based on Igor Pro (Wavemetrics, USA). The potential source regions around the receptor are divided into ijth grid arrays. CWT is a function of the BC concentration and time the trajectory corresponds to in the ijth grid, defined as follows:
C ij = 1 l = 1 M τ ijl l = 1 M C l τ ijl
where C ij is the average weight concentration in ijth grid, l indicates the trajectory, M is the total number of trajectories, C l is the concentration corresponding to trajectory l, and τ ijl is the elapsed time of trajectory l in ijth grid.

3. Results and Discussion

3.1. Concentration Variations of BC

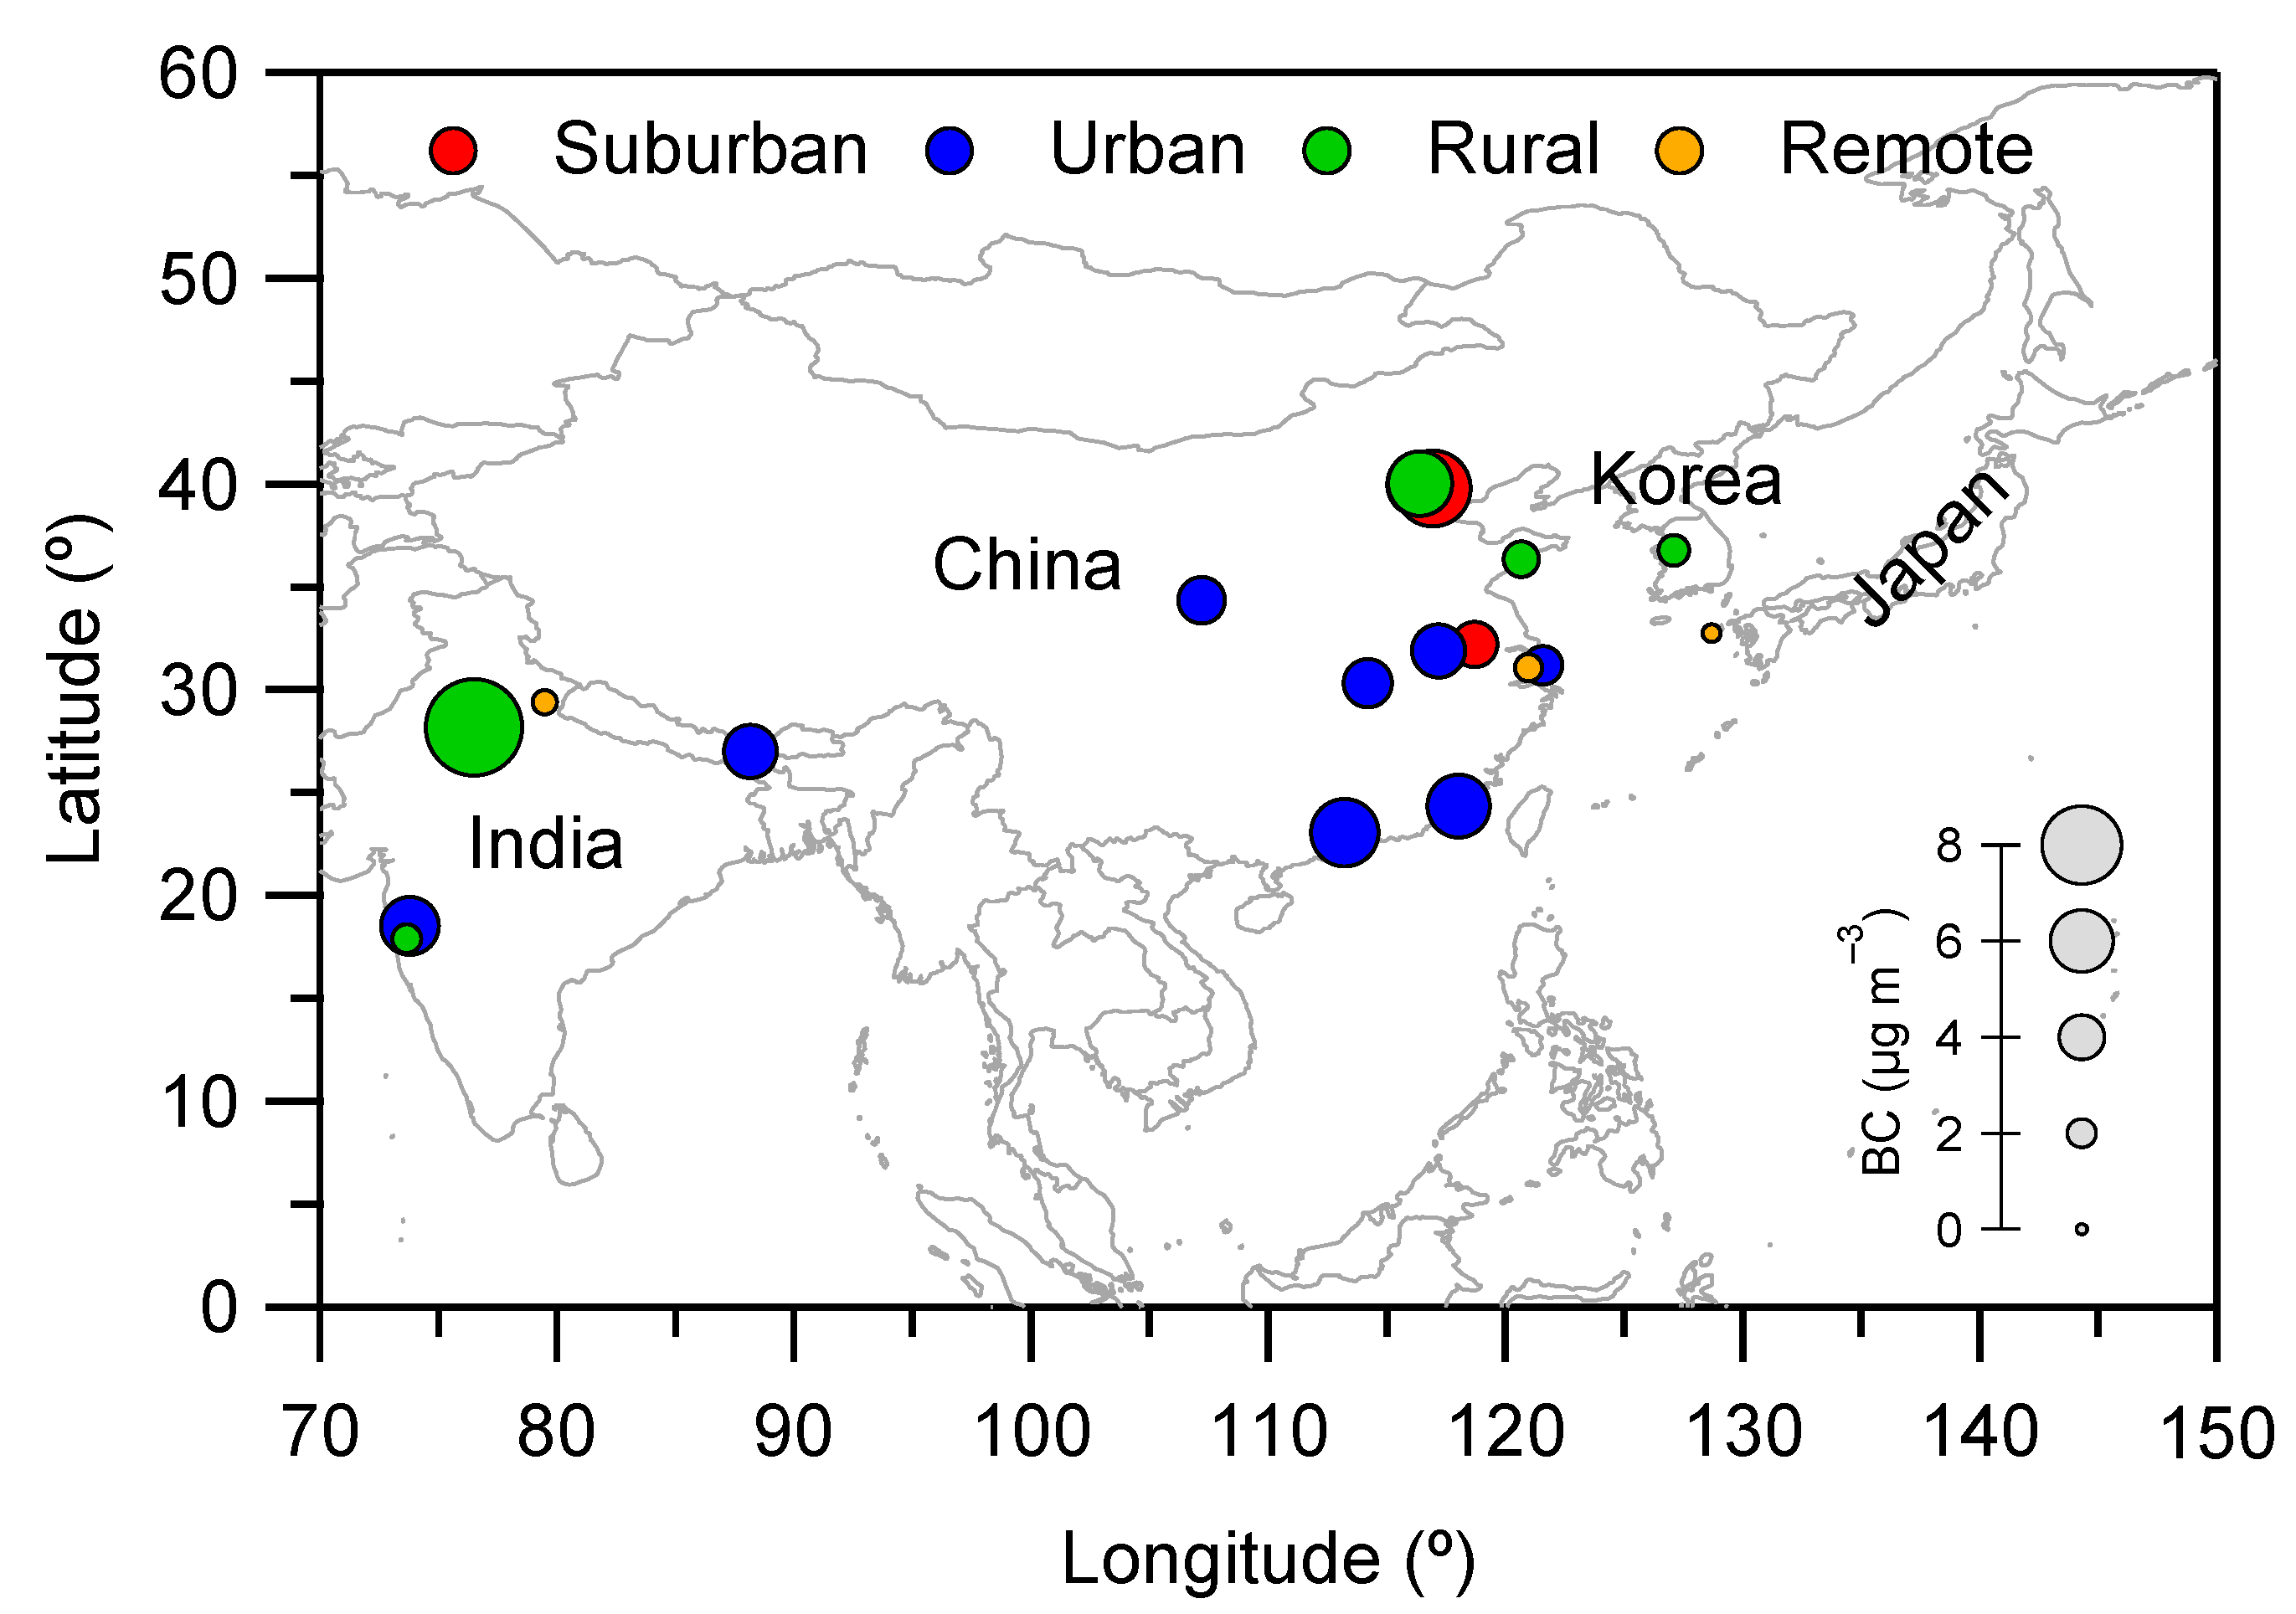
3.1.1. Overview of BC Concentrations

Figure 1 shows the time series of meteorological parameters and air pollutants (including BC). Meteorological elements include WS, BLH, RH, and precipitation, of which annual average (±1σ) values were 2.4 (±1.5) m s−1, 451 (±325) m, 70 ± 23% and 2.2 ± 4.6 mm, respectively. During the entire observation period, the average concentration (concentration range) of gaseous pollutants CO, SO2 and NO2 were 0.5 ± 0.3 mg m−3 (0.1–3.1 mg m−3), 5.8 ± 3.3 μg m−3 (1.0–50.0 μg m−3), and 15.7 ± 10.5 μg m−3 (2.0–94.0 μg m−3), respectively (Figure 1c,d). The mean concentration of PM2.5 was 30.4 (±27.6) μg m−3, where the minimum and maximum values are 278 μg m−3 and 3 μg m−3, respectively. During the entire observation period, the hourly mass concentration (mean ± 1σ) of BC varies from 0.02 to 12.08 μg m−3, with an annual average of 1.92 ± 1.89 μg m−3. The frequency diagram of the 5-min BC concentration distribution followed a typical lognormal distribution pattern (Figure S2a). The concentration (0.55 μg m−3) with the highest frequency can be regarded as the most representative under the atmospheric condition in the region [55]. These results indicated that the level of BC concentration in rural areas of Qingdao was at the middle level.
As shown in Figure 2, we summarized the results of long-term BC measurements from some previous studies at other locations in East Asia. Compared with other rural areas, the average BC concentrations in rural Qingdao were much lower than those in Beijing of China [34] and Delhi of India [27] and slightly higher than those in Mahabaleshwar of India [18] and Byeongcheon of Korea [56]. BC concentrations in both urban areas [18,19,26,36,57,58,59,60,61,62] and suburban areas [47,55] were higher than those in rural Qingdao areas. The BC concentrations in the remote background areas [24,63,64] were much lower than those in the rural areas of Qingdao. Those comparisons may indicate that ambient BC presents distinct regional characteristics, which would be due to different BC emission intensity and some influence by different meteorological conditions.

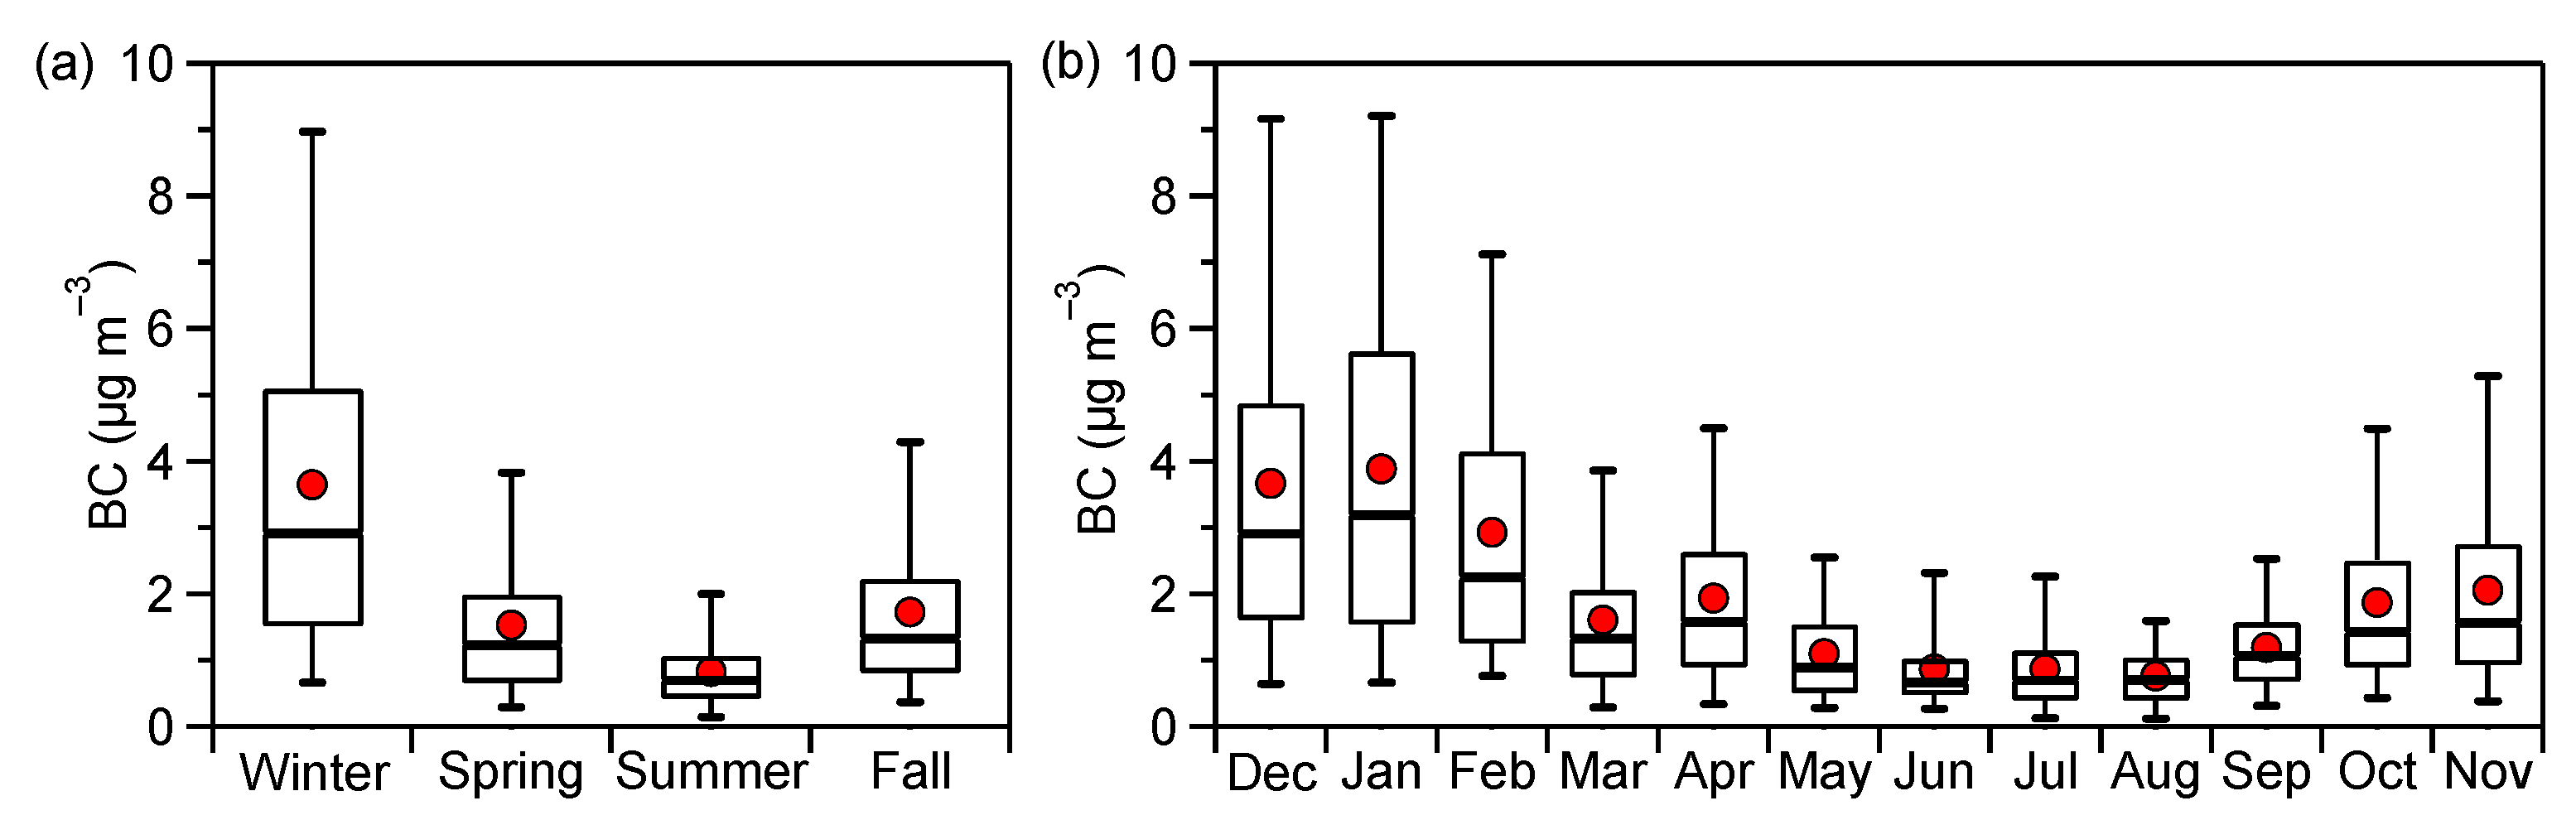
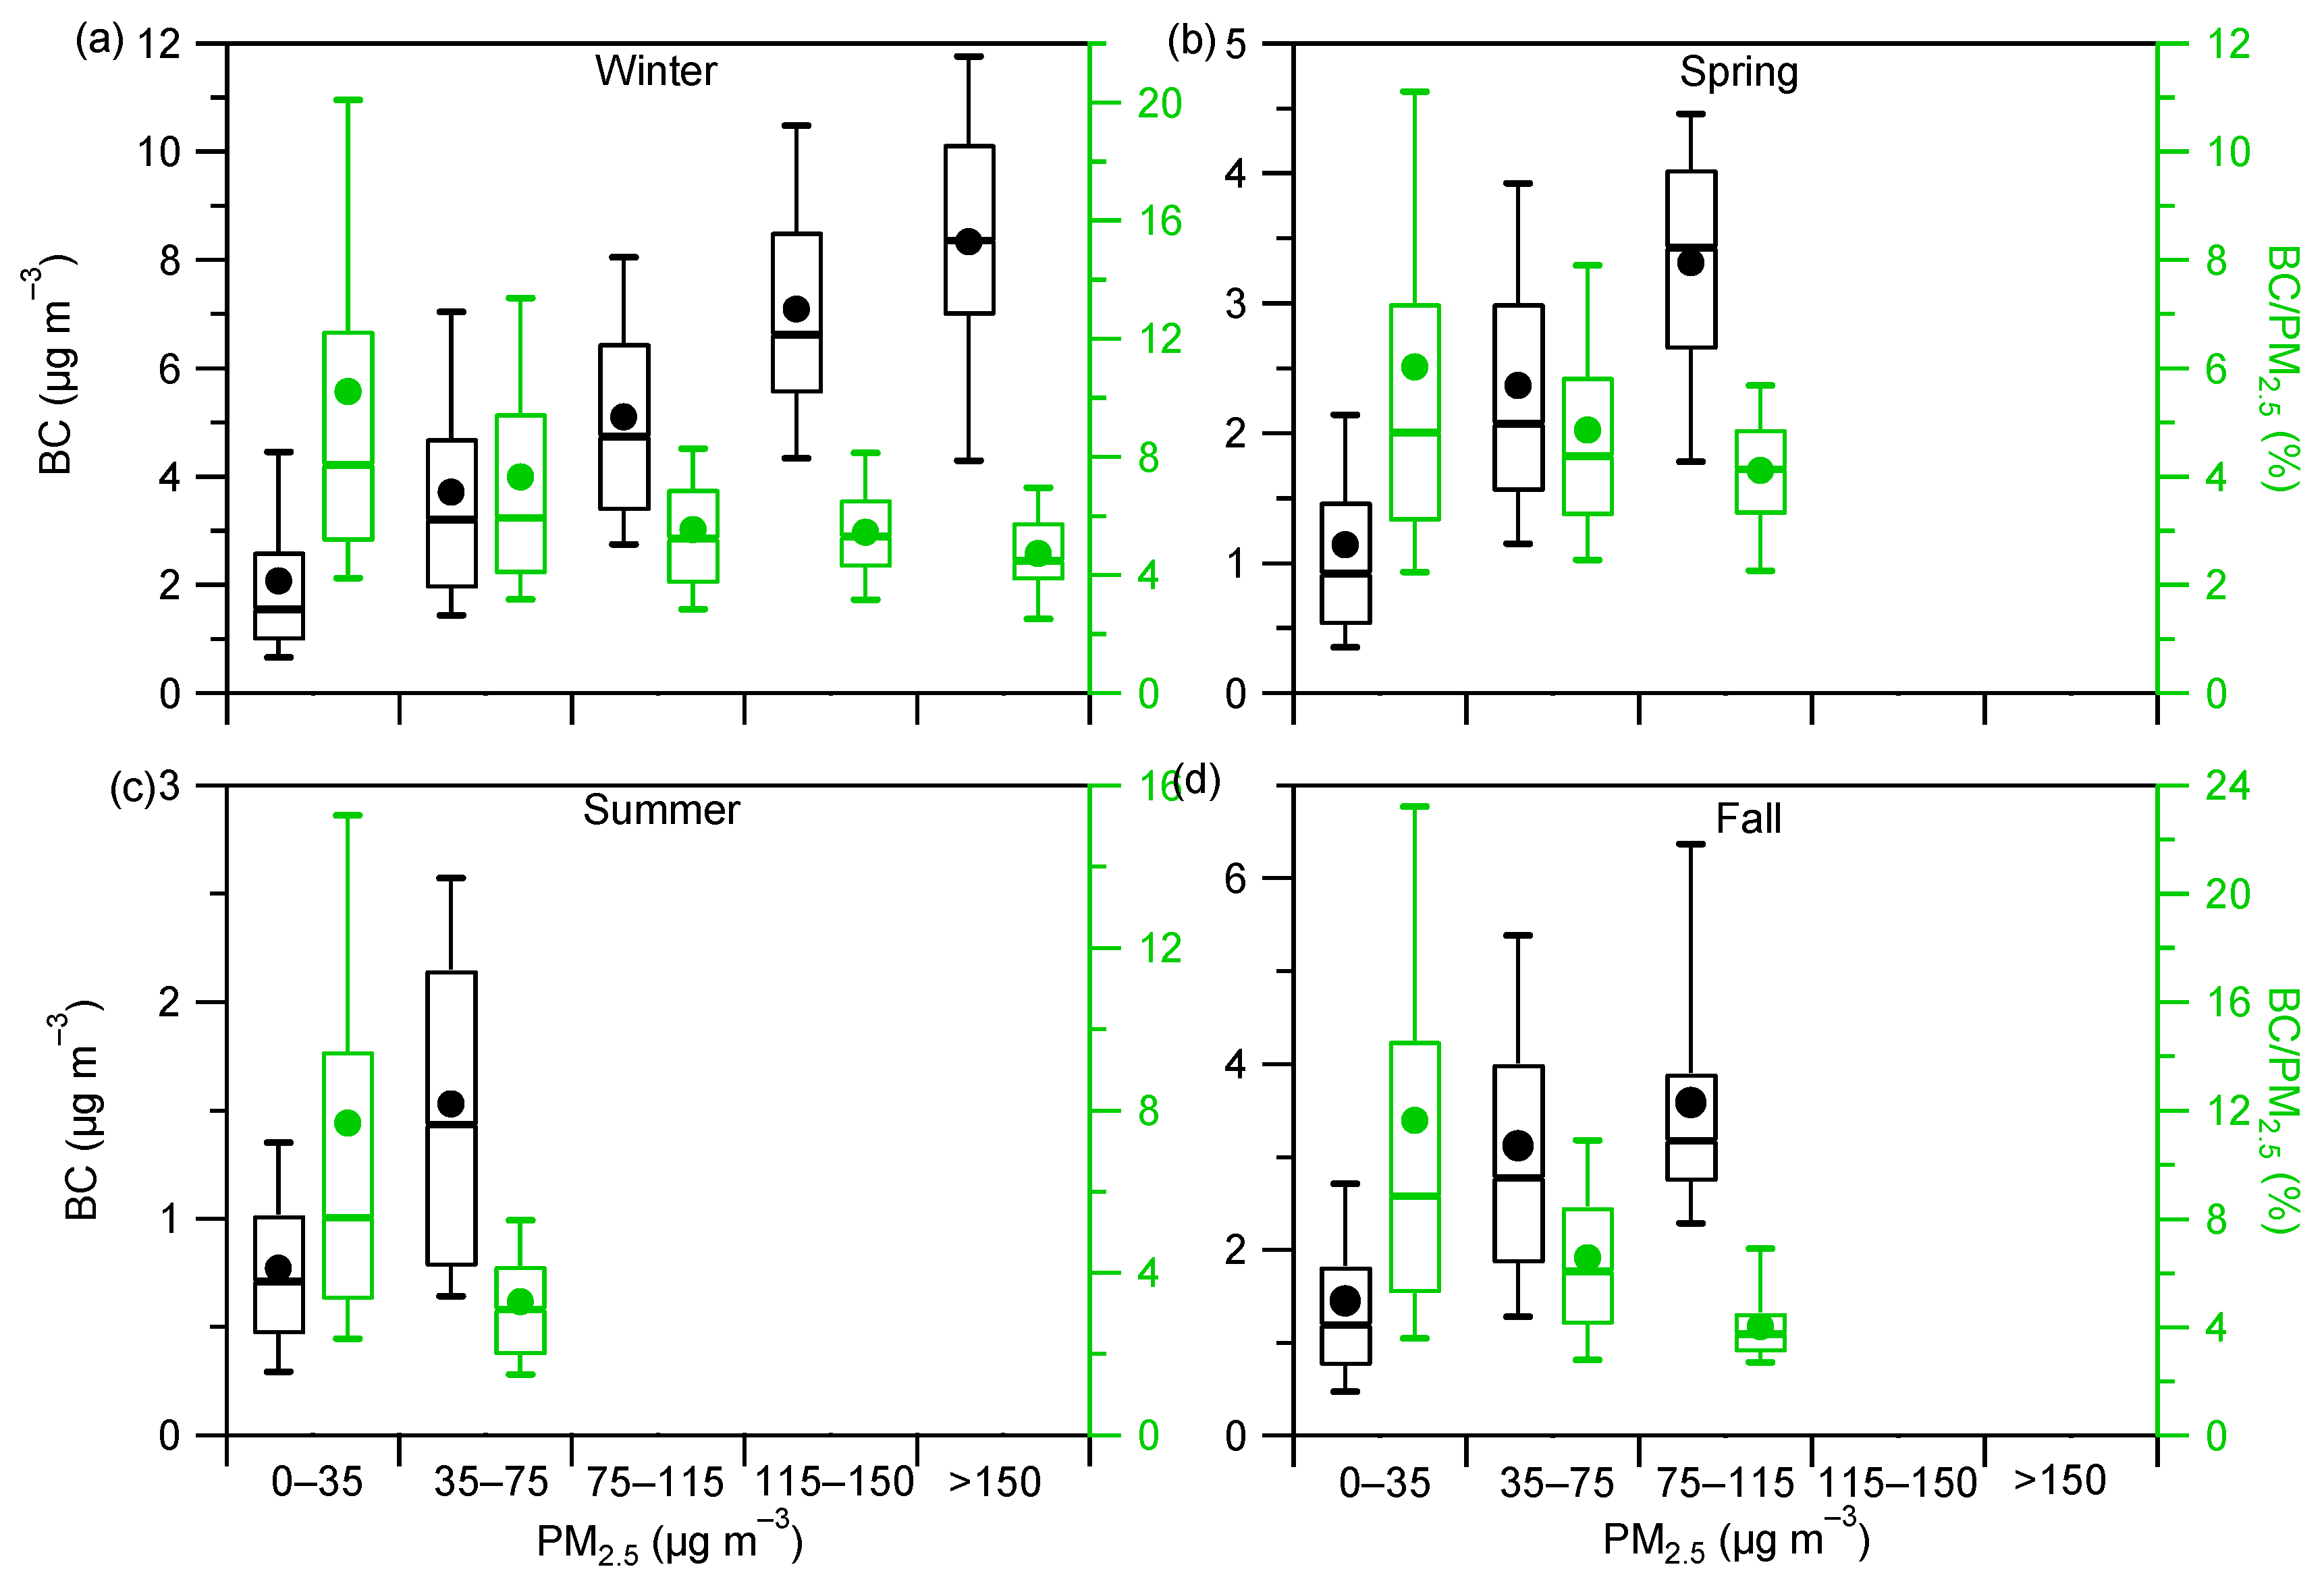
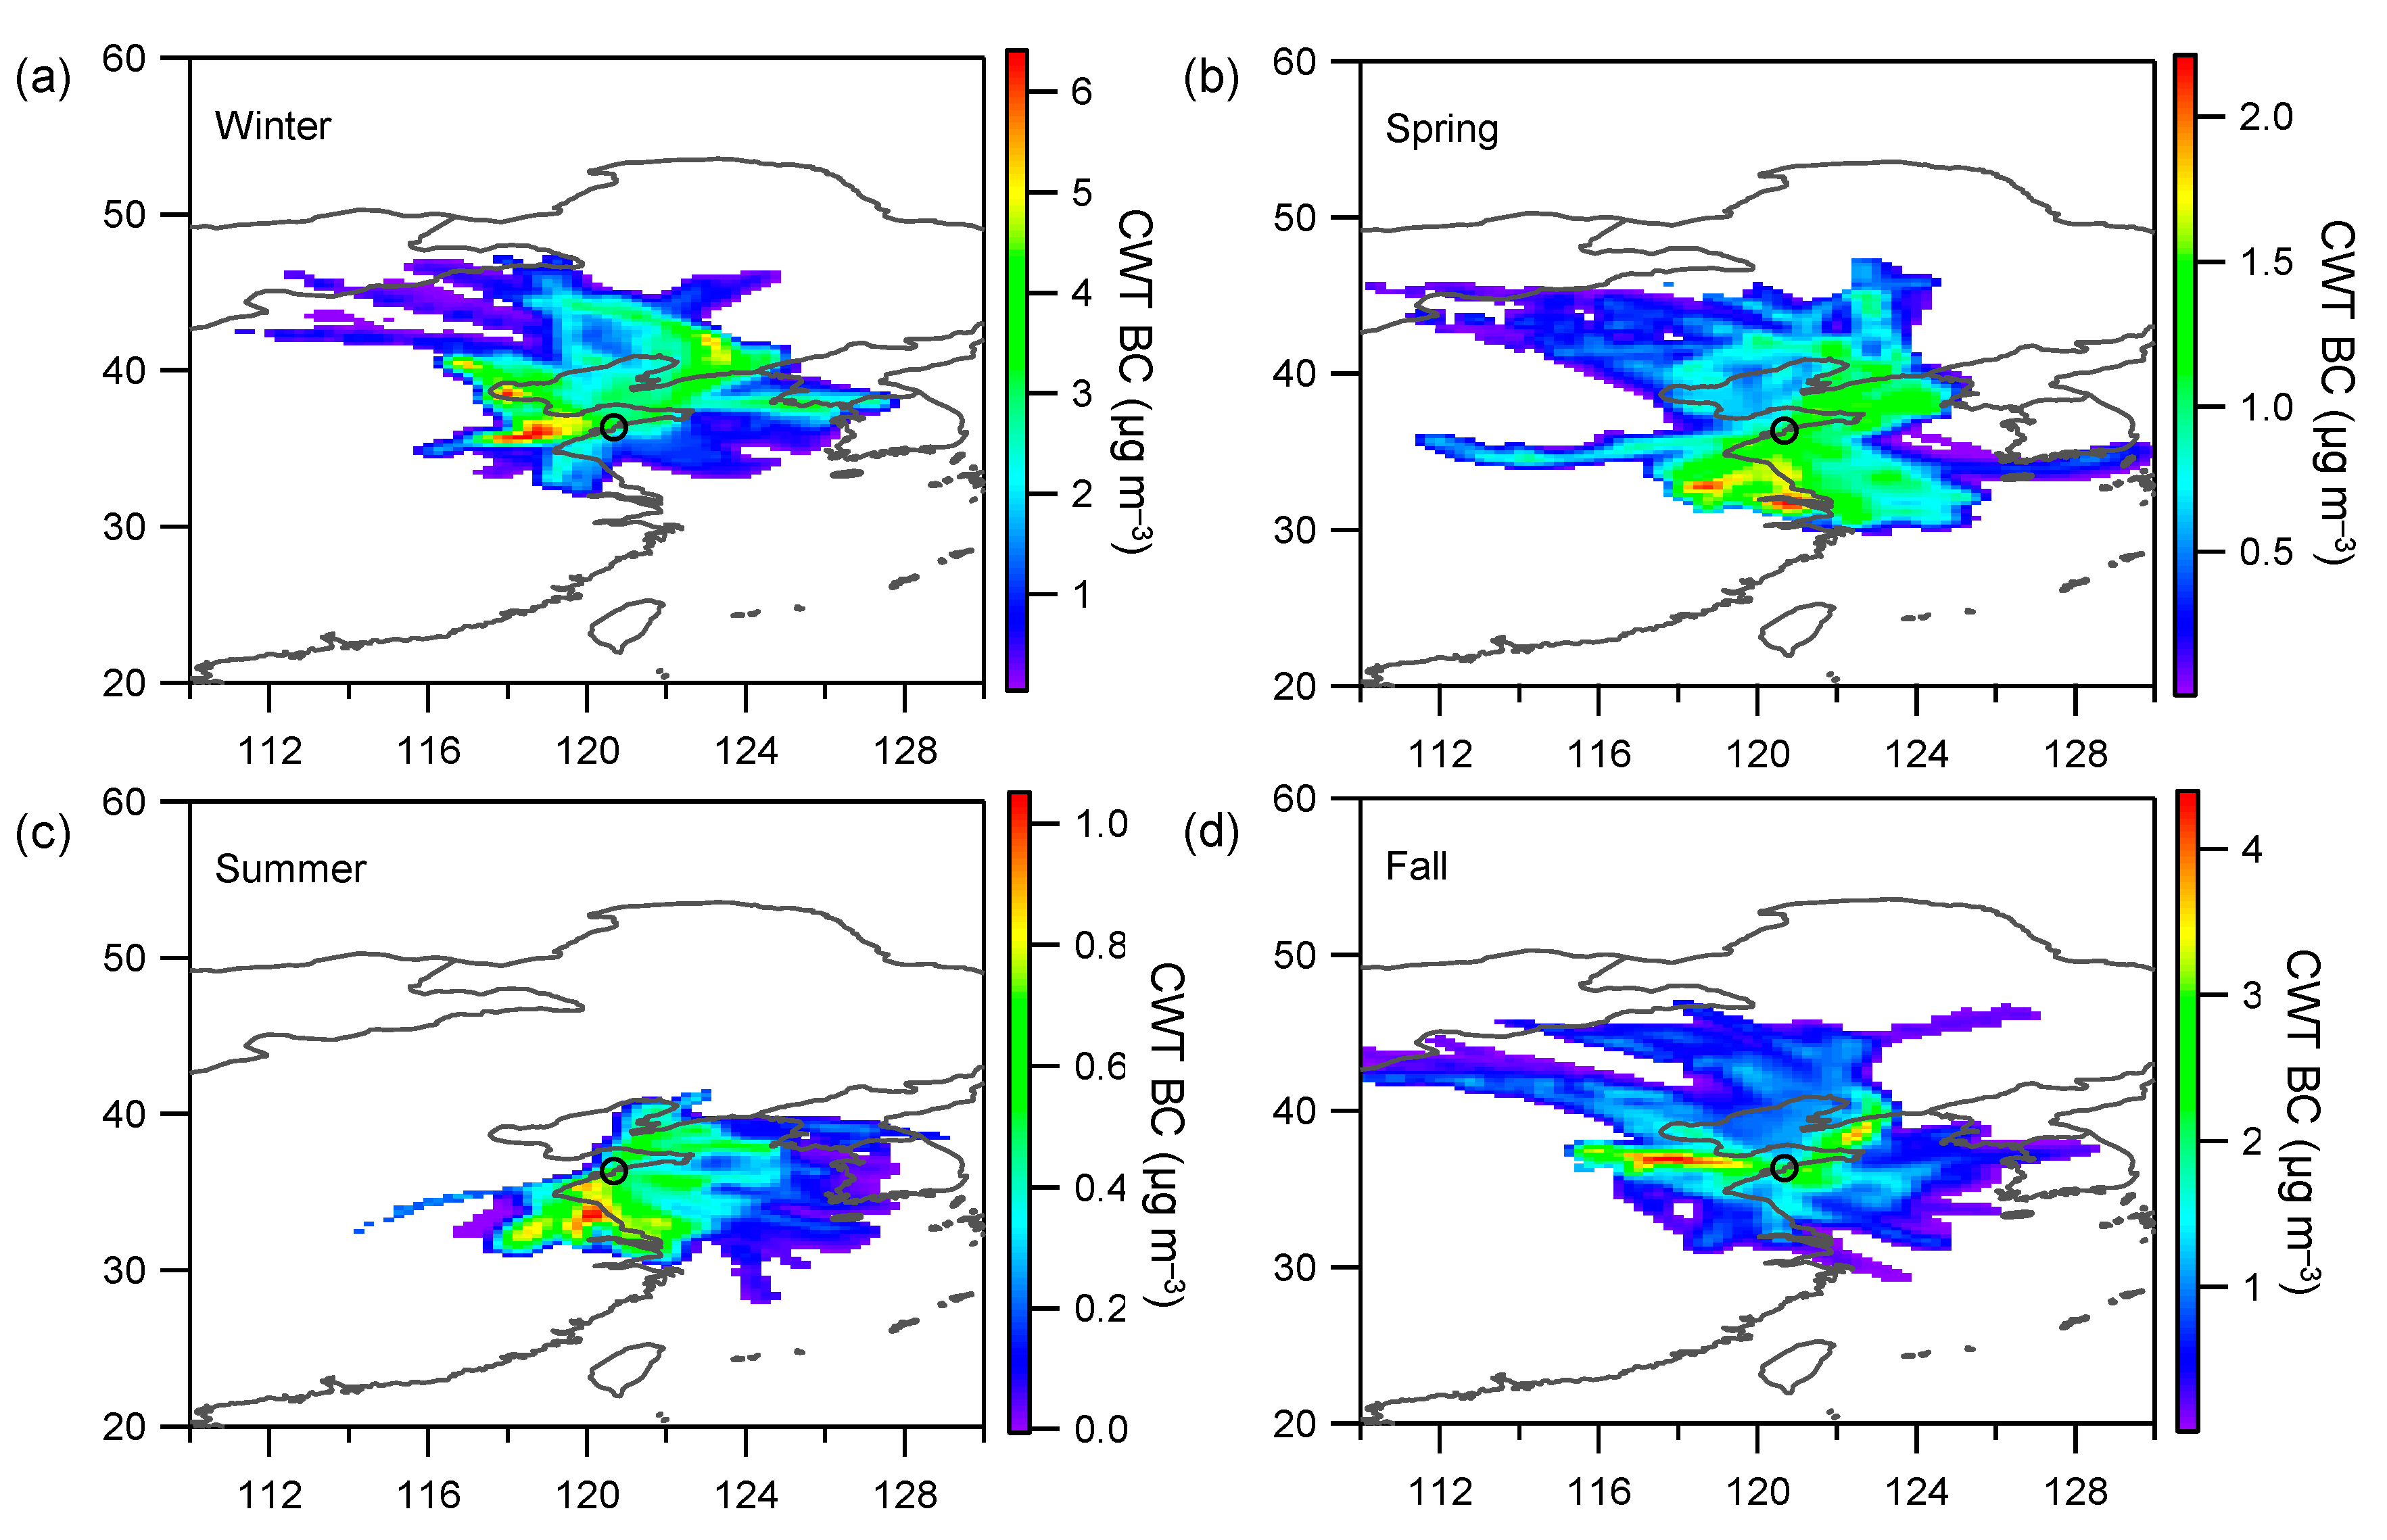
3.1.2. Seasonal Variations

Figure 3 shows clear seasonal variations of BC in rural Qingdao. The highest average concentration of BC was observed in winter (3.65 ± 2.66 μg m−3) and followed by fall (1.72 ± 1.33 μg m−3), spring (1.53 ± 1.33 μg m−3), and summer (0.83 ± 0.56 μg m−3). Such a seasonal variation pattern is similar to the seasonal pattern observed in other sampling sites in different regions, such as Hefei [58], Nanjing [55], and Indian Delhi [27]. Although the observation sites in rural Qingdao and urban Shanghai are both coastal cities (both belong to the monsoon region), the seasonal pattern of BC in Shanghai [19] (winter > summer > spring > fall) is different from that in rural Qingdao. BC concentrations observed in rural Beijing and urban Spain both showed a seasonal variation of fall > winter > spring > summer, which was not the same as in rural Qingdao, most likely due to increased biomass burning during the harvest season [65]. As reported by previous studies, the seasonal variation of atmospheric BC could be driven by both emissions [32,33] and meteorological conditions [26,31]. These results indicate that the contribution of the sources of BC in rural Qingdao was uniquely seasonal, while the magnitude of the influence of meteorological factors (WS, WD, BLH, and precipitation) on BC varied between seasons. The ratios of the mean BC concentrations in winter to the mean concentrations in other seasons (spring, summer, and fall) were 2.4, 4.4, and 2.1, respectively. This extreme seasonal difference is consistent with that observed in rural sites in Spain [66]. The BC concentrations corresponding to the maximum frequencies in different seasons were winter (1.29 μg m−3), spring (0.61 μg m−3), summer (0.43 μg m−3), and fall (0.76 μg m−3), as shown in Figure S2b. The peak and trough of the monthly variation of BC concentrations occurred in January (3.88 μg m−3) and August (0.76 μg m−3), respectively (In Figure 3b). The pattern of monthly BC concentration has not exhibited a clear U-shaped distribution. The lowest temperatures in January led to an increase in residential coal and biomass burning (the highest concentration of SO2 and CO) and an increase in vehicle traffic emissions near the Spring Festival (the higher level of NO2), resulting in the highest concentrations in January. The concentrations of gaseous pollutants (CO, SO2, and NO2) and meteorological factors (WS and BLH) were not the lowest in August, but the concentrations of BC and PM2.5 were both the lowest in August (in Figure 1). This may be the reason for the highest total precipitation and the highest frequency of precipitation in August (in Figure 1b) and the significant effect of wet deposition on BC scavenging, which is consistent with the findings in rural Beijing [34]. CO, a gaseous pollutant from incomplete combustion, showed the same monthly variation as BC, and PM2.5 and BC show the same peak and trough in the monthly pattern, which indicated that BC and combustion-generated atmospheric pollutants have common sources from Qingdao and its surrounding areas. These results indicate that the increase in local and regional anthropogenic primary emissions and adverse meteorological conditions lead to serious pollution of BC in winter [19,36,62], combined with the seasonal distribution pattern meteorological parameters and gas pollution.
Figure S3 shows the correlation between PM2.5 and BC was strong (r = 0.71), BC was scattered in winter. Moreover, the seasonal and monthly variation trends of BC and PM2.5 are consistent. These results indicated that BC and PM2.5 have common sources, but the contribution of the sources may be slightly different in four seasons. Therefore, to further investigate the distribution pattern of BC under different PM2.5 concentrations in the four seasons, the PM2.5 concentrations were divided into five bins (0–35 μg m−3, 35–75 μg m−3, 75–115 μg m−3, 115,150 μg m−3, >150 μg m−3). Figure 4 shows the box plot of BC concentration and mass ratio of BC/PM2.5 in five bins. As the concentration of PM2.5 increased (the data bins were based on the limits of different air pollution levels in China), the average BC concentration gradually increased from 2.07 to 8.3 μg m−3 in winter, from 1.14 to 3.3 μg m−3 in spring, from 0.77 to 1.53 μg m−3 in summer, and from 1.45 to 3.58 μg m−3 in fall. However, the mean ratio of BC/PM2.5 gradually decreased from 10.2% to 4.7% in winter, from 6.0% to 4.1% in spring, from 7.7% to 3.3% in summer, and from 11.6% to 4.0% in fall. It is well known that PM2.5 was a complex mixture of primary and secondary species, and BC aerosol was a typical primary pollutant. The decreasing proportion of BC in PM2.5 may be indicated that chemically generated secondary species play a more important role in the heavier pollution of PM2.5. This conclusion was consistent with the results found in the Nanjing area, but further verification is needed through the physical and chemical properties of PM2.5.

3.1.3. Diurnal Variation

As shown in Figure S4a, the diurnal variation of BC was similar for all four seasons except for summer, which showed a clear double peak with peaks at 7:00–8:00 and 18:00–19:00, respectively. The increasing BC concentrations in the morning and evening were mainly attributed to the increase of traffic emissions and solid fuel combustion (peaked in NO2, CO, and SO2 during the corresponding periods, as shown in Figure S4b,d), and meteorological factors (BLH and WS were the lowest values, as shown in Figure S5). After sunrise, with enhanced convective activity, BLH and WS rose rapidly (e.g., Figure S5), and better diffusion conditions caused BC concentrations to decrease gradually, reaching a minimum at 14:00–15:00. There was no obvious peak in summer, and BC only had a small high value at 6:00, consistent with that in an urban-rural fringe area of Beijing [34], and the diurnal pattern of BC was much stable in summer compared to the rest of the season. This was not similar to the daily variation in summer in some areas [19,36,57,58]. Moreover, the summer BC did not show the same morning and evening peaks as NO2 and was not quite the same as the daily variation of CO and SO2. However, the daily variation patterns of WS and BLH were similar throughout the four seasons (Figure S5b,c). The reason for this unique daily variation in summer may be due to the higher frequency and total amount of precipitation in summer, which had a significant wet deposition removal effect. Compared to other seasons, the daily variation of BC in winter was most similar to that of gaseous pollutants (Figure S4b,d), while horizontal and vertical dispersion conditions were moderate. However, the difference between daily maximum and minimum concentrations was greatest in winter (2.75 μg m−3), followed by fall (1.41 μg m−3), spring (1.20 μg m−3), and summer (0.41 μg m−3). The diurnal variation of BC in rural areas of Qingdao had certain seasonal differences, which may be due to the differences in emission intensity and meteorological conditions of the sources associated with BC in each season.

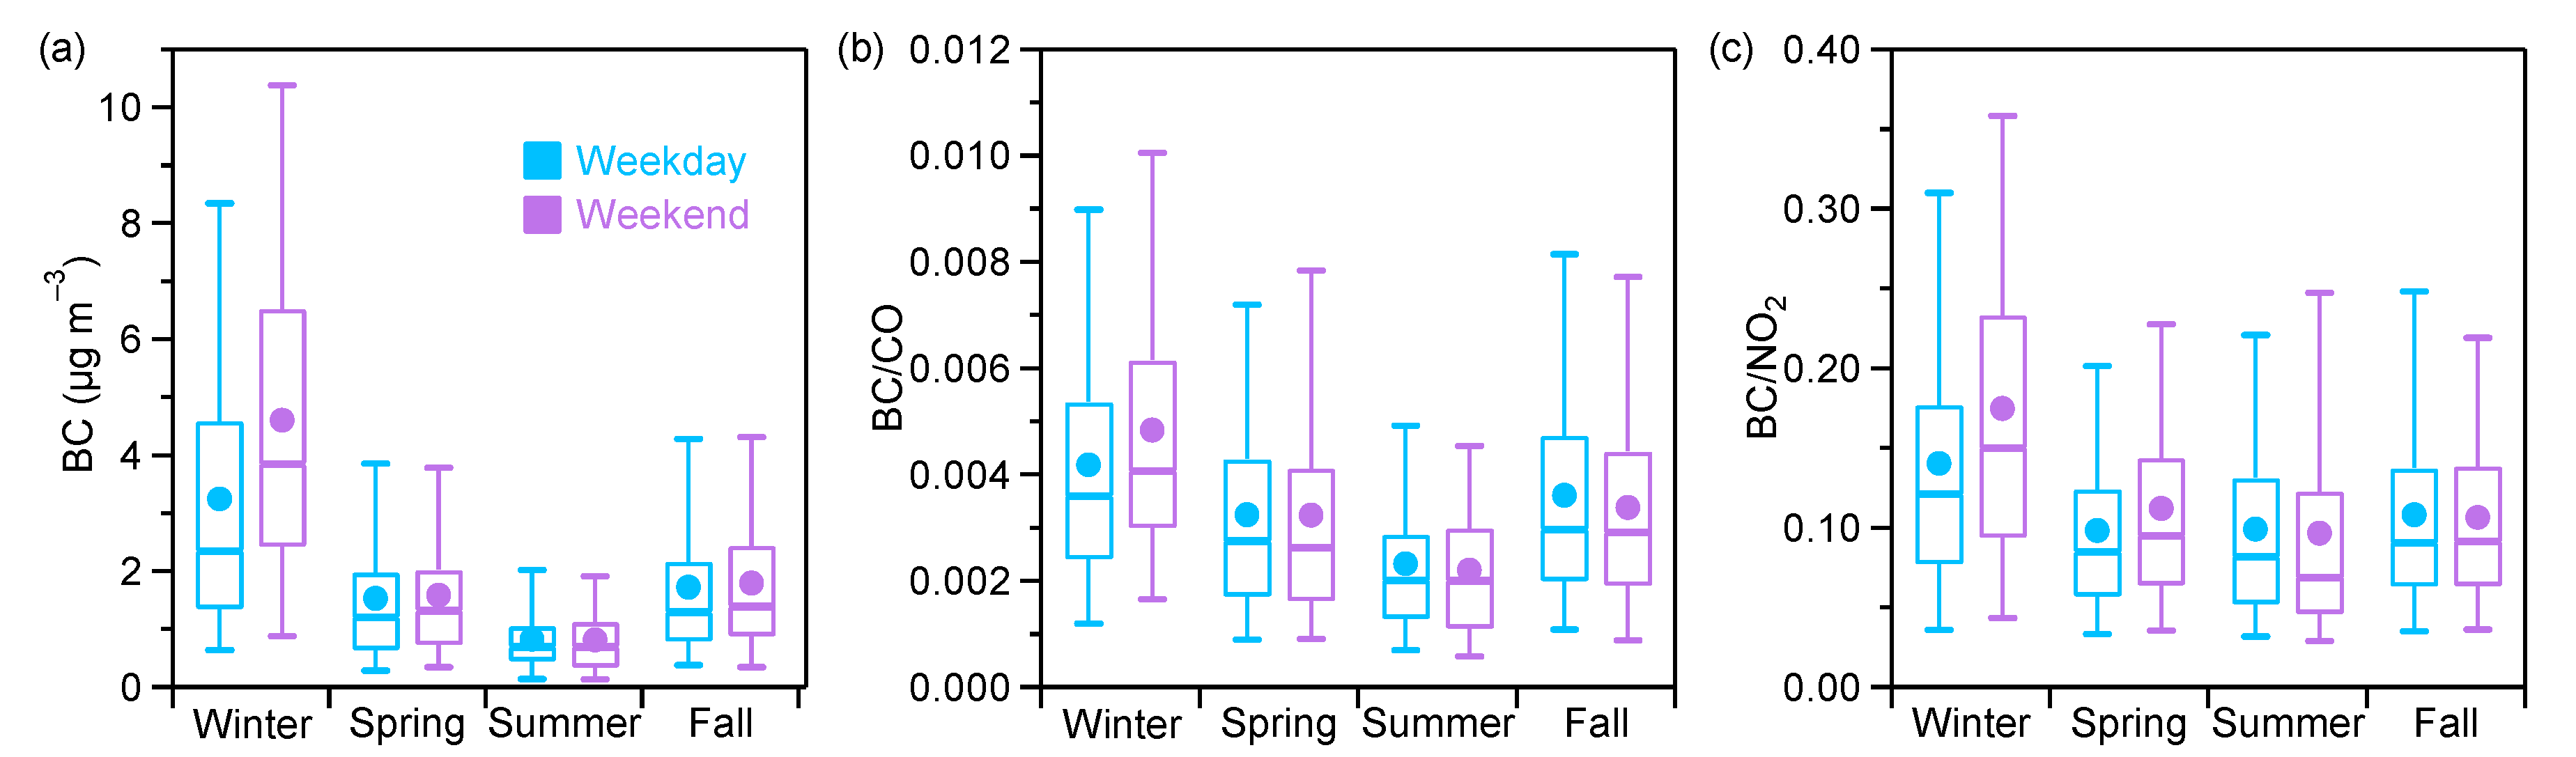
3.1.4. Weekend Effect

Figure 5a describes the differences in BC concentrations between weekdays and weekends in the four seasons. The BC concentrations on weekends were significantly higher than that on weekdays in winter, while the weekend and weekday BC concentrations were essentially comparable for the rest of the seasons. Similarly, the weekday and weekend BC/CO and BC/NO2 showed similar patterns in different seasons (Figure 5b,c). The diurnal variation of BC on weekends and weekdays in winter was similar, while the BC concentration on weekends was overall higher than that on weekdays (Figure S6). This was contrary to the result shown for urban areas [55,66,67], which was that the BC concentrations were higher on weekdays than that on weekends, implying unique anthropogenic emission regulation of BC in winter. There were two possible reasons to explain such a phenomenon. First, anthropogenic emissions (e.g., coal and biomass burning) increased during wintertime heating weekends in rural areas nearby the sampling site. This could be supported by the evidently higher concentrations of a biomass burning tracer, i.e., C2H4O2, on weekend winter than that on weekdays (Figure S7). In addition, the PM2.5 source apportionment analysis in Qingdao showed that coal and biomass combustion could contribute 41.53% to the total PM2.5 during the wintertime [43], supporting a significant contribution from these solid fuels combustion sources to ambient BC in Qingdao. Second, the area near the sampling site is a new type of tourist area (Heshan Scenic Area to the west) with hot springs and farmhouses. The short weekend trip leads to both increase in traffic emissions (20.52% contribution from traffic in Qingdao PM2.5 winter source analysis [43]) and a certain extent in solid fuel consumption. Those results could suggest the importance of such weekend effect on ambient BC concentrations due to distinct residential coal and/or biomass burning emissions between weekends and weekdays.

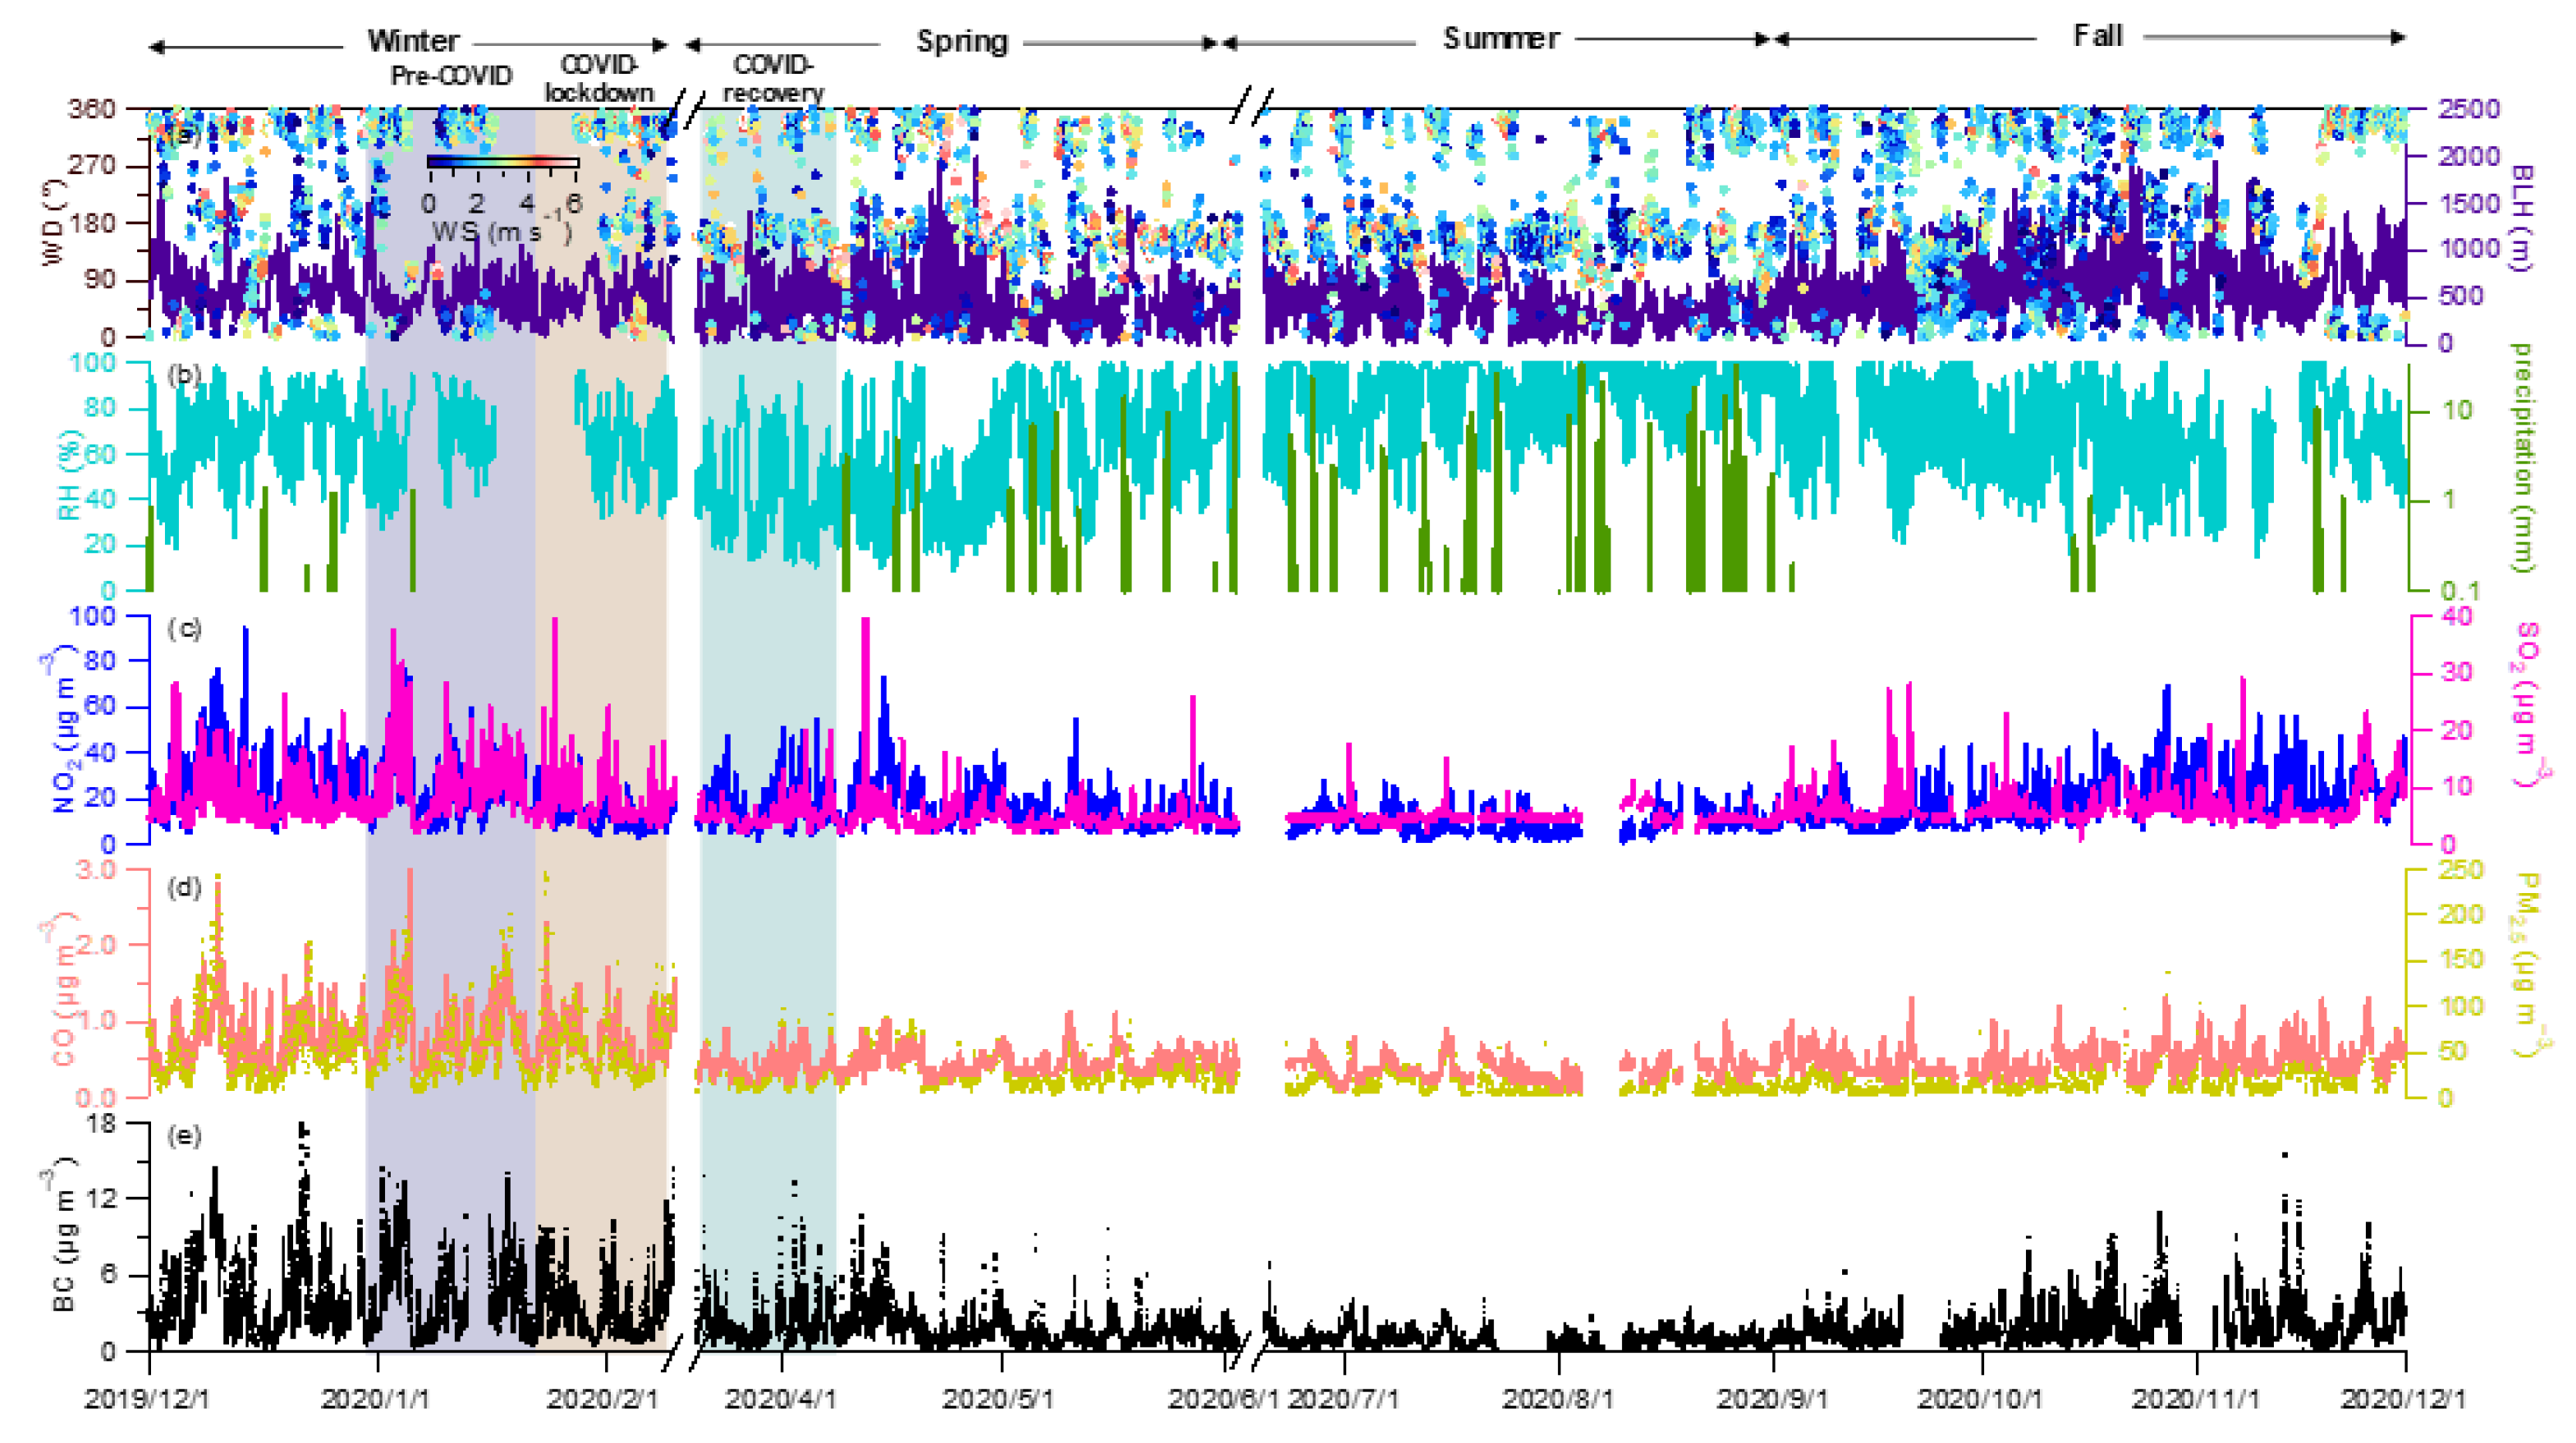
3.2. Influence of Meteorological Parameters on BC

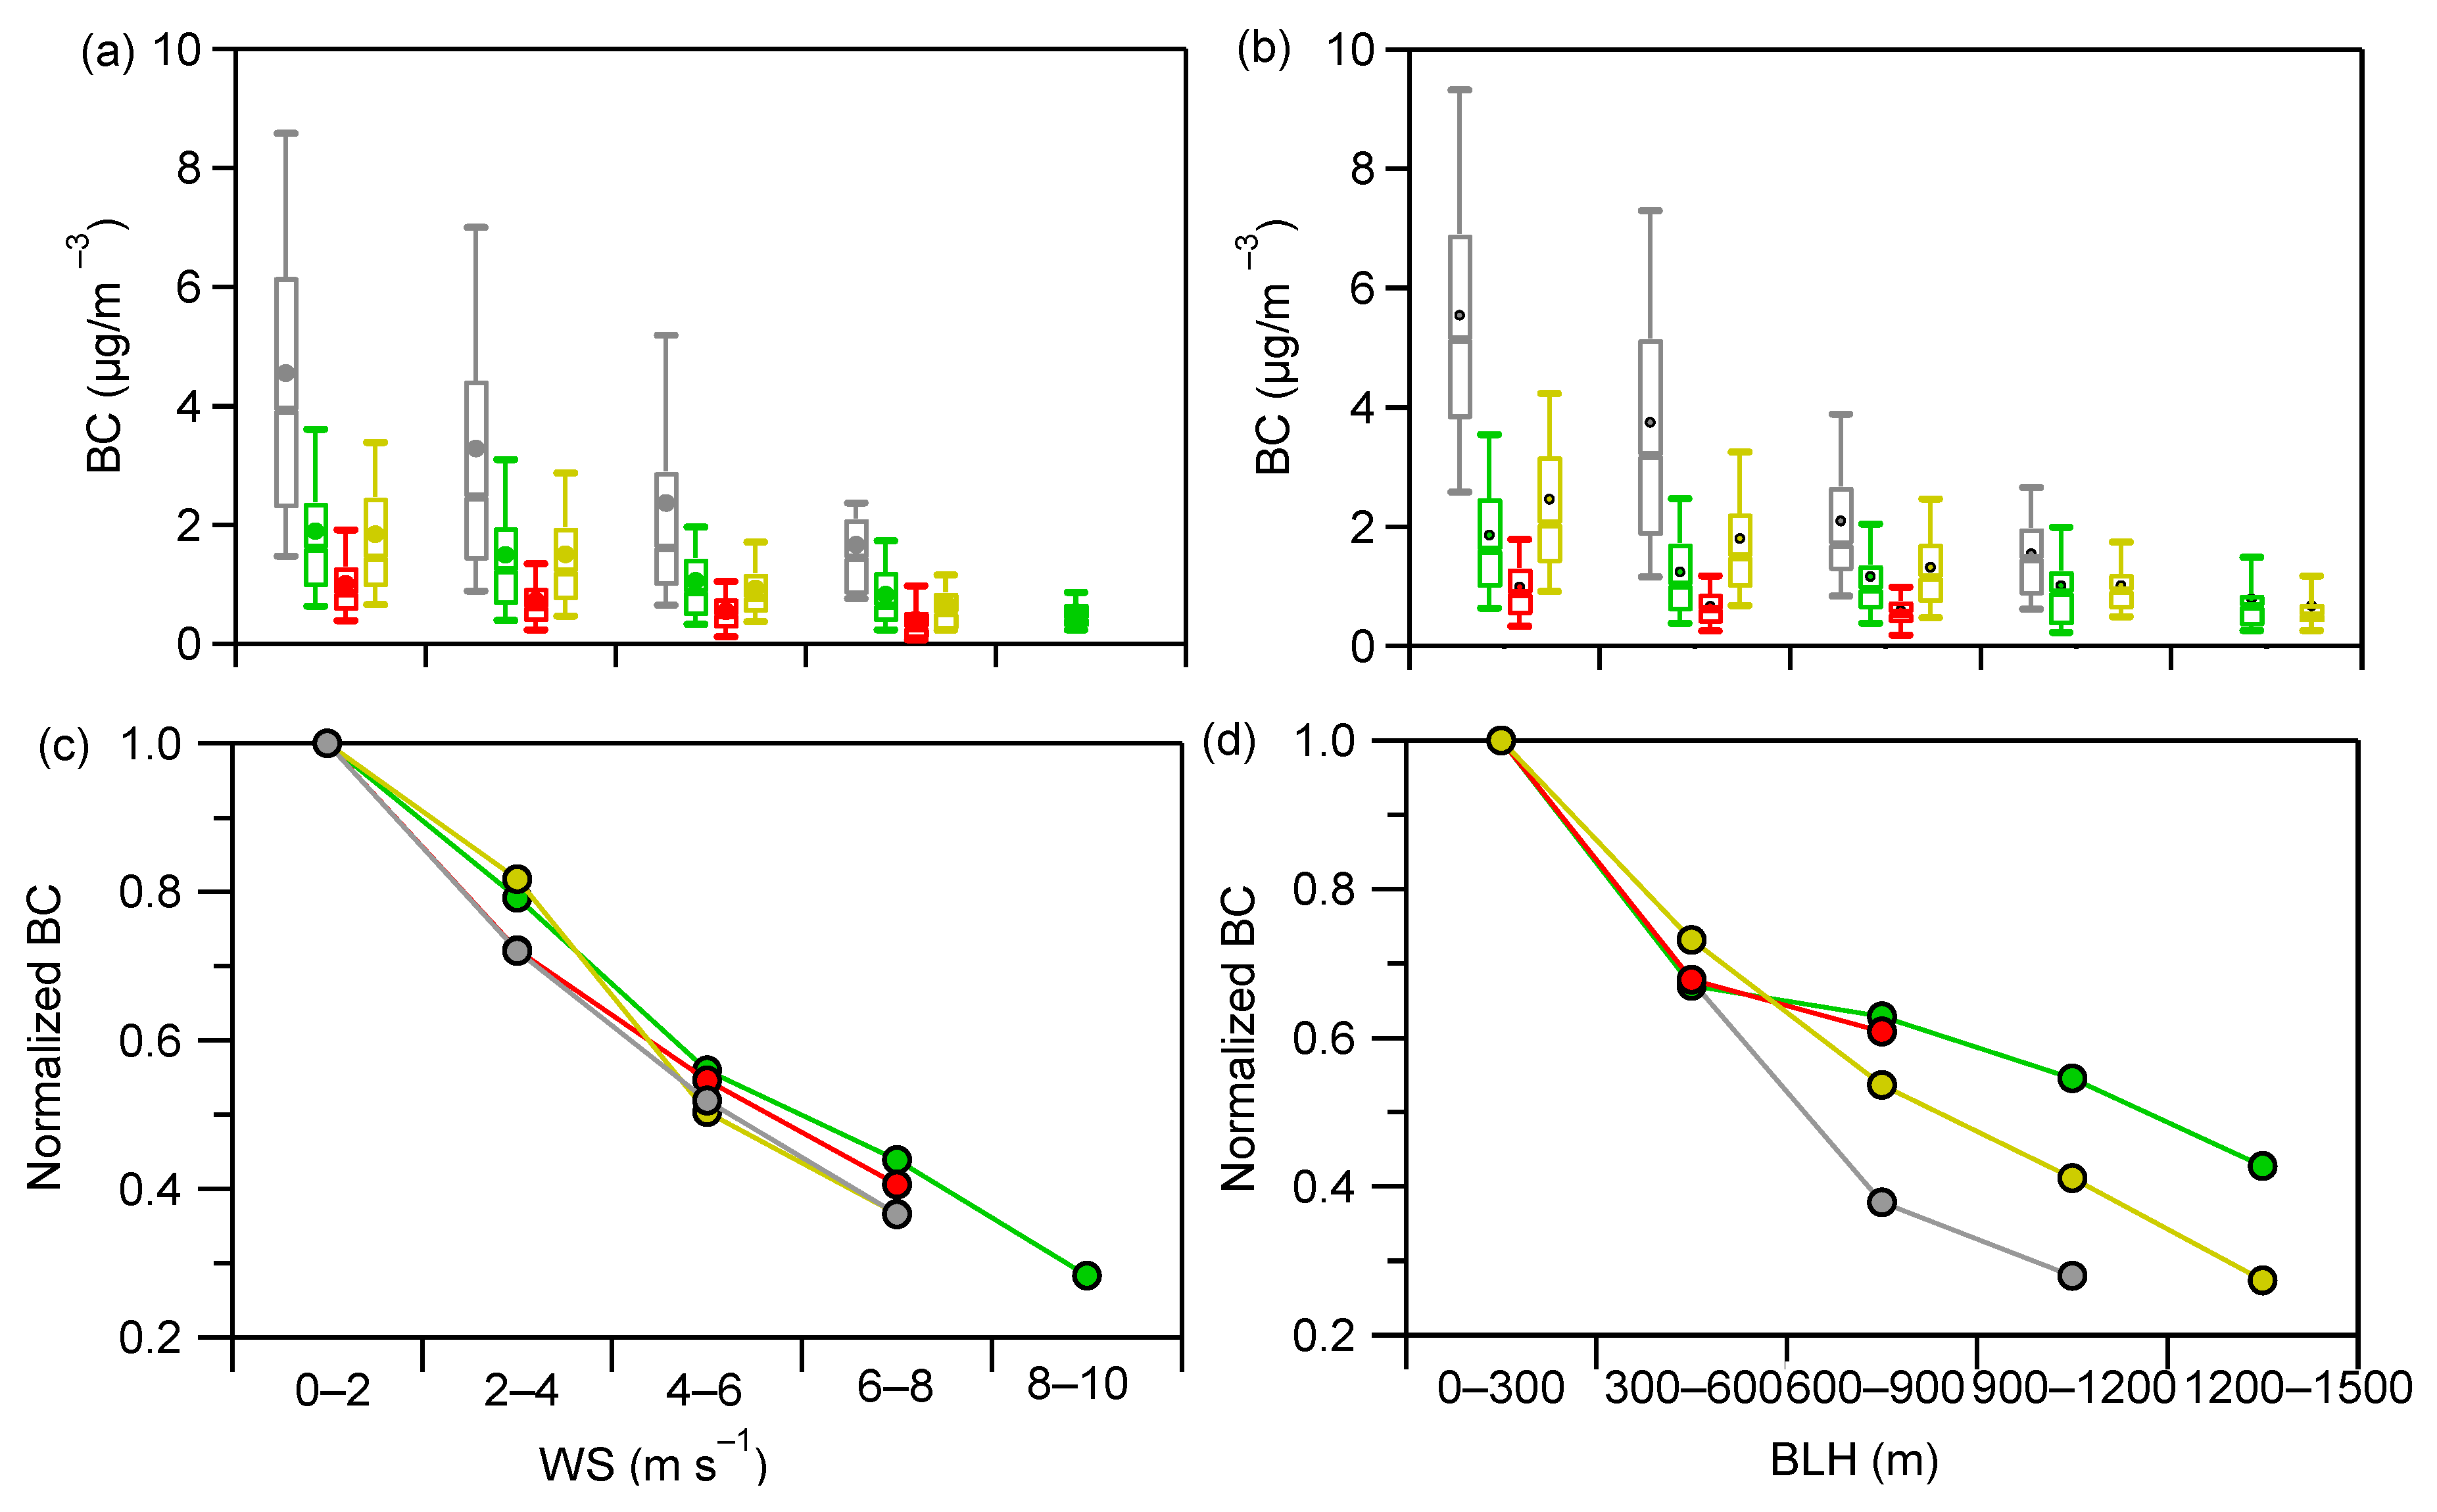
3.2.1. Influence of Wind Speed and Boundary Layer Height

Figure 6 shows the relationships between BC and WS and BLH in the four seasons, respectively. The average BC concentration gradually decreased with the increase of WS from 4.56 to 1.67 μg m−3 in winter, from 1.90 to 0.54 μg m−3 in spring, from 1.0 to 0.41 μg m−3 in summer, and from 1.84 to 0.67μg m−3 in fall, respectively. Similarly, the BC concentration gradually decreased with the increase of BLH from 5.54 to 1.55 μg m−3 in winter, from 1.86 to 0.79 μg m−3 in spring, from 0.99 to 0.60 μg m−3 in summer, and from 2.46 to 0.67 μg m−3 in fall, respectively. These results could support the important influence of these two meteorological factors, i.e., WS and BLH, on BC concentrations in the atmosphere. To further explore the relationship between the relative change rates of BC with WS and BLH, the BC was normalized by dividing the value of each WS or BLH-dependent bin by the average BC concentration observed in the first bin. As shown in Figure 6, the relative change rate of BC presented decreasing trends as the increase of WS in all seasons. These trends were highly consistent with each other in each season, suggesting insignificant seasonality of such the horizontal WS influence. Figure 6d shows the relative change rate of BC against BLH, which, however, was characterized by strong seasonal differences for their corresponding trends in different seasons. Indeed, the most rapid decrease in the relative change rate of BC was observed in winter among the four seasons, suggesting a more effective effect of vertical dilution and diffusion on BC in winter rather than in each of any other seasons. The results above imply that the seasonality of atmospheric diffusion and dilution effect on surface BC might be derived by the BLH variation in rural Qingdao.

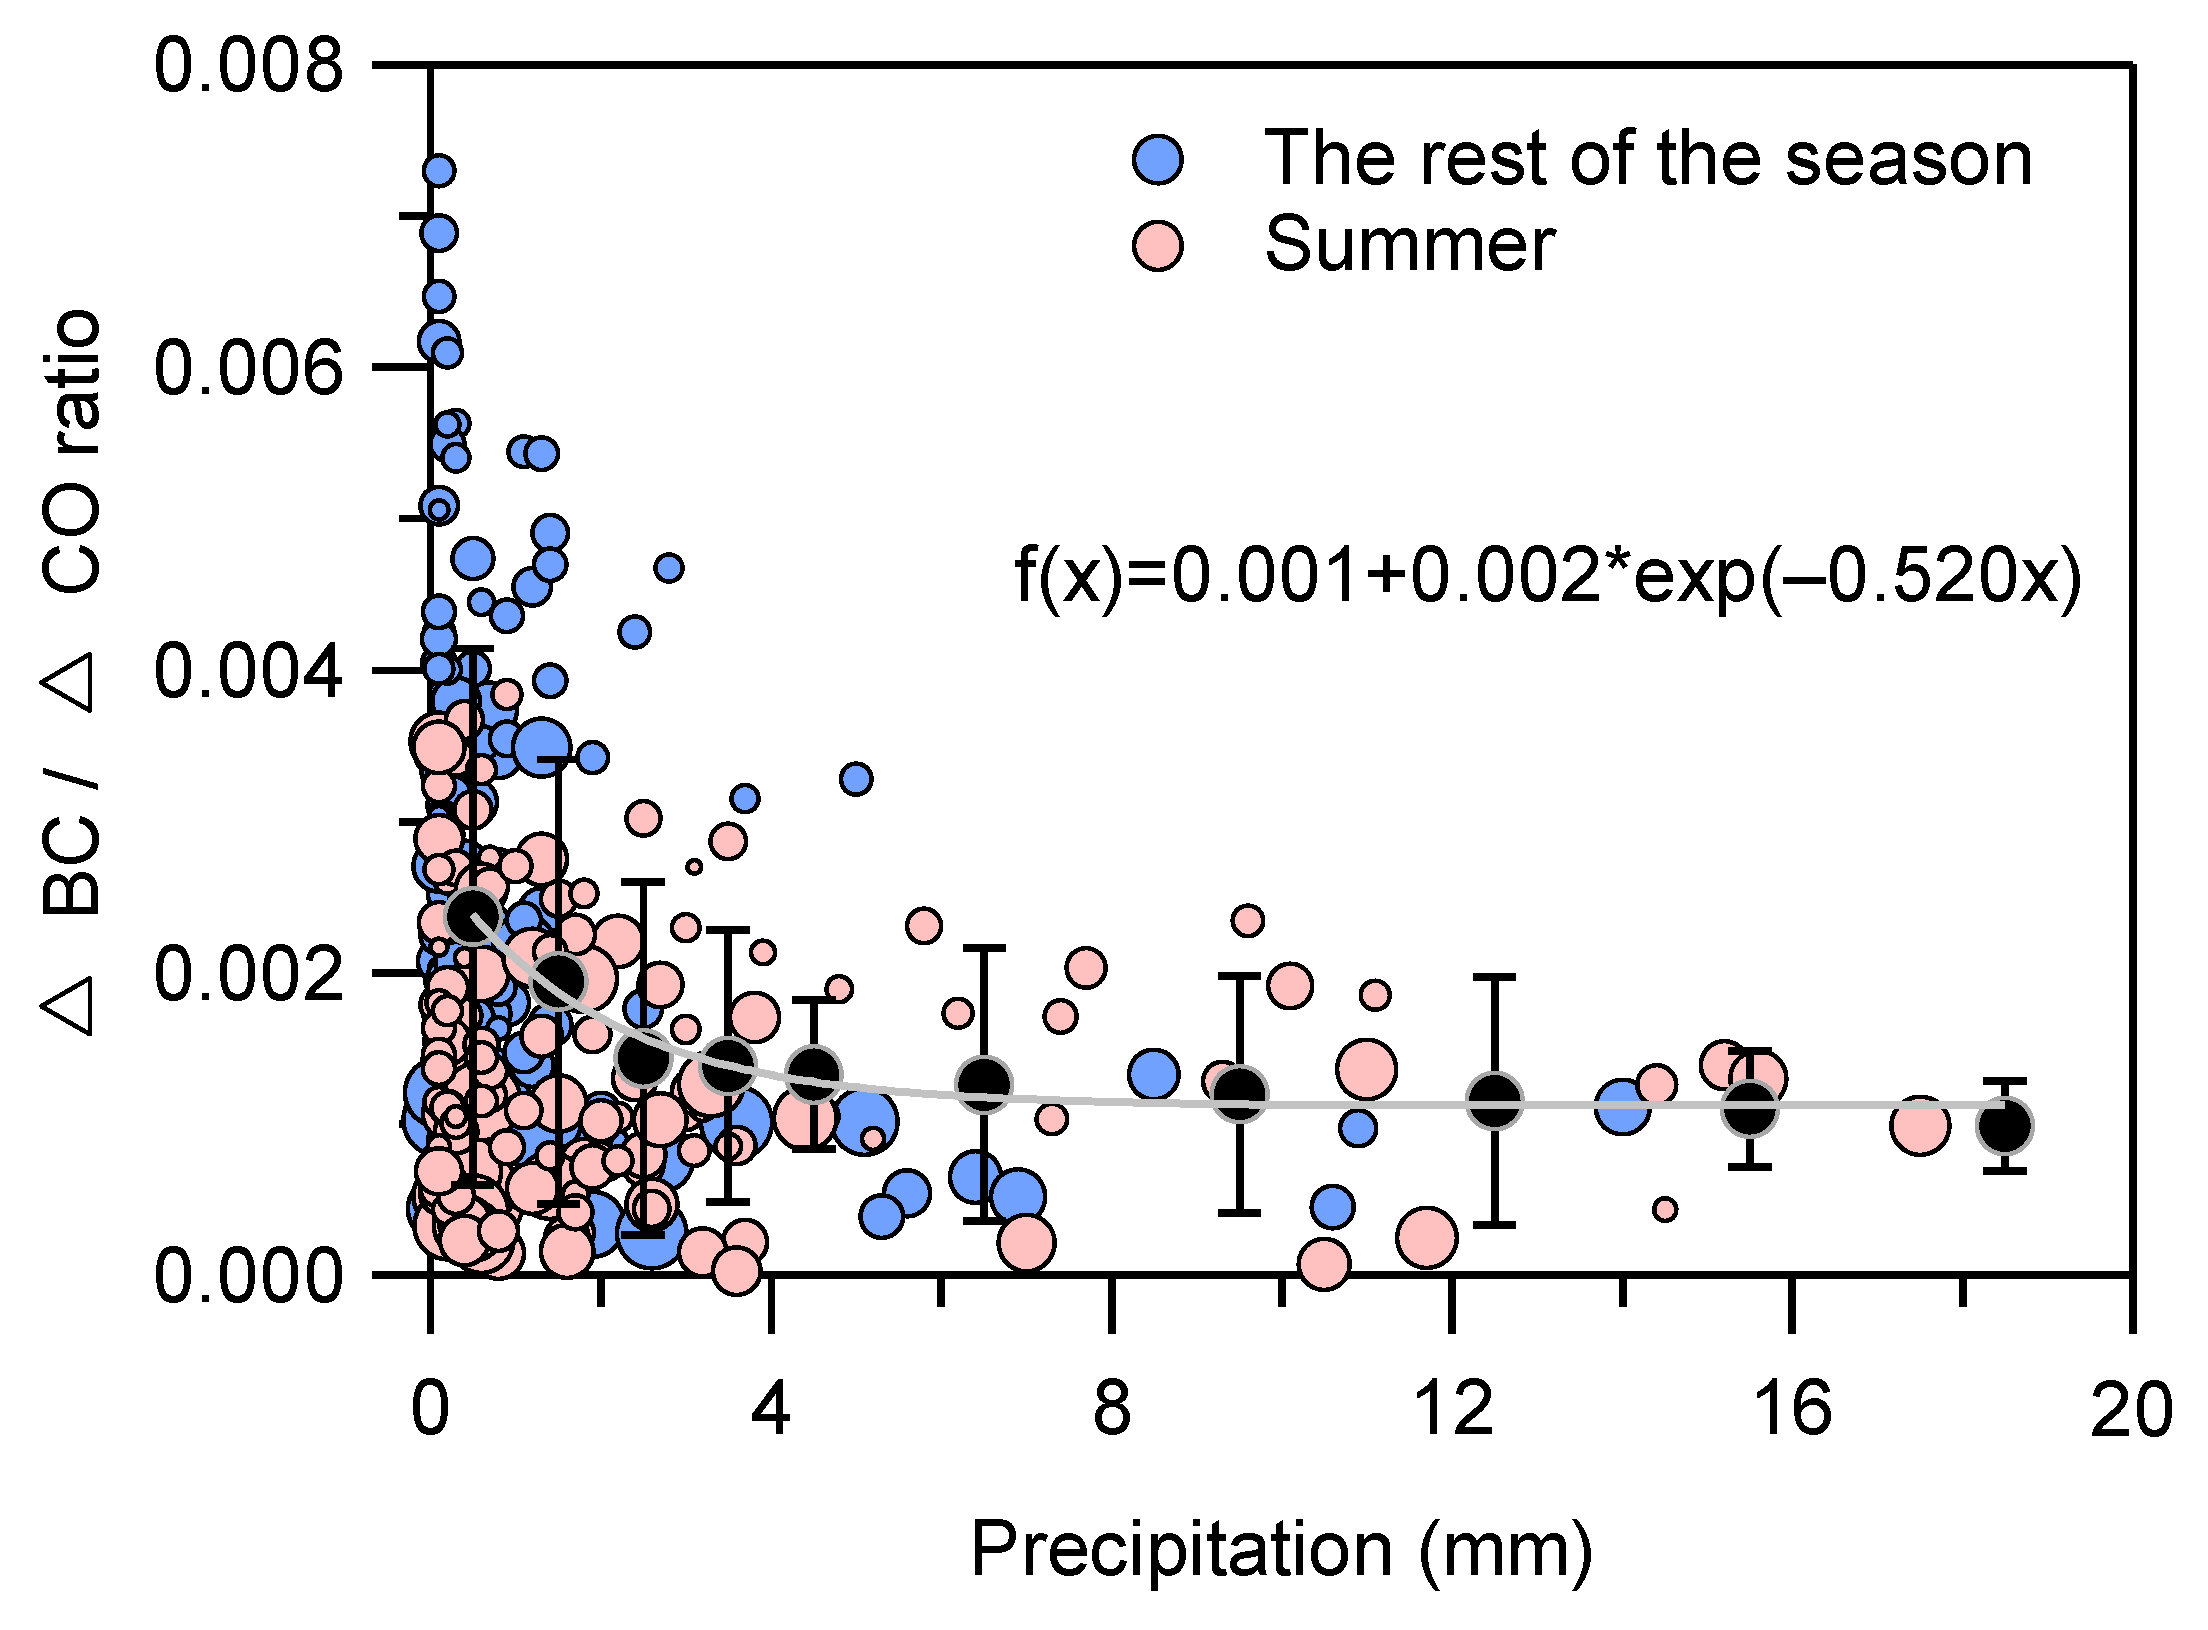
3.2.2. Influence of Precipitation

BC and CO are both mainly generated from the incomplete combustion of liquid fossil fuels or solid biomass and have source homology in intense anthropogenic regions. Because the atmospheric lifetime of BC (about one week) is shorter than that of CO (1 month), wet removal can remove BC, but not CO. Therefore, the △BC/△CO ratio, minimize influence atmospheric dilution, has been often used to investigate the influence of wet scavenging on surface BC [24,68,69]. The delta symbol (△) represents the difference between observed and background concentrations. The background concentration of BC was deemed to be zero, and the background concentration of CO was determined as 1.25th percentile of the CO concentrations for each month, which is consistent with the definition adopted in previous studies [25,70,71]. The background concentrations of CO for each month were 0.3 (December), 0.3 (January), 0.2 (February), 0.1 (March), 0.2 (April), 0.3 (May), 0.2 (June), 0.1 (July), 0.1 (August), 0.2 (September), 0.2 (October), and 0.3 (November) mg m−3, respectively.
The overall mean of the observed △BC/△CO ratio in the presence of precipitation (0.0041 ± 0.0036) was lower than that in the absence of precipitation (0.0071 ± 0.0057). As it could be assumed that CO was not affected by precipitation, this result could overall indicate that BC was lost through the below-cloud wet deposition. Such a result is consistent with some previous findings [24]. From the red fitting line in Figure 7, it can be seen that △BC/△CO decreases gradually with increasing precipitation. The △BC/△CO ratio decreases rapidly when precipitation is in the range of 0–5 mm, with a decrease of 43.5% compared to the average value of the first interval (the first black circle represents the value 0.0023 in Figure 7). The average △BC/△CO ratio was close to 0.0011 when the precipitation is larger than 10 mm, reflecting a flat trend for the relationship of △BC/△CO ratio against precipitation. Compared to the average value of the starting interval, the △BC/△CO ratio decreased by 52%. The results highlight the importance of the below-cloud wet removal effect on surface BC. The △BC/△CO ratio had the highest number of data points in summer (52.4%), followed by spring (19.6%), winter (16.0%), and fall (11.8%), respectively. Combined with the seasonal distribution pattern of BC concentration (in Section 3.1.2), it was found that wet deposition in summer had a significant removal effect on the BC concentration in rural Qingdao.

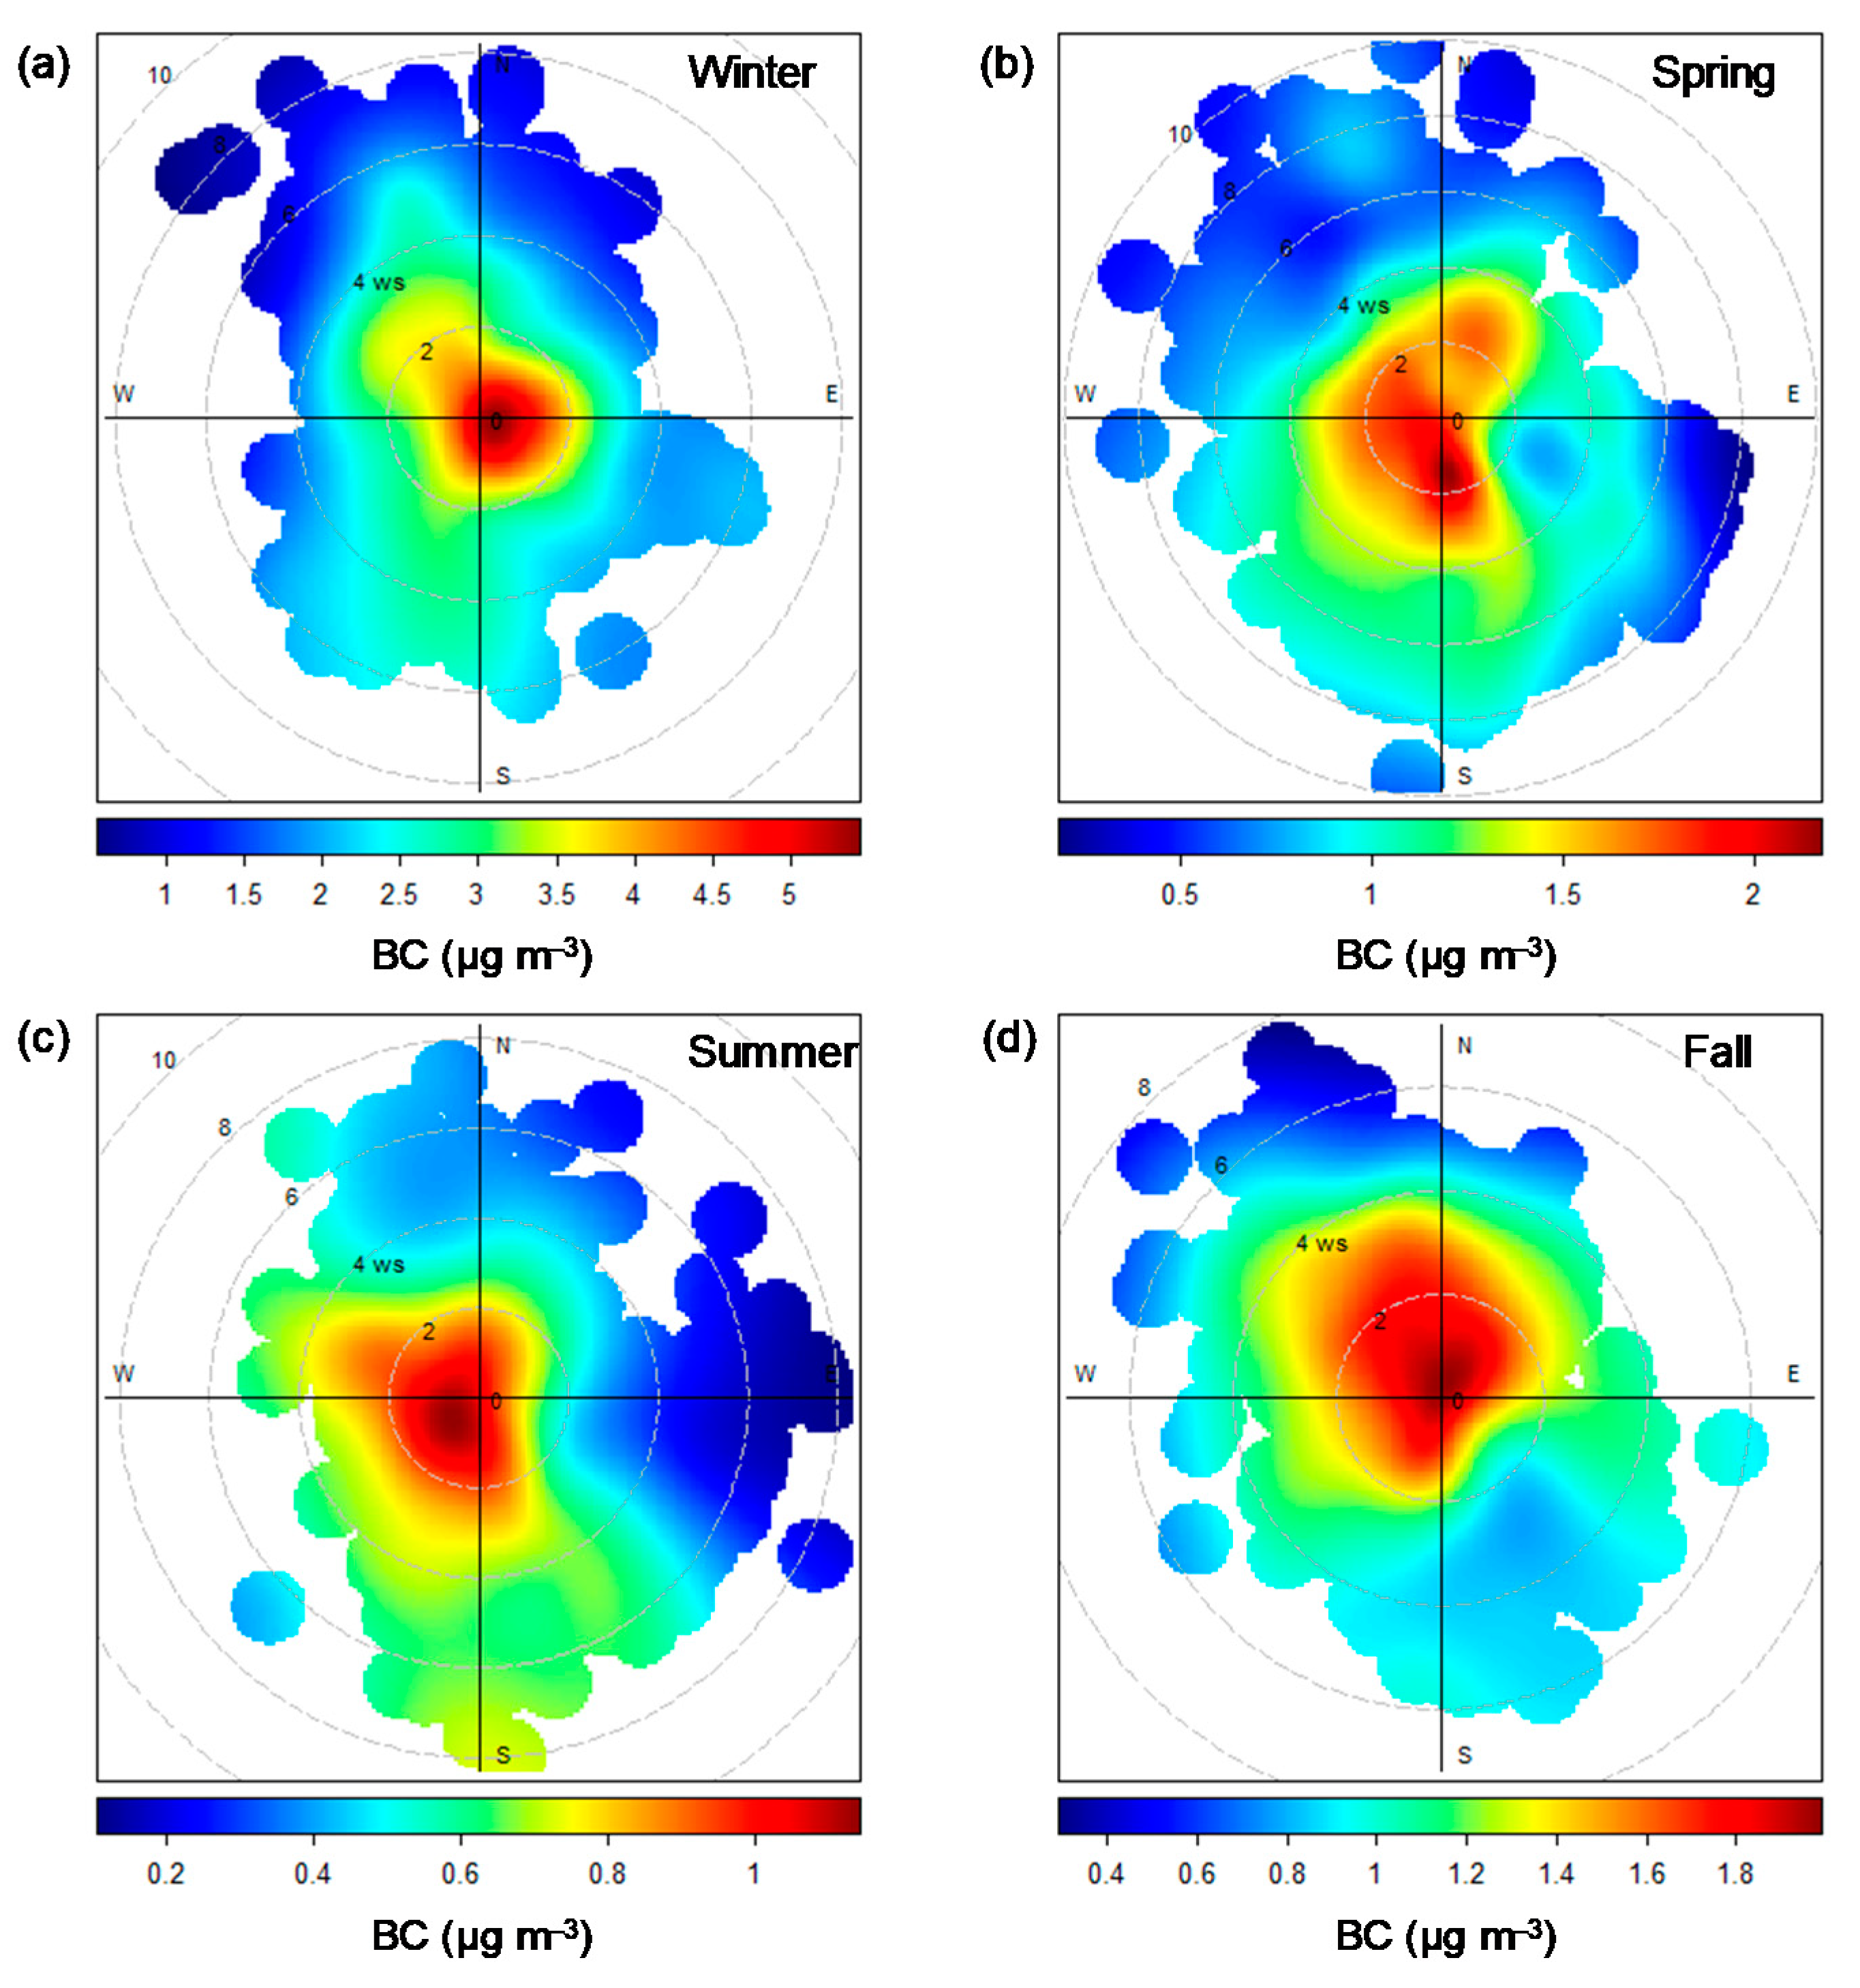
3.3. Source Analysis of BC

Bivariate polar plots obtained from wind analysis present the combined effect of wind speed and direction on air pollutants at a receptor site, which could provide an effective way to assess the possible geographic origins of these pollutants [72]. As shown in Figure 8, the high BC concentrations are observed associated with low wind speeds (mostly less than 2 m s−1) in all seasons, yet with different wind direction sectors in different seasons. For example, there was no evident wind direction dependence in winter, while the high BC concentrations were linked to winds from the south in spring, southwest in summer, and north in fall, respectively. Those results suggest that local-scale emissions could be a major contributor to ambient BC concentrations under the relatively stable atmospheric conditions (e.g., WS < 2 m s−1) observed at the sampling site. At high wind speed conditions (>6 m s−1), relatively high BC concentration was observed in the south in spring and summer. The mean wind speed in fall was much lower than the rest of the season, and higher BC concentrations were observed in the north when the wind speed was >4 m s−1. High north-northwest wind speeds (>6 m s−1) in winter were accompanied by higher mean mass loading of BC (>2 μg m−3) than the rest of the season. The above results suggest that regional transport is an important source of BC throughout the observation period. It was worth mentioning that in the south of all four seasons, higher mass loading of BC was observed at wind speeds > 4 m s−1, especially in spring and summer (WS > 6 m s−1). However, one kilometer south of the observation site is close to the ocean, which means that ship emissions were also an important source of BC. This result is consistent with the fact that ship emissions were also an important contributor to the BC of Qingdao in previous studies [73,74].
Figure 9 shows the seasonal distribution patterns of the CWT BC concentrations observed at this receptor site of rural Qingdao. These results were obtained from the CWT analysis to identify possible geographic origins. It should be noted that the observed BC data points were filtered out to minimize the possible influence of some trajectories linking to low wind speed (e.g., WS < 2 m s−1). As shown in Figure 9a,b, the high CWT BC concentrations were clearly distributed in central and western Shandong provinces, southeast of Hebei provinces, western Bohai Sea (Tianjin port) during winter and fall. Those high potential source areas to Qingdao could be mainly caused by residential and industrial solid fuel (e.g., coal) combustion [32,33]. Interestingly, high CWT-BC concentration from the region of western Bohai Sea could be partly explained by considerable contribution by the ship emissions sector [73]. This is consistent with wind analysis for BC during the two seasons of winter and fall, which showed relatively high concentrations at high wind speed originated from northwestern sectors (Figure 8). Overall, these results may highlight some potential contributions of regional transport for those BC-rich emission regions to Qingdao. As shown in Figure 9b, the high CWT-BC concentrations in spring were mainly associated with two distinct regions, i.e., south-southwest (over northwestern Jiangsu and central-eastern Anhui Provinces) and south (over the Shanghai region). In summer (see Figure 9c), the high potential source region was observed linked to northeastern Jiangsu. These results could imply that the long-range transport from the Yangtze River Delta region could make an important contribution to BC in rural Qingdao in spring and summer.

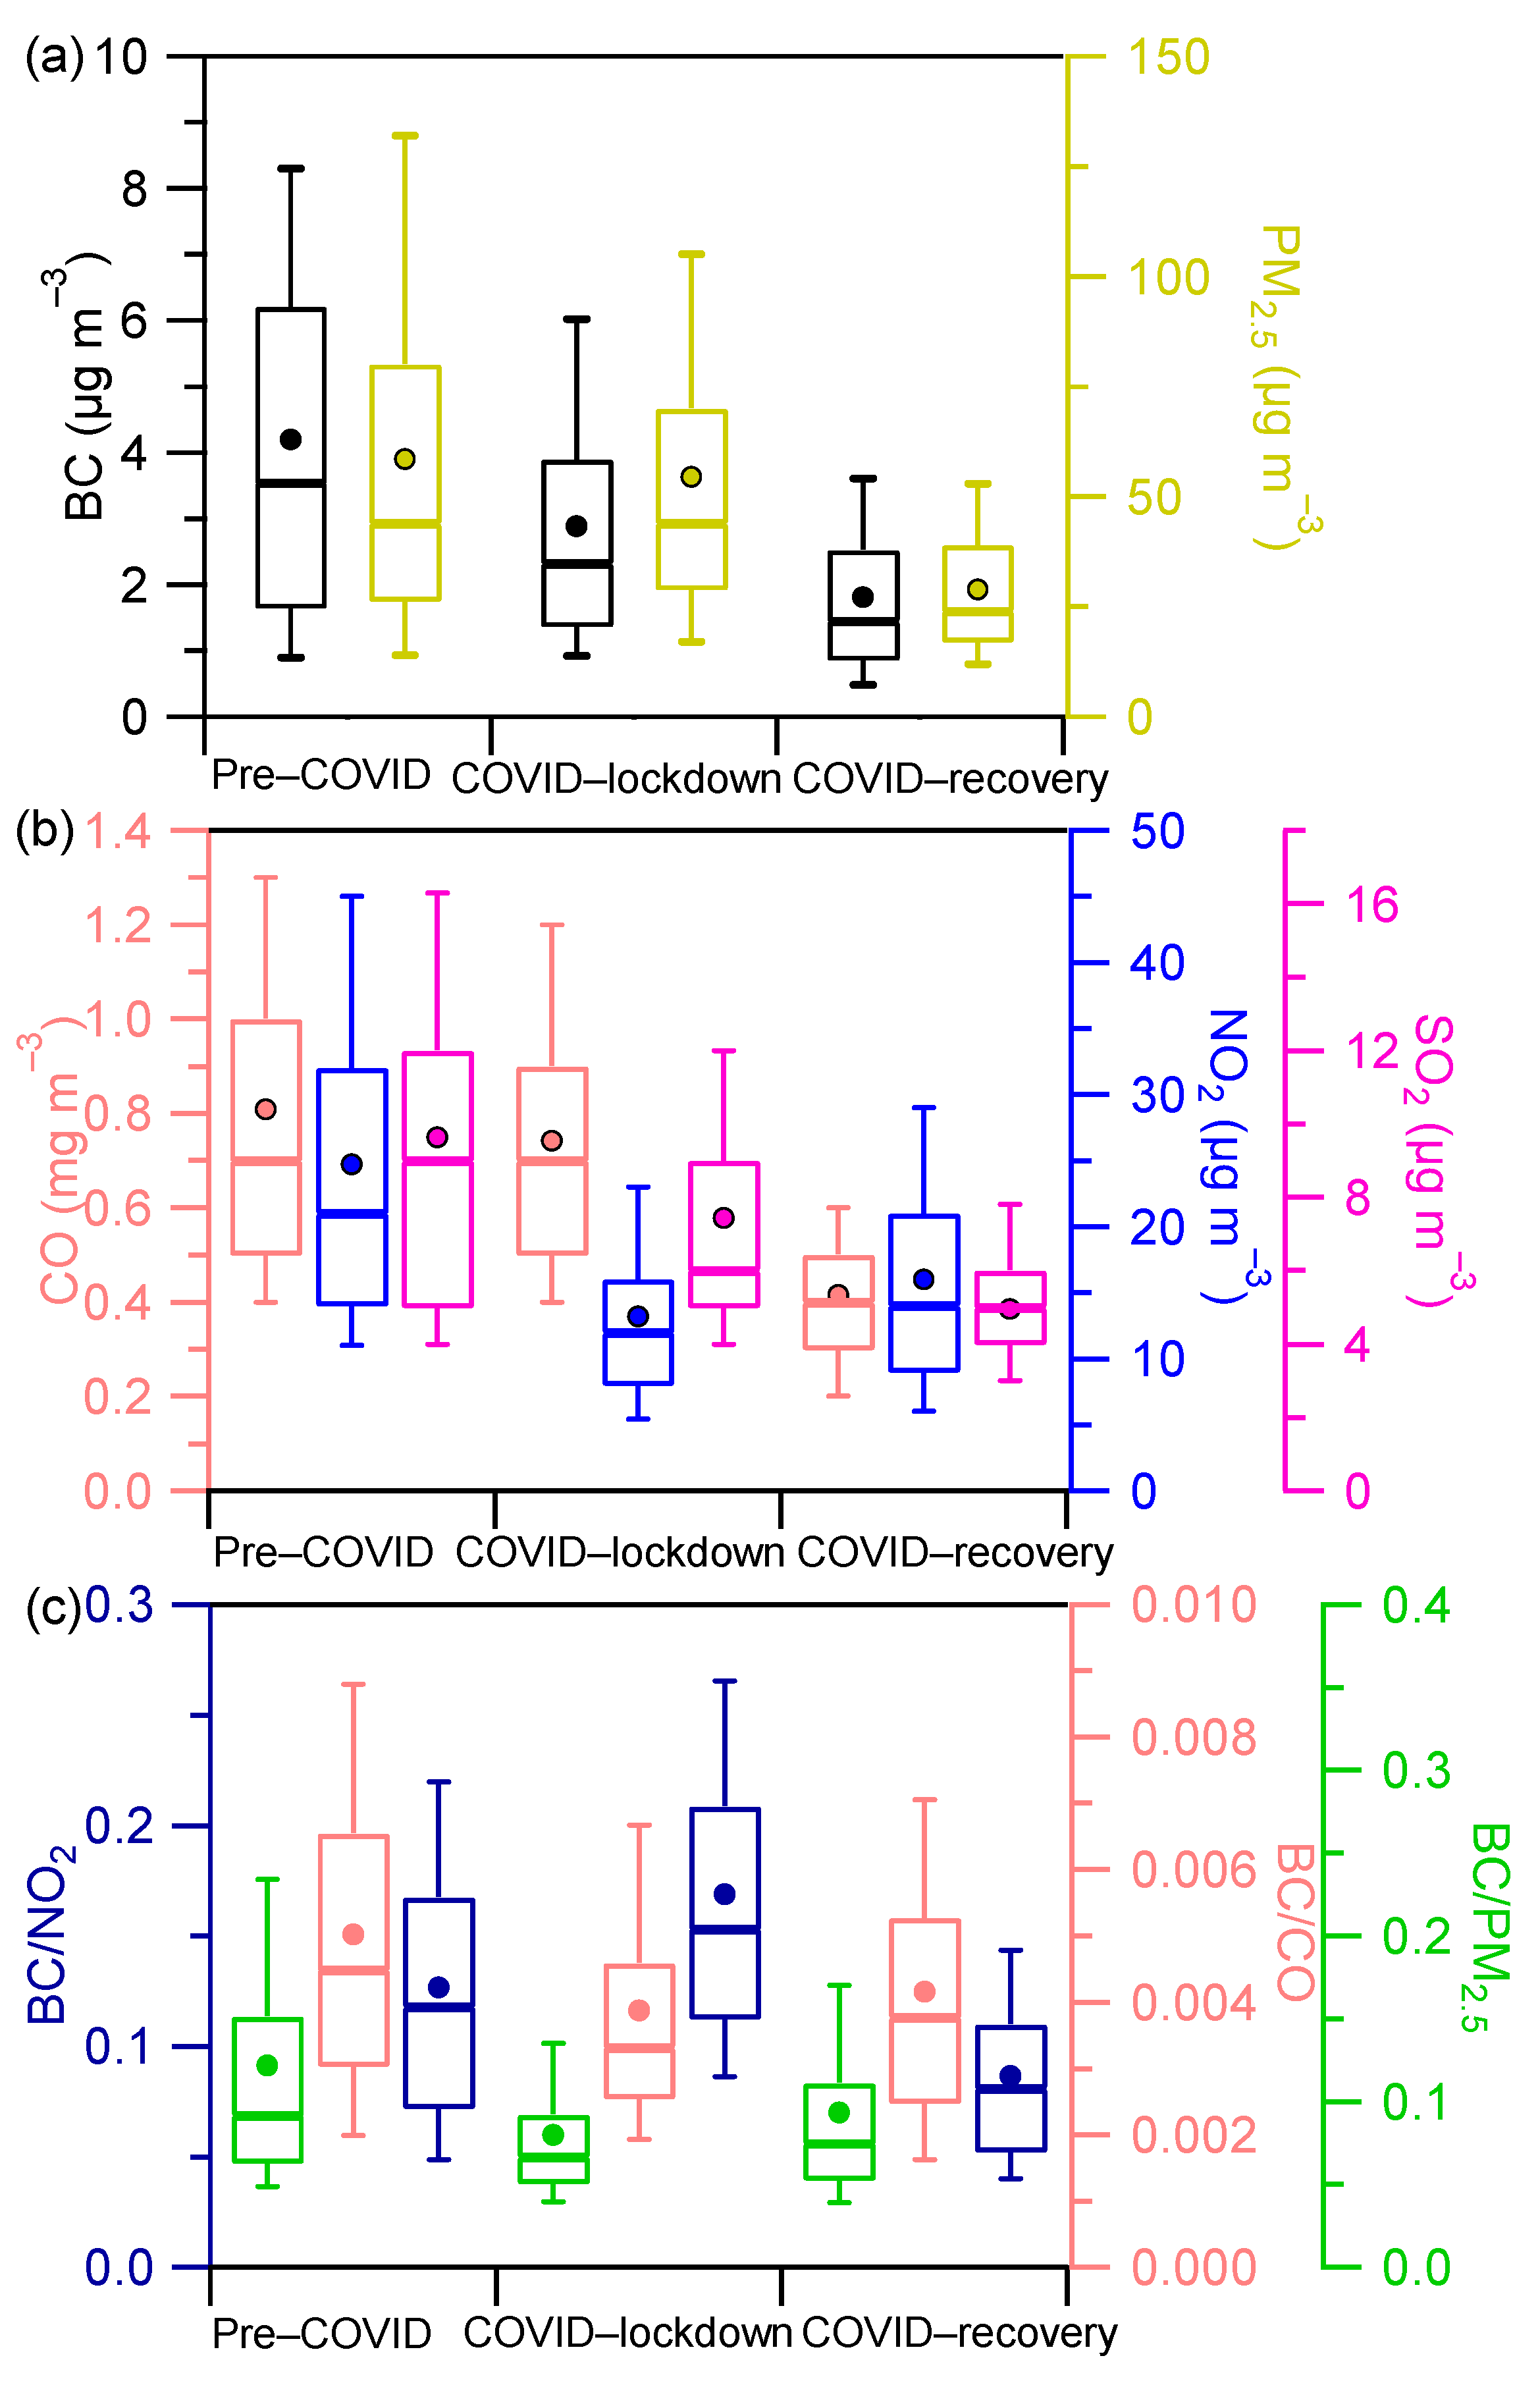
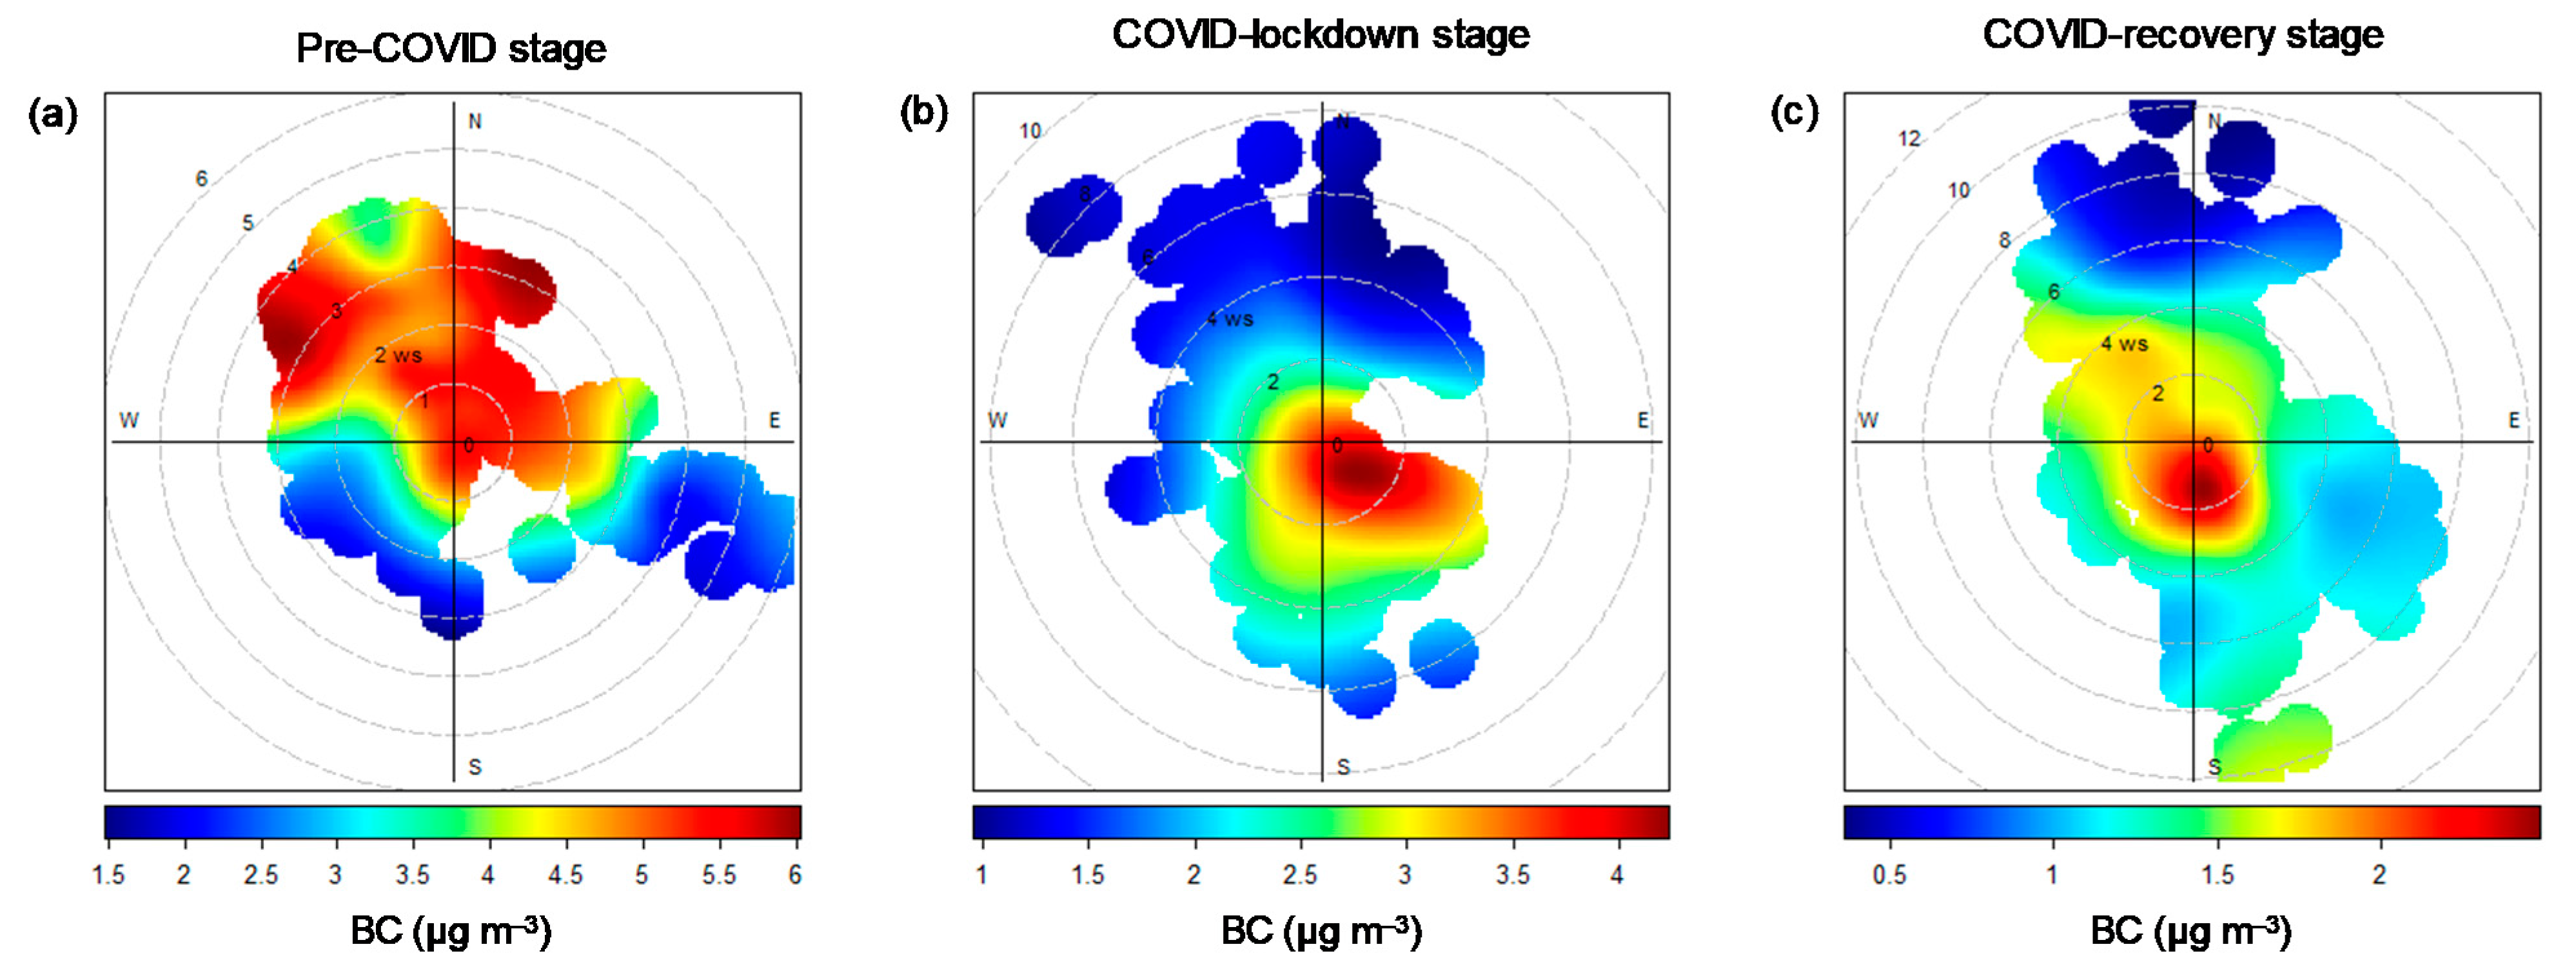
3.4. A Case Study of BC during the COVID-19 Pandemic

According to the timeline of the COVID-19 lockdown and prevention regulations for epidemic control issued by the Chinese government, three stages were divided in this study to investigate the response of ambient BC to such a unique emission reduction scenario. A detailed description of the division rules for the three stages is shown in Table 1.
Figure 10a shows the average concentrations of BC (PM2.5) in pre-COVID, COVID-lockdown, and COVID-recovery stages, which were 4.21 (58.5) μg m−3 and 2.88 (54.5) μg m−3, and 1.81 (28.9) μg m−3, respectively. BC was reduced by 31.6% from the pre-COVID phase to the COVID-lockdown phase. This is comparable to the decrease rate (38%) due to the COVID lockdown observed in rural Hangzhou, while there is a greater gap by comparing to some urban areas, e.g., Hangzhou city of China (44%) [40], Suzhou city of China (53%) [75], Somerville city of the United States of America (22–46%) [76], and Delhi city of India (59–78%) [39]. This could suggest that BC was effectively reduced by relevant control measures in rural Qingdao, yet with a lower decrease rate compared to urban regions. Compared to BC, the mass concentration of PM2.5 presented a much lower variation that decreased by only 6.8% from the pre-COVID stage to the COVID-lockdown stage, which is consistent with recent studies in urban environments [77,78,79]. This may suggest that rapid emission reduction in the transportation sector may not be efficient for control the ambient PM2.5 burden in rural areas. As shown in Figure 10b, changes in gaseous pollutants, including CO, SO2, and NO2, were also observed between pre-COVID and COVID-lockdown periods. NO2 presented the largest reduction rate (46.6%) among these gases, which could be explained by a rapid reduction in traffic emissions. However, the reduction rate (8.6%) of CO was approximately 5 times lower than NO2, suggesting a significant contribution of the nontraffic source to ambient CO in rural Qingdao. The reduction rate of SO2, mainly generated from coal combustion from industrial and power sectors in China [80], was 22.7%, reflecting a considerable influence of the COVID-lockdown on these sectors. Interestingly, BC was correlated well (R = 0.65−0.70) with these gaseous pollutants (CO, NO2, and SO2), supporting the possible contribution of the sources for these gaseous pollutants on BC in rural Qingdao. As shown in Figure 10c, an enhanced BC/NO2 ratio is clearly observed during the COVID-lockdown period. However, the BC/CO and BC/PM2.5 ratios present opposite patterns compared to the BC/NO2 ratio. These results could indicate that reduction in traffic emission could not be an effective measure to reduce ambient BC in rural Qingdao. Furthermore, nontraffic sources, like residential solid-fuel burning, could be a significant source sector for BC at the area of the sampling site. In fact, our findings are consistent with some previous studies based on the BC emission inventories, highlighting that the most important source sector of BC was associated with the residential sector in China [32,80].
Figure 11 shows the very different pole diagrams of BC in the three stages. During the pre-COVID stage, the high BC concentrations were distributed over the northwest and northern sectors. In addition, high concentrations (>5 μg m−3) of BC were also observed at low wind speeds (<2 m s−1). This may suggest that more intense BC emissions could be from larger scales during the pre-COVID period. The wind dependence of BC showed a large difference between the pre-COVID and COVID-lockdown. The high concentrations of BC were mainly associated with low wind speed during the COVID-lockdown, suggesting a major contribution of local sources to ambient BC. Such wind-dependent variation of BC during the COVID-lockdown was also different from the COVID-recovery stage that was characterized by the high BC concentrations linked to local and northwest winds. The distinct change in wind dependence of BC during these three stages could imply a significant influence of the COVID-lockdown on the potential geographic origins of BC.

4. Conclusions

In this work, we conducted one-year real-time monitoring of BC in rural Qingdao using the MAAP from December 2019 to November 2020. The highest concentration of BC in winter, followed by fall, spring, and summer, respectively. Together, BC showed a distinct monthly trend characterized by higher concentrations during cold months but lower concentrations during warm months, indicative of a significant seasonality. The mass fraction of BC in PM2.5 gradually decreased with increasing concentration of PM2.5 in all seasons, suggesting that enhanced formation of secondary aerosol particles might be a key source factor to promote air pollution induced by PM2.5 in rural environments in Qingdao. The BC concentrations and BC/NO2 ratios on the weekend (4.60 ± 2.86 μg m−3 and 0.20 ± 0.12) were evidently higher than those on weekdays (3.22 ± 2.45 μg m−3 and 0.16 ± 0.09), respectively during cold seasons, while there was no clear difference for both of them between weekend (0.81 ± 0.58 μg m−3 and 0.10 ± 0.05) and weekdays (0.83 ± 0.56 μg m−3 and 0.10 ± 0.06) in summer, indicating the weekend effect that might be attributed to increased biomass burning emissions during the weekend. Analysis of the influence of surface horizontal WS and BLH on ambient BC concentrations suggest that the vertical dilution effect would have seasonal dependence with the highest efficiency during winter under high BLH conditions (i.e., BLH > 900 m). Together, we observed obvious evidence of an important role of below-cloud wet removal in influencing ambient BC, which would be one of the major reasons to explain the low BC concentration levels during summer with highly frequent rainfall events in such a coastal region of Qingdao. Through the bivariate polar plots, the high concentrations in the Qingdao area mainly occurred under relatively stable atmospheric conditions (e.g., WS < 2 m s−1) and were highly associated with prevailing wind directions. According to the concentration weighted trajectory analysis, regional transport could have considerable influence on BC pollution in this rural area of Qingdao, for instance, when air masses were linked to the regions with high ship emissions in the Yellow Sea and the Bohai Sea. Based on the comprehensive analysis of the unique COVID−19 case, it was found that nontraffic sources (e.g., coal combustion) from the residential sector could be a major source of BC in winter in rural Qingdao. Thus, it could be very interesting to further investigate the quantitative contribution of such nontraffic sources to BC in future work.

Supplementary Materials

The following are available online at https://www.mdpi.com/2073-4433/12/3/394/s1, Figure S1: Sampling site location and its surroundings; Figure S2: The distribution of BC concentrations in the whole year (a) (the green bar is the number of BC concentrations within an interval of 0.05 μg m−3, the black line is the fitted curve following a lognormal function), and four seasons (b); Figure S3: Scatter plot of BC vs. PM2.5, the red line in the graph is the fitted line and the scatter color represents the date; Figure S4. Diurnal pattern of BC (a), CO (b), NO2 (c), and SO2 (d) in four seasons over the whole campaign period; Figure S5: Diurnal patterns of average PM2.5 concentration (a), wind speed (WS) (b), boundary layer height (BLH) (c), relative humidity (RH) (d), visibility (e), and temperature (T) (f) in four seasons;; Figure S6: Diurnal patterns of average BC concentrations during weekdays and weekends in four seasons; Figure S7: Diurnal patterns of average C2H4O2 concentrations during weekdays and weekends. The tracer C2H4O2 for biomass combustion is derived from organic fragments measured by Aerodyne soot particle aerosol mass spectrometer (SPAMS), which is installed at the same location as MAAP from 25 November 2019 to 7 January 2020. Table S1: Results of some long-term measurements of BC concentrations (μg m−3) in East Asia

Author Contributions

Conceptualization, S.C., Y.Z., X.G.; data curation, S.C., L.Z., J.X., F.S., B.D.; formal analysis, S.C., L.Z., J.X., B.D.; investigation, S.C.; methodology, S.C., L.Z., Y.Z.; project administration, X.G.; supervision, X.G.; writing—original draft, S.C.; writing—review and editing, Y.Z. All authors have read and agreed to the published version of the manuscript.

Funding

This research was funded by the National Natural Science Foundation of China (NSFC), grant number 21777073.

Data Availability Statement

The data used in this study can be made available upon request (yjzhang@nuist.edu.cn).

Conflicts of Interest

The authors declare no conflict of interest.

References

  1. Chow, J.C.; Watson, J.G.; Lowenthal, D.H.; Chen, L.-W.A.; Motallebi, N. PM2.5 source profiles for black and organic carbon emission inventories. Atmos. Environ. 2011, 45, 5407–5414. [Google Scholar] [CrossRef]
  2. Bond, T.C.; Doherty, S.J.; Fahey, D.W.; Forster, P.M.; Berntsen, T.; DeAngelo, B.J.; Flanner, M.G.; Ghan, S.; Kaercher, B.; Koch, D.; et al. Bounding the role of black carbon in the climate system: A scientific assessment. J. Geophys. Res. Atmos. 2013, 118, 5380–5552. [Google Scholar] [CrossRef]
  3. Petzold, A.; Ogren, J.A.; Fiebig, M.; Laj, P.; Li, S.-M.; Baltensperger, U.; Holzer-Popp, T.; Kinne, S.; Pappalardo, G.; Sugimoto, N.; et al. Recommendations for reporting “black carbon” measurements. Atmos. Chem. Phys. 2013, 13, 8365–8379. [Google Scholar] [CrossRef] [Green Version]
  4. Henning, S.; Wex, H.; Hennig, T.; Kiselev, A.; Snider, J.R.; Rose, D.; Dusek, U.; Frank, G.P.; Pöschl, U.; Kristensson, A.; et al. Soluble mass, hygroscopic growth, and droplet activation of coated soot particles during LACIS Experiment in November (LExNo). J. Geophys. Res. Atmos. 2010, 115. [Google Scholar] [CrossRef] [Green Version]
  5. Jacobi, H.-W.; Lim, S.; Ménégoz, M.; Ginot, P.; Laj, P.; Bonasoni, P.; Stocchi, P.; Marinoni, A.; Arnaud, Y. Black carbon in snow in the upper Himalayan Khumbu Valley, Nepal: Observations and modeling of the impact on snow albedo, melting, and radiative forcing. Cryosphere 2015, 9, 1685–1699. [Google Scholar] [CrossRef] [Green Version]
  6. Ramanathan, V.; Carmichael, G. Global and regional climate changes due to black carbon. Nat. Geosci. 2008, 1, 221–227. [Google Scholar] [CrossRef]
  7. Miao, Y.; Li, J.; Miao, S.; Che, H.; Wang, Y.; Zhang, X.; Zhu, R.; Liu, S. Interaction between planetary boundary layer and PM2.5 pollution in megacities in China: A review. Curr. Pollut. Rep. 2019, 5, 261–271. [Google Scholar] [CrossRef] [Green Version]
  8. Ding, A.J.; Fu, C.B.; Yang, X.Q.; Sun, J.N.; Petäjä, T.; Kerminen, V.-M.; Wang, T.; Xie, Y.; Herrmann, E.; Zheng, L.F.; et al. Intense atmospheric pollution modifies weather: A case of mixed biomass burning with fossil fuel combustion pollution in eastern China. Atmos. Chem. Phys. 2013, 13, 10545–10554. [Google Scholar] [CrossRef] [Green Version]
  9. Ding, A.J.; Huang, X.; Nie, W.; Sun, J.N.; Kerminen, V.; Petäjä, T.; Su, H.; Cheng, Y.F.; Yang, X.; Wang, M.H.; et al. Enhanced haze pollution by black carbon in megacities in China. Geophys. Res. Lett. 2016, 43, 2873–2879. [Google Scholar] [CrossRef]
  10. Huang, X.; Ding, A.; Wang, Z.; Ding, K.; Gao, J.; Chai, F.; Fu, C. Amplified transboundary transport of haze by aerosol–boundary layer interaction in China. Nat. Geosci. 2020, 13, 428–434. [Google Scholar] [CrossRef]
  11. Yang, T.-T.; Hsu, C.-Y.; Chen, Y.-C.; Young, L.-H.; Huang, C.-H.; Ku, C.-H. Characteristics, sources, and health risks of atmospheric PM2.5-bound polycyclic aromatic hydrocarbons in Hsinchu, Taiwan. Aerosol Air Qual. Res. 2016, 17, 563–573. [Google Scholar] [CrossRef]
  12. Cui, S.; Lei, R.; Wu, Y.; Huang, D.; Shen, F.; Wang, J.; Qiao, L.; Zhou, M.; Zhu, S.; Ma, Y.; et al. Characteristics of black carbon particle-bound polycyclic aromatic hydrocarbons in two sites of Nanjing and Shanghai, China. Atmosphere 2020, 11, 202. [Google Scholar] [CrossRef] [Green Version]
  13. Garrido, A.; Jiménez-Guerrero, P.; Ratola, N. Levels, trends and health concerns of atmospheric PAHs in Europe. Atmos. Environ. 2014, 99, 474–484. [Google Scholar] [CrossRef]
  14. Niu, X.; Ho, S.S.H.; Ho, K.F.; Huang, Y.; Sun, J.; Wang, Q.; Zhou, Y.; Zhao, Z.; Cao, J. Atmospheric levels and cytotoxicity of polycyclic aromatic hydrocarbons and oxygenated-PAHs in PM2.5 in the Beijing-Tianjin-Hebei region. Environ. Pollut. 2017, 231, 1075–1084. [Google Scholar] [CrossRef] [PubMed]
  15. Janssen, N.A.; Hoek, G.; Simic-Lawson, M.; Fischer, P.; Van Bree, L.; ten Brink, H.; Keuken, M.; Atkinson, R.W.; Anderson, H.R.; Brunekreef, B.; et al. Black carbon as an additional indicator of the adverse health effects of airborne particles compared with PM10and PM2. Environ. Health Perspect. 2011, 119, 1691–1699. [Google Scholar] [CrossRef] [Green Version]
  16. Cao, J.; Xu, H.; Xu, Q.; Chen, B.; Kan, H. Fine particulate matter constituents and cardiopulmonary mortality in a heavily polluted Chinese city. Environ. Health Perspect. 2012, 120, 373–378. [Google Scholar] [CrossRef] [Green Version]
  17. Liu, X.; Kong, S.; Yan, Q.; Liu, H.; Wang, W.; Chen, K.; Yin, Y.; Zheng, H.; Wu, J.; Qin, S.; et al. Size-segregated carbonaceous aerosols emission from typical vehicles and potential depositions in the human respiratory system. Environ. Pollut. 2020, 264, 114705. [Google Scholar] [CrossRef]
  18. Meena, G.S.; Mukherjee, S.; Buchunde, P.; Safai, P.D.; Singla, V.; Aslam, M.Y.; Sonbawne, S.M.; Made, R.; Anand, V.; Dani, K.K.; et al. Seasonal variability and source apportionment of black carbon over a rural high-altitude and an urban site in western India. Atmos. Pollut. Res. 2021, 12, 32–45. [Google Scholar] [CrossRef]
  19. Wei, C.; Wang, M.H.; Fu, Q.Y.; Dai, C.; Huang, R.; Bao, Q. Temporal characteristics and potential sources of black carbon in megacity Shanghai, China. J. Geophys. Res. Atmos. 2020, 125, 125. [Google Scholar] [CrossRef]
  20. Duc, H.N.; Shingles, K.; White, S.; Salter, D.; Chang, L.T.-C.; Gunashanhar, G.; Riley, M.; Trieu, T.; Dutt, U.; Azzi, M.; et al. Spatial-temporal pattern of black carbon (BC) emission from biomass burning and anthropogenic sources in New South Wales and the greater metropolitan region of Sydney, Australia. Atmosphere 2020, 11, 570. [Google Scholar] [CrossRef]
  21. Zotter, P.; Herich, H.; Gysel, M.; El-Haddad, I.; Zhang, Y.; Močnik, G.; Hüglin, C.; Baltensperger, U.; Szidat, S.; Prévôt, A.S.H. Evaluation of the absorption Ångström exponents for traffic and wood burning in the Aethalometer-based source apportionment using radiocarbon measurements of ambient aerosol. Atmos. Chem. Phys. 2017, 17, 4229–4249. [Google Scholar] [CrossRef] [Green Version]
  22. Rehman, I.H.; Ahmed, T.; Praveen, P.S.; Kar, A.; Ramanathan, V. Black carbon emissions from biomass and fossil fuels in rural India. Atmos. Chem. Phys. 2011, 11, 7289–7299. [Google Scholar] [CrossRef] [Green Version]
  23. Sahu, L.K.; Kondo, Y.; Miyazaki, Y.; Kuwata, M.; Koike, M.; Takegawa, N.; Tanimoto, H.; Matsueda, H.; Yoon, S.C.; Kim, Y.J. Anthropogenic aerosols observed in Asian continental outflow at Jeju Island, Korea, in spring 2005. J. Geophys. Res. Space Atmos. 2009, 114. [Google Scholar] [CrossRef]
  24. Kanaya, Y.; Pan, X.; Miyakawa, T.; Komazaki, Y.; Taketani, F.; Uno, I.; Kondo, Y. Long-term observations of black carbon mass concentrations at Fukue Island, western Japan, during 2009–2015: Constraining wet removal rates and emission strengths from East Asia. Atmos. Chem. Phys. 2016, 16, 10689–10705. [Google Scholar] [CrossRef] [Green Version]
  25. Pani, S.K.; Ou-Yang, C.-F.; Wang, S.-H.; Ogren, J.A.; Sheridan, P.J.; Sheu, G.-R.; Lin, N.-H. Relationship between long-range transported atmospheric black carbon and carbon monoxide at a high-altitude background station in East Asia. Atmos. Environ. 2019, 210, 86–99. [Google Scholar] [CrossRef]
  26. Liu, B.; Ma, Y.; Gong, W.; Zhang, M.; Shi, Y. The relationship between black carbon and atmospheric boundary layer height. Atmos. Pollut. Res. 2019, 10, 65–72. [Google Scholar] [CrossRef]
  27. Dumka, U.; Kaskaoutis, D.; Devara, P.; Kumar, R.; Kumar, S.; Tiwari, S.; Gerasopoulos, E.; Mihalopoulos, N. Year-long variability of the fossil fuel and wood burning black carbon components at a rural site in southern Delhi outskirts. Atmos. Res. 2019, 216, 11–25. [Google Scholar] [CrossRef]
  28. Wei, C.; Wang, M.; Fu, Q.; Dai, C.; Huang, R.; Bao, Q. Temporal characteristics of greenhouse gases (CO2 and CH4) in the megacity Shanghai, China: Association with air pollutants and meteorological conditions. Atmos. Res. 2020, 235, 104759. [Google Scholar] [CrossRef]
  29. Liu, Y.; Yan, C.; Zheng, M. Source apportionment of black carbon during winter in Beijing. Sci. Total. Environ. 2018, 618, 531–541. [Google Scholar] [CrossRef]
  30. Wang, Q.; Zhao, Z.; Tian, J.; Zhu, C.; Ni, H.; Zhang, Y.; Zhang, N.; Shen, Z.; Han, Y.; Cao, J. Seasonal transport and dry deposition of black carbon aerosol in the Southeastern Tibetan Plateau. Aerosol Sci. Eng. 2017, 1, 160–168. [Google Scholar] [CrossRef]
  31. Liu, D.; Ding, S.; Zhao, D.; Hu, K.; Yu, C.; Hu, D.; Wu, Y.; Zhou, C.; Tian, P.; Liu, Q.; et al. Black carbon emission and wet scavenging from surface to the top of boundary layer over Beijing region. J. Geophys. Res. Atmos. 2020, 125. [Google Scholar] [CrossRef]
  32. Qin, Y.; Xie, S.D. Spatial and temporal variation of anthropogenic black carbon emissions in China for the period 1980–2009. Atmos. Chem. Phys. 2012, 12, 4825–4841. [Google Scholar] [CrossRef] [Green Version]
  33. Wang, R.; Tao, S.; Wang, W.; Liu, J.; Shen, H.; Shen, G.; Wang, B.; Liu, X.; Li, W.; Huang, Y.; et al. Black carbon emissions in China from 1949 to 2050. Environ. Sci. Technol. 2012, 46, 7595–7603. [Google Scholar] [CrossRef] [PubMed]
  34. Ji, D.; Li, L.; Pang, B.; Xue, P.; Wang, L.; Wu, Y.; Zhang, H.; Wang, Y. Characterization of black carbon in an urban-rural fringe area of Beijing. Environ. Pollut. 2017, 223, 524–534. [Google Scholar] [CrossRef]
  35. Zhang, W.; Lu, Z.; Xu, Y.; Wang, C.; Gu, Y.; Xu, H.; Streets, D.G. Black carbon emissions from biomass and coal in rural China. Atmos. Environ. 2018, 176, 158–170. [Google Scholar] [CrossRef]
  36. Zhou, B.; Wang, Q.; Zhou, Q.; Zhang, Z.; Wang, G.; Fang, N.; Li, M.; Cao, J. Seasonal characteristics of black carbon aerosol and its potential source regions in Baoji, China. Aerosol Air Qual. Res. 2018, 18, 397–406. [Google Scholar] [CrossRef]
  37. Okuda, T.; Matsuura, S.; Yamaguchi, D.; Umemura, T.; Hanada, E.; Orihara, H.; Tanaka, S.; He, K.; Ma, Y.; Cheng, Y.; et al. The impact of the pollution control measures for the 2008 Beijing Olympic Games on the chemical composition of aerosols. Atmos. Environ. 2011, 45, 2789–2794. [Google Scholar] [CrossRef]
  38. Zhang, Y.; Li, X.; Li, M.; Zheng, Y.; Geng, G.; Hong, C.; Li, H.; Tong, D.; Zhang, X.; Cheng, Y.; et al. Reduction in black carbon light absorption due to multi-pollutant emission control during APEC China 2014. Atmos. Chem. Phys. 2018, 18, 10275–10287. [Google Scholar] [CrossRef] [Green Version]
  39. Goel, V.; Hazarika, N.; Kumar, M.; Singh, V.; Thamban, N.M.; Tripathi, S.N. Variations in Black Carbon concentration and sources during COVID-19 lockdown in Delhi. Chemosphere 2021, 270, 129435. [Google Scholar] [CrossRef]
  40. Xu, L.; Zhang, J.; Sun, X.; Xu, S.; Shan, M.; Yuan, Q.; Liu, L.; Du, Z.; Liu, D.; Xu, D.; et al. Variation in concentration and sources of black carbon in a megacity of China during the COVID-19 pandemic. Geophys. Res. Lett. 2020, 47, e2020GL090444. [Google Scholar] [CrossRef] [PubMed]
  41. Li, L.; Yan, D.; Xu, S.; Huang, M.; Wang, X.; Xie, S. Characteristics and source distribution of air pollution in winter in Qingdao, eastern China. Environ. Pollut. 2017, 224, 44–53. [Google Scholar] [CrossRef]
  42. Zhao, X.; Gao, Q.; Sun, M.; Xue, Y.; Ma, R.; Xiao, X.; Ai, B. statistical analysis of spatiotemporal heterogeneity of the distribution of air quality and dominant air pollutants and the effect factors in Qingdao urban zones. Atmosphere 2018, 9, 135. [Google Scholar] [CrossRef] [Green Version]
  43. Bie, S.; Yang, L.; Zhang, Y.; Huang, Q.; Li, J.; Zhao, T.; Zhang, X.; Wang, P.; Wang, W. Source appointment of PM2.5 in Qingdao Port, East of China. Sci. Total Environ. 2021, 755, 142456. [Google Scholar] [CrossRef] [PubMed]
  44. Krotkov, N.A.; McLinden, C.A.; Li, C.; Lamsal, L.N.; Celarier, E.A.; Marchenko, S.V.; Swartz, W.H.; Bucsela, E.J.; Joiner, J.; Duncan, B.N.; et al. Aura OMI observations of regional SO2 and NO2 pollution changes from 2005 to 2015. Atmos. Chem. Phys. 2016, 16, 4605–4629. [Google Scholar] [CrossRef] [Green Version]
  45. Bastien, L.A.J.; McDonald, B.C.; Brown, N.J.; Harley, R.A. High-resolution mapping of sources contributing to urban air pollution using adjoint sensitivity analysis: Benzene and diesel black carbon. Environ. Sci. Technol. 2015, 49, 7276–7284. [Google Scholar] [CrossRef] [PubMed]
  46. Sun, L.; Wei, J.; Duan, D.; Guo, Y.; Yang, D.; Jia, C.; Mi, X. Impact of land-use and land-cover change on urban air quality in representative cities of China. J. Atmos. Sol. Terr. Phys. 2016, 142, 43–54. [Google Scholar] [CrossRef]
  47. Ran, L.; Deng, Z.; Wang, P.; Xia, X. Black carbon and wavelength-dependent aerosol absorption in the North China Plain based on two-year aethalometer measurements. Atmos. Environ. 2016, 142, 132–144. [Google Scholar] [CrossRef]
  48. Zhang, Q.; Shen, Z.; Zhang, T.; Kong, S.; Lei, Y.; Wang, Q.; Tao, J.; Zhang, R.; Wei, P.; Wei, C.; et al. Spatial distribution and sources of winter black carbon and brown carbon in six Chinese megacities. Sci. Total Environ. 2021, 762, 143075. [Google Scholar] [CrossRef]
  49. Petzold, A.; Schönlinner, M. Multi-angle absorption photometry—A new method for the measurement of aerosol light absorption and atmospheric black carbon. J. Aerosol Sci. 2004, 35, 421–441. [Google Scholar] [CrossRef]
  50. Slowik, J.G.; Cross, E.S.; Han, J.-H.; Davidovits, P.; Onasch, T.B.; Jayne, J.T.; Williams, L.R.; Canagaratna, M.R.; Worsnop, D.R.; Chakrabarty, R.K.; et al. An inter-comparison of instruments measuring black carbon content of soot particles. Aerosol Sci. Technol. 2007, 41, 295–314. [Google Scholar] [CrossRef] [Green Version]
  51. Cha, Y.; Lee, S.; Lee, J. Measurement of black carbon concentration and comparison with PM10 and PM2.5 concentrations monitored in Chungcheong province, Korea. Aerosol Air Qual. Res. 2019, 19, 541–547. [Google Scholar] [CrossRef]
  52. Zhang, Y.; Favez, O.; Petit, J.-E.; Canonaco, F.; Truong, F.; Bonnaire, N.; Crenn, V.; Amodeo, T.; Prévôt, A.S.H.; Sciare, J.; et al. Six-year source apportionment of submicron organic aerosols from near-continuous highly time-resolved measurements at SIRTA (Paris area, France). Atmos. Chem. Phys. 2019, 19, 14755–14776. [Google Scholar] [CrossRef] [Green Version]
  53. Jain, S.; Sharma, S.K.; Choudhary, N.; Masiwal, R.; Saxena, M.; Sharma, A.; Mandal, T.K.; Gupta, A.; Gupta, N.C.; Sharma, C. Chemical characteristics and source apportionment of PM2.5 using PCA/APCS, UNMIX, and PMF at an urban site of Delhi, India. Environ. Sci. Pollut. Res. 2017, 24, 14637–14656. [Google Scholar] [CrossRef]
  54. Goel, V.; Mishra, S.K.; Pal, P.; Ahlawat, A.; Vijayan, N.; Jain, S.; Sharma, C. Influence of chemical aging on physico-chemical properties of mineral dust particles: A case study of 2016 dust storms over Delhi. Environ. Pollut. 2020, 267, 115338. [Google Scholar] [CrossRef]
  55. Zhang, L.; Shen, F.; Gao, J.; Cui, S.; Yue, H.; Wang, J.; Chen, M.; Ge, X. Characteristics and potential sources of black carbon particles in suburban Nanjing, China. Atmos. Pollut. Res. 2020, 11, 981–991. [Google Scholar] [CrossRef]
  56. Lee, J.; Yun, J.; Kim, K.J. Monitoring of black carbon concentration at an inland rural area including fixed sources in Korea. Chemosphere 2016, 143, 3–9. [Google Scholar] [CrossRef]
  57. Chen, X.; Zhang, Z.; Engling, G.; Zhang, R.; Tao, J.; Lin, M.; Sang, X.-F.; Chan, C.; Li, S.; Li, Y. Characterization of fine particulate black carbon in Guangzhou, a megacity of South China. Atmos. Pollut. Res. 2014, 5, 361–370. [Google Scholar] [CrossRef] [Green Version]
  58. Zhang, X.; Rao, R.; Huang, Y.; Mao, M.; Berg, M.J.; Sun, W. Black carbon aerosols in urban central China. J. Quant. Spectrosc. Radiat. Transf. 2015, 150, 3–11. [Google Scholar] [CrossRef]
  59. Chen, Y.; Schleicher, N.; Fricker, M.; Cen, K.; Liu, X.-L.; Kaminski, U.; Yu, Y.; Wu, X.-F.; Norra, S. Long-term variation of black carbon and PM2.5 in Beijing, China with respect to meteorological conditions and governmental measures. Environ. Pollut. 2016, 212, 269–278. [Google Scholar] [CrossRef]
  60. Sarkar, C.; Roy, A.; Chatterjee, A.; Ghosh, S.K.; Raha, S. Factors controlling the long-term (2009–2015) trend of PM2.5 and black carbon aerosols at eastern Himalaya, India. Sci. Total. Environ. 2019, 656, 280–296. [Google Scholar] [CrossRef]
  61. Deng, J.; Zhao, W.; Wu, L.; Hu, W.; Ren, L.; Wang, X.; Fu, P. Black carbon in Xiamen, China: Temporal variations, transport pathways and impacts of synoptic circulation. Chemosphere 2020, 241, 125133. [Google Scholar] [CrossRef] [PubMed]
  62. Xia, Y.; Wu, Y.; Huang, R.-J.; Xia, X.; Tang, J.; Wang, M.; Li, J.; Wang, C.; Zhou, C.; Zhang, R. Variation in black carbon concentration and aerosol optical properties in Beijing: Role of emission control and meteorological transport variability. Chemosphere 2020, 254, 126849. [Google Scholar] [CrossRef]
  63. Dumka, U.; Moorthy, K.K.; Kumar, R.; Hegde, P.; Sagar, R.; Pant, P.; Singh, N.; Babu, S.S. Characteristics of aerosol black carbon mass concentration over a high altitude location in the Central Himalayas from multi-year measurements. Atmos. Res. 2010, 96, 510–521. [Google Scholar] [CrossRef]
  64. Jia, H.; Huo, J.; Fu, Q.; Duan, Y.; Lin, Y.; Hu, X.; Fan, L.; Cheng, J. Atmospheric characteristics and population exposure assessment of black carbon at a regional representative site in the Yangtze River Delta region, China based on the five-year monitoring. Sci. Total. Environ. 2021, 777, 145990. [Google Scholar] [CrossRef]
  65. Yu, L.; Wang, G.; Zhang, R.; Zhang, L.; Song, Y.; Wu, B.; Li, X.; An, K.; Chu, J. Characterization and source apportionment of PM2.5 in an urban environment in Beijing. Aerosol Air Qual. Res. 2013, 13, 574–583. [Google Scholar] [CrossRef] [Green Version]
  66. Becerril-Valle, M.; Coz, E.; Prévôt, A.; Močnik, G.; Pandis, S.; Sanchez de la Campa, A.; Alastuey, A.; Díaz, E.; Pérez, R.; Artíñano, B. Characterization of atmospheric black carbon and co-pollutants in urban and rural areas of Spain. Atmos. Environ. 2017, 169, 36–53. [Google Scholar] [CrossRef]
  67. Zha, S.; Cheng, T.; Tao, J.; Zhang, R.; Chen, J.; Zhang, Y.; Leng, C.; Zhang, D.; Du, J. Characteristics and relevant remote sources of black carbon aerosol in Shanghai. Atmos. Res. 2014, 135–136, 159–171. [Google Scholar] [CrossRef]
  68. Garrett, T.J.; Brattström, S.; Sharma, S.; Worthy, D.E.J.; Novelli, P. The role of scavenging in the seasonal transport of black carbon and sulfate to the Arctic. Geophys. Res. Lett. 2011, 38. [Google Scholar] [CrossRef]
  69. Choi, Y.; Kanaya, Y.; Takigawa, M.; Zhu, C.; Park, S.-M.; Matsuki, A.; Sadanaga, Y.; Kim, S.-W.; Pan, X.; Pisso, I. Investigation of the wet removal rate of black carbon in East Asia: Validation of a below- and in-cloud wet removal scheme in FLEXible PARTicle (FLEXPART) model v10. Atmos. Chem. Phys. 2020, 20, 13655–13670. [Google Scholar] [CrossRef]
  70. Han, S.; Kondo, Y.; Oshima, N.; Takegawa, N.; Miyazaki, Y.; Hu, M.; Lin, P.; Deng, Z.; Zhao, Y.; Sugimoto, N.; et al. Temporal variations of elemental carbon in Beijing. J. Geophys. Res. Space Atmos. 2009, 114. [Google Scholar] [CrossRef] [Green Version]
  71. Pan, X.L.; Kanaya, Y.; Wang, Z.F.; Liu, Y.; Pochanart, P.; Akimoto, H.; Sun, Y.L.; Dong, H.B.; Li, J.; Irie, H.; et al. Correlation of black carbon aerosol and carbon monoxide in the high-altitude environment of Mt. Huang in Eastern China. Atmos. Chem. Phys. 2011, 11, 9735–9747. [Google Scholar] [CrossRef] [Green Version]
  72. Carslaw, D.C.; Beevers, S.D. Characterising and understanding emission sources using bivariate polar plots and k-means clustering. Environ. Model. Softw. 2013, 40, 325–329. [Google Scholar] [CrossRef]
  73. Chen, D.; Wang, X.; Nelson, P.; Li, Y.; Zhao, N.; Zhao, Y.; Lang, J.; Zhou, Y.; Guo, X. Ship emission inventory and its impact on the PM 2.5 air pollution in Qingdao Port, North China. Atmos. Environ. 2017, 166, 351–361. [Google Scholar] [CrossRef]
  74. Guo, Q.; Hu, M.; Guo, S.; Wu, Z.; Peng, J.; Wu, Y. The variability in the relationship between black carbon and carbon monoxide over the eastern coast of China: BC aging during transport. Atmos. Chem. Phys. 2017, 17, 10395–10403. [Google Scholar] [CrossRef] [Green Version]
  75. Wang, H.; Miao, Q.; Shen, L.; Yang, Q.; Wu, Y.; Wei, H.; Yin, Y.; Zhao, T.; Zhu, B.; Lu, W. Characterization of the aerosol chemical composition during the COVID-19 lockdown period in Suzhou in the Yangtze River Delta, China. J. Environ. Sci. 2021, 102, 110–122. [Google Scholar] [CrossRef] [PubMed]
  76. Hudda, N.; Simon, M.C.; Patton, A.P.; Durant, J.L. Reductions in traffic-related black carbon and ultrafine particle number concentrations in an urban neighborhood during the COVID-19 pandemic. Sci. Total Environ. 2020, 742, 140931. [Google Scholar] [CrossRef] [PubMed]
  77. Huang, X.; Ding, A.; Gao, J.; Zheng, B.; Zhou, D.; Qi, X.; Tang, R.; Wang, J.; Ren, C.; Nie, W.; et al. Enhanced secondary pollution offset reduction of primary emissions during COVID-19 lockdown in China. Natl. Sci. Rev. 2020, 8. [Google Scholar] [CrossRef]
  78. Sun, Y.; Lei, L.; Zhou, W.; Chen, C.; He, Y.; Sun, J.; Li, Z.; Xu, W.; Wang, Q.; Ji, D.; et al. A chemical cocktail during the COVID-19 outbreak in Beijing, China: Insights from six-year aerosol particle composition measurements during the Chinese New Year holiday. Sci. Total. Environ. 2020, 742, 140739. [Google Scholar] [CrossRef]
  79. Liu, L.; Zhang, J.; Du, R.; Teng, X.; Hu, R.; Yuan, Q.; Tang, S.; Ren, C.; Huang, X.; Xu, L.; et al. Chemistry of atmospheric fine particles during the COVID-19 pandemic in a megacity of Eastern China. Geophys. Res. Lett. 2021, 48. [Google Scholar] [CrossRef]
  80. Zheng, B.; Tong, D.; Li, M.; Liu, F.; Hong, C.; Geng, G.; Li, H.; Li, X.; Peng, L.; Qi, J.; et al. Trends in China’s anthropogenic emissions since 2010 as the consequence of clean air actions. Atmos. Chem. Phys. 2018, 18, 14095–14111. [Google Scholar] [CrossRef] [Green Version]
Figure 1. Time series of (a) wind direction (WD) colored by wind speed (WS), boundary layer height (BLH), (b) relative humidity (RH) and precipitation; mass concentrations of (c) SO2, NO2, (d) CO, PM2.5, and (e) atmospheric black carbon (BC) during the whole observation in Qingdao. Three transparent colors represent the three periods regarding the COVID-19 epidemic for further discussion.
Atmosphere 12 00394 g001
Figure 2. A summary of annual mean values of BC (μg m−3) obtained from the present study and previous long-term measurements in East Asia. The colors of the solid circles represent different types of sampling sites, including urban, suburban, rural, and remove, and the size of the data points refers to the mass concentration of BC. More descriptions of those observations are given in Table S1.
Atmosphere 12 00394 g002
Figure 3. Box plots for the BC mass concentration in different seasons (a) and month (b). In each symbol, the whiskers above and below box mark the 90% and 10% percentiles, respectively; the upper and lower edge of the boxes represent the 75% and 25% percentiles, respectively; and the lines and circles inside the boxes denote median and mean values, respectively.
Atmosphere 12 00394 g003
Figure 4. Mass concentrations and mass percentages of BC in PM2.5 (atmospheric fine particulate matter with aerodynamic equivalent diameter less than 2.5 μm) as a function of PM2.5 in winter (a), spring (b), summer (c), and fall (d). (Meanings of the boxes are consistent with those described in Figure 2).
Atmosphere 12 00394 g004
Figure 5. Comparison of (a) BC concentration, (b) BC/CO ratio, and (c) BC/NO2 during the weekday and weekend in different seasons, respectively.
Atmosphere 12 00394 g005
Figure 6. Mass concentration and normalized BC values as a function of (a,c) WS range and (b,d) BLH, respectively.
Atmosphere 12 00394 g006
Figure 7. The △BC/△CO ratio as a function of precipitation. The solid black circles present the average values (mean ± standard deviation) of the △BC/△CO ratio in different precipitation bins for the entire period. The curve fitting was performed with these averaged data points. The size-scale data points refer to surface wind speed.
Atmosphere 12 00394 g007
Figure 8. Bivariate polar plots for hourly BC mass concentration in the four seasons: (a) winter, (b) spring, (c) summer, and (d) fall, respectively.
Atmosphere 12 00394 g008
Figure 9. Maps of the concentration weighted trajectories of BC in the four season: (a) winter, (b) spring, (c) summer, and (d) fall, respectively. The color bar on the right represents the CWT BC mass concentration in μg·m−3.
Atmosphere 12 00394 g009
Figure 10. Mass concentration of BC and PM2.5 (a); mass loading of CO, NO2, and SO2 (b); the ratio of BC to NO2, BC to CO, and BC to PM2.5 (c) in different stages about the COVID-19 pandemic, respectively.
Atmosphere 12 00394 g010
Figure 11. Bivariate polar plots for hourly BC mass concentration in three stages: (a) Pre-COVOD stage, (b) COVID-lockdown stage, and (c) COVID-recovery stage, respectively.
Atmosphere 12 00394 g011
Table 1. Division of stages during the epidemic and relevant regulations.
StagesDatesRelevant Regulations
Pre-COVID2019-12-31–2020-1-23A novel coronavirus was reported on 31 December 2019. The first level emergency response for epidemic prevention and control by Shangdong province on 23 January 2020.
COVID-lockdown2020-1-24–2020-2-10Strict epidemic prevention and control measures were by the Qingdao government, and most public places, villages, communities, and government agencies closed on 24 January 2020. Qingdao, part of the regulation enterprises, began to resume work on 10 February 2020.
COVID-recovery2020-3-20–2020-4-10The various enterprises, certain public places, and major government agencies were fully resumed work, and agricultural production will be carried out on 20 March 2020. Issued a policy that allows outsiders to enter and exit at any time with a health code on 10 April 2020.
Notes: The above relevant regulations can be obtained from the Qingdao government website (http://www.qingdao.gov.cn/, accessed on 18 March 2021).
Publisher’s Note: MDPI stays neutral with regard to jurisdictional claims in published maps and institutional affiliations.

