
PM10 Chemical Profile during North African Dust Episodes over French West Indies

 , ,
, ,  , , and
Abstract
:1. Introduction
2. Experiments
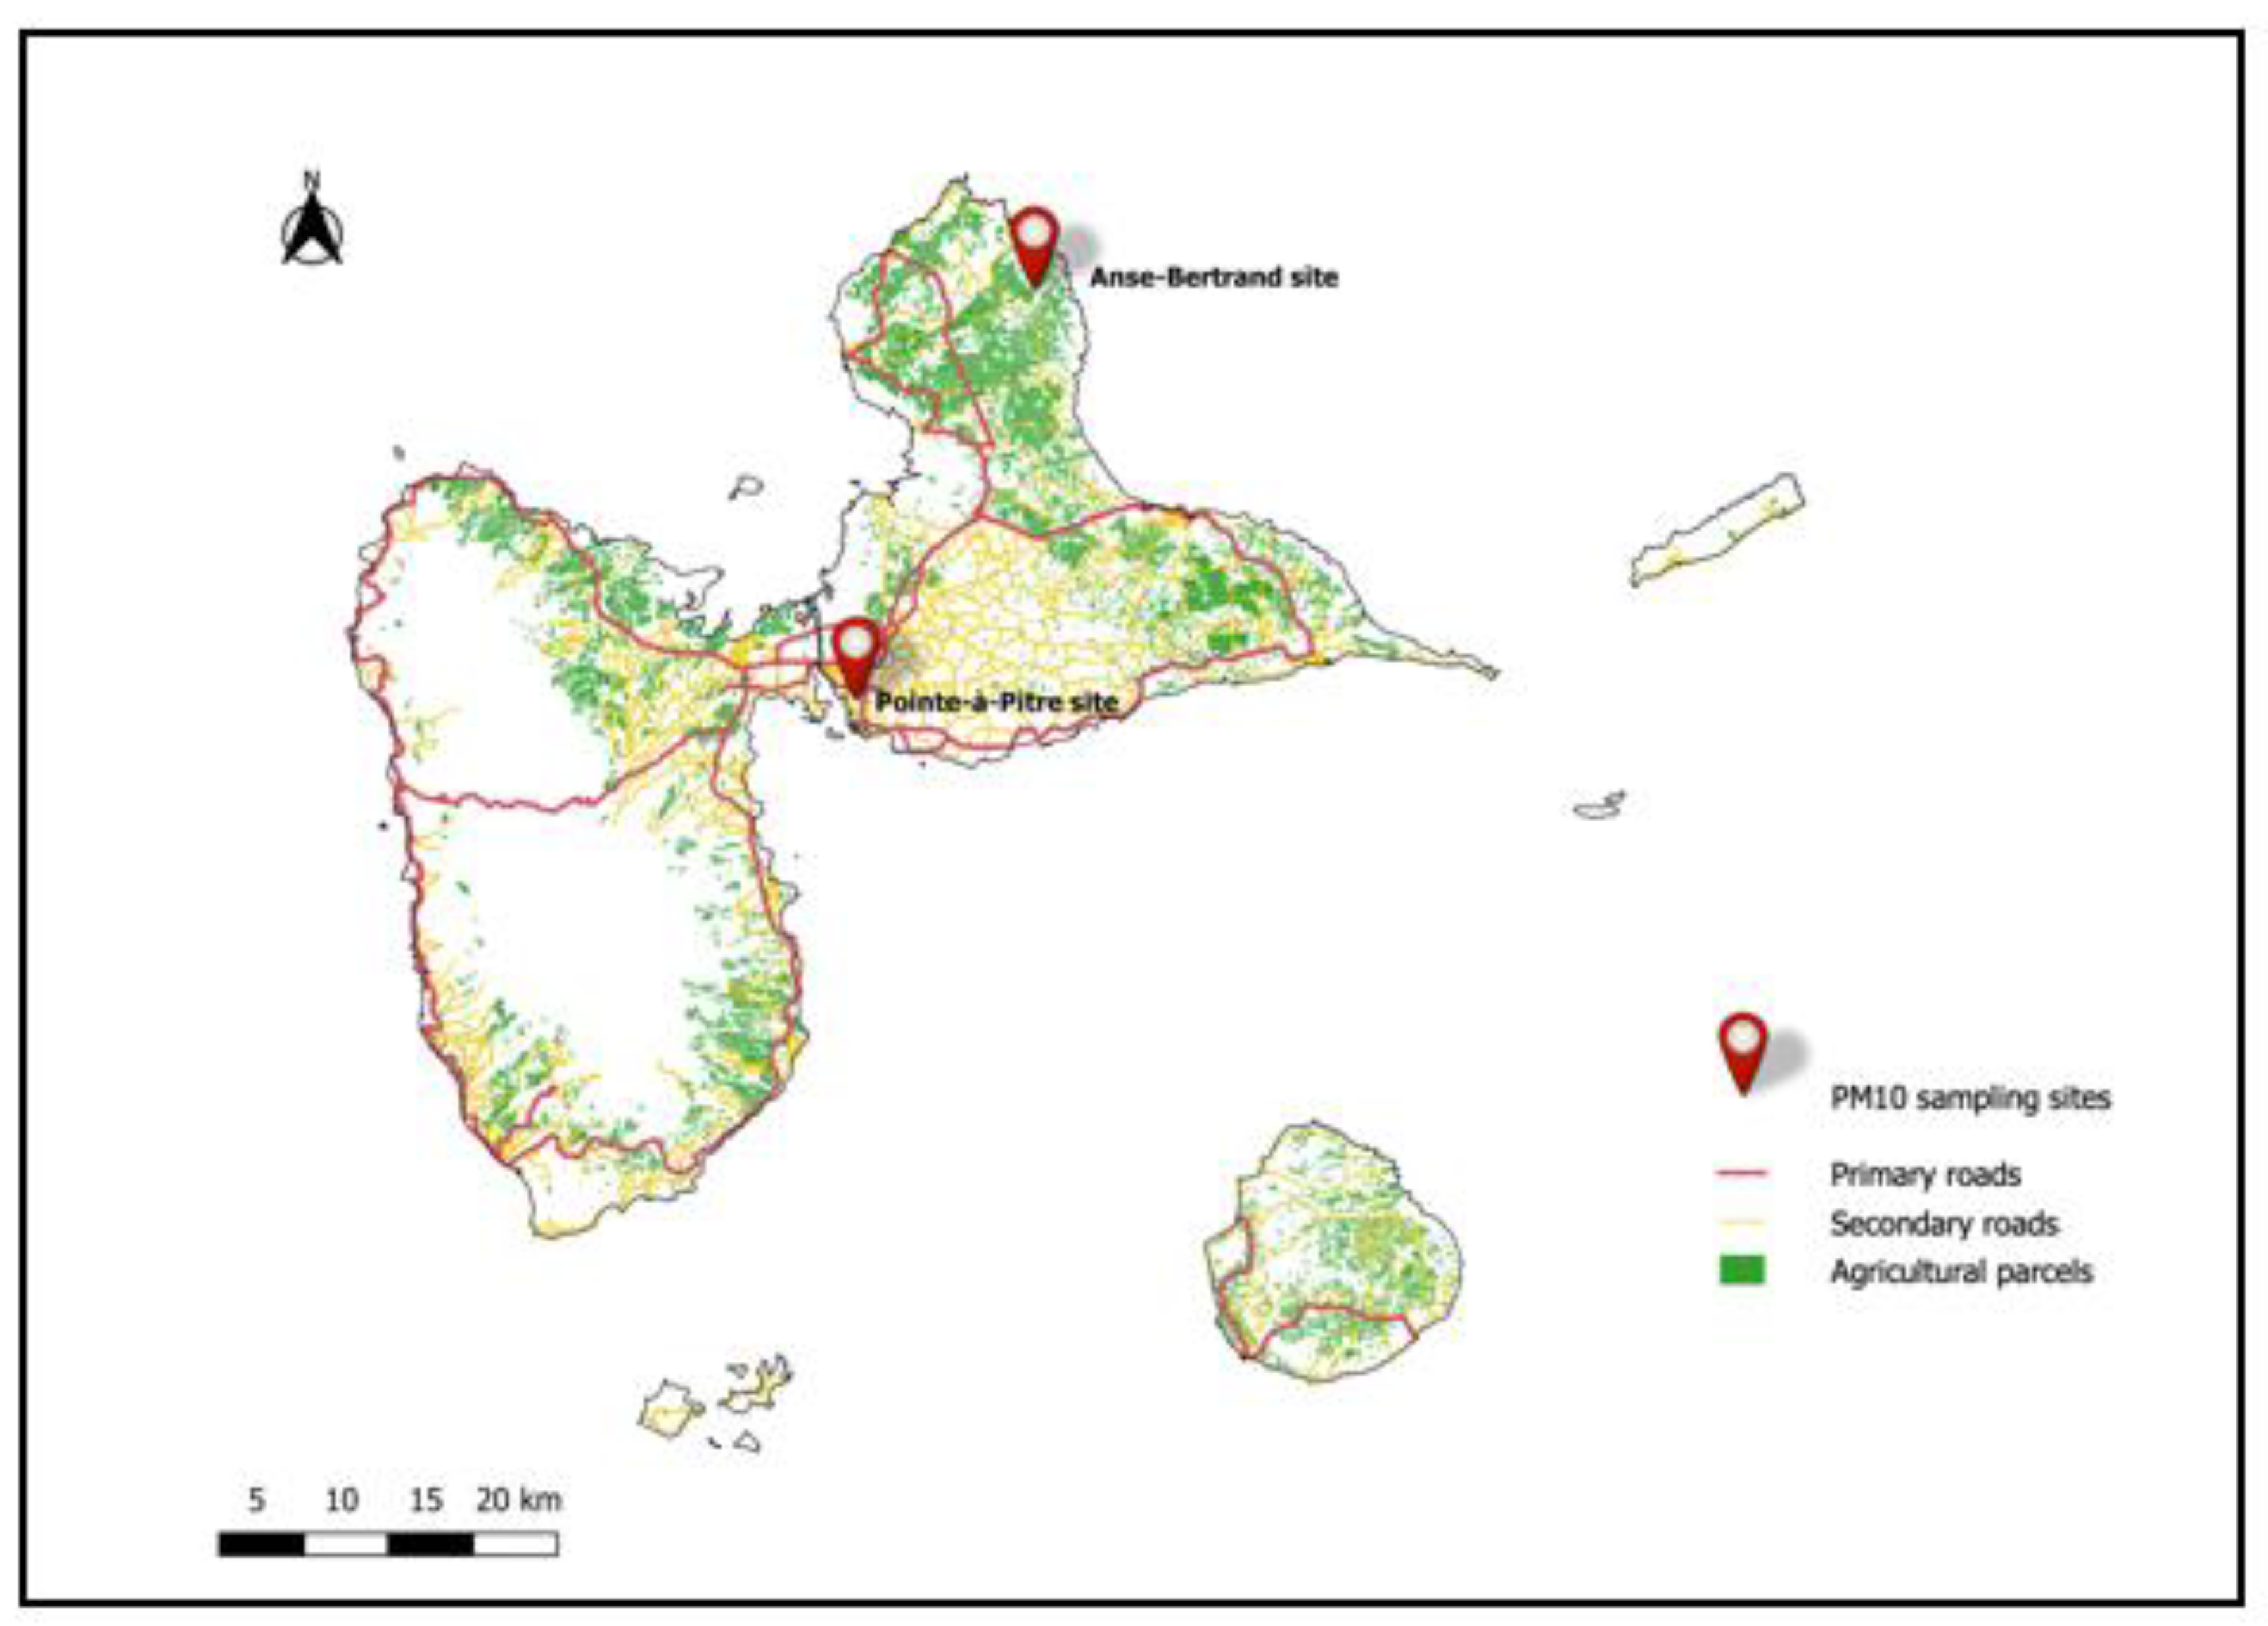
2.1. Samplings
2.2. Chemical Species Analyses
2.2.1. Carbonaceous Aerosols
2.2.2. Anions, Cations and Levoglucosan
2.2.3. Metals and Metalloids
2.2.4. Organic Species
- 14 organochlorine pesticides: 2,4′-DDD, 2,4′-DDE, 2,4′-DDT, 4,4′-DDD, 4,4′-DDE, 4,4′-DDT, aldrin, alpha-endosulfan, alpha-HCH, beta-endosulfan, dieldrin, endosulfan sulfate, gamma-HCH (lindane), and hexachlorobenzene (HCB);
- 1 organophosphate: tributylphosphate (TBP);
- 3 organophosphorus pesticides: chlorpyrifos-ethyl, diazinon, and dichlorvos;
- 1 herbicide: oxadiazon;
- 5 pyrethroid pesticides: cyfluthrin, cypermethrin, deltamethrin, permethrin, and tetramethrin;
- 9 PCBs: PCB 28, 31, 52, 101, 105, 118, 138, 153, and 180;
- 4 phthalates: BBP, DBP, DEP, and DiNP.
2.3. Data Treatment Procedures
2.3.1. Chemical Datasets
- 45 compounds (35 elements, 1 organic, 8 anions-cations, organic carbon) with a Qf > 0.6 have been selected for further analysis; the values below the quantification limit (QL) have been replaced by the corresponding value QL/2;
- 15 compounds (3 elements, 11 organic compounds, elemental carbon) quantified with Qf between 0.3 and 0.6 were kept for qualitative analysis only (see below) and coded into binary variables (quantified/not quantified);
- 59 compounds (13 elements, 45 organics, 1 anion) with a Qf < 0.3 were not retained for further data analysis.
2.3.2. Dust Episodes Origin
2.3.3. Chemical Characteristics of NADE PM10
- The weight allows to measure the contribution of a variable to the construction of the component ;
- is the part of variance of explained by the component .
3. Results
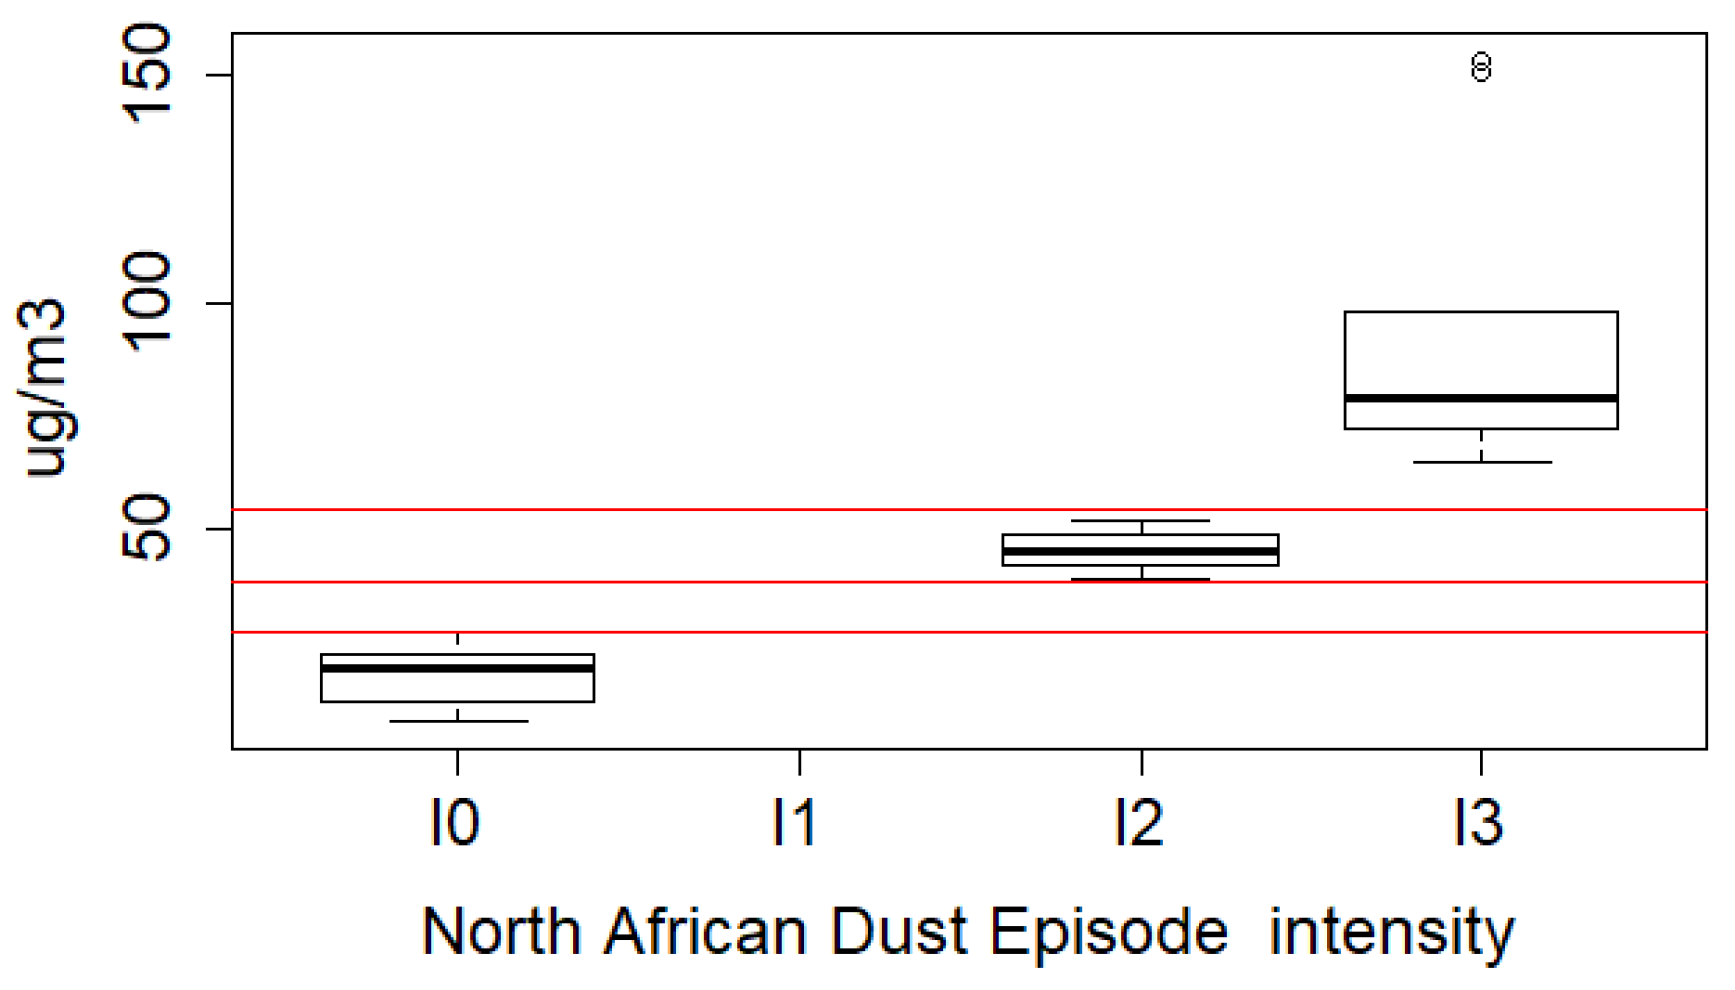
3.1. PM10 Volumetric Concentration Levels
3.2. Dust Episodes Origin
3.3. PM10 Chemical Compounds Concentrations
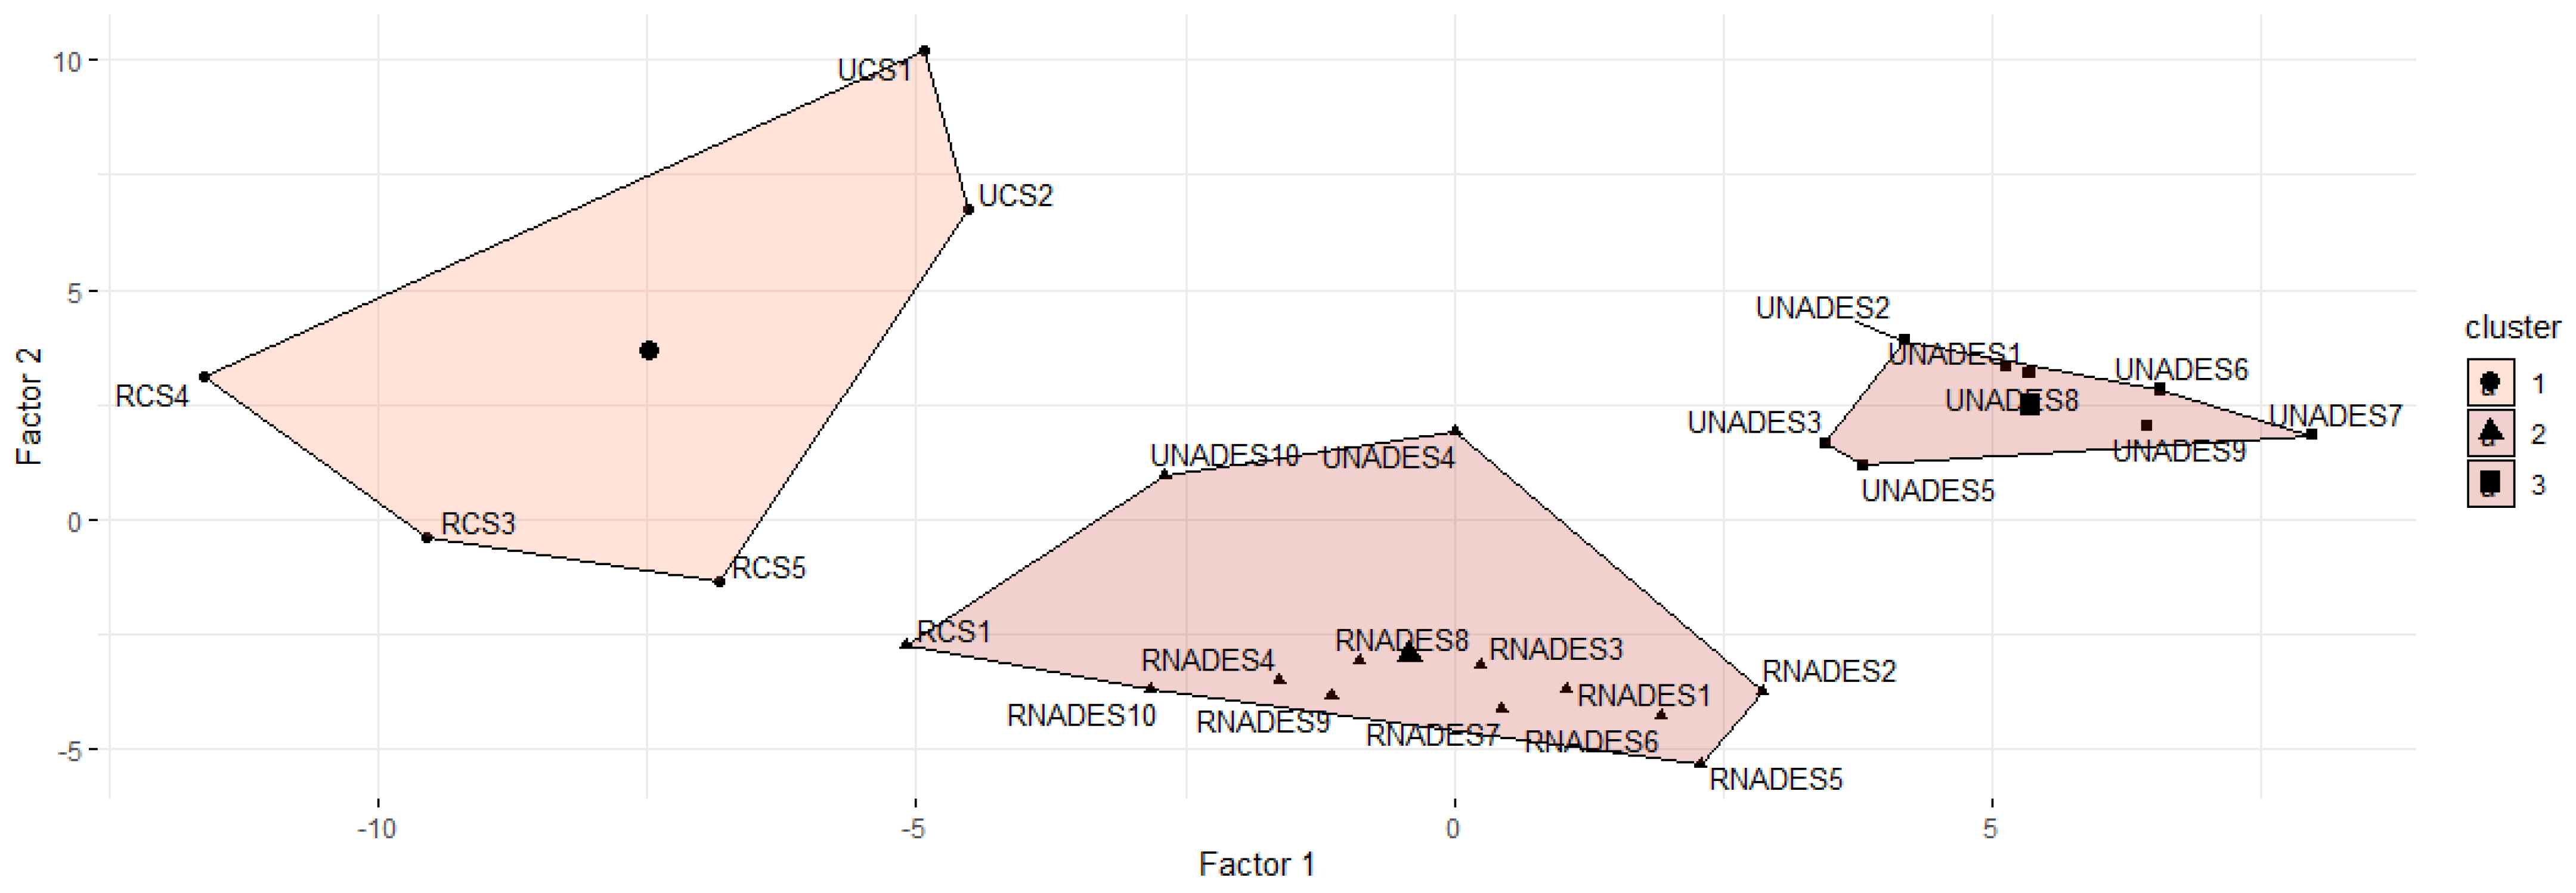
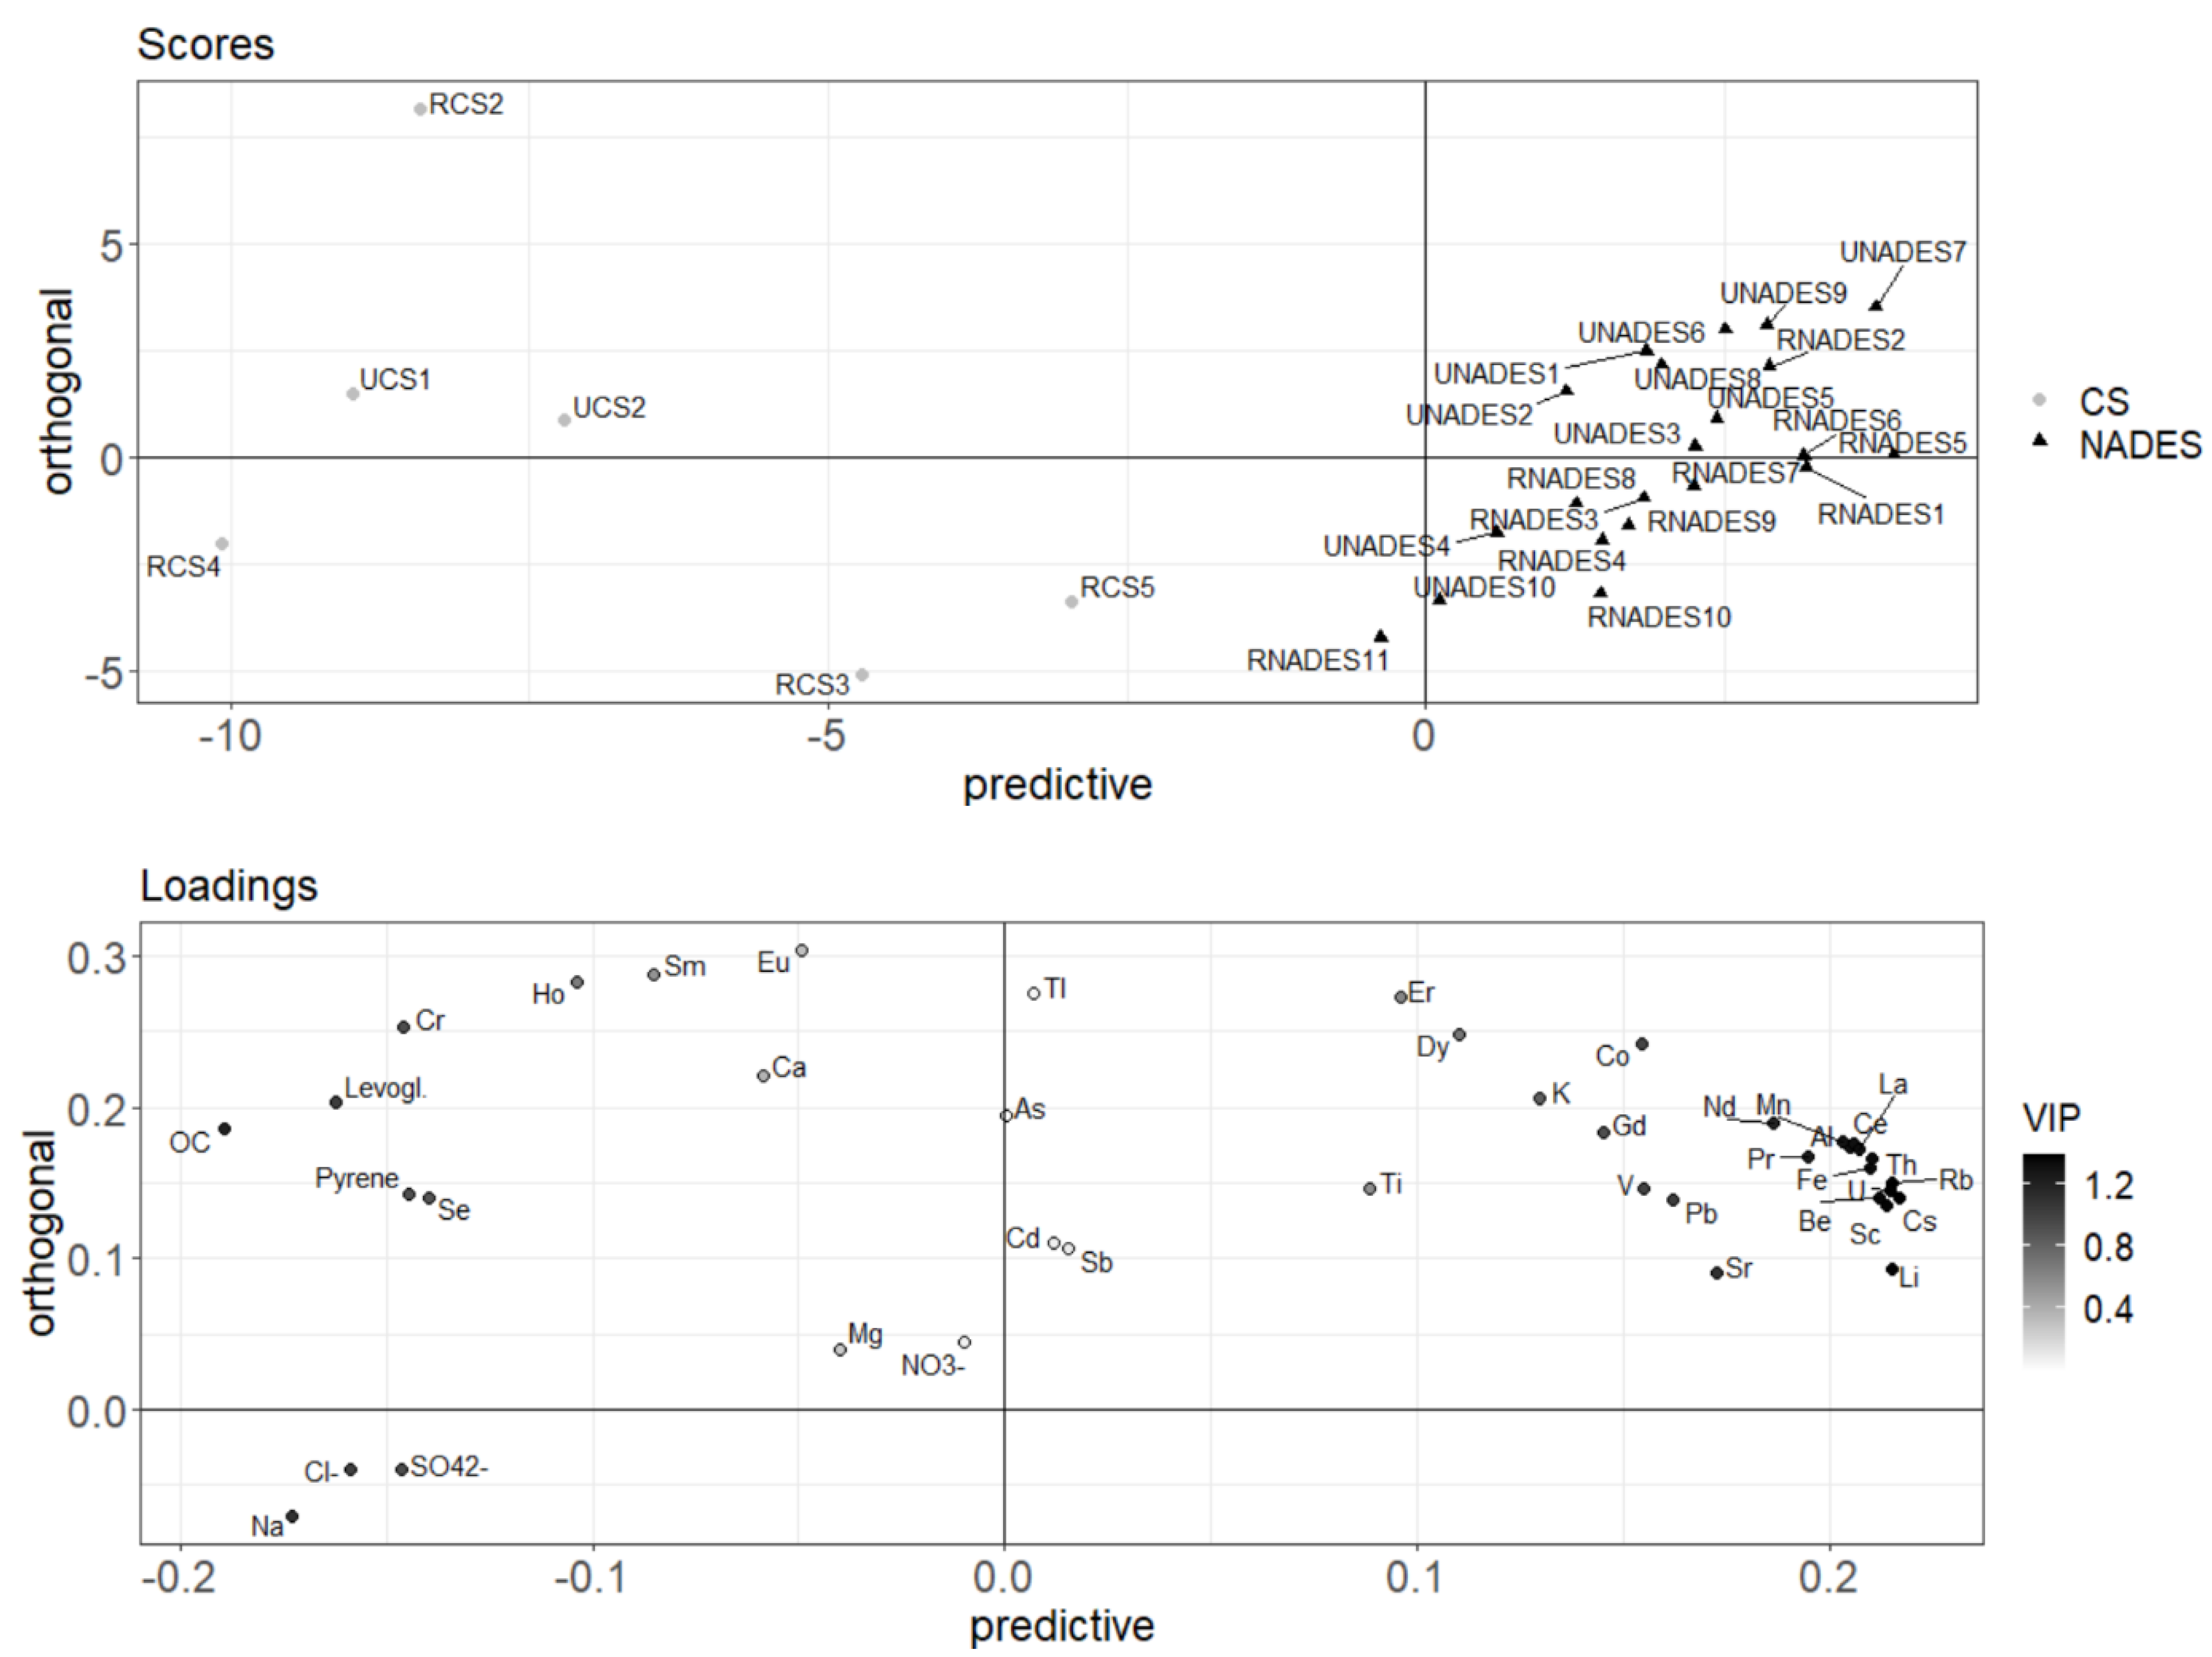
3.4. Chemical Profile of NADE PM10
4. Discussion
4.1. Origin of Particles
4.2. Levels and Measurement of PM
4.3. Chemical Composition of PM10
4.4. NADE PM10 Profile
4.5. Health Risk Related to NADE PM10
5. Conclusions
Supplementary Materials
Author Contributions
Funding
Institutional Review Board Statement
Informed Consent Statement
Data Availability Statement
Acknowledgments
Conflicts of Interest
References
- Taylor, D.A. Dust in the wind. Environ. Health Perspect. 2002, 110, A80–A87. [Google Scholar] [CrossRef]
- EU (European Commission). Air Quality Standards. 2019. Available online: https://ec.europa.eu/environment/air/quality/standards.htm (accessed on 7 December 2020).
- Prospero, J.M.; Bonatti, E.; Schubert, C.; Carlson, T.N. Dust in the Caribbean atmosphere traced to an African dust storm. Earth Planet. Sci. Lett. 1970, 9, 287–293. [Google Scholar] [CrossRef]
- Prospero, J.M.; Glaccum, R.A.; Nees, R.T. Atmospheric transport of soil dust from Africa to South America. Nat. Cell Biol. 1981, 289, 570–572. [Google Scholar] [CrossRef]
- Prospero, J.M. The Atmospheric Transport of Particles to the Ocean. In Particle Flux in the Ocean; Ittekkot, V., Schäfer, P., Honjo, S., Depetris, J., Eds.; John Wiley & Sons Ltd.: Berlin/Heidelberg, Germany, 1996; pp. 19–53. [Google Scholar]
- Prospero, J.M.; Mayol-Bracero, O.L. Understanding the Transport and Impact of African Dust on the Caribbean Basin. Bull. Am. Meteorol. Soc. 2013, 94, 1329–1337. [Google Scholar] [CrossRef]
- De Longueville, F.; Ozer, P.; Doumbia, S.; Henry, S. Desert dust impacts on human health: An alarming worldwide reality and a need for studies in West Africa. Int. J. Biometeorol. 2012, 57, 1–19. [Google Scholar] [CrossRef] [PubMed]
- Goudie, A.S. Desert dust and human health disorders. Environ. Int. 2014, 63, 101–113. [Google Scholar] [CrossRef] [PubMed]
- Sandstrom, T.; Forsberg, B. Desert Dust. Epidemiology 2008, 19, 808–809. [Google Scholar] [CrossRef] [PubMed]
- Karanasiou, A.; Moreno, N.; Moreno, T.; Viana, M.; De Leeuw, F.; Querol, X. Health effects from Sahara dust episodes in Europe: Literature review and research gaps. Environ. Int. 2012, 47, 107–114. [Google Scholar] [CrossRef]
- Stafoggia, M.; Zauli-Sajani, S.; Pey, J.; Samoli, E.; Alessandrini, E.; Basagaña, X.; Cernigliaro, A.; Chiusolo, M.; DeMaria, M.; Díaz, J.; et al. Desert Dust Outbreaks in Southern Europe: Contribution to Daily PM10 Concentrations and Short-Term Associations with Mortality and Hospital Admissions. Environ. Health Perspect. 2016, 124, 413–419. [Google Scholar] [CrossRef] [Green Version]
- Perez, L.; Tobias, A.; Querol, X.; Künzli, N.; Pey, J.; Alastuey, A.; Viana, M.; Valero, N.; González-Cabré, M.; Sunyer, J. Coarse Particles From Saharan Dust and Daily Mortality. Epidemiology 2008, 19, 800–807. [Google Scholar] [CrossRef] [PubMed]
- Samoli, E.; Kougea, E.; Kassomenos, P.; Analitis, A.; Katsouyanni, K. Does the presence of desert dust modify the effect of PM10 on mortality in Athens, Greece? Sci. Total. Environ. 2011, 409, 2049–2054. [Google Scholar] [CrossRef] [PubMed]
- Sajani, S.Z.; Miglio, R.; Bonasoni, P.; Cristofanelli, P.; Marinoni, A.; Sartini, C.; Goldoni, C.A.; De Girolamo, G.; Lauriola, P. Saharan Dust Transport and Daily Mortality. Epidemiology 2009, 20, S40. [Google Scholar] [CrossRef]
- Mallone, S.; Stafoggia, M.; Faustini, A.; Gobbi, S.; Forastiere, F.; A Perucci, C. Effect of Saharan Dust on the Association Between Particulate Matter and Daily Mortality in Rome, Italy. Epidemiology 2009, 20, S66–S67. [Google Scholar] [CrossRef]
- Tobias, A.; Shahsavan, A.; Querol, X.; Stafoggia, M.; Hadei, M.; Hashemi, S.; Khosravi, A.; Namvar, Z.; Yarahmadi, M.; Emam, B. Short-term effects of desert dust and particulate matter on daily mortality in Iran. Environ. Epidemiol. 2019, 3, 396. [Google Scholar] [CrossRef]
- Monteil, M.A. Saharan dust clouds and human health in the English-speaking Caribbean: What we know and don’t know. Environ. Geochem. Health 2008, 30, 339–343. [Google Scholar] [CrossRef] [PubMed]
- Prospero, J.M.; Blades, E.; Naidu, R.; Mathison, G.; Thani, H.; Lavoie, M.C. Relationship between African dust carried in the Atlantic trade winds and surges in pediatric asthma attendances in the Caribbean. Int. J. Biometeorol. 2008, 52, 823–832. [Google Scholar] [CrossRef] [PubMed]
- Gyan, K.; Henry, W.; Lacaille, S.; Laloo, A.; Lamsee-Ebanks, C.; McKay, S.; Antoine, R.M.; Monteil, M.A. African dust clouds are associated with increased paediatric asthma accident and emergency admissions on the Caribbean island of Trinidad. Int. J. Biometeorol. 2005, 49, 371–376. [Google Scholar] [CrossRef] [PubMed]
- Blateau, A.; Bouobda, D.; Le Tertre, A.; Gandar, S.; Quénel, P. Effets sanitaires des brumes de sable désertique à la Martinique, 2001–2006. Bull. Veill. Sanit. Antilles-Guyane. 2012, 3, 11–15. Available online: https://www.santepubliquefrance.fr/regions/guyane/documents/bulletin-regional/2012/bulletin-de-veille-sanitaire-antilles-guyane.-n-3-mars-2012 (accessed on 7 December 2020).
- Cadelis, G.; Tourres, R.; Molinie, J. Short-Term Effects of the Particulate Pollutants Contained in Saharan Dust on the Visits of Children to the Emergency Department due to Asthmatic Conditions in Guadeloupe (French Archipelago of the Caribbean). PLoS ONE 2014, 9, e91136. [Google Scholar] [CrossRef] [Green Version]
- Querol, X.; Alastuey, A.; Viana, M.; Rodriguez, S.; Artiñano, B.; Salvador, P.; Santos, S.G.D.; Patier, R.F.; Ruiz, C.; De La Rosa, J.; et al. Speciation and origin of PM10 and PM2.5 in Spain. J. Aerosol. Sci. 2004, 35, 1151–1172. [Google Scholar] [CrossRef]
- Artíñano, B.; Salvador, P.; Alonso, D.G.; Querol, X.; Alastuey, A. Anthropogenic and natural influence on the PM10 and PM2.5 aerosol in Madrid (Spain). Analysis of high concentration episodes. Environ. Pollut. 2003, 125, 453–465. [Google Scholar] [CrossRef]
- Garrison, V.; Majewski, M.; Foreman, W.; Genualdi, S.; Mohammed, A.; Simonich, S.M. Persistent organic contaminants in Saharan dust air masses in West Africa, Cape Verde and the eastern Caribbean. Sci. Total. Environ. 2014, 468–469, 530–543. [Google Scholar] [CrossRef] [PubMed]
- Henn, B.C.; Ettinger, A.S.; Hopkins, M.R.; Jim, R.; Amarasiriwardena, C.; Christiani, D.C.; Coull, B.A.; Bellinger, D.C.; Wright, R.O. Prenatal Arsenic Exposure and Birth Outcomes among a Population Residing near a Mining-Related Superfund Site. Environ. Health Perspect. 2016, 124, 1308–1315. [Google Scholar] [CrossRef] [Green Version]
- Davis, M.A.; Higgins, J.; Li, Z.; Gilbert-Diamond, D.; Baker, E.R.; Das, A.; Karagas, M.R. Preliminary analysis of in utero low-level arsenic exposure and fetal growth using biometric measurements extracted from fetal ultrasound reports. Environ. Health 2015, 14, 12. [Google Scholar] [CrossRef] [Green Version]
- Ferguson, K.K.; Chin, H.B. Environmental Chemicals and Preterm Birth: Biological Mechanisms and the State of the Science. Curr. Epidemiol. Rep. 2017, 4, 56–71. [Google Scholar] [CrossRef] [PubMed] [Green Version]
- Helmfrid, I.; Berglund, M.; Löfman, O.; Wingren, G. Health effects and exposure to polychlorinated biphenyls (PCBs) and metals in a contaminated community. Environ. Int. 2012, 44, 53–58. [Google Scholar] [CrossRef]
- Menai, M.; Heude, B.; Slama, R.; Forhan, A.; Sahuquillo, J.; Charles, M.-A.; Yazbeck, C. Association between maternal blood cadmium during pregnancy and birth weight and the risk of fetal growth restriction: The EDEN mother–child cohort study. Reprod. Toxicol. 2012, 34, 622–627. [Google Scholar] [CrossRef]
- Zhu, M.; Fitzgerald, E.F.; Gelberg, K.H.; Lin, S.; Druschel, C.M. Maternal Low-Level Lead Exposure and Fetal Growth. Environ. Health Perspect. 2010, 118, 1471–1475. [Google Scholar] [CrossRef] [Green Version]
- Llanos, M.N.; Ronco, A.M. Fetal growth restriction is related to placental levels of cadmium, lead and arsenic but not with antioxidant activities. Reprod. Toxicol. 2009, 27, 88–92. [Google Scholar] [CrossRef]
- Ferguson, K.K.; McElrath, T.F.; Meeker, J.D. Environmental Phthalate Exposure and Preterm Birth. JAMA Pediatr. 2014, 168, 61–67. [Google Scholar] [CrossRef] [PubMed] [Green Version]
- Lenters, V.; Portengen, L.; Rignell-Hydbom, A.; Jönsson, B.A.; Lindh, C.H.; Piersma, A.H.; Toft, G.; Bonde, J.P.; Heederik, D.; Rylander, L.; et al. Prenatal Phthalate, Perfluoroalkyl Acid, and Organochlorine Exposures and Term Birth Weight in Three Birth Cohorts: Multi-Pollutant Models Based on Elastic Net Regression. Environ. Health Perspect. 2016, 124, 365–372. [Google Scholar] [CrossRef] [PubMed]
- Chevrier, C.; Limon, G.; Monfort, C.; Rouget, F.; Garlantézec, R.; Petit, C.; Durand, G.; Cordier, S. Urinary Biomarkers of Prenatal Atrazine Exposure and Adverse Birth Outcomes in the PELAGIE Birth Cohort. Environ. Health Perspect. 2011, 119, 1034–1041. [Google Scholar] [CrossRef]
- Kadhel, P.; Monfort, C.; Costet, N.; Rouget, F.; Thomé, J.-P.; Multigner, L.; Cordier, S. Chlordecone Exposure, Length of Gestation, and Risk of Preterm Birth. Am. J. Epidemiol. 2014, 179, 536–544. [Google Scholar] [CrossRef] [PubMed] [Green Version]
- Kezios, K.L.; Liu, X.; Cirillo, P.M.; Cohn, B.A.; Kalantzi, O.I.; Wang, Y.; Petreas, M.X.; Park, J.-S.; Factor-Litvak, P. Dichlorodiphenyltrichloroethane (DDT), DDT metabolites and pregnancy outcomes. Reprod. Toxicol. 2013, 35, 156–164. [Google Scholar] [CrossRef] [PubMed] [Green Version]
- Longnecker, M.P.; Klebanoff, M.A.; Zhou, H.; Brock, J.W. Association between maternal serum concentration of the DDT metabolite DDE and preterm and small-for-gestational-age babies at birth. Lancet 2001, 358, 110–114. [Google Scholar] [CrossRef]
- Taylor, P.R.; E Lawrence, C.; Hwang, H.L.; Paulson, A.S. Polychlorinated biphenyls: Influence on birthweight and gestation. Am. J. Public Health 1984, 74, 1153–1154. [Google Scholar] [CrossRef] [Green Version]
- Blondel, B.; Kermarrec, M. Enquête nationale périnatale 2010. In Les Naissances en 2010 et leur Evolution Depuis 2003; Inserm: Paris, France, 2011; pp. 3–47. [Google Scholar]
- Viel, J.-F.; Mallet, Y.; Raghoumandan, C.; Quénel, P.; Kadhel, P.; Rouget, F.; Multigner, L. Impact of Saharan dust episodes on preterm births in Guadeloupe (French West Indies). Occup. Environ. Med. 2019, 76, 336–340. [Google Scholar] [CrossRef]
- Westphal, D.L.; Curtis, C.A.; Liu, M.; Walker, A.L. Operational aerosol and dust storm forecasting. IOP Conf. Ser. Earth Environ. Sci. 2009, 7, 012007. [Google Scholar] [CrossRef]
- EU (European Commission). Establishing Guidelines for Demonstration and Subtraction of Exceedances Attributable to Natural Sources under the Directive 2008/50/EC On Ambient Air Quality and Cleaner Air for Europe. 2008. Available online: https://ec.europa.eu/environment/air/quality/legislation/pdf/sec_2011_0208.pdf (accessed on 7 December 2020).
- EU (European Commission). CSN EN 16450 Ambient air—Automated Measuring Systems for the Measurement of the Concentration of Particulate Matter (PM10; PM2.5). 2013. Available online: https://www.en-standard.eu/csn-en-16450-ambient-air-automated-measuring-systems-for-the-measurement-of-the-concentration-of-particulate-matter-pm10-pm2-5/ (accessed on 7 December 2020).
- Birch, M.E.; Cary, R.A. Elemental Carbon-Based Method for Monitoring Occupational Exposures to Particulate Diesel Exhaust. Aerosol Sci. Technol. 1996, 25, 221–241. [Google Scholar] [CrossRef]
- Cavalli, F.; Viana, M.; Yttri, K.E.; Genberg, J.; Putaud, J.-P. Toward a standardised thermal-optical protocol for measuring atmospheric organic and elemental carbon: The EUSAAR protocol. Atmospheric Meas. Tech. 2010, 3, 79–89. [Google Scholar] [CrossRef] [Green Version]
- Waked, A.; Favez, O.; Alleman, L.Y.; Piot, C.; Petit, J.-E.; Delaunay, T.; Verlinden, E.; Golly, B.; Besombes, J.-L.; Jaffrezo, J.-L.; et al. Source apportionment of PM10 in a north-western Europe regional urban background site (Lens, France) using positive matrix factorization and including primary biogenic emissions. Atmospheric Chem. Phys. Discuss. 2014, 14, 3325–3346. [Google Scholar] [CrossRef] [Green Version]
- EU (European Commission). EN 14902:2005 Ambient Air Quality—Standard Method for the Measurement of Pb, Cd, As, and Ni in the PM10 Fraction of Suspended Particulate Matter. 2013. Available online: https://infostore.saiglobal.com/preview/is/en/2005/i.s.en14902-2005%2Bac-2006.pdf?sku=675284 (accessed on 15 February 2021).
- Mbengue, S.; Alleman, L.Y.; Flament, P. Size-distributed metallic elements in submicronic and ultrafine atmospheric particles from urban and industrial areas in northern France. Atmospheric Res. 2014, 35–47. [Google Scholar] [CrossRef]
- Leclercq, B.; Alleman, L.Y.; Perdrix, E.; Riffault, V.; Happillon, M.; Strecker, A.; Lo-Guidice, J.-M.; Garçon, G.; Coddeville, P. Particulate metal bioaccessibility in physiological fluids and cell culture media: Toxicological perspectives. Environ. Res. 2017, 156, 148–157. [Google Scholar] [CrossRef] [PubMed]
- Tomaz, S.; Shahpoury, P.; Jaffrezo, J.-L.; Lammel, G.; Perraudin, E.; Villenave, E.; Albinet, A. One-year study of polycyclic aromatic compounds at an urban site in Grenoble (France): Seasonal variations, gas/particle partitioning and cancer risk estimation. Sci. Total. Environ. 2016, 565, 1071–1083. [Google Scholar] [CrossRef] [PubMed]
- Blanchard, O.; Glorennec, P.; Mercier, F.; Bonvallot, N.; Chevrier, C.; Ramalho, O.; Mandin, C.; Le Bot, B. Semivolatile Organic Compounds in Indoor Air and Settled Dust in 30 French Dwellings. Environ. Sci. Technol. 2014, 48, 3959–3969. [Google Scholar] [CrossRef]
- Raffy, G.; Mercier, F.; Blanchard, O.; Derbez, M.; Dassonville, C.; Bonvallot, N.; Glorennec, P.; Le Bot, B. Semi-volatile organic compounds in the air and dust of 30 French schools: A pilot study. Indoor Air 2016, 27, 114–127. [Google Scholar] [CrossRef]
- Formenti, P.; Schütz, L.; Balkanski, Y.; Desboeufs, K.; Ebert, M.; Kandler, K.; Petzold, A.; Scheuvens, D.; Weinbruch, S.; Zhang, D. Recent progress in understanding physical and chemical properties of African and Asian mineral dust. Atmospheric Chem. Phys. Discuss. 2011, 11, 8231–8256. [Google Scholar] [CrossRef] [Green Version]
- Remoundaki, E.; Bourliva, A.; Kokkalis, P.; Mamouri, R.-E.; Papayannis, A.; Grigoratos, T.; Samara, C.; Tsezos, M. PM10 composition during an intense Saharan dust transport event over Athens (Greece). Sci. Total. Environ. 2011, 409, 4361–4372. [Google Scholar] [CrossRef]
- Scheuvens, D.; Schütz, L.; Kandler, K.; Ebert, M.; Weinbruch, S. Bulk composition of northern African dust and its source sediments—A compilation. Earth Sci. Rev. 2013, 116, 170–194. [Google Scholar] [CrossRef]
- Pagès, J. Analyse factorielle de données mixtes. Rev. Stat. Appl. 2004, 52, 93–111. [Google Scholar]
- Chen, B.; Harrison, R.; Pan, Y.; Tai, P.C. Novel Hybrid Hierarchical-K-means Clustering Method (H-K-means) for Microarray Analysis. In Proceedings of the 2005 IEEE Computational Systems Bioinformatics Conference-Workshops (CSBW’05), Stanford, CA, USA, 8–12 August 2006; IEEE: Piscataway, NJ, USA, 2006; pp. 105–108. [Google Scholar] [CrossRef]
- Husson, F.; Josse, J.; Pagès, J. Principal Component Methods—Hierarchical Clustering—Partitional Clustering: Why Would We Need to Choose for Visualizing Data? Technical Report—Agrocampus. Applied Mathematics Department. September 2010. Available online: http://www.agrocampus-ouest.fr/math/ (accessed on 15 February 2021).
- Trygg, J.; Wold, S. Orthogonal projections to latent structures (O-PLS). J. Chemom. 2002, 16, 119–128. [Google Scholar] [CrossRef]
- Thevenot, E.A. PCA, PLS(-DA) and OPLS(-DA) for Multivariate Analysis and Feature Selection of Omics Data. Bioconductor 3.12. Software Packages Ropls. Available online: https://www.bioconductor.org/packages/release/bioc/html/ropls.html (accessed on 15 February 2021).
- Benjamini, Y.; Hochberg, Y. Controlling the false discovery rate: A practical and powerful approach to multiple hypothesis testing. J. R. Stat. Soc. 1995, 57, 289–300. [Google Scholar] [CrossRef]
- Borbély-Kiss, I.; Kiss, Á.Z.; Koltay, E.; Szabó, G.; Bozó, L. Saharan dust episodes in Hungarian aerosol: Elemental signatures and transport trajectories. J. Aerosol Sci. 2004, 35, 1205–1224. [Google Scholar] [CrossRef]
- Ganor, E.; Foner, H.A. The mineralogical and chemical properties and the behaviour of Aeolian Saharan dust over Israel. In The Impact of Desert Dust across the Mediterranean; Gurezoni, S., Chester, R., Eds.; Kluwer Academic Publishers: Dordrecht, The Netherlands, 1996; pp. 163–172. [Google Scholar]
- Guieu, C.; Thomas, A.J. Saharan Aerosols: From the Soil to the Ocean. In Environmental Science and Technology Library; Springer: Berlin/Heidelberg, Germany, 1996; pp. 207–216. [Google Scholar]
- Gelado-Caballero, M.D.; López-García, P.; Prieto, S.; Patey, M.D.; Collado, C.; Hernández-Brito, J.J. Long-term aerosol measurements in Gran Canaria, Canary Islands: Particle concentration, sources and elemental composition. J. Geophys. Res. Space Phys. 2012, 117, 03304. [Google Scholar] [CrossRef] [Green Version]
- Koçak, M.; Mihalopoulos, N.; Kubilay, N. Contributions of natural sources to high PM10 and PM2.5 events in the eastern Mediterranean. Atmos. Environ. 2007, 41, 3806–3818. [Google Scholar] [CrossRef]
- Kleanthous, S.; Bari, A.; Baumbach, G.; Sarachage-Ruiz, L. Influence of particulate matter on the air quality situation in a mediterranean island. Atmos. Environ. 2009, 43, 4745–4753. [Google Scholar] [CrossRef]
- Li-Jones, X.; Prospero, J.M. Variations in the size distribution of non-sea-salt sulfate aerosol in the marine boundary layer at Barbados: Impact of African dust. J. Geophys. Res. Space Phys. 1998, 103, 16073–16084. [Google Scholar] [CrossRef] [Green Version]
- Prospero, J.M. African Droughts and Dust Transport to the Caribbean: Climate Change Implications. Science 2003, 302, 1024–1027. [Google Scholar] [CrossRef]
- Prospero, J.M.; Ginoux, P.; Torres, O.; Nicholson, S.E.; Gill, T.E. Environmental characterization of global sources of atmospheric soil dust identified with the NIMBUS 7 Total Ozone Mapping Spectrometer (TOMS) absorbing aerosol product. Rev. Geophys. 2002, 40, 1002. [Google Scholar] [CrossRef]
- Gwadair. Rapport d’Activité 2005. Available online: https://www.gwadair.fr/images/pdf/rapport-activites2005.pdf (accessed on 7 December 2020).
- Gwadair. Rapport d’Activité 2006. Available online: https://www.gwadair.fr/images/pdf/rapport-activites2006.pdf (accessed on 7 December 2020).
- Gwadair. Rapport d’Activité 2007. Available online: http://www.gwadair.fr/images/pdf/rapport-activites2007.pdf (accessed on 7 December 2020).
- Zhao, N.; Qiu, J.; Zhang, Y.; He, X.; Zhou, M.; Li, M.; Xu, X.; Cui, H.; Lv, L.; Lin, X.; et al. Ambient air pollutant PM10 and risk of preterm birth in Lanzhou, China. Environ. Int. 2015, 76, 71–77. [Google Scholar] [CrossRef] [PubMed] [Green Version]
- Slama, R.; Darrow, L.; Parker, J.; Woodruff, T.J.; Strickland, M.; Nieuwenhuijsen, M.; Glinianaia, S.; Hoggatt, K.J.; Kannan, S.; Hurley, F.; et al. Meeting Report: Atmospheric Pollution and Human Reproduction. Environ. Health Perspect. 2008, 116, 791–798. [Google Scholar] [CrossRef] [PubMed] [Green Version]
- ANSES. Polluants “Emergents” dans l’Air Ambiant: Identification, Catégorisation et Hiérarchisation de Polluants Actuellement non Réglementés pour la Surveillance de la Qualité de l’Air. Rapport d’Expertise Collective. 2018; pp. 1–250. Available online: https://www.anses.fr/fr/system/files/AIR2015SA0216Ra.pdf (accessed on 7 December 2020).
- ANSES. Valeurs Limites d’Exposition en Milieu Professionnel: Evaluation des Indicateurs Biologiques d’Exposition et Recom-mandation de Valeurs Biologiques de Référence pour le Béryllium et ses Composés. 2018; pp. 1–75. Available online: https://www.anses.fr/fr/system/files/VLEP2014SA0058Ra.pdf (accessed on 7 December 2020).
- ANSES. Avis de l’Agence Nationale de Sécurité Sanitaire de l’Alimentation, de l’Environnement et du Travail Relatif à la Détermination d’une Valeur Sanitaire Maximale Admissible pour le Manganèse dans l’Eau Destinée à la Consommation Humaine Risques Professionnels. 2018; pp. 1–89. Available online: https://www.anses.fr/fr/system/files/EAUX2016SA0203.pdf (accessed on 7 December 2020).


| Start Date (mm/dd/yy) | End Date (mm/dd/yy) | Number of Samples Collected during NADE | Number of Control Samples Collected Just after NADE |
|---|---|---|---|
| Urban area | |||
| 04/02/17 | 04/05/17 | 1 | 1 |
| 05/19/17 | 05/30/17 | 9 | 1 |
| Rural area | |||
| 06/26/17 | 06/28/17 | 2 | 2 |
| 09/25/17 | 09/28/17 | 2 | 2 |
| 10/15/17 | 10/24/17 | 6 | 1 * |
| Elements/ Compounds | QL (ug/m3) | Quantification Frequency | NADE Samples | Control Samples | ||
|---|---|---|---|---|---|---|
| Mean (ug/g) | SD | Mean (ug/g) | SD | |||
| Al | 3.57 × 10⁻² | 100% | 90,252.27 | 14,136.24 | 44,188.46 | 23,944.78 |
| As | 1.39 × 10⁻⁵ | 100% | 8.34 | 1.82 | 7.56 | 5.41 |
| Be | 0 | 100% | 2.66 | 0.40 | 1.32 | 0.62 |
| Ca | 2.42 × 10⁻² | 100% | 23,114.09 | 2386.32 | 24,678.60 | 9625.29 |
| Cd | 1.39 × 10⁻⁵ | 78% | 0.67 | 1.05 | 0.38 | 0.36 |
| Ce | 2.78 × 10⁻⁵ | 100% | 105.71 | 17.79 | 46.74 | 23.24 |
| Co | 2.22 × 10⁻⁴ | 78% | 14.64 | 2.35 | 8.92 | 3.42 |
| Cr | 2.40 × 10⁻³ | 63% | 61.59 | 13.90 | 89.37 | 42.37 |
| Cs | 0 | 100% | 3.33 | 0.50 | 1.46 | 0.69 |
| Dy | 4.17 × 10⁻⁵ | 74% | 2.85 | 0.54 | 1.76 | 0.83 |
| Er | 2.78 × 10⁻⁵ | 78% | 1.25 | 0.32 | 0.93 | 0.36 |
| Eu | 2.78 × 10⁻⁵ | 70% | 0.92 | 0.22 | 0.93 | 0.44 |
| Fe | 4.13 × 10⁻² | 96% | 40,288.33 | 6124.16 | 19,361.05 | 9900.01 |
| Gd | 4.17 × 10⁻⁵ | 78% | 3.69 | 0.88 | 1.94 | 0.74 |
| Ho | 1.39 × 10⁻⁵ | 63% | 0.48 | 0.15 | 0.62 | 0.29 |
| K | 4.38 × 10⁻² | 100% | 17,381.37 | 1534.32 | 14,180.03 | 4339.40 |
| La | 1.39 × 10⁻⁵ | 100% | 45.74 | 7.72 | 20.03 | 10.02 |
| Li | 2.78 × 10⁻⁵ | 100% | 34.10 | 5.24 | 16.56 | 5.75 |
| Mg | 6.68 × 10⁻³ | 100% | 18,980.01 | 2201.94 | 21,130.22 | 6819.53 |
| Mn | 6.11 × 10⁻⁴ | 100% | 565.92 | 99.12 | 280.87 | 122.59 |
| Na | 1.45 × 10⁻² | 100% | 71,620.49 | 21,043.91 | 161,142.72 | 92,117.83 |
| Nd | 9.72 × 10⁻⁵ | 96% | 18.62 | 3.83 | 9.02 | 3.52 |
| Pb | 1.53 × 10⁻⁴ | 93% | 28.85 | 7.90 | 13.75 | 5.41 |
| Pr | 2.78 × 10⁻⁵ | 89% | 4.97 | 1.01 | 2.15 | 1.23 |
| Rb | 2.78 × 10⁻⁵ | 100% | 79.73 | 11.44 | 37.11 | 15.22 |
| Sb | 1.11 × 10⁻⁴ | 78% | 11.39 | 21.67 | 6.48 | 4.30 |
| Sc | 2.78 × 10⁻⁵ | 96% | 12.29 | 2.05 | 5.56 | 2.95 |
| Se | 2.78 × 10⁻⁵ | 100% | 7.51 | 1.88 | 17.94 | 18.15 |
| Sm | 1.25 × 10⁻⁴ | 67% | 4.08 | 1.00 | 4.65 | 2.20 |
| Sr | 2.36 × 10⁻⁴ | 100% | 226.88 | 27.68 | 161.09 | 47.00 |
| Th | 1.39 × 10⁻⁵ | 100% | 13.58 | 2.11 | 5.83 | 2.90 |
| Ti | 7.57 × 10⁻³ | 96% | 2633.86 | 459.25 | 2153.32 | 1074.86 |
| Tl | 1.39 × 10⁻⁵ | 74% | 0.44 | 0.07 | 0.41 | 0.17 |
| U | 0 | 100% | 2.45 | 0.28 | 1.20 | 0.53 |
| V | 2.50 × 10⁻⁴ | 96% | 110.63 | 32.89 | 56.66 | 25.59 |
| Pyrene | 5.33 × 10⁻⁶ | 63% | 0.27 | 0.32 | 1.08 | 1.33 |
| Ca2+ | 3.90 × 10⁻² | 100% | 14,792.37 | 1341.21 | 12 312.84 | 1706.38 |
| Cl− | 1.50 × 10⁻² | 100% | 75,678.27 | 24,237.95 | 157,701.21 | 65,400.07 |
| Levoglucosan | 6.00 × 10⁻³ | 100% | 603.94 | 579.42 | 1563.14 | 1080.73 |
| Mg2+ | 1.50 × 10⁻² | 96% | 5610.98 | 1718.57 | 8904.72 | 5253.78 |
| NO3− | 9.00 × 10⁻³ | 100% | 13,079.30 | 3808.51 | 12,053.54 | 5694.35 |
| OC | 1.29 × 10⁻¹ | 100% | 19,859.47 | 11,469.10 | 51,105.19 | 29,056.23 |
| K+ | 3.90 × 10⁻² | 100% | 2953.52 | 641.78 | 4925.05 | 1632.93 |
| Na+ | 5.10 × 10⁻² | 100% | 48,838.48 | 15,847.95 | 103,154.76 | 39,641.48 |
| SO42− | 1.50 × 10⁻² | 100% | 33,658.63 | 7851.19 | 46,044.73 | 7479.11 |
| Caption | NADE Samples | Control Samples | Wilcoxon Tests Adjusted p-Value | ||
|---|---|---|---|---|---|
| Compounds | Mean (ug/g) | Mean (ng/m3) | Mean (ug/g) | Mean (ng/m3) | |
| Al | 89,176.94 | 6059.01 | 40,274.79 | 585.88 | 3.42 × 10⁻² |
| Be | 2.63 | 0.18 | 1.19 | 0.02 | 3.42 × 10⁻² |
| Ce | 103.87 | 7.07 | 43.35 | 0.65 | 3.42 × 10⁻² |
| Cs | 3.27 | 0.23 | 1.36 | 0.02 | 3.42 × 10⁻² |
| Fe | 39,844.56 | 2711.32 | 17,426.35 | 263.88 | 3.42 × 10⁻² |
| La | 44.94 | 3.06 | 18.57 | 0.28 | 3.42 × 10⁻² |
| Li | 33.55 | 2.35 | 15.57 | 0.23 | 3.42 × 10⁻² |
| Mn | 558.68 | 37.98 | 258.73 | 3.90 | 3.42 × 10⁻² |
| Nd | 18.31 | 1.25 | 8.52 | 0.13 | 3.42 × 10⁻² |
| Pb | 28.16 | 1.87 | 13.64 | 0.22 | 3.42 × 10⁻² |
| Pr | 4.91 | 0.33 | 1.90 | 0.03 | 3.42 × 10⁻² |
| Rb | 78.32 | 5.42 | 34.96 | 0.53 | 3.42 × 10⁻² |
| Sc | 12.20 | 0.84 | 4.77 | 0.07 | 3.42 × 10⁻² |
| Th | 13.32 | 0.91 | 5.44 | 0.08 | 3.42 × 10⁻² |
| U | 2.41 | 0.16 | 1.13 | 0.02 | 3.42 × 10⁻² |
| V | 109.35 | 7.27 | 52.18 | 0.80 | 3.42 × 10⁻² |
| Cl- | 80,416.70 | 4901.43 | 154,787.22 | 2093.33 | 3.42 × 10⁻² |
| Levoglucosan | 592.82 | 34.76 | 1761.94 | 25.00 | 3.42 × 10⁻² |
| OC | 19,707.43 | 1203.81 | 56,844.95 | 841.67 | 3.42 × 10⁻² |
| Na | 75,176.80 | 4656.87 | 163,616.00 | 2207.75 | 3.42 × 10⁻² |
| SO42− | 34,366.24 | 2091.90 | 45,632.43 | 693.33 | 3.42 × 10⁻² |
Publisher’s Note: MDPI stays neutral with regard to jurisdictional claims in published maps and institutional affiliations. |
© 2021 by the authors. Licensee MDPI, Basel, Switzerland. This article is an open access article distributed under the terms and conditions of the Creative Commons Attribution (CC BY) license (http://creativecommons.org/licenses/by/4.0/).
Share and Cite
Quénel, P.; Vadel, J.; Garbin, C.; Durand, S.; Favez, O.; Albinet, A.; Raghoumandan, C.; Guyomard, S.; Alleman, L.Y.; Mercier, F. PM10 Chemical Profile during North African Dust Episodes over French West Indies. Atmosphere 2021, 12, 277. https://doi.org/10.3390/atmos12020277
Quénel P, Vadel J, Garbin C, Durand S, Favez O, Albinet A, Raghoumandan C, Guyomard S, Alleman LY, Mercier F. PM10 Chemical Profile during North African Dust Episodes over French West Indies. Atmosphere. 2021; 12(2):277. https://doi.org/10.3390/atmos12020277
Chicago/Turabian StyleQuénel, Philippe, Jade Vadel, Céline Garbin, Séverine Durand, Olivier Favez, Alexandre Albinet, Christina Raghoumandan, Stéphanie Guyomard, Laurent Yves Alleman, and Fabien Mercier. 2021. "PM10 Chemical Profile during North African Dust Episodes over French West Indies" Atmosphere 12, no. 2: 277. https://doi.org/10.3390/atmos12020277