Article

Quantifying the Contribution of LUCC to Surface Energy Budget: A Case Study of Four Typical Cities in the Yellow River Basin in China

1
Key Laboratory of Geospatial Technology for the Middle and Lower Yellow River Regions (Henan University), Ministry of Education, Kaifeng 475004, China
2
Key Laboratory of Integrative Prevention of Air Pollution and Ecological Security of Henan Province, Kaifeng 475004, China
3
Henan Key Laboratory of Earth System Observation and Modeling, Henan University, Kaifeng 475004, China
4
Weather Modification Office of Qinghai Province, Xining 810001, China
5
Department of Geography, Kent State University, Kent, OH 44242, USA
*
Authors to whom correspondence should be addressed.
Atmosphere 2021, 12(11), 1374; https://doi.org/10.3390/atmos12111374
Submission received: 29 August 2021 / Revised: 10 October 2021 / Accepted: 14 October 2021 / Published: 20 October 2021
(This article belongs to the Special Issue Remote Sensing and GIS Applications in Urban Climate Research)

Abstract

:
With social changes and economic development, human activities inevitably lead to significant changes in land use types. Land use and land cover change (LUCC) leads to a series of changes in energy balance and surface temperature, which has an impact on the regional climate. In this study, MODIS remote sensing data were used to quantify the results of the biological and geophysical effects caused by LUCC in four typical cities in the Yellow River Basin of China: Jinan, Zhengzhou, Lanzhou and Xining. The results showed the following: (1) The latent heat flux and the net radiation of the four cities were both increasing on the whole. The latent heat flux of water and forest was higher, which played a key role in energy consumption on the ground. The net radiation value of the old urban and urban expansion areas was higher, while that of the forest was lower, which indicated that human activities increased the input of surface energy. (2) The differences between latent heat flux and net radiation in areas greatly affected by human activities were much smaller than those in natural areas such as forest and grassland. This indicted that human activities increased the warming trend. In addition, most of the differences between latent heat flux and net radiation in the four cities showed a downward trend. (3) Different cities have different regulating factors for land surface temperature (LST). In Jinan and Zhengzhou, the regulation of LST by net radiation was more obvious, while in Lanzhou and Xining, the regulation of LST by latent heat flux was more pronounced. By comparing LUCC and the forced balance between energy intake and consumption in four typical cities along the Yellow River Basin, this study emphasizes the difference of energy budgets under different land use types, which has important reference value for judging the spatial difference of urban thermal environments.

1. Introduction

The process of surface energy exchange is closely related to solar radiation, ecological change and human activities. The influence of these natural and man-made factors on climate change is mainly realized by the change of surface radiation and energy balance [1]. As a major human activity, land use and land cover change (LUCC) can influence ecological climate through biogeochemical processes [2,3], which is one of the driving forces of regional and global climate change [4,5,6]. Therefore, surface energy budget is the link between land and atmosphere energy conversion, and it is an important intermediate mechanism for LUCC to cause temperature change [7]. Moreover, LUCC changes the physical characteristics of the land surface, such as surface albedo, roughness and evapotranspiration, which directly affects the absorption of surface radiation and energy consumption, thus causing changes in surface energy balance.
Surface albedo represents the ability of the surface to reflect solar radiation and directly affects the energy budget; it has great influence on global climate trends, local weather phenomena and biological processes [8,9,10]. Land cover change can effectively reflect the influence of human activities on vegetation and its corresponding surface albedo. As a typical land cover change under human activities, urban expansion replaces cultivated land and other natural or semi-natural vegetation cover, such as forests, grasslands and wetlands. With the increase of buildings, the corresponding albedo will increase or decrease, which is due to the higher or lower albedo of the main building materials used in the process of urban expansion [11,12]. In addition, vegetation dynamics inevitably influence or provide feedback on the energy distribution and balance of payments on the surface [13]; thus, a comprehensive understanding of deforestation, urbanization and LUCC changes is important for understanding the complex interaction between the atmosphere and the surface in water balance and energy cycles during climate change [14].
Since solar radiation is the main energy source of the earth’s surface, net radiation is an important component of heat balance and an indispensable parameter for the quantitative study of surface energy conversion and hydrothermal cycles [15,16,17]. Moreover, the net radiation formation process is complex; it is not only affected by meteorological factors such as total solar radiation, air temperature, humidity and wind speed, but is also related to the physical and biological properties of the underlying surface [18,19]. The energy balance between land and atmosphere includes radioactive and non-radioactive elements. The former includes shortwave and longwave radiation, while the latter includes sensible and latent heat fluxes. Their changes depend on LUCC and atmospheric conditions and significantly affect climate, including land surface temperature (LST) and water exchange (between land and atmosphere), and vice versa [20]. Furthermore, for a region, the land surface temperature is affected by altitude, population density, industrial development degree, forest coverage and so on [21,22]. In the analysis of surface physical and dynamic processes at different spatial scales, LST is an important parameter for studying surface radiation budget, global climate and environmental changes [23,24], so it is widely used in drought assessment, urban heat island monitoring, evapotranspiration estimation and regional hydrological and climate modeling [25,26,27].
In this study, four typical cities in the Yellow River Basin—Xining, Lanzhou, Zhengzhou and Jinan—were taken as study areas. These cities are the capital cities of Shandong province, Henan province, Gansu province and Qinghai province, respectively. These four cities are located in different climatic zones, with different altitudes and obvious geographical differentiation, but they are located in the same latitude zone, with the same intensity of illumination and radiation. Therefore, the study of the balance of surface energy in these four cities is convenient for comparing the biogeochemical effects caused by land change. Because of the diversity of underlying surfaces, it is necessary to perform further detailed analysis on the radiation budget of various underlying surfaces. Scholars have conducted much research on the energy and radiation balance of different underlying surfaces [28,29,30,31]. Considering the changes between cropland, grassland, forest, water and urban areas, and taking advantage of the ecological environments and spatial differences of these four cities, aiming at the climate problems caused by land use changes, the surface energy budget of these four cities was quantified, and the biophysical warming or cooling effects caused by LUCC were explored. The research results of this study can provide scientific reference for urban thermal environment regulation and climate change assessment.

2. Materials and Methods

2.1. Study Area

The Yellow River Basin is an important ecological barrier in northern China. It is also an important agricultural production base and energy base. This study selected four typical cities in the Yellow River Basin as study areas, as shown in Figure 1 and Figure 2. Xining is the city with the highest altitude, with an average altitude of 3137 m. Lanzhou is one of the important central cities in the western region, with an average altitude of 1520 m. Xining and Lanzhou have a typical temperate semi-arid climate. The average altitudes of Zhengzhou and Jinan are 108 m and 57.8 m, respectively. Moreover, Zhengzhou is representative of a fast-developing industrial city, while Jinan is one of the central cities in eastern China, in the middle and lower reaches of the Yellow River.

2.2. Dataset

Land cover data from ESA European Space Agency, with a 300 m spatial resolution, was used (http://maps.elie.ucl.ac.be/CCI/viewer/download.php, accessed on 15 September 2020). The demographic data and GDP data are from China Bureau of Statistics (http://www.stats.gov.cn/, accessed on 6 August 2021). Temperature interpolation data came from the Data Center of Resources and Environmental Sciences, Chinese Academy of Sciences (http://www.resdc.cn, accessed on 24 October 2020). The water vapor pressure data came from the Scientific Data Sharing Center of China Meteorological Administration (http://data.cma.cn/, accessed on 27 October 2020). The solar radiation data were downloaded from the Environmental Ecology Laboratory of Seoul National University, Korea (http://environment.snu.ac.kr, accessed on 1 November 2020). The remote sensing data for albedo, LST, land surface emissivity and LE were all from MODIS data products, provided by NASA (https://modis.gsfc.nasa.gov/, accessed on 3 October 2020). The MODIS data information is shown in Table 1. In this study, we synthesized the above data into annual average data in batches and applied it to the energy balance formula in Section 2.3.2.

2.3. Research Method

2.3.1. Land Classification

Based on the land cover data in 2000 and 2015, the land types of Jinan, Zhengzhou, Lanzhou and Xining were divided into five categories: cropland, grassland, forest, water area and urban area (Figure 3). After superimposing the data of the two periods, the changes in each land type could be obtained. The statistical results of land type change and proportion in the four cities in 2015 are shown in Table 2. For these four cities, it can be seen that, among the unchanged land types, cropland and grassland account for a higher proportion, and among the changed land types, the areas changing to urban areas account for a higher proportion than other types, especially the transition of cropland and grassland into urban areas.

2.3.2. Calculation of Surface Energy Balance and Warming Effects

According to Bastiaanssen et al. (1998) [32,33,34,35], we calculated the parameters that affect the energy balance. This calculation formula of net radiation is as follows:
R net = R ns + R nl
where R net   is net radiation, R ns is net shortwave radiation and R nl is net longwave radiation.
R ns = R ns ( d ) R ns ( t ) = ( 1 A ) R ns ( d )
where R ns ( d ) is downward shortwave radiation, R ns ( t ) is upward shortwave radiation, both in W/m2, and A refers to surface albedo.
R nl = R nl ( d ) R nl ( t ) = M s R nl ( d ) ( T a , M a ) R nl ( t ) ( T s , M s ) = M S ϑ M a T a 4 ϑ M s T s 4
where R nl ( d ) is downward longwave radiation, R nl ( t ) is upward longwave radiation, M s is the surface emissivity, M a is the emissivity of air, T a is the air temperature, T s is the land surface temperature, both in K, and ϑ is the Boltzmann constant, which is 5.67 × 10⁻⁸ W/m2/K4.
The calculation formula of air emissivity is as follows:
M a = 1 . 24 ( P / T s ) 1 7
In Equation (4), P is the water vapor pressure in hpa.
Here, R net is used to express the forcing of energy uptake caused by biogeochemical factors. The negative sign indicates that R net decreases with the increase of albedo, and LE represents the forcing of consuming R net on energy consumption. Therefore, LE R net in this study represents the final result of surface energy budget between energy intake and expenditure caused by LUCC. In the forcing balance, a larger LE R net reduces the energy of sensible heat flux and soil heat flux. Thus, when less energy is used to heat the atmosphere and surface temperature, it corresponds to a cooling feedback or a weak warming feedback. Conversely, lower values of LE R net equate to a stronger warming feedback [1,7]. The basic research framework is shown in Figure 4.

2.3.3. Data Processing

In this study, we used the land cover data from 2000 and 2015 and obtained the changes of different land types during the study period by superimposing the two periods of data (Figure 3). After synthesizing the annual data in batches, the factors affecting the surface energy balance were calculated through the formula for surface energy balance. By using regional statistics, we extracted the values of various factors of energy absorption and consumption of underground land from 2000 to 2015, including land surface temperature, surface albedo, net shortwave radiation, net longwave radiation, net radiation and latent heat flux. Based on the values of various factors under different land use types, we discussed the impacts of different land types on the surface energy budget and analyzed the changes in multi-year mean values of various factors in different study areas using trend analysis. Because land resources and human social development complement each other, land use types reflect social development to a certain extent. This study explored the changes of surface energy budget caused by land type changes from the perspective of biogeochemistry.

3. Results

3.1. Changes in Land Surface Temperature

LST is the basic determinant of land thermal behavior, because it controls the effective radiation temperature on the land surface [36]. Previous studies have shown that LST will decrease significantly with an increase of vegetation aggregation [37]. In this study, we extracted the LST changes in Jinan, Zhengzhou, Lanzhou and Xining during the period from 2000 to 2015 (Figure 5). It can be found that the LST in urban areas and urban expansion areas was higher, while the LST in forest and water areas was lower. In Jinan, Zhengzhou and Xining, the LST in urban areas was the highest, with multi-year mean values of 295.8 K, 298 K and 290.5 K, respectively. However, the LST high-value areas in Lanzhou were distributed in grassland and urban expansion areas. Furthermore, the lowest LST values in the four cities were water bodies and forest areas: in Jinan, the lowest LST value was in the water body area (291.2 K), and in Lanzhou, the lowest LST value was in the forest expansion area (289.1 K). Because the urban areas were mainly composed of impermeable surfaces, the surface evapotranspiration capacity was low, and the heat capacity was small, resulting in the surrounding temperature being higher than that of the area covered by forest [38]. Figure 6 shows the changing trend of the multi-year mean value of LST in four cities. From 2000 to 2015, the LST in Jinan, Zhengzhou and Lanzhou increased, while the LST in Xining decreased, but the trend was slow.

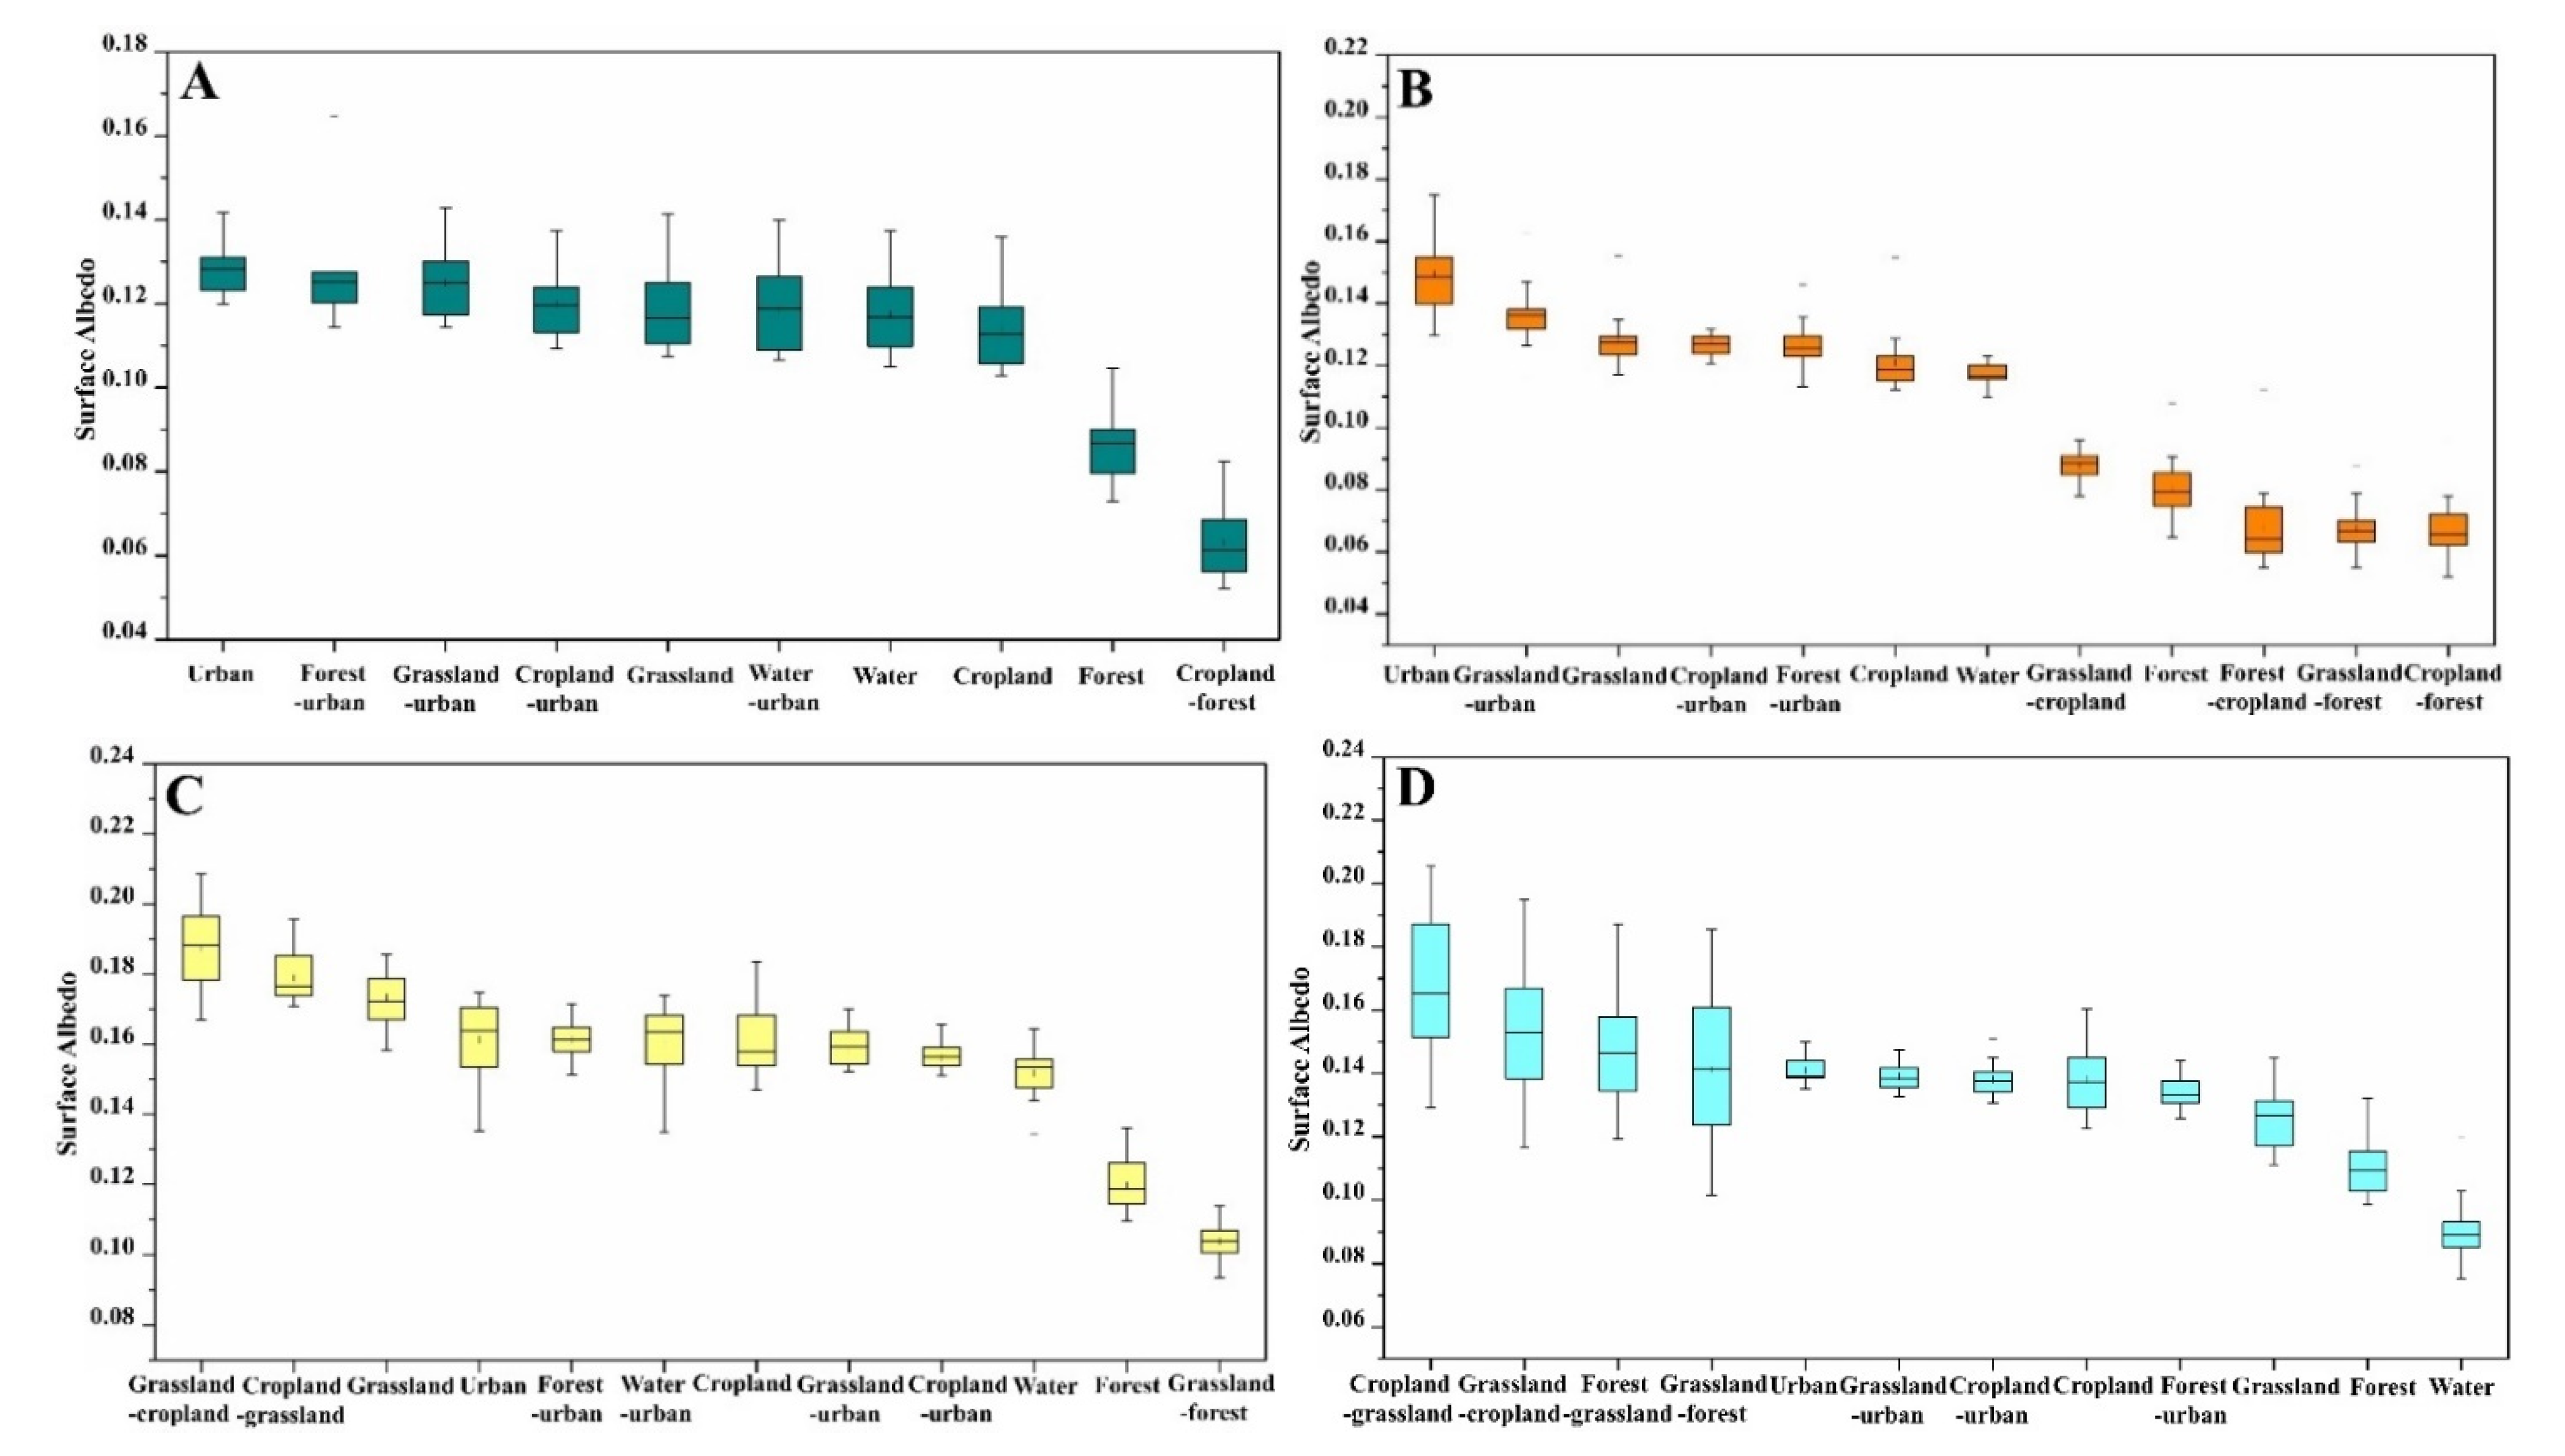
3.2. Surface Albedo Variation

Surface albedo refers to the ratio of the reflection flux of the surface to the incident solar radiation flux, which determines how much radiation can be absorbed by the underlying surface. Thus, it is an important parameter in the study of surface energy balance [39]. Figure 7 shows the statistical characteristic values of surface albedo in four cities from 2000 to 2015. Urban areas and grasslands have higher surface albedo, while forests and water bodies have lower albedo. In Jinan and Zhengzhou, the albedo of urban areas and urban extension areas was the highest, much higher than that of forests and forest extension areas. In Lanzhou and Xining, the albedo of cropland expansion areas and grassland expansion areas was larger, while the albedo of water areas, forests and forest expansion areas was smaller. The albedo of the four cities showed a downward trend, but the downward trend was not significant (Figure 8).

3.3. Changes of Surface Energy Intake

3.3.1. Shortwave Radiation and Longwave Radiation

Based on the land cover change from 2000 to 2015, we obtained data results for shortwave radiation in Jinan, Zhengzhou, Lanzhou and Xining. Figure 9 shows the statistical characteristic values of shortwave radiation in four cities based on land change types. In Jinan and Zhengzhou, the shortwave radiation in forests and cropland is higher, while that in grassland, urban areas and urban expansion areas was lower, which related to the higher surface albedo in grassland and urban areas and the lower surface albedo in forests and cropland. On the contrary, in Xining, at high altitude, the high-value areas of shortwave radiation were urban areas and urban expansion areas, while the low-value areas were forests and cropland. Furthermore, because of the high solar radiation, the multi-year average value of shortwave radiation in Xining was the largest. On the whole, there was little difference in net shortwave radiation under different land types in Lanzhou. The multi-year mean value of shortwave radiation from high to low was Xining > Lanzhou > Jinan > Zhengzhou, with the values of 143.7 W/m2, 140.3 W/m2, 118.8 W/m2 and 115.8 W/m2, respectively. Figure 10 shows that the shortwave radiation in the four cities had a downward trend; Jinan had the most obvious downward trend, with a multi-year trend value of −0.7 W / ( m 2 · year ) .
For the longwave radiation in these four cities, as shown in Figure 11 and Figure 12, the value of the old urban and urban expansion area was higher, while the longwave radiation value for forests and cropland was lower; the order of their multi-year mean values from high to low was Zhengzhou > Jinan > Lanzhou > Xining, with values of 835.4 W/m2, 792.4 W/m2, 294.9 W/m2, 15.1 W/m2, respectively. Therefore, the longwave radiation value was higher in areas greatly affected by human activities and lower in natural areas. From the trend of longwave radiation in cities from 2000 to 2015, it can be seen that the longwave radiation in the four cities was on the rise, with Zhengzhou having the largest increase, followed by Lanzhou, Xining and Jinan.

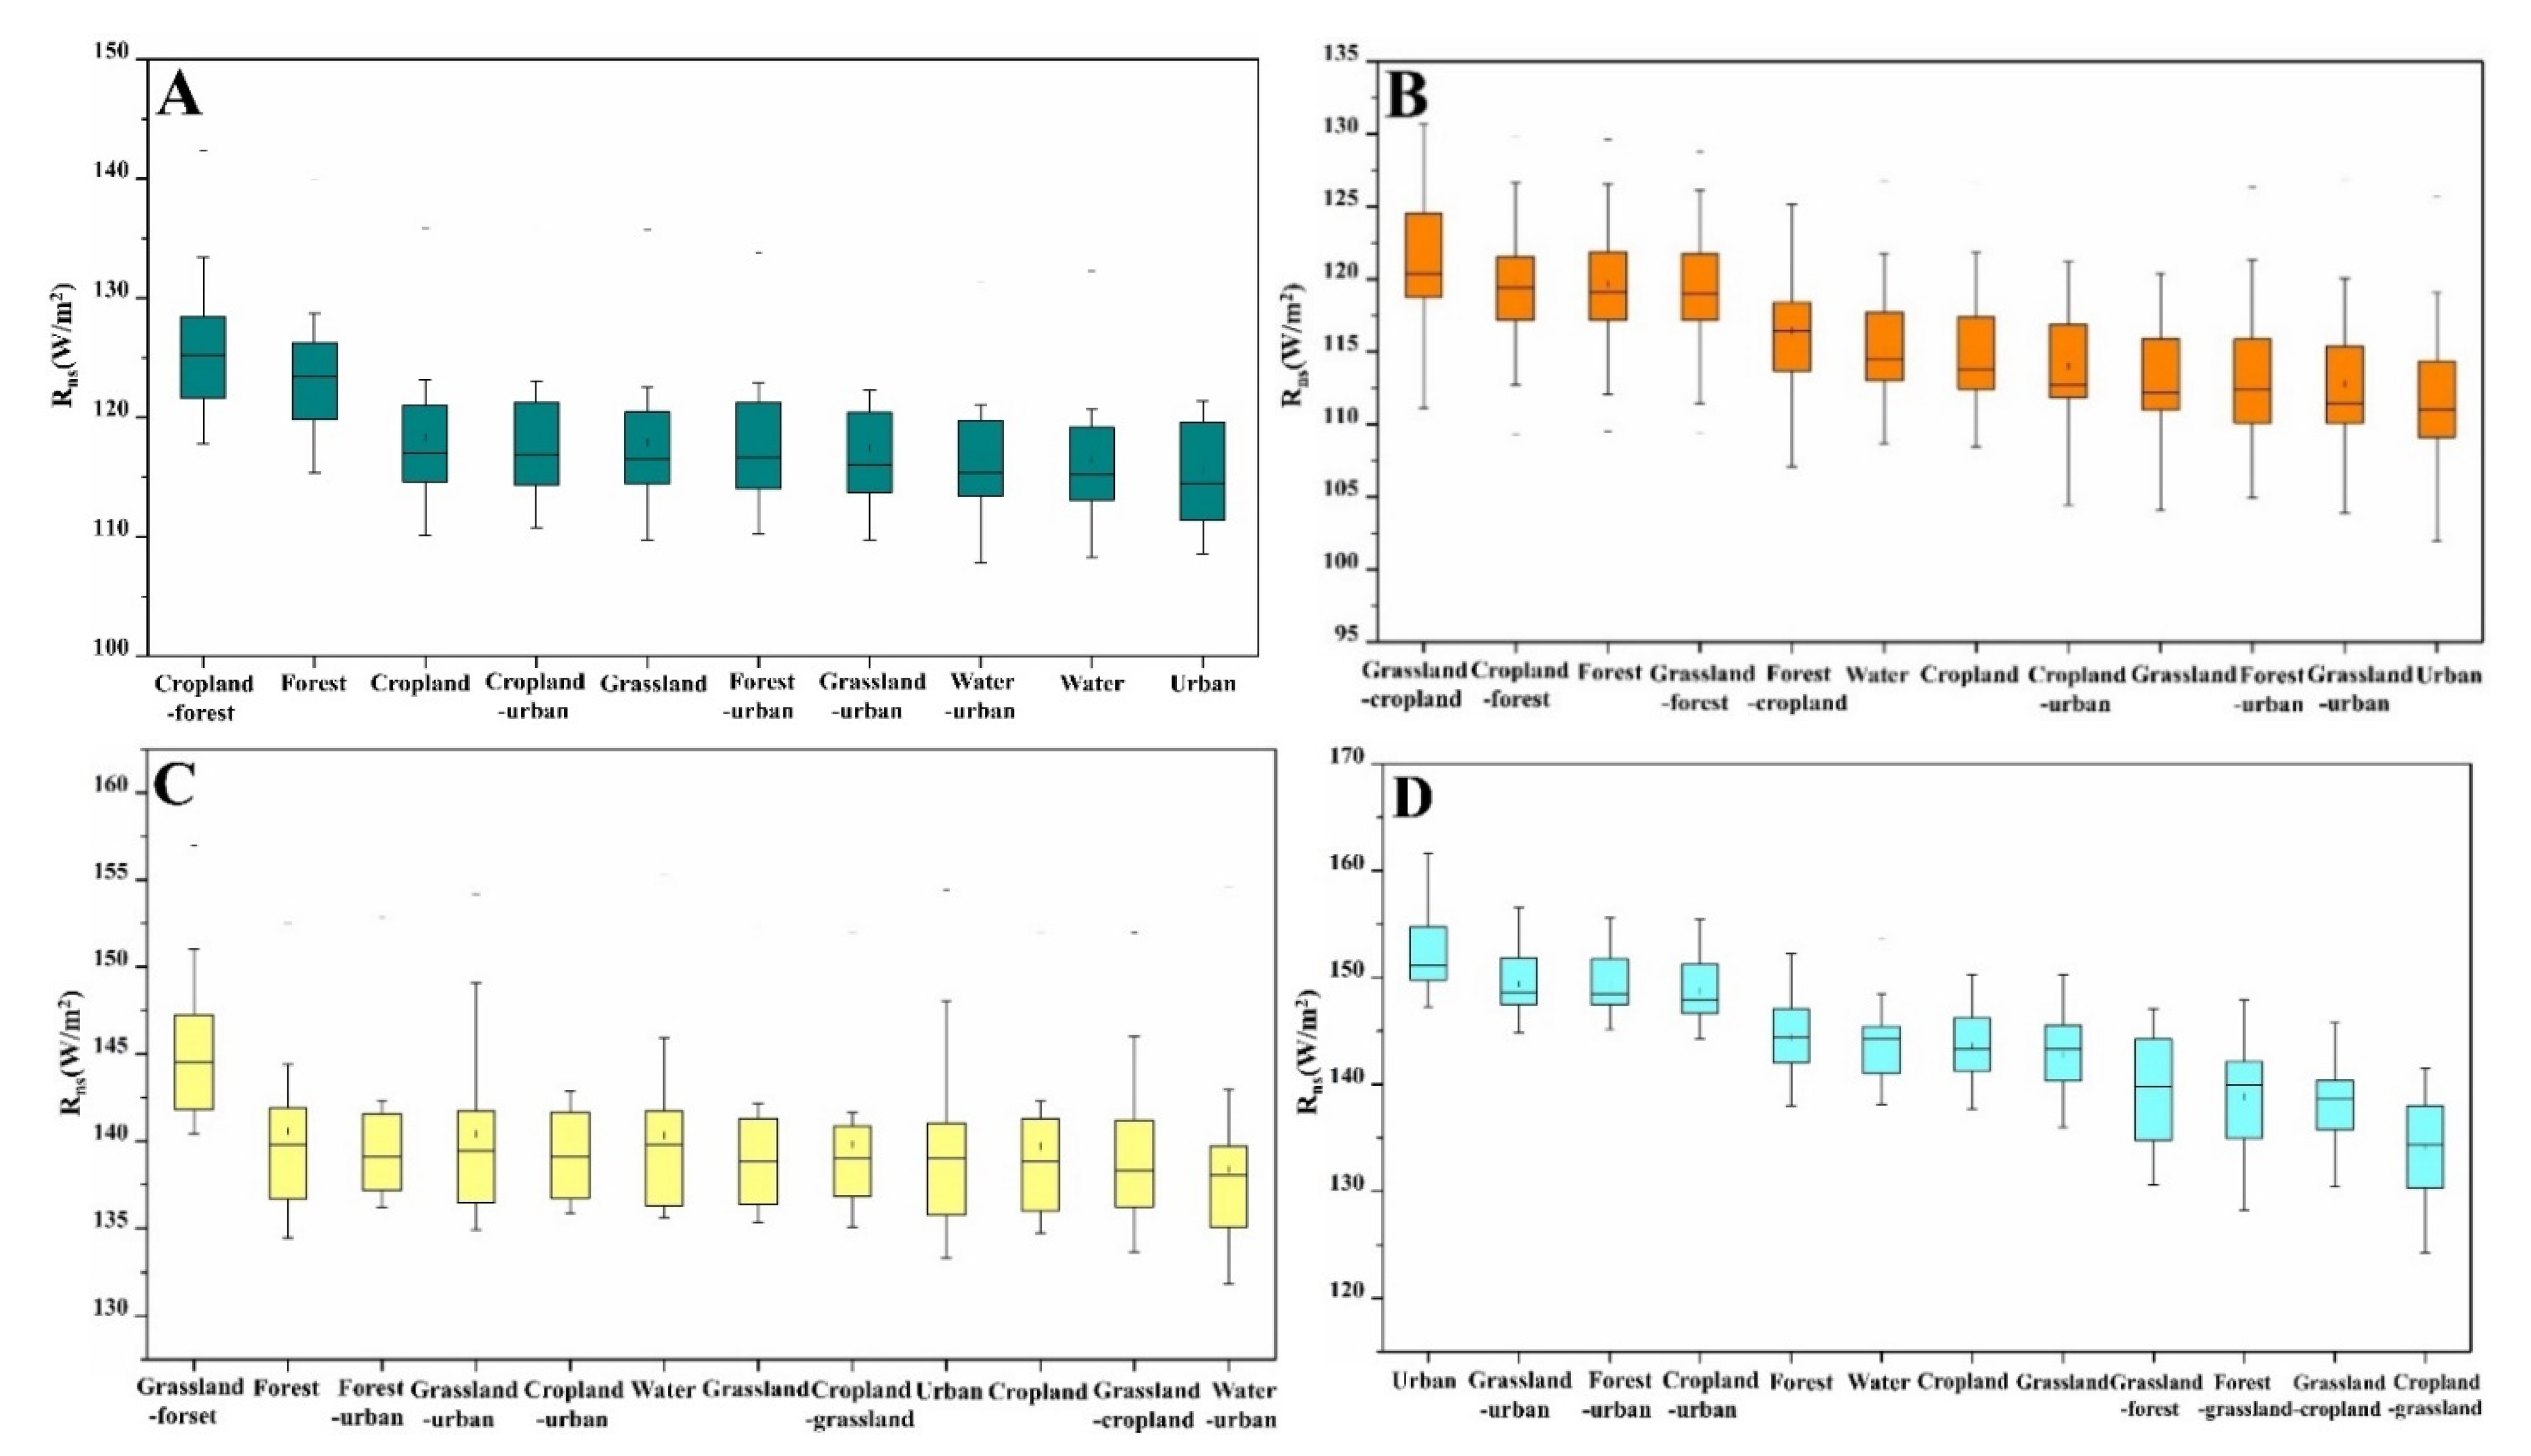
3.3.2. Changes in Net Radiation

The net radiation result was obtained by superimposing shortwave radiation and longwave radiation from 2000 and 2015. Figure 13 shows the statistical characteristic values of R n for various land types. The results show that the R n value was higher in areas greatly affected by human activities, such as urban expansion areas and old urban areas, but lower in grassland, forests and cropland. The R n value of the old urban areas in Jinan was 951.2 W/m2, and the lowest value of R n was 825.1 W/m2, in forests. In Zhengzhou, the R n value of the old urban area is the highest, at 1059.6 W/m2; the R n in forests and grassland converted to urban areas was 1060.1 W/m2 and 1057.9 W/m2, respectively, while the forest area, at 871.9 W/m2, had the lowest value. The land use type with the highest R n value in Lanzhou was the area where water had been converted to urban areas, with a value of 555.3 W/m2, and the lowest was the area where grassland had changed to forest, with a value of 318.8 W/m2. In Xining, the R n value in urban areas was higher, while that for forests and cropland was lower; that is, human activities increased the input of radiation energy.
According to the above results, when considering the control of the net radiation factor, we should not neglect the regulation of forest land. On the whole, Zhengzhou had a larger multi-year average value of 957.9 W/m2, followed by Jinan, with a multi-year average value of 928.2 W/m2, and Lanzhou and Xining with values of 408.8 W/m2 and 153.2 W/m2, respectively. The change in net radiation in the four cities showed an increasing trend, and the order of the trend value from high to low was Zhengzhou > Xining > Jinan > Lanzhou (Figure 14).

3.4. Analysis of the Change in the Surface Energy Expenditure

According to the results of latent heat flux from 2000 to 2015, the LE values for water and forests in the four cities were higher, and much higher than those in urban areas (Figure 15). In Jinan and Zhengzhou, the water area had the highest LE, with multi-year mean values of 94.4 W/m2 and 204.7 W/m2, respectively, and the LE in urban areas was the lowest, at 6.6 W/m2 and 3.7 W/m2, respectively. In Lanzhou, the forest had the highest LE value, 31.2 W/m2, followed by the areas where grassland had turned to forest, at 29.4 W/m2. On the contrary, in urban areas, the LE value was the lowest, at 3.6 W/m2. The highest values of LE in Xining were distributed in the areas where grassland expanded to cropland and forest, 40.1 W/m2 and 38 W/m2, respectively, and the lowest LE value was in urban areas: 2.8 W/m2. It can be seen from the above results that the latent heat flux was lower in urban areas, which were greatly influenced by human activities, while the latent heat flux was higher in water areas or natural areas, such as forests and grassland. That is to say, water and forest land cover play a key role in surface energy consumption. Therefore, it is urgent to strengthen the protection of forest areas and effectively control urban expansion, so as to improve the vegetation coverage and reduce the warming effect caused by deforestation and urban expansion. The annual mean values of LE in Jinan, Zhengzhou, Lanzhou and Xining all showed an upward trend during the study period, with Zhengzhou having the largest mean value of 44.9 W/m2, followed by Jinan with a mean value of 34.6 W/m2, and Xining and Lanzhou with values of 29.2 W/m2 and 19.8 W/m2, respectively. The rising trend of LE in Xining was the most obvious, with the largest multi-year trend value (Figure 16).

3.5. Comparison of Net Radiation and Latent Heat Flux

In this study, the difference between net radiation and latent heat flux represents the final result of forced balance between energy intake and expenditure caused by LUCC. It can be observed from the following figures (Figure 17 and Figure 18) that LE R net in urban areas and urban expansion areas was much smaller than that in natural areas such as forest land. During the study period, LE R net of all land types in Jinan, Zhengzhou and Lanzhou was negative; that is, the energy consumption was not enough to offset the energy intake, which represented the warming effect. Our results showed that there were not only negative values but also positive values of LE R net for various land types in Xining; the multi-year average of LE R net in urban areas was the smallest, followed by urban expansion areas, and in cropland expansion areas, forest expansion areas and grassland expansion areas, the multi-year average values of LE R net were positive, showing a weak cooling effect. By observing the trend of LE R net , it can be seen that the LE R net in Jinan increased, but the rising trend was not obvious. The other cities showed a decrease, especially in Zhengzhou, which had a multi-year trend value of −2.89 W / ( m 2 · year ) .

4. Discussion

Since the energy budget can directly affect LST, the energy consumption process could also react to LST, including latent heat flux, which could cause the change of LST [40]. Here, we explored the relationship between energy and temperature by comparing the correlation between LST and R net , LE, and LE R net (Figure 19). The results show that there were obvious differences in the regulating factors of LST in different cities. In Jinan and Zhengzhou, LST had a positive correlation with net radiation and a negative correlation with LE R net ; the effect of net radiation on LST was more obvious. However, in Lanzhou and Xining, LST was negatively correlated with net radiation and positively correlated with LE R net , and the correlation between LST and LE was obvious; that is, the regulation of latent heat flux on LST was more obvious.
Because of the differences in geographical location and land types in the four regions, there are significant differences in the correlation between each energy factor and LST. Under the background of rapid development of society, Jinan and Zhengzhou have experienced rapid population expansion and economic growth (Figure 2), with obvious changes in land scale. For Jinan and Zhengzhou, the proportion of urban expansion has increased, being much higher than that of Lanzhou and Xining. In addition, our research results showed that the net radiation value in urban areas was greater than that in other natural lands, while the latent heat flux value was the lowest. Urban expansion at the expense of natural land such as forests and cropland accelerated the growth of net radiation in Jinan and Zhengzhou and promoted the warming effect. On the contrary, it also can be seen from Figure 17 and Figure 19 that in Lanzhou and Xining, grassland and forests played a key role in energy consumption, and the rising trend of LE was higher than that in Jinan and Zhengzhou. In Xining, the area where grassland, forests and cropland expanded presented a weak cooling effect. Therefore, when analyzing the driving mechanism of land cover change in energy budget at a regional/local scale, fully considering the spatial heterogeneity of land cover types and quantitatively evaluating the radiation of different types of land cover changes and their temporal and spatial patterns [41,42] can deepen the understanding of the climate effect of land cover change and can provide a basis for future regional and global land use decision making [43,44].

5. Conclusions

In this study, multi-source data were used to quantify the results of warming or cooling due to changes in the energy balance caused by LUCC in four typical cities (Jinan, Zhengzhou, Lanzhou and Xining) in the Yellow River Basin in China. This study reached the following conclusions:
(1) The longwave radiation of the four cities has clearly increased, with the order of multi-year average from high to low being Zhengzhou > Jinan > Lanzhou > Xining. The high-value areas were the old urban areas and urban expansion areas, while the low-value areas were forests and cropland areas. The shortwave radiation showed a downward trend, with the largest multi-year average being Xining, followed by Lanzhou, Jinan, and Zhengzhou.
(2) The R net value of the four cities increased, and the multi-year average from high to low was Zhengzhou > Jinan > Lanzhou > Xining, with the increasing trend of R net in Zhengzhou being the most obvious. The R net value of the old urban areas and urban expansion areas was higher, while the low-value areas were mostly forests and forest expansion areas; this shows that human activities increased the input of ground energy and promoted a warming effect. Thus, when considering the control of the net radiation factor, the regulation of forest land should not be ignored.
(3) The LE of the four cities increased, and its multi-year trend value was Xining > Lanzhou > Jinan > Zhengzhou. The LE value of water and forest land was higher, which played a key role in the energy consumption on the ground. Therefore, the evaporation can be regulated by urban vegetation or water. It is thus urgent to strengthen the protection of forest areas and effectively control urban expansion, so as to improve the vegetation coverage and reduce deforestation.
(4) The LE R net mostly showed a downward trend, and the LE R net in areas greatly affected by human activities was much smaller than that in natural areas such as forests and grassland, which showed that human activities increased the warming trend. In Xining, the expansion of cropland, forests and grassland showed a weak cooling effect, while the multi-year average values of LE R net in Lanzhou, Jinan and Zhengzhou were all negative, showing a warming effect.
In Jinan and Zhengzhou, the regulating effect of R net on LST was more obvious, while in Lanzhou and Xining, the regulating effect of LE was more obvious. Because there are differences in how land cover changes in each city over the years, the results of energy budgets would be different, and the LST in different regions would be affected differently by the different surface energy factors. Therefore, when analyzing the urban heat island effect, the influence of net radiation and latent heat flux on LST or various land uses cannot be ignored. The boundary range and land type not only affects the heat island intensity but also affects the corresponding LST changes [7,15].

Author Contributions

Conceptualization, S.Z. and Y.C.; methodology, Q.C., S.Z., L.W., Y.C. and J.L.; software, Q.C. and M.Z.; validation, M.Z., D.L., W.T., X.Z., S.X. and S.Y.; formal analysis, Q.C., S.Z. and L.W.; investigation, Q.C. and S.Z.; resources, S.Z. and Y.C.; data curation, S.Z. and Y.C.; writing—original draft preparation, Q.C. and S.Z.; writing—review and editing, S.Z., L.W., Y.C. and J.L.; visualization, M.Z., D.L., W.T., X.Z., S.X. and S.Y.; supervision, S.Z.; project administration, S.Z.; funding acquisition, S.Z. and Y.C. All authors have read and agreed to the published version of the manuscript.

Funding

This research was funded by the National Natural Science Foundation of China, grant numbers 42005102, 42071415; the Second Tibetan Plateau Comprehensive Scientific Expedition, grant number 2019QZKK0104; the Qinghai Science and Technology Department Project, grant number 2020-ZJ-711; the Henan Science & Technology Think Tank Project, grant number HNKJZK-2021-35C; the Outstanding Youth Foundation of Henan Natural Science Foundation, grant number 202300410049; the National Key Research and Development Program of China, grant number 2021YFE0106700.

Data Availability Statement

The land cover data from ESA with 300 m spatial resolution were used, and the download address is (http://maps.elie.ucl.ac.be/CCI/viewer/download.php, accessed on 15 September 2020). Demographic data and GDP data are from the China Bureau of Statistics (http://www.stats.gov.cn/, accessed on 6 August 2021). Temperature interpolation data come from the Data Center of Resources and Environmental Sciences, Chinese Academy of Sciences (http://www.resdc.cn, accessed on 24 October 2020). The water vapor pressure data come from the Scientific Data Sharing Center of the China Meteorological Administration (http://data.cma.cn/, accessed on 27 October 2020). The solar radiation data were downloaded from the Environmental Ecology Laboratory of Seoul National University, Korea (http://environment.snu.ac.kr, accessed on 1 November 2020). The remote sensing data for albedo, LST, land surface emissivity and LE are all from MODIS data products, provided by NASA, from 2000 to 2015 (https://modis.gsfc.nasa.gov/, accessed on 3 October 2020).

Acknowledgments

The interval range vector data of this study are from the downstream scientific data sharing platform of the Yellow River, website address: http://henu.geodata.cn, accessed on 10 September 2020. This platform depends on the establishment of Henan University, the key laboratory of the Ministry of Education “Yellow River Middle and Digital Geography Laboratory”. Thanks to Scientific Research Start-up Funding of the Program Supporting Special Talent Zone (Henan University; to Zhaodong FENG). Thanks also to the reviewers who provided valuable comments to improve the paper.

Conflicts of Interest

The authors declare no conflict of interest.

References

  1. Chi, Q.; Zhou, S.; Wang, L.; Zhu, M.; Liu, D.; Tang, W.; Cui, Y.; Lee, J. Exploring on the eco-climatic effects of land use changes in the influence area of the Yellow River Basin from 2000 to 2015. Land 2021, 10, 601. [Google Scholar] [CrossRef]
  2. Huang, L.; Zhai, J.; Sun, C.; Liu, J.; Ning, J.; Zhao, G. Biogeophysical forcing of land-use changes on local temperatures across different climate regimes in China. J. Climate 2018, 31, 7053–7068. [Google Scholar] [CrossRef]
  3. Zhu, E.; Deng, J.; Zhou, M.; Gan, M.; Jiang, R.; Wang, K.; Shahtahmassebi, A. Carbon emissions induced by land-use and land-cover change from 1970 to 2010 in Zhejiang, China. Sci. Total Environ. 2018, 646, 930–939. [Google Scholar] [CrossRef]
  4. Yang, H.; Zhong, X.; Deng, S.; Su, H. Assessment of the impact of LUCC on NPP and its influencing factors in the Yangtze River basin, China. Catena 2021, 206, 105542. [Google Scholar] [CrossRef]
  5. Yang, W.; Long, D.; Bai, P. Impacts of future land cover and climate changes on runoff in the mostly afforested river basin in North China. J. Hydrol. 2019, 570, 201–219. [Google Scholar] [CrossRef]
  6. Wang, Q.; Cheng, L.; Zhang, L.; Liu, P.; Qin, S.; Liu, L.; Jing, Z. Quantifying the impacts of land-cover changes on global evapotranspiration based on the continuous remote sensing observations during 1982–2016. J. Hydrol. 2021, 598, 126231. [Google Scholar] [CrossRef]
  7. Zhou, S.; Wang, K.; Yang, S.; Li, W.; Zhang, Y.; Zhang, B.; Fu, Y.; Liu, X.; Run, Y.; Chubwa, O.G.; et al. Warming effort and energy budget difference of various human land use intensity: Case study of Beijing, China. Land 2020, 9, 280. [Google Scholar] [CrossRef]
  8. Zheng, L.; Qi, Y.; Qin, Z.; Xu, X.; Dong, J. Assessing albedo dynamics and its environmental controls of grasslands over the Tibetan Plateau. Agr. Forest Meteorol. 2020, 307, 108479. [Google Scholar] [CrossRef]
  9. Xiao, B.; Bowker, M.A. Moss-biocrusts strongly decrease soil surface albedo, altering land-surface energy balance in a dryland ecosystem. Sci. Total Environ. 2020, 741, 140425. [Google Scholar] [CrossRef] [PubMed]
  10. Susca, T. Enhancement of life cycle assessment (LCA) methodology to include the effect of surface albedo on climate change: Comparing black and white roofs. Environ. Pollut. 2012, 163, 48–54. [Google Scholar] [CrossRef] [PubMed]
  11. Sieber, P.; Ericsson, N.; Hansson, P.A. Climate impact of surface albedo change in Life Cycle Assessment: Implications of site and time dependence. Environ. Impact Asses. 2019, 77, 191–200. [Google Scholar] [CrossRef]
  12. Ramamurthy, P.; Sun, T.; Rule, K.; Bou-Zeid, E. The joint influence of albedo and insulation on roof performance: An observational study. Energy Build. 2015, 93, 249–258. [Google Scholar] [CrossRef] [Green Version]
  13. Jahangir, M.H.; Arast, M. Remote sensing products for predicting actual evapotranspiration and water stress footprints under different land cover. J. Clean Prod. 2020, 266, 121818. [Google Scholar] [CrossRef]
  14. Sannigrahi, S.; Bahtt, S.; Rahmat, S.; Paul, S.K.; Sen, S. Estimating global ecosystem service values and its response to land surface dynamics during 1995–2015. J. Environ. Manag. 2018, 223, 115–131. [Google Scholar] [CrossRef] [PubMed]
  15. Cui, Y.; Liu, J.; Hu, Y.; Wang, J.; Kuang, W. Modeling the radiation balance of different urban underlying surfaces. Sci. Bull. 2012, 57, 465–473. [Google Scholar] [CrossRef] [Green Version]
  16. Odongo, V.O.; Oel, P.R.; Tol, C.; Su, Z. Impact of land use and land cover transitions and climate on evapotranspiration in the Lake Naivasha Basin, Kenya. Sci. Total Environ. 2019, 682, 19–30. [Google Scholar] [CrossRef]
  17. Bry, K.; Bry, T.; Ojrzyńska, H.; Sayegh, M.A.; Gogowski, A. Variability and role of long-wave radiation fluxes in the formation of net radiation and thermal features of grassy and bare soil active surfaces in Wroclaw. Sci. Total Environ. 2020, 747, 141192. [Google Scholar]
  18. Golkar, F.; Rossow, W.B.; Sabziparvar, A.A. Refining surface net radiation estimates in arid and semi-arid climates of Iran. Adv. Space Res. 2018, 61, 2932–2941. [Google Scholar] [CrossRef]
  19. Meng, C.; Huang, C.; Dou, J.; Li, H.; Cheng, C. Key parameters in urban surface radiation budget and energy balance modeling. Urban. Clim. 2021, 39, 100940. [Google Scholar] [CrossRef]
  20. Umair, M.; Kim, D.; Choi, M. Impacts of land use/land cover on runoff and energy budgets in an East Asia ecosystem from remotely sensed data in a community land model. Sci. Total Environ. 2019, 684, 641–656. [Google Scholar] [CrossRef]
  21. Ezimand, K.; Azadbakht, M.; Aghighi, H. Analyzing the effects of 2D and 3D urban structures on LST changes using remotely sensed data. Sustain. Cities Soc. 2021, 74, 103216. [Google Scholar] [CrossRef]
  22. Aguilar-Lome, J.; Espinoza-Villar, R.; Espinoza, J.C.; Rojas-Acuña, J.; Willems, B.L.; Leyva-Molina, W.M. Elevation-dependent warming of land surface temperatures in the Andes assessed using MODIS LST time series (2000–2017). Int. J. Appl. Earth Obs. 2019, 77, 119–128. [Google Scholar] [CrossRef]
  23. Wang, W.; Samat, A.; Abuduwaili, J.; Ge, Y. Quantifying the influences of land surface parameters on LST variations based on GeoDetector model in Syr Darya Basin, Central Asia. J. Arid Environ. 2021, 186, 104415. [Google Scholar] [CrossRef]
  24. Zhao, J.; Zhao, X.; Liang, S.; Zhou, T.; Du, X.; Xu, P. Assessing the thermal contributions of urban land cover types. Landsc. Urban. Plan. 2020, 204, 103927. [Google Scholar] [CrossRef]
  25. Huh, Y.; Lee, J. Enhanced contextual forest fire detection with prediction interval analysis of surface temperature using vegetation amount. Int. J. Remote Sens. 2017, 38, 3375–3393. [Google Scholar] [CrossRef]
  26. Karnieli, A.; Agam, N.; Pinker, R.T.; Anderson, M.; Imhoff, M.L.; Gutman, G.G.; Panov, N.; Goldberg, A. Use of NDVI and land surface temperature for drought assessment: Merits and limitations. J. Climate 2010, 23, 618–633. [Google Scholar] [CrossRef]
  27. Huang, B.; Wang, J.; Song, H.; Fu, D.; Wong, K. Generating high spatiotemporal resolution land surface temperature for urban heat island monitoring. IEEE Geosci. Remote Sens. Lett. 2013, 10, 1011–1015. [Google Scholar] [CrossRef]
  28. Roerink, G.J.; Su, Z.; Menenti, M. S-SEBI: A simple remote sensing algorithm to estimate the surface energy balance. Phys. Chem. Earth 2000, 25, 147–157. [Google Scholar] [CrossRef]
  29. Deng, X.; Shi, Q.; Zhang, Q.; Shi, C.; Yin, F. Impacts of land use and land cover changes on surface energy and water balance in the Heihe River Basin of China, 2000–2010. Phys. Chem. Earth 2015, 79, 2–10. [Google Scholar] [CrossRef]
  30. Su, Y.; Liu, L.; Wu, J.; Chen, X.; Shang, J.; Ciais, P.; Zhou, G.; Lafortezza, R.; Wang, Y.; Yuan, W.; et al. Quantifying the biophysical effects of forests on local air temperature using a novel three-layered land surface energy balance model. Environ. Int. 2019, 132, 105080. [Google Scholar] [CrossRef]
  31. Jia, A.; Ma, H.; Liang, S.; Wang, D. Cloudy-sky land surface temperature from VIIRS and MODIS satellite data using a surface energy balance-based method. Remote Sens. Environ. 2021, 263, 112566. [Google Scholar] [CrossRef]
  32. Bastiaanssen, W.G.M.; Menenti, M.; Feddes, R.A.; Holtslag, A.A.M. A remote sensing surface energy balance algorithm for land (SEBAL).1. Formulation. J. Hydrol. 1998, 212, 198–212. [Google Scholar] [CrossRef]
  33. Rwasoka, D.T.; Gumindoga, W.; Gwenzi, J. Estimation of actual evapotranspiration using the Surface Energy Balance System (SEBS) algorithm in the Upper Manyame catchment in Zimbabwe. Phys. Chem. Earth 2011, 36, 736–746. [Google Scholar] [CrossRef]
  34. Laipelt, L.; Kayser, B.; Fleischmann, A.S.; Ruhoff, A.; Bastiaanssen, W.; Erickson, T.A.; Melton, F. Long-term monitoring of evapotranspiration using the SEBAL algorithm and Google Earth Engine cloud computing. ISPRS J. Photogramm. 2021, 178, 81–96. [Google Scholar] [CrossRef]
  35. Webster, E.; Ramp, D.; Kingsford, R.T. Spatial sensitivity of surface energy balance algorithms to meteorological data in a heterogeneous environment. Remote Sens. Environ. 2016, 187, 294–319. [Google Scholar] [CrossRef]
  36. Azmi, R.; Tekouabou Koumetio, C.S.; Diop, E.B.; Chenal, J. Exploring the relationship between urban form and land surface temperature (LST) in a semi-arid region Case study of Ben Guerir city—Morocco. Environ. Chall. 2021, 5, 100229. [Google Scholar] [CrossRef]
  37. Wang, X.; Zhang, B.; Xu, X.; Tian, J.; He, C. Regional water-energy cycle response to land use/cover change in the agro-pastoral ecotone, Northwest China. J. Hydrol. 2020, 580, 124246. [Google Scholar] [CrossRef]
  38. Paciolla, N.; Corbari, C.; Hu, G.; Zheng, C.; Menenti, M.; Jia, L.; Mancini, M. Evapotranspiration estimates from an energy-water-balance model calibrated on satellite land surface temperature over the Heihe basin. J. Arid Environ. 2021, 188, 104466. [Google Scholar] [CrossRef]
  39. Tang, X.; Cui, Y.; Li, N.; Fu, Y.; Liu, X.; Run, Y.; Li, M.; Zhao, G.; Dong, J. Human activities enhance radiation forcing through surface albedo associated with vegetation in Beijing. Remote Sens. 2020, 12, 837. [Google Scholar] [CrossRef] [Green Version]
  40. Rahimzadegan, M.; Janani, A.S. Estimating evapotranspiration of pistachio crop based on SEBAL algorithm using Landsat 8 satellite imagery. Agr. Water Manag. 2019, 217, 383–390. [Google Scholar] [CrossRef]
  41. Zhong, J.; Liu, J.; Jiao, L.; Lian, X.; Xu, Z.; Zhou, Z. Assessing the comprehensive impacts of different urbanization process on vegetation net primary productivity in Wuhan, China, from 1990 to 2020. Sustain. Cities Soc. 2021, 75, 103295. [Google Scholar] [CrossRef]
  42. Liu, Y.; Zhang, M.; Li, Q.; Zhang, T.; Yang, L.; Liu, J. Investigation on the distribution patterns and predictive model of solar radiation in urban street canyons with panorama images. Sustain. Cities Soc. 2021, 75, 13275. [Google Scholar] [CrossRef]
  43. He, J.; Wu, Y.; Wu, J.; Li, S.; Liu, F.; Zhou, J.; Liao, M. Towards cleaner heating production in rural areas: Identifying optimal regional renewable systems with a case in Ningxia, China. Sustain. Cities Soc. 2021, 75, 103288. [Google Scholar] [CrossRef]
  44. Yang, L.; Ren, Q.; Zheng, K.; Jiao, Z.; Ruan, X.; Wang, Y. Migration of heavy metals in the soil-grape system and potential health risk assessment. Sci. Total Environ. 2021, 806, 150646. [Google Scholar] [CrossRef] [PubMed]
Figure 1. The location of four cities (Xining, Lanzhou, Zhengzhou and Jinan) in the Yellow River Basin.
Atmosphere 12 01374 g001
Figure 2. Statistical histogram of total population and Gross Domestic Product (GDP) in Xining, Lanzhou, Zhengzhou and Jinan from 2000 to 2015.
Atmosphere 12 01374 g002
Figure 3. Spatial distribution of land use types in Jinan, Zhengzhou, Lanzhou and Xining in 2015. Connectors indicate the transfer of land types from 2000 to 2015. For example, Cropland-urban indicates that cropland areas have turned into urban areas. ((A) Jinan City, (B): Zhengzhou City, (C): Lanzhou City, (D): Xining City).
Atmosphere 12 01374 g003
Figure 4. Basic research framework for energy budget feedback of land use change.
Atmosphere 12 01374 g004
Figure 5. Statistical characteristic values of land surface temperature based on different land types from 2000 to 2015 ((A) Jinan City, (B) Zhengzhou City, (C) Lanzhou City, (D) Xining City. LST here is in kelvin).
Atmosphere 12 01374 g005
Figure 6. Trend of land surface temperature from 2000 to 2015 ((A) Jinan City, (B) Zhengzhou City, (C) Lanzhou City, (D) Xining City).
Atmosphere 12 01374 g006
Figure 7. Statistical characteristic values of surface albedo based on different land types from 2000 to 2015 ((A) Jinan City, (B) Zhengzhou City, (C) Lanzhou City, (D) Xining City).
Atmosphere 12 01374 g007
Figure 8. Trend of surface albedo from 2000 to 2015 ((A) Jinan City, (B) Zhengzhou City, (C) Lanzhou City, (D) Xining City).
Atmosphere 12 01374 g008
Figure 9. Statistical characteristic values of shortwave radiation based on different land types from 2000 to 2015 ((A) Jinan City, (B) Zhengzhou City, (C) Lanzhou City, (D) Xining City).
Atmosphere 12 01374 g009
Figure 10. Trend of shortwave radiation from 2000 to 2015 (A): Jinan City, (B): Zhengzhou City, (C): Lanzhou City, (D): Xining City).
Atmosphere 12 01374 g010
Figure 11. Statistical characteristic values of longwave radiation based on different land types from 2000 to 2015 ((A) Jinan City, (B) Zhengzhou City, (C) Lanzhou City, (D) Xining City).
Atmosphere 12 01374 g011
Figure 12. Trend of longwave radiation from 2000 to 2015 ((A): Jinan City, (B): Zhengzhou City, (C): Lanzhou City, (D): Xining City).
Atmosphere 12 01374 g012
Figure 13. Statistical characteristic values of net radiation based on different land types from 2000 to 2015 ((A) Jinan City, (B) Zhengzhou City, (C) Lanzhou City, (D) Xining City).
Atmosphere 12 01374 g013
Figure 14. Trend of net radiation from 2000 to 2015 ((A) Jinan City, (B) Zhengzhou City, (C) Lanzhou City, (D) Xining City).
Atmosphere 12 01374 g014
Figure 15. Statistical characteristic values of LE based on different land types from 2000 to 2015 ((A): Jinan City, (B): Zhengzhou City, (C): Lanzhou City, (D): Xining City).
Atmosphere 12 01374 g015
Figure 16. Trend of LE from 2000 to 2015 ((A) Jinan City, (B) Zhengzhou City, (C) Lanzhou City, (D) Xining City).
Atmosphere 12 01374 g016
Figure 17. Statistical characteristic values of LE R net based on different land types from 2000 to 2015 ((A) Jinan City, (B) Zhengzhou City, (C) Lanzhou City, (D) Xining City).
Atmosphere 12 01374 g017
Figure 18. Trend of LE R net from 2000 to 2015 ((A) Jinan City, (B) Zhengzhou City, (C) Lanzhou City, (D) Xining City).
Atmosphere 12 01374 g018
Figure 19. Correlation between LST and R net , LE, and LE R net under five land types (blue dots and lines represent scatter plots of LST and R net , red dots and lines represent scatter plots of LST and LE, and green dots and lines represent scatter plots of LST and LE R net . ((A) Jinan City, (B) Zhengzhou City, (C) Lanzhou City, (D) Xining City).
Atmosphere 12 01374 g019
Table 1. Moderate Resolution Imaging Spectroradiometer (MODIS) data items and descriptions.
DataTime ResolutionSpatial ResolutionData Resource
Albedodaily500 mMCD43A3
Temperature (LST)daily1 kmMOD11A1
Latent heat flux (LE)8 times daily500 mMOD16A2
Emissivitydaily1 kmMOD11A1
Table 2. Statistical table of land type change and proportion in four cities.
CityLand Use TypeProportionLand Use TypeProportion
JinanCropland43%Cropland to forest≈0%
Grassland34%Cropland to urban3%
Forest9%Grassland to urban5%
Water1%Forest to urban≈0%
Urban3%Water to urban≈0%
ZhengzhouCropland68.7%Grassland to cropland0.02%
Grassland8.8%Grassland to forest0.14%
Forest7.9%Grassland to urban8.8%
Water0.5%Cropland to urban5.5%
Urban3.4%Forest to urban0.2%
Cropland to forest0.2%Forest to cropland≈0%
LanzhouCropland12.8%Grassland to cropland0.03%
Grassland70%Grassland to forest0.02%
Forest9%Cropland to urban0.1%
Water0.1%Grassland to urban1%
Urban1%Forest to urban0.1%
Cropland to grassland0.7%Water to urban0.01%
XiningCropland12%Grassland to cropland0.1%
Grassland77%Grassland to forest0.01%
Forest1%Cropland to urban0.4%
Water0.07%Grassland to urban1%
Urban0.5%Forest to urban0.2%
Cropland to grassland0.2%Forest to grassland0.2%
Publisher’s Note: MDPI stays neutral with regard to jurisdictional claims in published maps and institutional affiliations.

