Article

Drought Trends in the Polish Carpathian Mts. in the Years 1991–2020

Faculty of Geography and Geology, Institute of Geography and Spatial Management, Jagiellonian University, 7 Gronostajowa St., 30-387 Kraków, Poland
*
Author to whom correspondence should be addressed.
Atmosphere 2021, 12(10), 1259; https://doi.org/10.3390/atmos12101259
Submission received: 28 July 2021 / Revised: 20 September 2021 / Accepted: 20 September 2021 / Published: 27 September 2021

Abstract

:
Mountains are highly sensitive to the effects of climate change, including extreme short- and long-term weather phenomena. Therefore, in spite of relatively high annual precipitation totals, mountains might become endangered by droughts. The paper presents drought trends in the Polish Carpathians located in Central Europe. Data from the period 1991–2020 from 12 meteorological stations located in various vertical climate zones of the mountains were used to define drought conditions using the following indices: Standardized Precipitation (SPI), Standardized Precipitation Evapotranspiration (SPEI), Relative Precipitation (RPI) and Sielianinov. Additionally, four forest drought indices were used in order to estimate the impact of drought on beech as a typical Carpathian tree species, i.e., the Ellenberg (EQ), Forestry Aridity (FAI), Mayr Tetratherm (MT) and De Martonne Aridity (AI) indices. Statistically significant but weak trends were obtained for the 6-month SPI for four stations (indicating an increase in seasonal to mid-term precipitation), for the 1-month SPEI for three stations, for the 3-month SPEI for four stations, and for MT for all stations (indicating an increase in drought intensity). The analysis of dry month frequency according to particular indices shows that at most of the stations during the last decade of the study period, the frequency of dry months was much higher than in previous decades, especially in the cold half-year. Two zones of the Polish Carpathians are the most prone to drought occurrence: the peak zone due to the shift in climatic vertical zones triggered by the air temperature increase, and the forelands and foothills, together with basins located about 200–400 m a.s.l., where the mean annual air temperature is the highest in all the vertical profile, the annual sums of precipitation are very diversified, and the conditions for beech are already unfavorable.

1. Introduction

Drought is a phenomenon that negatively affects many economic sectors. Depending on the duration, effects and intensity, drought can be classified into four types: meteorological, agricultural, hydrological and socio-economic [1]. According to IPCC [2], mountains are among the areas most endangered by climate change, and droughts have been observed and are predicted in various mountain ranges, for example, in the Alps [3]. The pan-European study showed that in the 1990s and 2000s, drought hotspots were identified in the Mediterranean and Carpathian Regions; in the latter, drought severity and duration were highest in Hungary and Slovakia [4]. In the period 1961–2010, the worst droughts occurred in 1990, 2000, and 2003; less intense or prolonged droughts took place in 1964, 1970, 1973/74, 1983, 1987, 1992, and 2007 [5]. The Carpathians are located in Central Europe where the future drought risk is estimated to be relatively high with projected increases in hydrological, agricultural and ecological droughts at mid-century warming levels of 2 °C or above, regardless of greenhouse gas emission scenarios [6]. The Carpathian region includes the Carpathian Mts. and the Pannonian Basin. Studies concerning droughts in the whole region were based on gridded data (e.g., [5,7,8]) and showed that the region’s lowlands are much more endangered than the mountains. National-level studies confirmed the results for the lowlands and revealed the complexity of the issue in the mountains. In the lowlands of Hungary, Serbia, Romania and Slovakia, droughts have already caused significant agricultural yield losses in recent decades ([9,10,11]). Studies for the Carpathian Mts. are more limited and encompass only a few mountain ranges. For the part of the Western Carpathians located in Slovakia, in the period 1951–2007 precipitation exceeded potential evapotranspiration [9,12]. Those results have been confirmed for the upper Hron region [13]. In a study for Romania, with data for the period 1961–2010, it was shown that drought may affect areas with both low and high precipitation averages, and can occur in mountains or lowlands. Large-scale atmospheric circulation is the major drought driver in Romania in winter, while thermodynamic factors (such as air temperature and humidity levels) are the major drivers in summer. The Carpathian mountain chain itself is the second regional factor influencing drought spatial variability, triggering differences between intra-Carpathian and extra-Carpathian regions in wintertime [14]. The Tatra Mts are the highest range in the Carpathians, located at the border between Poland and Slovakia. For the Slovakian part, data from the period 1961–2010 were used to show that the occurrence of drought has a cyclic pattern over an approximately 30-year period. The core areas of the biosphere reserve of the Tatra National Park inhabited by unique species (altitudes over 1500 m a.s.l.) are in the relatively “drought-safe altitudinal zone”. Unfortunately, ecosystems at lower altitudes (up to 900 m a.s.l.) could be impacted by drought due to a lower precipitation surplus. The occurrence of drought episodes was influenced by the precipitation shadow of the Tatra Mts range and of the surrounding mountains situated to their north and northwest. Thus the occurrence of drought is more likely in the south and southeastern regions of the mountains than on the windward north or northeastern parts. In addition, another drought-prone area was indicated in the Western Tatra Mts. This area is influenced by the Oravsk’e Beskydy and Oravsk’a Magura ranges located to the northwest [15]. A study concerning the Polish part of the Tatra Mts was compared with a study for the Ukrainian Carpathians for the period 1984–2015, concerning the occurrence of dry months. At least one extremely dry month at each meteorological station was detected, but only in November 2011 was an extreme drought at all the stations observed. That was a month with precipitation less than 5% of the long-term average at specific meteorological stations [16]. In Poland, atmospheric drought is observed most often from April to September [17], and it affects mainly the lowlands where agriculture is concentrated [18,19]. The Carpathians receive much more precipitation than the rest of the country (with the exception of the Sudeten Mts where precipitation is comparable), but long periods without precipitation have been observed more frequently during the last few decades both on the mountain foreland [20] and on the mountain ranges [21,22]. Such a tendency combined with increased runoff and decreased retention (due to human activity) is a huge disadvantage for water resource management, and for the functioning of ecosystems. Additionally, an increase in hydrological drought risk has been observed in the Carpathians over the period 1901–2002 [23]. Agricultural drought has been studied for Poland for the period 1961–2010, but mountain areas were excluded from that research. However, the study showed that foreland areas were relatively little endangered by agricultural drought [24].
In spite of receiving the highest annual precipitation totals, in comparison to the rest of the country, the Polish Carpathians are affected by current climate change too, and drought has to be considered one of the potential new threats to the region. Therefore, this paper is aimed to show whether atmospheric drought risk varies in the vertical climatic profile of the Polish Carpathians and whether the eastern part of the mountain chain is more endangered by drought than the western part due to more continental climatic conditions. This aspect of the present climate has not yet been studied for that part of the Carpathians in contrast to some other parts. The present paper shows variability and trends in atmospheric drought occurrence in the most recent 30-year period. The middle of the 1980s represents a turning point for all the climatic variables in the Carpathian region [25] and shows the beginnings of presently observed climate change. The data from the period 1991–2020 represent the current long-term climatic period characterized by ecosystems entering a new state of dynamic balance. The Polish Carpathians are not an important agricultural region in the country; the main economic sector developed there is tourism and the properties of the natural environment are one of the most important factors in its development. The Carpathians, apart from offering picturesque landscapes, are a European biodiversity hotspot, with rich flora and endemic plants, and including the most extensive primeval forests across the whole of Europe; there are many different bird species and it is home to the largest communities of carnivores and predators such as bears and wolves [5,26]. Beech is the main species of the Dentario glandulosae-Fagetum community, a typical element of the Carpathian environment. Therefore, forest drought indices have also been used in the present study to estimate trends in atmospheric conditions favorable for beech. This is one of the indicators of the long-term impact of the drought trend on the natural environment of the Carpathians.

2. Study Area

The Polish Carpathian Mts. are part of the huge Carpathian mountain chain in Central Europe. It is divided into the Southern Carpathians (located in Romania), the Eastern Carpathians (Ukraine, Slovakia, Hungary, Poland), and the Western Carpathians (Poland, Slovakia, Czech Republic, Hungary, Austria). The relief of the Carpathians varies from undulating foothills to typical alpine landscapes in the Tatra, Rodna, Fagaras, and Retezat mountains [27]. The highest peaks can be found in the Tatra Mts, in Slovakia: Gerlach, 2655 m a.s.l.; and in the Fagaras Mts, in Romania: Moldoveanu, 2543 m a.s.l. As much as 88% of the Carpathian area located in Poland belongs to the Western Carpathians [28]. The climatic and hydrological conditions of the Polish Carpathians have been the subject of many studies, for example, [29,30,31,32,33,34,35], but rarely in the context of atmospheric drought as it is the region with the highest precipitation on a national scale. Most of the climatic parameters show increasing climate continentality from the west toward the east; for example, the mean annual air temperature range increases by 0.49 °C per degree of longitude on convex landforms, and by 0.35 °C on concave ones [31]. Even more important are changes in climatic conditions with altitude which are visible as vertical climate-vegetation zones [29]. The location of zonal boundaries (i.e., altitudes where a certain mean annual air temperature is found) depends on the scale of a particular mountain range, slopes aspect, the main geomorphological features and the prevailing direction of air mass advection [36]. According to the original vertical zone pattern [29], the study area contains six zones from “cold” with a mean annual air temperature from −4 to −2 °C, to “moderately warm” with a mean temperature from 6 to 8 °C. However, one of the effects of global warming is a shift in zonal boundaries [33] and this will be discussed further in the present study. The vertical climate-vegetation zone that occupies the largest area in the Polish Carpathians is that of deciduous forest, with its dominating Dentario glandulosae-Fagetum plant community [37]. European beech (Fagus sylvatica) is the main species of that community. The deciduous forest zone is located in the mountain foothills and on medium-height mountain ranges which are areas of intensive anthropopressure due to tourist activity. Therefore, a potential impact of drought on beech forest conditions will be presented later in the paper.

3. Materials and Methods

The data used in the present study come from 12 meteorological stations located in the Polish Carpathians (Figure 1 and Table 1). The stations represent the highest parts of the Carpathians, that is, the peaks of the Tatra Mts (Kasprowy Wierch) and the neighboring basin (Zakopane), the Beskidy ranges which are medium-height mountains (Limanowa, Nowy Sącz, Krynica, Lesko and Komańcza), the foothills (Gaik-Brzezowa, Łazy and Bielsko-Biała), and the foreland (Kraków and Katowice). The stations in Gaik-Brzezowa and Łazy belong to the Institute of Geography and Spatial Management, Jagiellonian University, Kraków, while the others are administered by the Institute of Meteorology and Water Management—National Research Institute. The spatial distribution of the stations allows drought occurrence to be studied in the Polish Carpathians both vertically and from west to east.
The data used come from the 30-year period 1991–2020 (while for Gaik-Brzezowa the data cover that of 1991–2019) and consist of mean monthly air temperatures and monthly precipitation totals. The choice of study period is linked to data availability and to the fact that since the 1990s, a significant change in climatic conditions has begun on both global and regional scales [38]. Therefore, the analyses presented show the contemporary situation and trends which are the effect of the present climate drivers. The data were used first to determine the variability of air temperature and precipitation in the study period and to distinguish areas with different air temperature and precipitation patterns.
Then the data were used to calculate indices widely used to determine the occurrence of drought (see also Appendix A):
  • SPI (Standardized Precipitation Index) [39]: it is based on the probability of precipitation which is the only input parameter. SPI was calculated for 1-, 3- and 6- monthly timescales for each station: SPI ≤−2.0—extreme drought, −1.99 < SPI ≤ −1.50—strong drought, −1.49 < SPI ≤ −1.00—moderate drought, −0.99 < SPI < 0.99 near normal conditions, 1.0 < SPI < 1.49 moderately wet, 1.5 < SPI < 1.99 very wet.
  • RPI (Relative Precipitation Index) is the ratio of precipitation sum for the given period and the long-term average for the same period expressed in percent [40]. It was calculated for each month and station; the values for particular months were interpreted following the intensity scale: <25%—extremely dry, 25–50%—very dry, 51–75%—dry, 76–125%—normal, 126–150%—wet, 151–200%—very wet, >200%—extremely wet.
  • Selianinov index describes humidity conditions in relation to the needs of the environment; the volume of precipitation is determined together with the potential for its use by plants, depending on the thermal conditions [41]. According to its formula (Appendix A), it was calculated for those months only when mean daily air temperature exceeded 10 °C; then the months were classified as follows: <0.4—extremely dry, 0.4–0.7—very dry, 0.8–1.0—dry, 1.1–1.3—moderately dry, 1.4–1.6—optimal, 1.7–2.0—moderately wet, 2.1–2.5—wet, 2.6–3.0—very wet, >3.0—extremely wet.
  • SPEI (Standardized Precipitation Evapotranspiration Index) is a standardized monthly climatic balance computed as the difference between the cumulative precipitation and the potential evapotranspiration [42]. It was calculated for 1-, 3- and 6-each monthly timescales and for each station. The following drought classes were applied: ≥2—exceptionally wet, 1.6–1.99—extremely wet, 1.3–1.59—severely wet, 0.8–1.29—moderately wet, 0.5–0.79—slightly wet, 0.49 to −0.49—normal, −0.5 to −0.79—slightly dry, −0.8 to −1.29—moderate drought, −1.3 to −1.59—severe drought, −1.6 to −1.99—extreme drought, ≤−2—exceptional drought.
In order to estimate the impact of drought on beech, the following indices of forest drought were used and calculated for each year and station:
  • EQ (Ellenberg index) [43]; the values optimal for beech are <30 while at EQ > 40, beech cannot survive.
  • FAI (Forestry Aridity Index) [44]; the values optimal for beech are at FAI < 4.75.
  • MT (Mayr Tetratherm Index) [45]; the values optimal for beech are 13–18 °C [46]
  • AI (De Martonne Aridy Index) [47]; the values optimal for beech are 35–40 [46].
The SPI index was calculated with SPI Generator software [48], SPEI was calculated with the Package ‘SPEI’ software (https://cran.r-project.org/web/packages/SPEI/SPEI.pdf, accessed on 20 August 2021) and other indices were calculated with MS Excel, with the formulas listed in Appendix A and provided in the publications mentioned above.
In the calculation of SPI and RPI, only precipitation data are taken into consideration, while the Selianinov index and SPEI include also air temperature data. The forest drought indices are not only based on data for air temperature and precipitation but are calculated at various temporal resolutions, which allows different aspects of the phenomenon to be observed.
The series of air temperature, precipitation and index values were tested using regression analysis; linear trends were determined together with their equations, R2 and p level with Statistica software (https://www.statsoft.pl/, accessed on 1 August 2021). Then the data series were additionally tested for the presence of trends by the Mann–Kendall test [49,50,51] using XLSTAT software (https://www.xlstat.com/en/, accessed on 5 August 2021). That software was also used to calculate standard errors for mean values. For each data series, the variability coefficient was calculated with MS Excel following the formula:
Vc = (σ/m) × 100
where:
Vc—variability coefficient (in %)
σ—standard deviation
m—mean value
The values of the coefficient calculated were interpreted in the following way:
<25%—low variability, 25–45%—mean variability, 46–100%—high variability, >100%—very high variability.
The drought occurrence estimation was based on a comparison of the SPI, SPEI, RPI and Selianinov index outcomes, that is, the number of dry months defined as SPI ≤ −1.00, SPEI ≤ −0.8, RPI ≤ 75%, Selianinov index < 1.4. The frequency of dry months was presented for specific decades of the study period, for the whole year, the warm half-year (May–October) and the cold half-year (November–April). The forest drought indices can be calculated with only an annual resolution so the number of years with conditions unfavorable for beech in specific decades has been shown.

4. Results

All the indices used in the study are based on data concerning air temperature, precipitation or both. Therefore, the spatial and temporal variability of air temperature and precipitation is presented first in order to provide background for the analysis of drought indices.

4.1. Air Temperature and Precipitation Variability

For all stations included in the study, an increase in mean annual air temperature has been observed; the regression analysis showed that it was statistically significant at p < 0.05. The rate of increase varied from 0.5 to 0.7 °C per 10 years (R2 from 0.34 to 0.47). The Mann-Kendall test confirmed statistically significant positive trends for all stations, and Sen’s slope values confirmed the rate of increase described above (Appendix B). The variability coefficient for all series is <25%, which means a relatively low variability of mean annual air temperature in the study area. Figure 2 shows that the mean decadal air temperature has been gradually increasing at all stations, too. The most striking increase is observed for Kasprowy Wierch, one of the highest peaks of the Tatra Mts, where mean annual air temperature has exceeded 0 °C which means a shift from the ”moderately cold” vertical climatic zone (i.e., from mean annual air temperature from −2 to 0 °C) to “very cool” (0 to 2 °C). Such a shift can also be observed for Zakopane (from “moderately cool” to “moderately warm”). Lesko and Limanowa shifted from “moderately warm” to a mean annual air temperatures above 8 °C, not included in the original scheme described in [29].
In the case of precipitation, there are no statistically significant changes for annual totals (according to regression analysis and the Mann–Kendall test; see Appendix B). The comparison of mean annual totals in specific decades confirms this fact (Figure 3); the highest values were noted in the second decade. The values of the variability coefficient for annual totals are below 25% which means low variability. However, the values for particular months reveal that for Kasprowy Wierch, Bielsko-Biała, Limanowa and Kraków, for all months the coefficient values are >45%, which means high variability. For Zakopane, Katowice, Łazy, Nowy Sącz, Gaik-Brezowa and Krynica, from 1 to 3 months show mean variability (25–45%) but for all other months, the coefficient exceeds 45%. For Lesko and Komańcza, 4–5 months show mean variability while all other months have high variability. Additionally, there is no clear dependency between precipitation and altitude (except Kasprowy Wierch) or precipitation and longitude, and this is linked to the strong local impacts of landforms in the mountains on spatial patterns of precipitation.
Both air temperature and precipitation are key factors controlling drought occurrence and Figure 4 shows their combination for the stations included in the study. The stations can be then assigned to the following temperature-precipitation zones (TPZ):
  • TPZ 1: The highest parts of the Carpathians, located above 1500 m a.s.l., represented by Kasprowy Wierch, where mean annual air temperature is lowest (around 0 °C), and mean annual precipitation is highest (about 1800 mm); therefore, potential drought risk is the lowest.
  • TPZ 2: The Carpathian basins and large valleys located at about 500–900 m a.s.l., represented by Zakopane, Krynica and Komańcza, where annual precipitation exceeds 800 mm, and mean annual air temperature is about 6–7 °C, which allows potential drought risk to be considered as relatively low.
  • TPZ 3: The Carpathian basins and large valleys located at about 400–500 m a.s.l., represented by Lesko and Limanowa, with a mean annual air temperature of 8.2 °C and precipitation above 800 mm. Here the potential drought risk is medium.
  • TPZ 4: The Carpathian foreland and foothills, together with basins located about 200–400 m a.s.l., represented by Bielsko-Biała, Gaik-Brzezowa, Nowy Sącz, Łazy, Kraków and Katowice, where the mean annual air temperature is the highest in the vertical profile (8.9–9.0 °C), and annual precipitation totals are very diversified, from 670 to 1000 mm, so the potential drought risk is high.

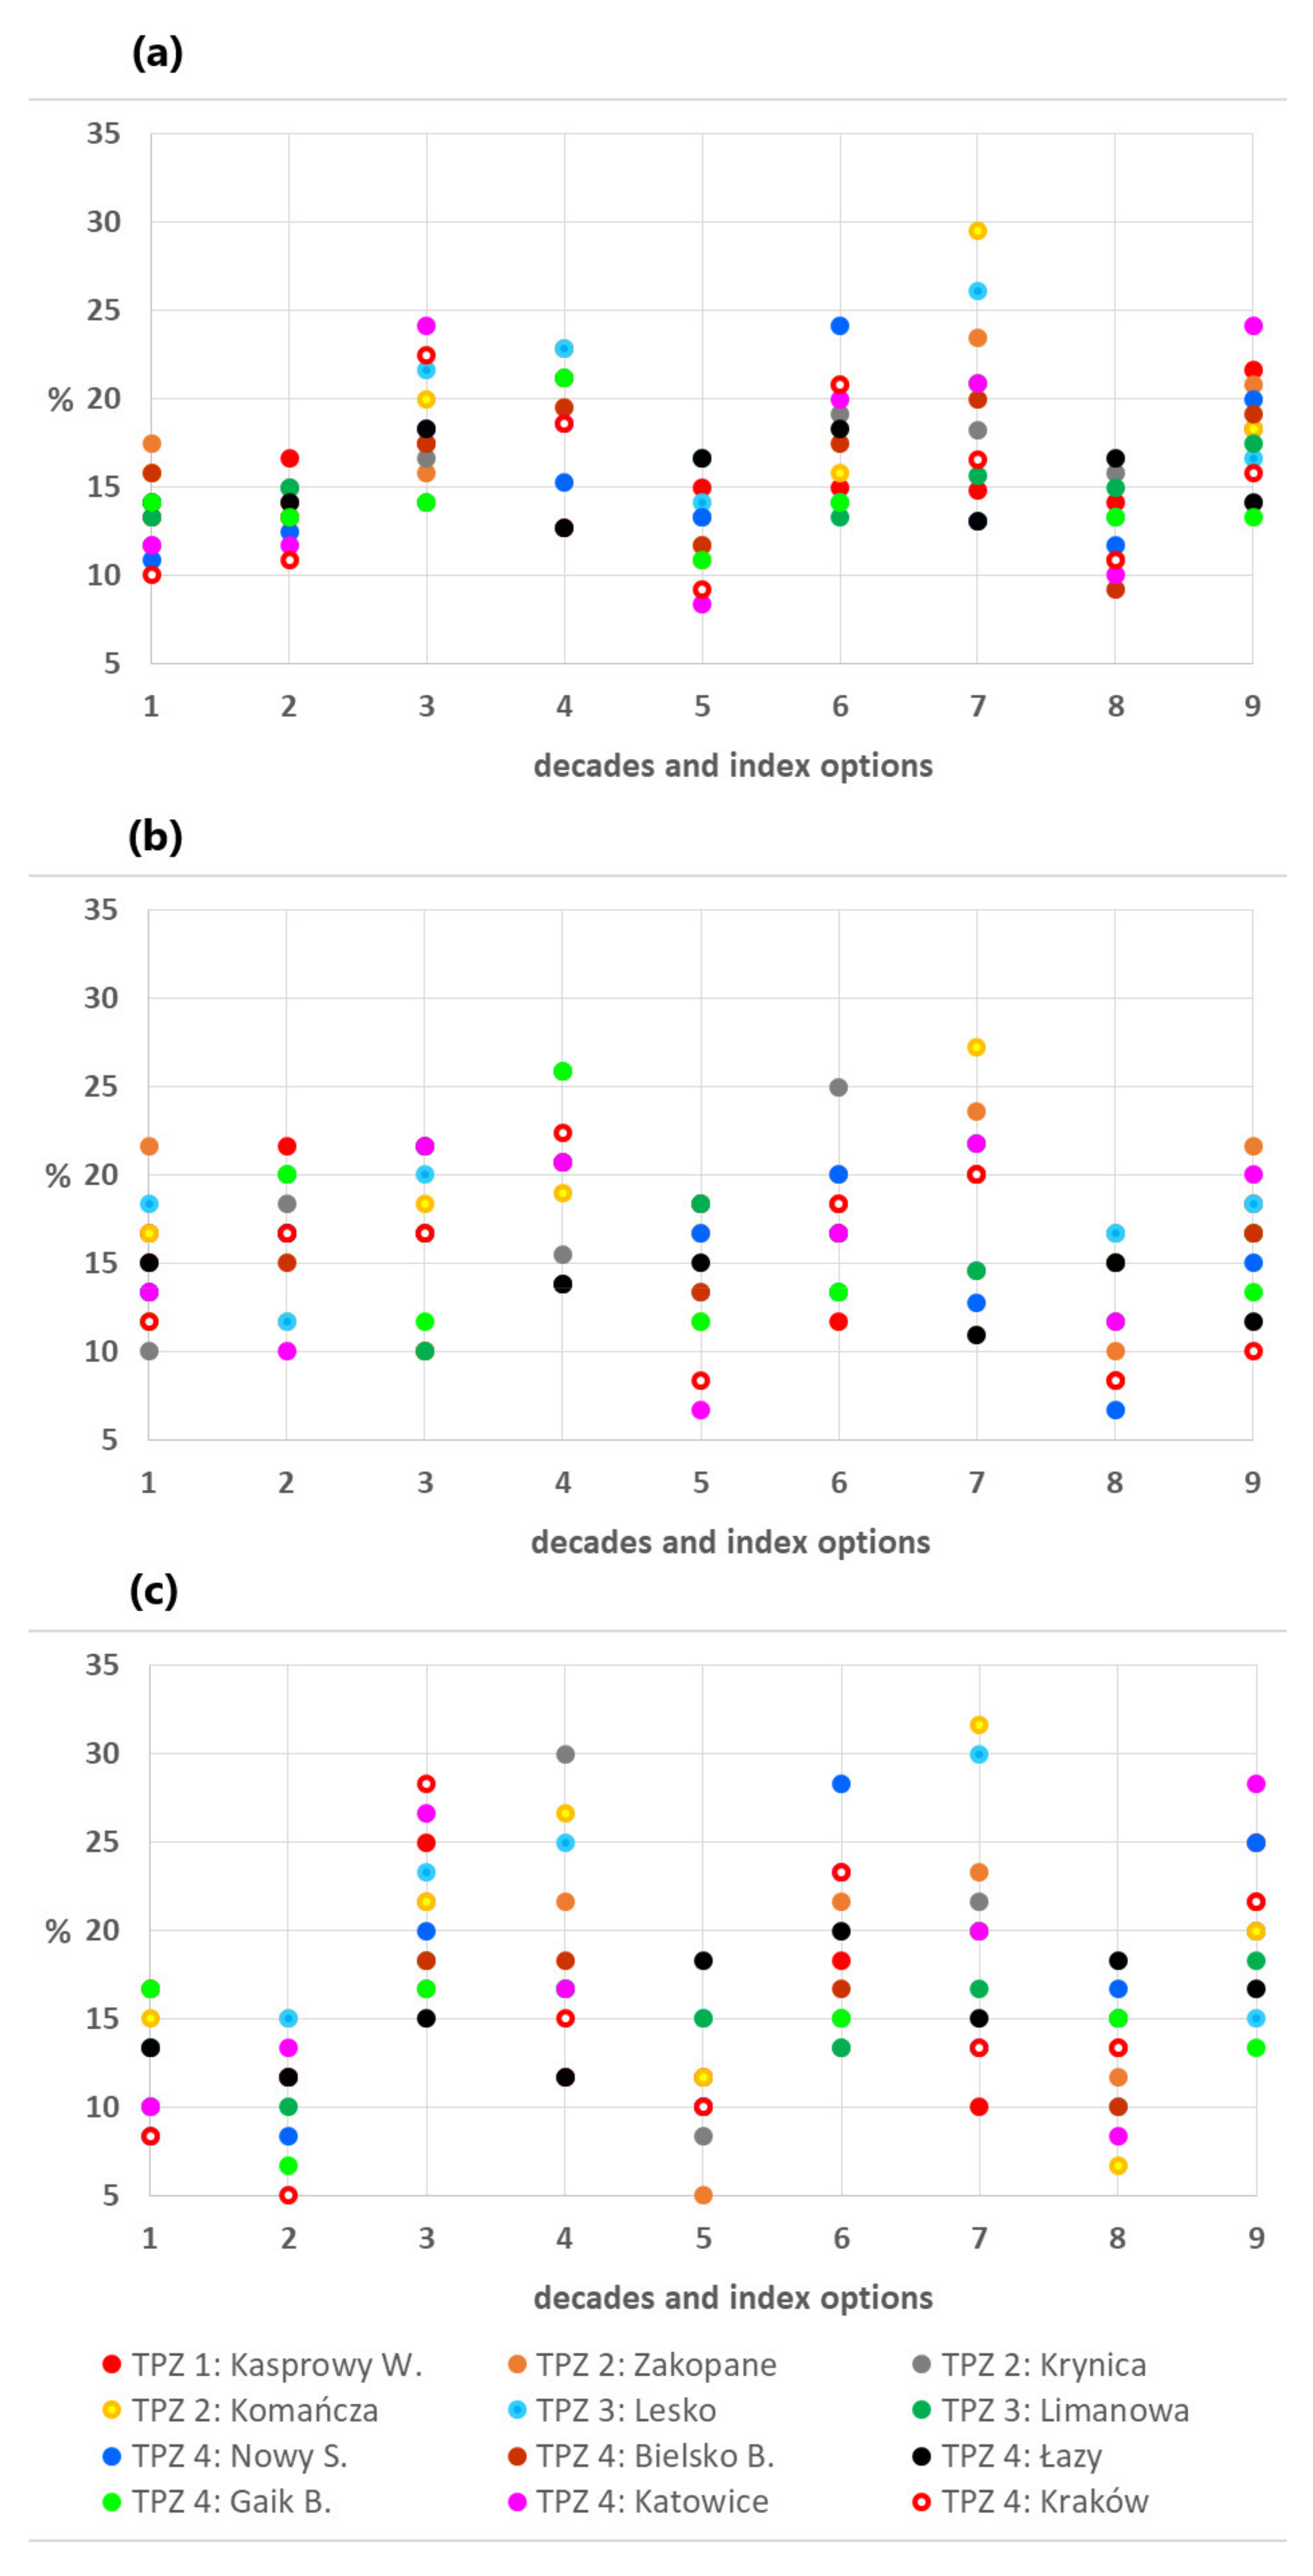
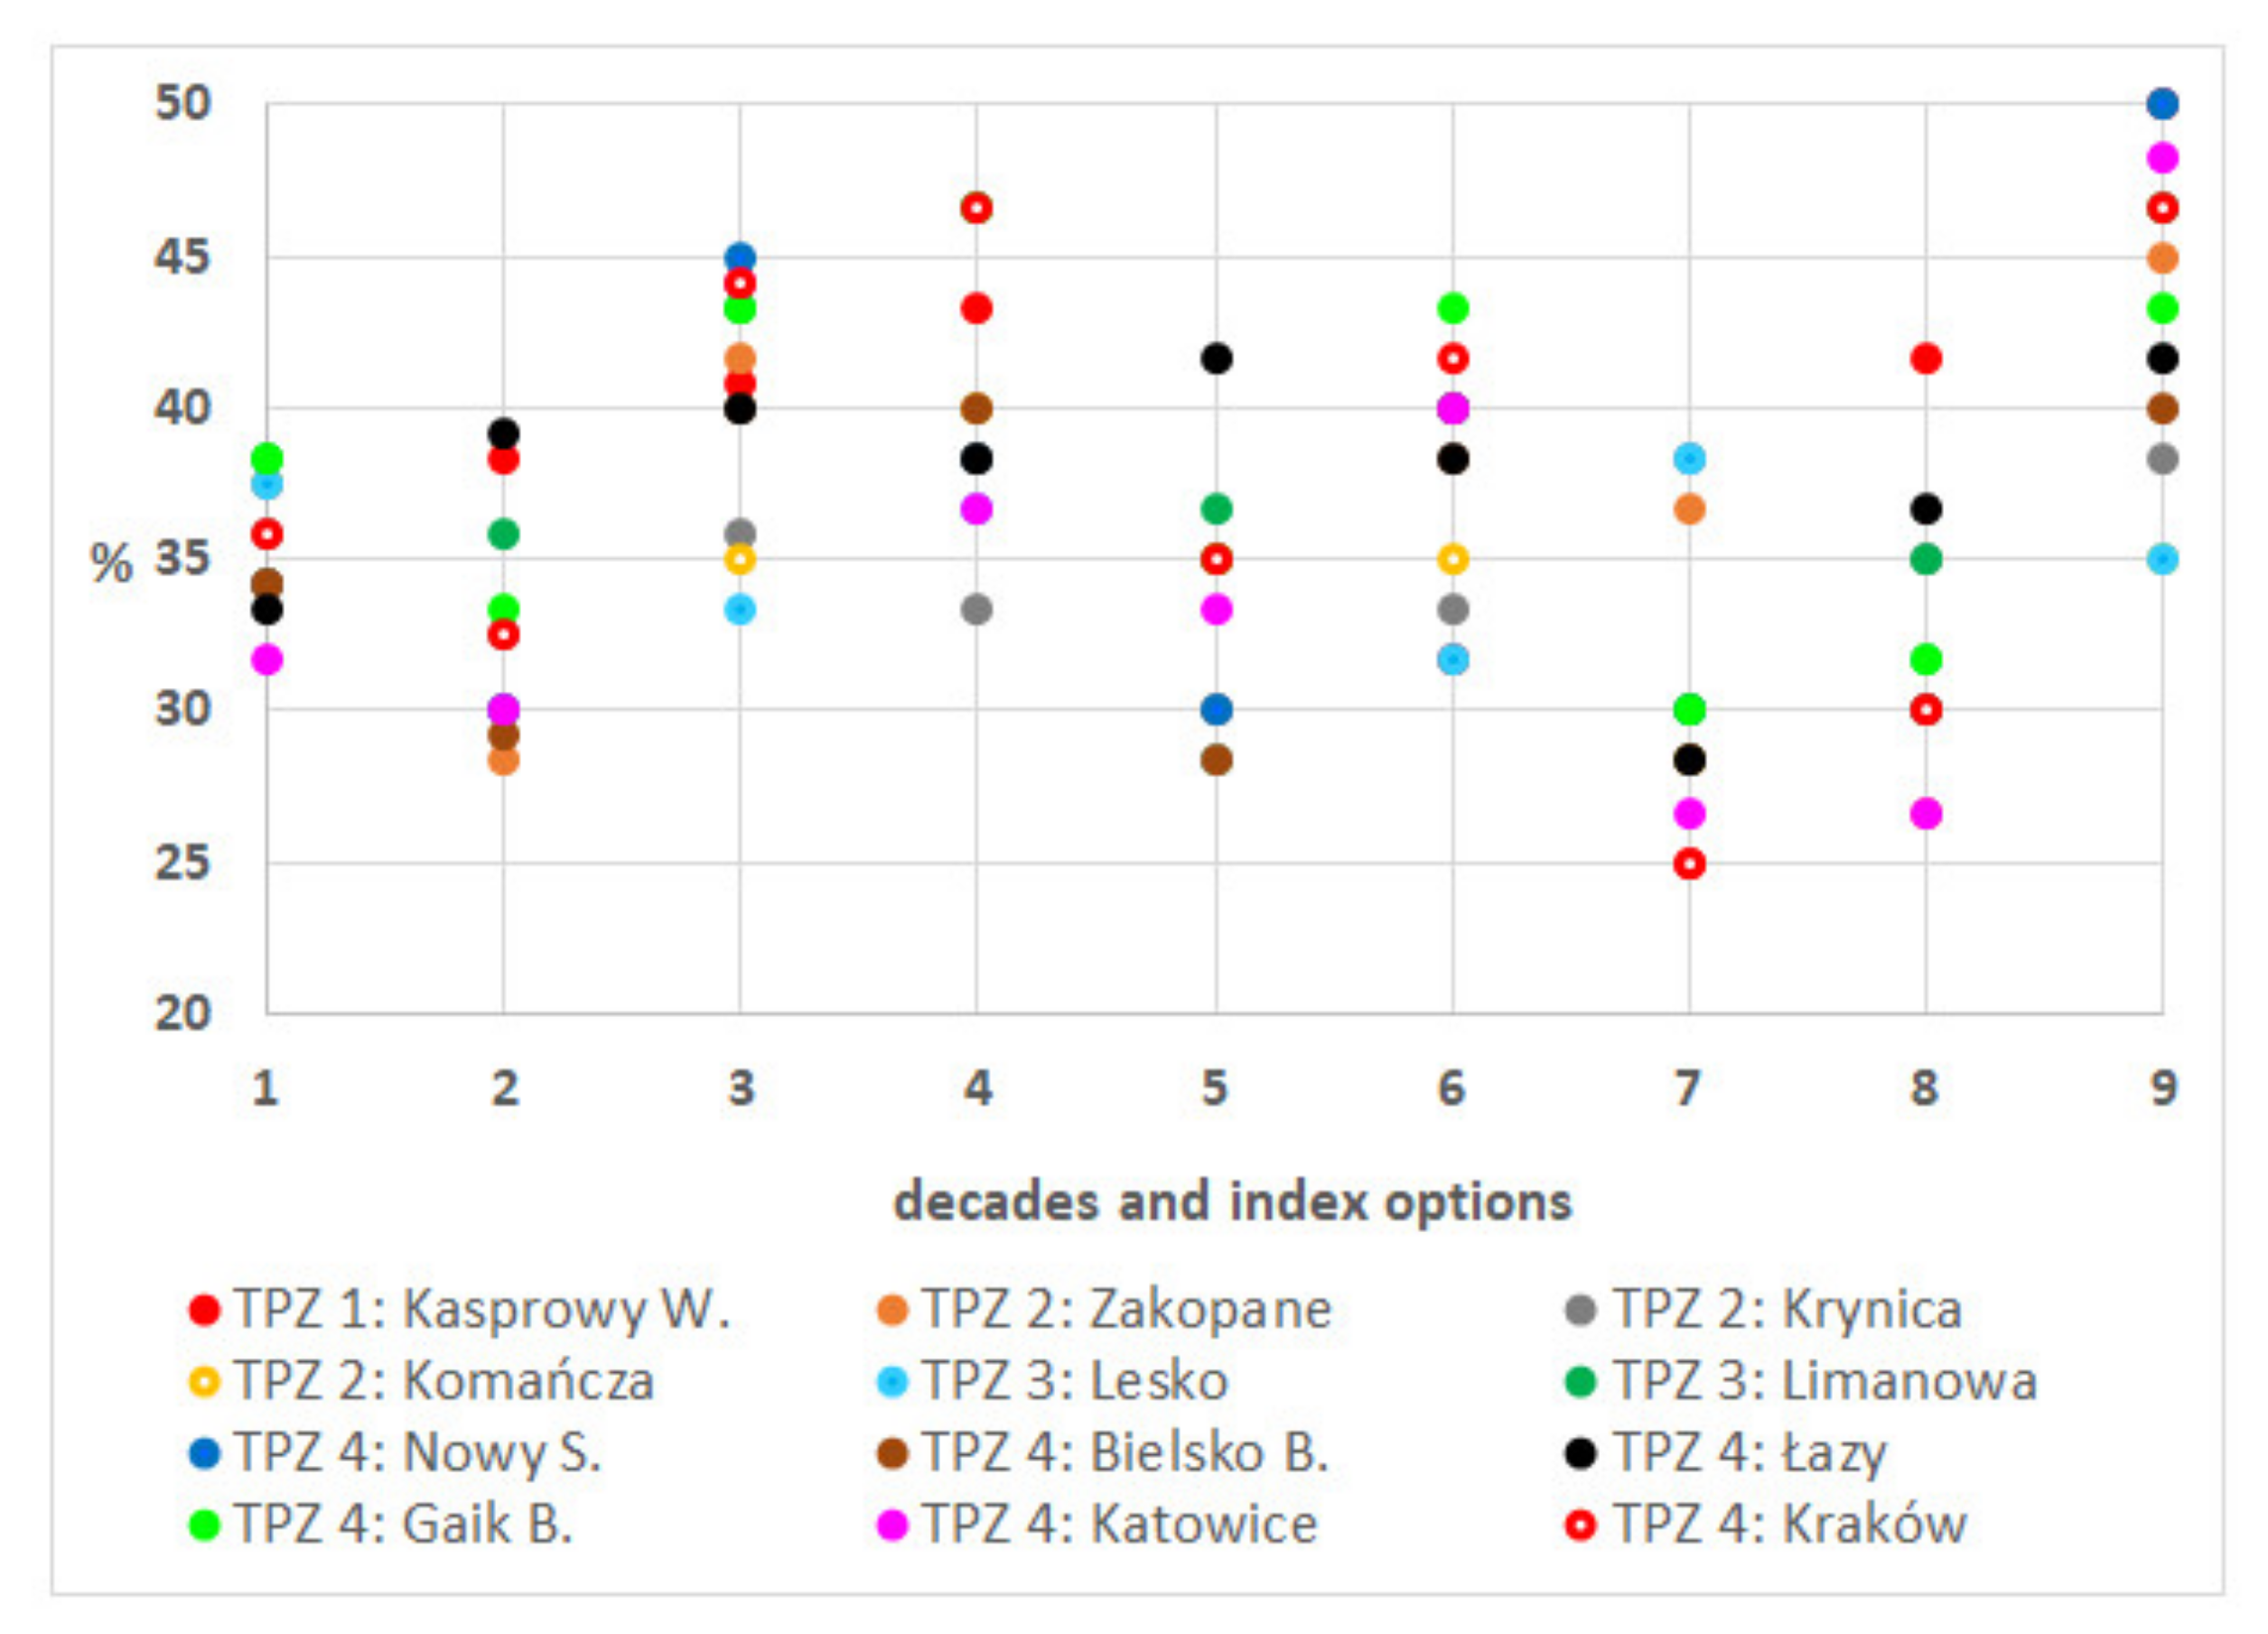
4.2. Drought Frequency and Trends in the Polish Carpathians

Drought occurrence was determined by SPI, SPEI, RPI and the Selianinov index. For SPI and SPEI, the percentages of dry months (i.e., with SPI ≤ –1.00, SPEI ≤ −0.8) for the whole year and for the subperiods May–October and November–April were calculated. All data series show very high variability, that is, the values of Vc exceed 100%.
SPI values for the 1-month time scale vary from 3.74 to −4.28, for the 3-month scale from 3.81 to −3.13, and for the 6-month scale from 3.62 to −2.78. None of the SPI 1- and 3-monthly series shows any statistically significant trend; the results of the Mann–Kendall test are presented in Appendix B. In the case of SPI 6-monthly series for Zakopane, Krynica, Komańcza (TPZ 2) and Gaik-Brzezowa (TPZ 4), the p-values indicate statistically significant increasing trends, but Sen’s slope values are as low as 0.001, and low tau values indicate that the trends are weak (Appendix B). A 1-month SPI reflects short-term conditions, related closely to meteorological drought along with short-term soil moisture and crop stress, while a 3-month SPI reflects short- and medium-term moisture conditions and provides a seasonal estimate of precipitation, and a 6-month SPI indicates seasonal to medium-term trends in precipitation [39]. Figure 5 presents the data for the decades and it shows that in a short-term perspective, a clear increase in the frequency of dry months in the cold subperiod can be seen in the last decade in comparison to the previous ones (except Gaik-Brzezowa; Figure 5c). This is also the reason for the increase of dry-month frequency at an annual scale (Figure 5a). The increase is observed throughout the whole study area. In the decade 2011–2020, the frequency of dry months according to SPI reached about 15% on an annual scale at all stations. For medium-term and seasonal perspectives (Figure 5, data for 3- and 6-monthly timescales), there are no clear spatial or temporal patterns.
For annual values of RPI, the Mann–Kendall test by definition gives the same results as for annual precipitation totals (Appendix B). For the test’s results for particular months and particular stations, all p-values exceeded 0.05, so none of the series shows any statistically significant trend. Tau values varied from −0.264 to 0.209. Figure 6 shows that in the decade 2011–2020, for most of the stations, a large increase in the number of dry months per year can be seen which is mainly the effect of the increase in the frequency of such months in the cold half-year. In the last decade of the study period, according to RPI, from 35 to 45% of months per year were dry.
The Selianinov index could be calculated for all stations (except Kasprowy Wierch) and for each year only for June, July and August; for other months the values could be calculated only sporadically. The Mann–Kendall test for those three months showed no statistically significant trend at any station. All p-values exceeded 0.05, tau values varied from −0.159 to 0.062. However, the Selianinov index, unlike SPI and RPI, showed a large spatial variability of drought occurrence in the warm part of the year (Figure 7), with a clear increase in drought risk with decrease in altitude (i.e., from less than 10% of dry months at Kasprowy Wierch (TPZ 1) to over 50% in Kraków, TPZ 4). Additionally, the data show that for most stations, the share of dry months is greater in the last decade than in the two previous ones. An increase is especially visible in the highest parts of the Carpathians. Until 2015, the Selianinov index could be calculated for Kasprowy Wierch only once over several years, and only for July, while later it could be calculated also for June and August, as the index is calculated only for the months when the mean daily air temperature exceeds 10 °C. There is no significant difference in the W-E profile concerning drought risk, but the data for Bielsko-Biała are worth attention as the risk is much lower than in other stations of similar locations. Bielsko-Biała and Katowice (TPZ 4) are the westernmost points of the study area, and both of them are exposed to moist oceanic air masses coming from the west; however, Bielsko-Biała is located in the Carpathian foothills, that is, close to an orographic barrier which enhances precipitation. Figure 3 shows that Bielsko-Biała has higher precipitation sums than neighboring stations.
SPEI values for the 1-monthly time scale vary from 2.54 to −3.15, for the 3-monthly scale from 2.60 to −2.83, and for the 6-monthly scale from 2.72 to −3.44. For the 1-monthly series, statistically significant trends were found with the Mann–Kendall test for Katowice, Nowy Sącz and Kraków (TPZ 4), and for 3-monthly and 6-monthly series for Kasprowy Wierch (TPZ 1), Katowice, Nowy Sącz and Kraków (TPZ 4) (Appendix D). The trends indicate an increase in drought risk although Sen’s slope values are as low as 0.001–0.002 which indicates that the trends are weak. However, most tau values are much higher than for SPI (Appendix B), which shows that those trends, although weak, should be considered important signals of the increasing drought risk at least in some areas of the Polish Carpathians, mainly in foreland areas. SPEI presents combined effects of precipitation and air temperature and concerning the results presented above, it is the increasing temperature that is mainly contributing to those trends. Figure 8 presents the percentage of the dry months (SPEI ≤ −0.8) for the decades and it shows that in the last decade of the study period, there were much more dry months observed at most of the stations than previously. Such tendency is more clear for the cold half-year than for the warm one, especially for the 1-monthly time scale.

4.3. Drought Risk for Beech in the Polish Carpathians

The forest drought indices used in the study are based on air temperature and precipitation (EQ, AI and FAI) or on air temperature only (MT). They were calculated for all stations except Kasprowy Wierch, as that station is located far above the tree line. For EQ, FAI and AI, no statistically significant trend in the study period was found for any station, neither by regression analysis nor with the Mann–Kendall test (Appendix B). The indices show high spatial and temporal variability (Figure 9). The Carpathian foreland and foothills, together with basins located about 200–400 m a.s.l., are the areas where, in each decade, there are years with forest drought conditions, and at some stations (i.e., in Katowice, Kraków, Nowy Sącz—TPZ 4) an increasing tendency can be observed. In the remaining part of the study area, drought conditions do not occur at all or they occur only sporadically.
Unlike the indices shown in Figure 9, MT has a statistically significant increasing trend at all stations (p < 0.05) at the rate from 0.4 to 0.5 per decade; only for Limanowa did the value reach 0.6 per 10 years. The Mann–Kendall test confirms those results (Appendix B). The threshold value of 18 °C, above which the conditions for beech are estimated to be unfavorable, was crossed for the first time in 2002 at all stations in the zone of the Carpathian foreland and foothills, together with basins located about 200–400 m a.s.l. (TPZ 4), except for Bielsko-Biała. In the second decade, the value was crossed in three years in the zone mentioned, and in the third decade for five years. In 2018, in Katowice and Kraków, the index value reached 19 °C (Figure 10).

5. Discussion

The analyses presented above, based on the application of various indices, show that atmospheric drought risk has increased in the study area, and the main reason is increasing air temperature. It is recommended to study the drought issue with a variety of methods as in many studies, solely precipitation-based indices show only minor changes in drought occurrence, whereas other indices that consider evapotranspiration indicate a significant increase in the area under drought [52]. The results presented for air temperature and precipitation series confirm earlier findings for the Polish Carpathians that there has been significant warming in the area, particularly over recent decades. Climate change is most evident in the foothills; however, it is the highest summits that have experienced the most intensive increases in temperature during the recent period. Precipitation does not demonstrate any substantial trend and has high year-to-year variability. The distribution of annual temperature provides evidence of the upward shift of vertical climate zones in the Polish Carpathians, reaching approximately 350 m, on average, which indicates further ecological consequences [53]. The absence of statistically significant trends in precipitation is in accordance with the results for Czechia, Slovakia and Austria [54] where the main driver of drought is an increase in the evaporative demand of the atmosphere, driven by higher temperatures and global radiation with limited changes to precipitation totals. However, the observed drying trends were most pronounced there during the April−September period and at lower elevations. Conversely, the majority of stations above 1000 m exhibited a significant wetting trend for both the summer and winter (October−March) half-years. The part of the Carpathians included in that study is located on the southern side of the Western Carpathian chain, while the Polish Carpathians, considered in the present paper, are located on the northern side. Therefore, the climatic factors, for example, atmospheric circulation impacts are different for these regions and this is then visible in the values for climatic elements. Conditions for areas above 1000 m a.s.l. can be estimated on the northern side with the data from Kasprowy Wierch only, and they do not show a wetting trend but an increase in drought risk. For stations located at lower altitudes, according to indices based on precipitation only, drought frequency was highest in the warm half-year in the first decade only, while in the last decade it was most frequent in the cold half-year. However, the Selianinov index, based on both air temperature and precipitation, and calculated for the warm half-year, showed that the last decade experienced drought much more often than previous decades, which is in accordance with the results presented in [54]. SPEI is also based on both air temperature and precipitation, but it has been calculated for the whole year, and as shown in Figure 8, the frequency of dry months increased a lot in the last decade all over the study area. The increase was larger in the cold half-year than in the warm one; at some stations, it was more than double in comparison to previous decades. In the study for the whole Carpathian region [5], there are no differences among the mountains and lowlands shown but the general trend confirms an increase in drought frequency. For the Alpine region [55], drought impacts were studied and turned out to be most pronounced in the warm half-year, while the high-altitude region showed this effect the most. The Polish Carpathians can also be compared to the remainder of Poland. Areas classified as dry increased their surface area from 13% in the period 1931–1960 to 20% in the 30-year period of 1971–2000, and 46% in the 30-year period of 1981–2010. However, the northern and western regions of Poland are more endangered by drought than the mountains where the precipitation is always higher [56].
It can be concluded that the present paper shows the frequency and trends of drought in the Polish Carpathians in the most recent 30 years, that is, in the period marked by global warming. The results obtained are in accordance with the outcomes of other studies concerning drought in Central Europe and in the Central European mountains, but they also show some new aspects which have not been analyzed so far. There is no drought frequency variability in the W-E profile. The stations representing the easternmost part of the Polish Carpathians, Komańcza and Lesko, belong to two different TPZs (2 and 3, respectively), and the indices values obtained show that drought risk in that region is similar to that in the remaining part of the study area. However, there is a high impact of local environmental conditions on spatial patterns of precipitation. Unlike the indices based on precipitation only, the index based on both precipitation and air temperature has shown a clear increase in drought risk with decrease in altitude. Additionally, for the highest parts of the mountains represented by Kasprowy Wierch, there are clear indications of increasing drought risk, so both TPZ 1 and TPZ 4 should be considered most endangered with the increase of drought risk due to ongoing air temperature increase. In the Polish Carpathians, agriculture is not the dominating sector, due to more unfavorable environmental conditions than in the lowland part of the country. Much more important is tourism for which the state of the natural environment, including forests, is one of the key factors. Analyses of the indices describing the conditions for beech forest have shown that the zone of the Carpathian foreland and foothills, together with basins located about 200–400 m a.s.l., is the part of the Polish Carpathians where conditions are already unfavorable and are worsening most rapidly. According to [57], Carpathian ecosystems located in water-limited environments of lowland to foothill areas can be particularly exposed to climate change, and the Tatras are climate change hotspots. As the vertical climate-vegetation zones are shifting due to constant warming, it can be expected that the deterioration of climatic conditions for beech will appear at higher altitudes. Other studies show that in the Carpathian Basin, beech has already reached its xeric limit on many sites [58]. Beech total yield production in the Western Carpathians was recently found to be lower by −11% on average compared to beech forests in Central Europe (Germany) [59]. The extraordinary drought and heat in the summers of 2018 and 2019 have demonstrated the climatic vulnerability of European beech in many parts of its Central European distribution range. At its southern and south-eastern range edges, beech is most likely limited by summer drought and probably also by heat [60]. In the high-mountain zone of the Carpathians, populations of cold-adapted species are very vulnerable to climate change, while their habitats tend to shrink. The climate-driven decrease of snow cover often leads to frost damage to vegetation that provides gaps appropriate for the establishment of many rare species [61]. Most probably, many species of conservation concern will irreversibly disappear from the regional flora under the ongoing climate change [62]. The increase of drought risk in the highest parts of the Polish Western Carpathians, shown in the present paper, is another factor that can contribute to those negative processes. In Europe, a strong spatial pattern in the beech growth responses to summer temperature and to drought was found; radial growth of the species generally did not respond to summer drought in Central Europe (Germany, Slovakia and Romania), but it became highly responsive in the Balkan Peninsula (Bosnia and Herzegovina). However, beech shows a wide variety of growth patterns driven by several factors, and beech growth has been declining over the last two decades [63]. The results shown in the present paper suggest that the drought risk has been increasing during the last 30 years in the Polish Western Carpathians, especially in the foothills zone, so we can expect the beech forests growing there to be effects and even decline in the next decades.
It should be mentioned that the trends from observed data might, for two main reasons, not be suitable for extrapolation into the future [64,65]. First, they could be related to climate variability and not too persistent changes over time. Second, an investigated trend depends on the observation period, so it could differ if the observation period was extended.

Author Contributions

Conceptualization, A.B., M.K., P.K. and W.K.; methodology, A.B., M.K. and P.K.; software, not applicable; validation, M.K., P.K. and W.K.; formal analysis, A.B., M.K. and P.K.; investigation, A.B., M.K. and P.K.; resources, M.K., P.K. and W.K.; data curation, M.K., P.K.; writing—original draft preparation, A.B., M.K. and P.K.; writing—review and editing, A.B., M.K. and P.K.; visualization, A.B., M.K., P.K.; supervision, A.B.; project administration, not applicable; funding acquisition, not applicable. All authors have read and agreed to the published version of the manuscript.

Funding

This research received no external funding.

Institutional Review Board Statement

Not applicable.

Informed Consent Statement

Not applicable.

Data Availability Statement

Not applicable.

Acknowledgments

The authors wish to thank the reviewers for their valuable comments and suggestions, and Piotr Sekuła, for the assistance in SPEI calculations and preparation of Figure 2 and Figure 3.

Conflicts of Interest

The authors declare no conflict of interest.

Appendix A

Formulas for calculation of the indices used
RPI:
RPI = (P/Pmean)*100%
where:
P—precipitation sum in a certain period (e.g., a month; in mm);
Pmean—mean multi-annual precipitation sum for the same period (e.g., a certain month; in mm).
Selianinov index:
K = 10P/Σt,
where:
P—monthly precipitation sum
Σt—sum of mean daily air temperatures; the index is calculated only for the months when mean daily air temperature exceeds 10 °C
EQ:
EQ = TW/P × 1000
where:
TW—temperature of the warmest month in a year
P—annual precipitation total
FAI:
FAI = 100 × (Jul–Aug)/(P(May–Jul) + P(Jul–Aug)
where:
T (Jul–Aug)—mean air temperature in July and August;
P (May–Jul)—precipitation total from May to July;
P (Jul–Aug)—precipitation total from July to August.
MT:
MT = (TMay + TJun + TJul + TAug)/4
where:
TMay, TJun etc.—mean monthly air temperature for May, June etc.
AI:
AI = P/(TA + 10)
where:
P—annual precipitation total
TA—mean annual air temperature

Appendix B

Table A1. Values of test statistics S (upper value) and tau (middle/bottom value) of the Mann–Kendall test for the series of mean annual air temperature, annual sums of precipitation, 1-, 3- and 6-monthly SPI, and annual values of AI, FAI, EQ and MT. For mean annual air temperature, the bottom value presents Sen’s slope value (provided only if the p-value calculated was lower than 0.05).
Station Mean Annual Air Temper. Annual Total of Precip.SPI
1 Month
SPI
3 Months
SPI
6 Months
AIFAIEQMT
Kasprowy W.199
0.457
0.056
−19
−0.044
−1865
−0.029
−2855
−0.045
−2731
−0.044
nananana
Zakopane201
0.462
0.059
69
0.159
1818
0.028
3862
0.061
4739
0.076
−15
−0.034
3
0.007
−7
−0.016
173
0.398
0.048
Krynica205
0.471
0.055
81
0.186
1824
0.028
4197
0.066
5081
0.081
23
0.053
−9
−0.021
−33
−0.076
155
0.356
0.043
Komańcza213
0.489
0.061
51
0.117
2183
0.034
4266
0.067
5088
0.081
−21
−0.048
−33
−0.076
−3
−0.007
195
0.448
0.045
Lesko221
0.508
0.062
35
0.080
2632
0.041
3518
0.055
3382
0.054
−31
−0.071
−25
−0.057
9
0.021
175
0.402
0.048
Limanowa221
0.508
0.067
37
0.085
1076
0.017
3335
0.052
4306
0.069
−13
−0.030
−21
−0.048
1
0.002
201
0.462
0.063
Nowy S.187
0.429
0.059
−11
−0.025
−2015
−0.031
−1992
−0.031
−1925
−0.031
−45
−0.103
17
0.039
37
0.085
177
0.407
0.053
Bielsko B.203
0.466
0.063
35
0.080
414
0.006
2524
0.040
3079
0.049
−1
−0.002
5
0.011
11
0.025
159
0.366
0.057
Łazy185
0.425
0.057
33
0.076
878
0.014
3253
0.051
3255
0.052
−9
−0.021
−3
−0.007
−5
−0.011
162
0.375
0.041
Gaik B.190
0.467
0.065
48
0.118
2227
0.037
4150
0.070
5110
0.087
6
0.015
−4
−0.010
−10
−0.025
196
0.483
0.063
Katowice190
0.436
0.055
−13
−0.030
−1584
−0.025
−1408
−0.022
−3117
−0.050
−59
−0.136
−1
−0.002
29
0.067
143
0.329
0.042
Kraków170
0.390
0.052
−5
−0.011
−1857
−0.029
−1972
−0.031
−2947
−0.047
−57
−0.131
1
0.002
35
0.080
143
0.329
0.039
Explanation: na: non-applicable.

Appendix C

Table A2. Standard error for the mean annual air temperatures and precipitation totals shown in Figure 2 and Figure 3.
DecadeKasprowy W.ZakopaneKrynicaKomańczaLeskoLimanowaNowy S.Bielsko B.ŁazyGaik B.KatowiceKraków
Air temperature
1991–20000.1860.2530.2130.2340.2560.2590.2950.3100.2670.3080.2760.283
2001–20100.1880.1800.1410.1810.1650.2140.1940.1990.2050.2040.1890.189
2011–20200.1650.1600.1750.1970.1860.1890.1800.1880.1750.1960.1930.210
Precipitation
1991–200089,06544,82225,33626,58731,30940,59730,34450,04528,75747,51737,71333,755
2001–2010112,53367,43643,54436,75442,83277,61853,02666,31165,41478,12035,04048,688
2011–202083,90947,33936,61936,03727,84443,16332,61946,11035,94842,07234,65820,368

Appendix D

Table A3. Values of test statistics S (upper value), tau (middle value) and Sen’s slope (bottom value) of the Mann-Kendall test for those series of SPEI for which p-value calculated was <0.05.
Station1-Month SPEI3-Month SPEI6-Month SPEI
Kasprowy W.na−4498−4639
−0.070−0.074
−0.001−0.001
Katowice−4754−6267−8855
−0.074−0.098−0.141
−0.001−0.002−0.002
Nowy S.−4861−6567−7649
−0.075−0.103−0.122
−0.001−0.002−0.002
Kraków−4796−6767−9261
−0.074−0.106−0.147
−0.001−0.002−0.002
Explanation: na: non-applicable.

Appendix E

Table A4. Linear regressin equations and the values of R2 for the series of MT.
StationEquationR2
Zakopaney = 0.0443x + 13.3760.2593
Krynicay = 0.0394x + 14.1990.2718
Komańczay = 0.045x + 14.6040.3366
Leskoy = 0.0435x + 15.5040.2792
Limanoway = 0.0575x + 15.4730.3495
Nowy Sączy = 0.0447x + 16.5040.2747
Bielsko-BiałaY = 0.0492x + 16.0670.2572
Łazyy = 0.0377x + 16.6550.2285
Gaik-Brzezoway = 0.0603x + 16.4080.4182
Katowicey = 0.0406 + 16.6040.1912
Krakówy = 0.037x + 16.8820.1868

References

  1. Mishra, A.K.; Singh, V.P. A review of drought concepts. J. Hydrol. 2010, 391, 202–216. [Google Scholar] [CrossRef]
  2. IPCC. Climate Change 2014: Synthesis Report. Contribution of Working Groups I, II and III to the Fifth Assessment Report of the Intergovernmental Panel on Climate Change; IPCC: Geneva, Switzerland, 2014; p. 151. Available online: https://www.ipcc.ch/report/ar5/syr/ (accessed on 5 August 2021).
  3. Haslinger, K.; Schöner, W.; Anders, I. Future drought probabilities in the Greater Alpine Region based on COSMO-CLM experiments-spatial patterns and driving forces. Meteor. Zeit. 2015, 25, 137–148. [Google Scholar] [CrossRef]
  4. Spinoni, J.; Naumann, G.; Vogt, J.; Barbosa, P. Meteorological Droughts in Europe: Events and Impacts—Past Trends and Future Projections; Publications Office of the European Union: Luxembourg, 2016. [Google Scholar] [CrossRef]
  5. Spinoni, J.; Antofie, T.; Barbosa, P.; Bihari, Z.; Lakatos, M.; Szalai, S.; Szentimey, T.; Vogt, J. An overview of drought events in the Carpathian Region in 1961–2010. Adv. Sci. Res. 2013, 10, 21–32. [Google Scholar] [CrossRef] [Green Version]
  6. IPCC. Sixth Assessment Report, Working Group I—The Physical Science Basis, Regional Fact Sheet—Europe. 2021. Available online: https://www.ipcc.ch/report/ar6/wg1/#Regional (accessed on 5 August 2021).
  7. János Vágó-András Hegedűs-Endre Dobos. Analysis of drought conditions in the Carpathians using standardized precipitation index (SPI) 1951–2050. Geosci. Eng. 2013, 2, 66–80. [Google Scholar]
  8. Antofie, T.; Naumann, G.; Spinoni, J.; Vogt, J. Estimating the water needed to end the drought or reduce the drought severity in the Carpathian region. Hydrol. Earth Syst. Sci. 2015, 19, 177–193. [Google Scholar] [CrossRef] [Green Version]
  9. Škvarenina, J.; Tomlain, J.; Hrvoľ, J.; Škvareninová, J.; Nejedlík, P. Progress in dryness and wetness parameters in altitudinal vegetation stages of West Carpathians: Time-series analysis 1951–2007. IDŐJÁRÁS Q. J. Hung. Meteorol. Serv. 2009, 113, 47–54. [Google Scholar]
  10. Mezősi, G.; Blanka, V.; Ladányi, Z.; Bata, T.; Urdea, P.; Frank, A.; Meyer, B.C. Expected mid- and long-term changes in drought hazard for the south-eastern Carpathian basin. Carpathian J. Earth Environ. Sci. 2016, 11, 355–366. [Google Scholar]
  11. Crocetti, L.; Forkel, M.; Fischer, M.; Jurečka, F.; Grl, A.; Salentinig, A.; Trnka, M.; Anderson, M.; Ng, W.-T.; Kokalj, Z.; et al. Earth Observation for agricultural drought monitoring in the Pannonian Basin (southeastern Europe): Current state and future directions. Reg. Environ. Chang. 2020, 20, 123. [Google Scholar] [CrossRef]
  12. Skvarenina, J.; Tomlain, J.; Hrvol’, J.; Skvareninova, J. Occurrence of Dry and Wet Periods in Altitudinal Vegetation Stages of West Carpathians in Slovakia: Time-Series Analysis 1951–2005. In Bioclimatology and Natural Hazards; Strelcová, K., Matyas, C., Kleidon, A., Lapin, M., Matejka, F., Blazenec, M., Skvarenina, J., Holecy, J., Eds.; Springer: Amsterdam, The Netherlands, 2009; pp. 97–106. [Google Scholar] [CrossRef]
  13. Vido, J.; Nalevanková, P. Drought in the Upper Hron Region (Slovakia) between the Years 1984–2014. Water 2020, 12, 2887. [Google Scholar] [CrossRef]
  14. Cheval, S.; Busuioc, A.; Dumitrescu, A.; Birsan, M.-V. Spatiotemporal variability of meteorological drought in Romania using the standardized precipitation index (SPI). Clim. Res. 2014, 60, 235–248. [Google Scholar] [CrossRef]
  15. Vido, J.; Tadesse, T.; Šustek, Z.; Kandrík, R.; Hanzelová, M.; Škvarenina, J.; Škvareninová, J.; Hayes, M. Drought Occurrence in Central European Mountainous Region (Tatra National Park, Slovakia) within the Period 1961–2010. Adv. Meteorol. 2015, 248728. [Google Scholar] [CrossRef] [Green Version]
  16. Kholiavchuk, D.; Cebulska, M. Precipitation Shortage in the High Ukrainian and Polish Carpathians. In Proceedings of the Air and Water—Components of the Environment Conference, Cluj-Napoca, Romania, 25–26 March 2021; pp. 33–42. [Google Scholar] [CrossRef]
  17. Kalbarczyk, R.; Kalbarczyk, E.; Leshchenko, O. Występowanie suszy atmosferycznej w półroczu ciepłym 2018 roku w Polsce—ocena intensywności i zasięgu [Occurrence of Atmospheric Drought in the Warm Half-Year in 2018 in Poland—Assessment of Intensity and Range]. In Zmienność Klimatu Polski i Europy oraz jej Cyrkulacyjne Uwarunkowania [Variability of the Climate of Poland and Europe and Its Circulation Background]; Kolendowicz, L., Bednorz, E., Tomczyk, A.M., Eds.; Bogucki Wyd. Naukowe: Poznan, Poland, 2019; pp. 105–116. [Google Scholar]
  18. Łabędzki, L.; Bąk, B. Prognozowanie suszy meteorologicznej i rolniczej w systemie monitorowania suszy na Kujawach i w Dolinie Górnej Noteci [Predicting meteorological and agricultural drought in the system of drought monitoring in Kujawy and the upper Notec valley]. Infrastruct. Ecol. Rural. Areas 2011, 5, 19–28. Available online: http://www.infraeco.pl/pl/art/a_16106.htm?plik=904 (accessed on 5 August 2021).
  19. Bartoszek, K. Występowanie susz atmosferycznych w okolicy Lublina i ich uwarunkowania cyrkulacyjne [Occurrence of atmospheric droughts in the Lublin area and atmospheric circulation conditions]. Ann. Univ. Mariae Curie-Skłodowska Sec. E 2014, 69, 49–61. Available online: https://czasopisma.up.lublin.pl/index.php/as/article/view/679/518 (accessed on 5 August 2021).
  20. Twardosz, R. Charakterystyka okresów bezopadowych w Krakowie 1863–1995 [The characteristic of dry spells in Cracow in period 1863–1995]. Geogr. Rev. 1999, 71, 435–446. [Google Scholar]
  21. Cebulska, M. Okresy bez opadów i ze słabymi opadami w polskich Karpatach (1984–2013) [Periods without precipitation and with low precipitation in the Polish Carpathians in the years of 1984–2013]. Pol. J. Agron. 2013, 34, 52–61. [Google Scholar] [CrossRef]
  22. Cebulska, M. Niedobór opadów atmosferycznych w okresie wegetacyjnym w zlewni Małej Wisły (1984–2013) [Deficiencies of precipitation in the growing season in the Mała Wisła catchment (1984–2013)]. Acta Sci. Pol. Form. Circumiectus 2016, 15, 13–26. Available online: http://www.formatiocircumiectus.actapol.net/pub/15_2_13.pdf (accessed on 5 August 2021). [CrossRef]
  23. Somorowska, U. Wzrost zagrożenia suszą hydrologiczną w różnych regionach geograficznych Polski w XX wieku [Increase in the hydrological drought risk in different geographical regions of Poland in the 20th century]. Geogr. Works Stud. 2009, 43, 97–114. Available online: https://wgsr.uw.edu.pl/wgsr/wp-content/uploads/2018/11/Somorowska.pdf (accessed on 5 August 2021).
  24. Doroszewski, A.; Jóźwicki, T.; Wróblewska, E.; Kozyra, J. Susza Rolnicza w Polsce w Latach 1961–2010 [Agricultural Drought in Poland in the Years 1961–2010]; Institute of Soil Science and Plant Cultivation-State Research Institute: Puławy, Poland, 2014; ISBN 978-83-7562-171-6. [Google Scholar]
  25. Spinoni, J.; Szalai, S.; Szentimrey, T.; Lakatos, M.; Bihari, Z.; Nagy, A.; Németh, A.; Kovács, T.; Mihic, D.; Dacic, M.; et al. Climate of the Carpathian Region in the period 1961–2010: Climatologies and trends of 10 variables. Int. J. Climatol. 2015, 35, 1322–1341. [Google Scholar] [CrossRef] [Green Version]
  26. Gurung, A.B.; Bokwa, A.; Chełmicki, W.; Elbakidze, M.; Hirschmugl, M.; Hostert, P.; Ibisch, P.; Kozak, J.; Kuemmerle, T.; Matei, E.; et al. Global change research in the Carpathian Mountain Region. Mt. Res. Dev. 2009, 28, 282–288. [Google Scholar] [CrossRef] [Green Version]
  27. Izmaiłow, B.; Kaszowski, L.; Krzemień, K.; Święchowicz, J. Rzeźba [Relief]. In Karpaty Polskie [The Polish Carpathians]; Warszyńska, J., Ed.; Institute of Geography, Jagiellonian University: Krakow, Poland, 1995; pp. 23–30. [Google Scholar]
  28. Kondracki, J. Geografia Polski [Geography of Poland]; PWN: Warsaw, Poland, 1978; p. 463. [Google Scholar]
  29. Hess, M. Piętra klimatyczne w Polskich Karpatach Zachodnich [Vertical climatic zones in the Polish Western Carpathians]. Prace Geogr. Uniw. Jagiell. 1965, 11, 266. [Google Scholar]
  30. Obrębska-Starklowa, B. Typologia i Regionalizacja Fenologiczno-Klimatyczna na Przykładzie Dorzecza Górnej Wisły [Phenological-Climatological Typology and Regionalization with the Upper Vistula River Basin as an Example]; Series: Habilitation Dissertations of the Jagiellonian University, 11; Jagiellonian University: Kraków, Poland, 1977. [Google Scholar]
  31. Niedźwiedź, T. Sytuacje Synoptyczne i ich Wpływ na Zróżnicowanie Przestrzenne Wybranych Elementów Klimatu w Dorzeczu Górnej Wisły [Synoptic Situations and Their Impact on Spatial Variability of Selected Climate Elements in the Upper Vistula River Basin]; Series: Habilitation Dissertations of the Jagiellonian University, 58; Jagiellonian University: Kraków, Poland, 1981. [Google Scholar]
  32. Niedźwiedź, T.; Obrębska-Starklowa, B. Klimat [Climate]. In Dorzecze Górnej Wisły [The Upper Vistula River Basin]; Dynowska, I., Maciejewski, M., Eds.; PWN: Warsaw-Kraków, Poland, 1991. [Google Scholar]
  33. Bokwa, A.; Wypych, A.; Ustrnul, Z. Climate Changes in the Vertical Zones of the Polish Carpathian in the Last 50 Years. In The Carpathians: Integrating Nature and Society towards Sustainability; Kozak, J., Ostapowicz, K., Bytnerowicz, A., Wyżga, B., Eds.; Springer: Berlin/Heidelberg, Germany, 2013; pp. 89–110. ISBN 978-3-642-12724-3. [Google Scholar]
  34. Micu, D.M.; Dumitrescu, A.; Cheval, S.; Birsan, M.-V. Climate of the Romanian Carpathians, Variability and Trends; Springer: Cham, Switzerland, 2015; p. 221. ISBN 978-3-319-02886-6. [Google Scholar] [CrossRef]
  35. Kobiv, Y. Response of rare alpine plant species to climate change in the Ukrainian Carpathians. Folia Geobot. 2017, 52, 217–236. [Google Scholar] [CrossRef]
  36. Obrębska-Starklowa, B.; Hess, M.; Olecki, Z.; Trepińska, J.; Kowanetz, L. Klimat [Climate]. In Karpaty Polskie [The Polish Carpathians]; Warszyńska, J., Ed.; Institute of Geography, Jagiellonian University: Krakow, Poland, 1995; pp. 31–47. [Google Scholar]
  37. Towpasz, K.; Zemanek, B. Szata roślinna [Plants]. In Karpaty Polskie [The Polish Carpathians]; Warszyńska, J., Ed.; Institute of Geography, Jagiellonian University: Krakow, Poland, 1995; pp. 77–94. [Google Scholar]
  38. European Environment Agency. Global and European Temperatures; EEA: København, Denmark, 2021; Available online: https://www.eea.europa.eu/data-and-maps/indicators/global-and-european-temperature-10/assessment (accessed on 5 August 2021).
  39. World Meteorological Organization. Standardized Precipitation Index User Guide; WMO-No. 1090; World Meteorological Organization: Geneva, Switzerland, 2012; p. 24. ISBN 978-92-63-11090-9. [Google Scholar]
  40. Gąsiorek, E.; Musiał, E. Porównanie i klasyfikacja warunków opadowych na podstawie wskaźnika standaryzowanego opadu i wskaźnika względnego opadu [Comparison and classification of precipitation conditions based on standardized SPI and relative RPI precipitation indices]. Water-Environ.-Rural Areas 2011, 11, 107–119. Available online: https://www.itp.edu.pl/old/wydawnictwo/woda/zeszyt_36_2011/artykuly/Gasiorek%20Musial.pdf (accessed on 5 August 2021).
  41. Gałęzewska, M.; Kapuściński, J. Próba określenia prawdopodobieństwa posuchy i suszy w Wielkopolsce na przykładzie Poznania [An attempt of defining the probability of drought in Wielkopolska region with Poznań as an example]. Ann. Agric. Acad. Poznań 1978, 105, 3–11. [Google Scholar]
  42. Vicente-Serrano, S.M.; Begueria, S.; Lopez-Moreno, J.I. A multi-scalar drought index sensitive to global warming: The Standardized Precipitation Evapotranspiration Index. J. Clim. 2010, 23, 1696–1718. [Google Scholar] [CrossRef] [Green Version]
  43. Ellenberg, H.; Weber, H.E.; Düll, R.; Wirth, V.; Werner, W.; Paulissen, D. Zeigerwerte von Pflanzen in Mitteleuropa. Scr. Geobot. 1991, 18, 1–248. [Google Scholar]
  44. Führer, E.; Horvath, L.; Jagodics, A.; Machon, A.; Szabados, I. Application of a new aridity index in Hungarian forestry practice. Idöjárás 2011, 115, 205–216. Available online: https://www.met.hu/en/ismeret-tar/kiadvanyok/idojaras/index.php?id=24 (accessed on 5 August 2021).
  45. Mayr, H. Waldbau auf Naturgesetzlicher Grundlage; Verlag Paul Perey: Berlin, Germany, 1909. [Google Scholar]
  46. Satmari, A. Lucrari Practice de Biogeografie (Practical Applications of Biogeography). Available online: http://www.academia.edu/9909429/05_indici_ecometrici (accessed on 28 July 2021).
  47. De Martonne, E. Une nouvelle fonction climatologique: L’indice d’aridité. La Meteorol. 1926, 2, 449–458. [Google Scholar]
  48. National Drought Mitigation Center—UNL, SPI Generator. 2018. Available online: https://drought.unl.edu/droughtmonitoring/SPI/SPIProgram.aspx (accessed on 5 August 2021).
  49. World Meteorological Organization. Guide to Hydrological Practices, Vol. II: Management of Water Resources and Application of Hydrological Practices; WMO-No. 168; World Meteorological Organization: Geneva, Switzerland, 2009; p. 302. ISBN 978-92-63-10168-6. [Google Scholar]
  50. Kendall, M.G. Rank Correlation Measures; Charles Griffin: London, UK, 1975. [Google Scholar]
  51. Mann, H.B. Non-parametric tests against trend. Econometrica 1945, 13, 245–259. [Google Scholar] [CrossRef]
  52. IPCC. Managing the Risks of Extreme Events and Disasters to Advance Climate Change Adaptation. In A Special Report of Working Groups I and II of the Intergovernmental Panel on Climate Change; Field, C.B., Barros, V., Stocker, T.F., Qin, D., Dokken, D.J., Ebi, K.L., Mastrandrea, M.D., Mach, K.J., Plattner, G.-K., Allen, S.K., et al., Eds.; Cambridge University Press: Cambridge, UK; New York, NY, USA, 2012; 582p. [Google Scholar]
  53. Wypych, A.; Ustrnul, Z.; Schmatz, D. Long-term variability of air temperature and precipitation conditions in the Polish Carpathians. J. Mt. Sci. 2018, 15, 237–253. [Google Scholar] [CrossRef]
  54. Trnka, M.; Balek, J.; Štěpánek, P.; Zahradniček, P.; Možny, M.; Eitzinger, J.; Žalud, Z.; Formayer, H.; Turňa, M.; Nejedlik, P.; et al. Drought trends over part of Central Europe between 1961 and 2014. Clim. Res. 2016, 70, 143–160. [Google Scholar] [CrossRef] [Green Version]
  55. Stephan, R.; Erfurt, M.; Terzi, S.; Žun, M.; Kristan, B.; Haslinger, K.; Stahl, K. An Inventory of Alpine Drought Impact Reports to explore past droughts in a mountain region. Nat. Hazards Earth Syst. Sci. 2021, 21, 2485–2501. [Google Scholar] [CrossRef]
  56. Ziernicka-Wojtaszek, A.; Kopcińska, J. Variation in Atmospheric Precipitation in Poland in the Years 2001–2018. Atmosphere 2020, 11, 794. [Google Scholar] [CrossRef]
  57. Hlasny, T.; Trombik, J.; Dobor, L.; Barcza, Z.; Barka, I. Future climate of the Carpathians: Climate change hot-spots and implications for ecosystems. Reg. Environ. Chang. 2016, 16, 1495–1506. [Google Scholar] [CrossRef]
  58. Berki, I.; Rasztovits, E.; Móricz, N.; Mátyás, C. Determination of the drought tolerance limit of beech forests and forecasting their future distribution in Hungary. In Proceedings of the VIII. Alps-Adria Scientific Workshop, Neum, Bosnia-Herzegovina, 27 April–2 May 2009; pp. 613–616. [Google Scholar] [CrossRef]
  59. Bosela, M.; Štefančík, I.; Petráš, R.; Vacek, S. The effects of climate warming on the growth of European beech forests depend critically on thinning strategy and site productivity. Agric. For. Meteorol. 2016, 222, 21–31. [Google Scholar] [CrossRef]
  60. Hohnwald, S.; Indreica, A.; Walentowski, H.; Leuschner, C. Microclimatic Tipping Points at the Beech-Oak Ecotone in the Western Romanian Carpathians. Forests 2020, 11, 919. [Google Scholar] [CrossRef]
  61. Kobiv, Y. Trends in Population Size of Rare Plant Species in the Alpine Habitats of the Ukrainian Carpathians under Climate Change. Diversity 2018, 10, 62. [Google Scholar] [CrossRef] [Green Version]
  62. Svitková, I.; Svitok, M.; Petrík, A.; Bernátová, D.; Senko, D.; Šibík, J. The Fate of Endangered Rock Sedge (Carex rupestris) in the Western Carpathians—The Future Perspective of an Arctic-Alpine Species under Climate Change. Diversity 2019, 11, 172. [Google Scholar] [CrossRef] [Green Version]
  63. Bosela, M.; Lukac, M.; Castagneri, D.; Sedmák, R.; Biber, P.; Carrer, M.; Konôpka, B.; Nola, P.; Nagel, T.A.; Popa, I.; et al. Contrasting effects of environmental change on the radial growth of co-occurring beech and fir trees across Europe. Sci. Total. Environ. 2018, 615, 1460–1469. [Google Scholar] [CrossRef]
  64. Blöschl, G.; Hall, J.; Viglione, A.; Perdigão, R.A.P.; Parajka, J.; Merz, B.; Lun, D.; Arheimer, B.; Aronica, G.T.; Bilibashi, A.; et al. Changing climate both increases and decreases European river floods. Nature 2019, 573, 108–111. [Google Scholar] [CrossRef]
  65. De Luca, D.L.; Petroselli, A.; Galasso, L.A. Transient Stochastic Rainfall Generator for Climate Changes Analysis at Hydrological Scales in Central Italy. Atmosphere 2020, 11, 1292. [Google Scholar] [CrossRef]
Figure 1. Location of the meteorological stations used in the study numbers as in Table 1.
Atmosphere 12 01259 g001
Figure 2. Mean annual air temperature (°C, black horizontal marks inside the boxes) in specific decades at the stations studied. Boxes mark the first and the third quartile, and the whiskers show the highest and the lowest value in a certain decade. Standard errors for the mean values are provided in Appendix C. Stations are ordered following the concept of TPZ explained in Section 4.1.
Atmosphere 12 01259 g002
Figure 3. Mean annual total of precipitation (mm, black horizontal marks inside the boxes) in specific decades at the stations studied. Boxes mark the first and the third quartile, and the whiskers show the highest and the lowest value in a certain decade, except the outliers which are shown with black dots. Standard errors for the mean values are provided in Appendix C. Stations are ordered following the concept of TPZ explained in Section 4.1.
Atmosphere 12 01259 g003
Figure 4. Comparison of mean annual air temperature and precipitation totals for the period 1991–2020 for the stations studied. The value for Nowy Sącz is not visible in the figure as it is almost identical to the value for Katowice and the symbols overlap each other.
Atmosphere 12 01259 g004
Figure 5. Percentages of dry months according to SPI (SPI ≤ −1.0) for 1-, 3- and 6-monthly timescales, for the whole year (a) and for the subperiods May–October (b) and November–April (c) in the decades of the study period. Stations are ordered following the concept of TPZ explained in Section 4.1. Explanation of numbers on axis x: 1—1991–2000, 1 month; 2—2001–2010, 1 month; 3—2011–2020, 1 month; 4—1991–2000, 3 months; 5—2001–2010, 3 months; 6—2011–2020, 3 months; 7—1991–2000, 6 months; 8—2001–2010, 6 months; 9—2011–2020, 6 months.
Atmosphere 12 01259 g005
Figure 6. Percentage of dry months according to RPI (RPI ≤ 75%-for the whole year) and for the subperiods May-October and November-April in the decades of the study period. Stations are ordered following the concept of TPZ explained in Section 4.1. Explanation of numbers on axis x: 1—1991–2000, year; 2—2001–2010, year; 3—2011–2020, year; 4—1991–2000, May–Oct; 5—2001–2010, May–Oct; 6—2011–2020, May–Oct; 7—1991–2000, Nov–Apr; 8—2001–2010, Nov–Apr; 9—2011–2020, Nov–Apr.
Atmosphere 12 01259 g006
Figure 7. Percentage of dry months according to the Selianinov index for the subperiod April–October in the decades of the study period. Stations are ordered following the concept of TPZ explained in Section 4.1.
Atmosphere 12 01259 g007
Figure 8. Percentage of dry months according to SPEI (SPEI ≤ −0.8) for 1-, 3- and 6-monthly timescales, for the whole year (a) and for the subperiods May–October (b) and November–April (c) in the decades of the study period. Stations are ordered following the concept of TPZ explained in Section 4.1. Explanation of numbers on axis x: 1—1991–2000, 1 month; 2—2001–2010, 1 month; 3—2011–2020, 1 month; 4—1991–2000, 3 months; 5—2001–2010, 3 months; 6—2011–2020, 3 months; 7—1991–2000, 6 months; 8—2001–2010, 6 months; 9—2011–2020 6 months.
Atmosphere 12 01259 g008
Figure 9. The number of years in specific decades when forest drought conditions unfavorable for beech occurred at the stations studied: (a) EQ > 30; (b) FAI > 4.75; (c) AI < 35. Stations are ordered following the concept of TPZ explained in Section 4.1.
Atmosphere 12 01259 g009
Figure 10. Values of the Mayr Tetratherm Index for particular TPZs and stations in the period 1991–2020, together with linear trends. See Appendix E for regression equations and the values of R2. Stations are ordered following the concept of TPZ explained in Section 4.1.
Atmosphere 12 01259 g010
Table 1. Coordinates and altitude of the meteorological stations used in the study numbers as in Figure 1. TPZ concept is explained in Section 4.1.
No.Station NameLatitude (φ)Longitude (λ)Altitude
m a.s.l
TPZ
1Bielsko-Biała49°48′26″ N19°00′01″ E3964
2Katowice50°14′26″ N19°01′58″ E2784
3Kraków50°04′40″ N19°47′42″ E2374
4Łazy49°57′55″ N20°29′43″ E2454
5Gaik- Brzezowa 49°52′00″ N20°05′00″ E3034
6Nowy Sącz49°37′38″ N20°41′19″ E2924
7Limanowa49°41′37″ N20°25′06″ E5153
8Lesko49°27′59″ N22°20′30″ E4203
9Krynica-Zdrój49°24′28″ N20°57′39″ E5822
10Komańcza49°20′21″ N22°03′48″ E4782
11Zakopane49°17′38″ N19°57′37″ E8552
12Kasprowy Wierch49°13′57″ N19°58′55″ E19911
Publisher’s Note: MDPI stays neutral with regard to jurisdictional claims in published maps and institutional affiliations.

