Article

Changes in Intensity and Variability of Tropical Cyclones over the Western North Pacific and Their Local Impacts under Different Types of El Niños

1
State Key Laboratory of Water Resources and Hydropower Engineering Science, Wuhan University, Wuhan 430072, China
2
Department of Safety and Disaster Prevention Research, Seoul Institute of Technology, Seoul 03909, Korea
3
Department of Civil Engineering, Joongbu University, Goyang-si, Gyeunggi-do 10279, Korea
*
Authors to whom correspondence should be addressed.
Atmosphere 2021, 12(1), 59; https://doi.org/10.3390/atmos12010059
Submission received: 12 November 2020 / Revised: 19 December 2020 / Accepted: 29 December 2020 / Published: 31 December 2020

Abstract

:
This study investigated the effects of El Niño events on tropical cyclone (TC) characteristics over the western North Pacific (WNP) region. First, TC characteristics associated with large-scale atmospheric phenomena (i.e., genesis position, frequency, track, intensity, and duration) were investigated in the WNP in relation to various types of El Niño events—moderate central Pacific (MCP), moderate eastern Pacific (MEP), and strong basin-wide (SBW). Subsequently, the seasonal and regional variability of TC-induced rainfall across China was analyzed to compare precipitation patterns under the three El Niño types. When extreme El Niño events of varying degrees occurred, the local rainfall varied during the developmental and decaying years. The development of MEP and SBW was associated with a distinct change in TC-induced rainfall. During MEP development, TC-induced rainfall occurred in eastern and northeastern China, whereas in SBW, TC-induced heavy rainfall occurred in southwest China. During SBW development, the southwestern region was affected by TCs over a long period, with the eastern and northeastern regions being affected significantly fewer days. During El Niño decay, coastal areas were relatively more affected by TCs during MCP events, and the Pearl River basin was more affected during SBW events. This study’s results could help mitigate TC-related disasters and improve water-supply management.

1. Introduction

Recent advances in satellite remote sensing have provided the opportunity to assess the impact of anthropogenic climate change on natural disasters, a topic that has been explored in many studies [1,2,3,4]. Data obtained in studies on climate change can provide the data basis for environmental monitoring and forecasting, which have implications for global agriculture, livestock breeding, forestry, and other natural-resource industries. Damage to industries and infrastructure from events, such as floods or droughts, could be mitigated through an improved understanding of the effects of climate change; for example, knowledge of flood trends could support dam flood-control calculations and repairs [1]. Many studies have shown that tropical cyclones (TCs) have a considerable impact on China’s summer rainfall. Studying TC patterns could help link summer hydrological decision-making in China with global climate trends. In the western North Pacific (WNP), TC-induced rain accounted for 9% of rainfall events and 21% of accumulated rainfall for 1979–2005 [2]. TC events accounted for 37% of natural disaster-related damage in China, and from 1994 to 2013, catastrophic TC events led to an economic loss of approximately 17% in China [3]. Therefore, it is necessary to investigate the changing intensity and variability of TCs, as well as their local impacts.
TC-induced rainfall is affected by many factors, including the El Niño–Southern Oscillation (ENSO) [4,5]. Air–sea interactions in the tropical Pacific generate extreme ENSO events [5]. Zhao et al. [3] investigated TC variability using satellite data from 1979 to 2015, and along with a decreasing trend in the number of TCs in the WNP, they observed a stronger relationship between El Niño and TC activities since 1998. Thus, it is vital to better understand the relationship between extreme ENSO events and TC characteristics to improve climate projections [4]. Many studies have explored factors influencing seasonal precipitation variations, and El Niño events have been found to greatly impact summer precipitation in China [4,6,7,8]. Additionally, TCs that occur in the WNP promote extreme rainfall events accompanied by abnormal advection of moisture. However, El Niño’s effect on rainfall and its indirect impact on the behavior of TCs remain partially understood [4,9]. Therefore, in this study, we evaluated the impact of different types of El Niño events on TC activities and TC-induced rainfall.
A subtropical high is one of several highs that reach the Northern Hemisphere and play an important role in balancing transportation, water supply, energy, and heat, as well as effecting seasonal variations. Thus, the subtropical high has a strong influence on TC tracks and the atmospheric climate of China. Many studies have discussed the linkages between TCs and the subtropical high and their role in increasing rainfall. TCs and TC-induced anticyclonic circulation anomalies promote water vapor transport [10,11,12]. TC events also have a significant impact on the subtropical high and relevant weather changes in the WNP [11,12]. These TC/subtropical high interactions affect the prediction of TC features, such as tracks and heavy rainfall, across East Asia, where the western subtropical high greatly affects the summer climate in East Asia [13].
An investigation of the effects of El Niño on precipitation revealed that ENSO events cause an intense southwest wind along coastal China, which leads to unusual rainfall in northern China in the decaying years of El Niño events [6]. Zhang et al. [7,8] noted that the amounts of TC-induced precipitation in inland China were low compared with that experienced in coastal regions. Further, several studies have indicated that ENSO events affect TC characteristics, such as their tracks and genesis positions [9,14], and their intensity [15,16]. In addition, TCs tend to occur more frequently and have a longer lifetime when occurring in the context of a strong ENSO [17]. However, few studies have emphasized the distinctions between types of El Niño events and their effect on TCs. As the characteristics of TCs and impacts induced by TCs vary, they must be studied separately. From a long-term perspective, discussing links between El Niño events and the impacts of TCs, such as induced rainfall, is crucial.
Zonal and meridional asymmetries in weather and oceanic conditions contribute to the diversity of ENSO forms, which reflect the complicacy of atmospheric feedbacks [18]. Some studies categorized El Niño events as Central Pacific (CP) or Eastern Pacific (EP) events. Cai et al. [19] noted that during the development of EP El Niño events, seasonal rainfall decreases in South America, whereas it increases during El Niño decay. However, in CP events, precipitation patterns are more complicated and remain unclear. Wang et al. [20] applied a nonlinear K-means cluster analysis to distinguish El Niño events of various magnitudes with greater specificity. The method classifies El Niño events based on three types of onsets: moderate central Pacific (MCP), moderate eastern Pacific (MEP), and strong basin-wide (SBW) events. SBW El Niño events are significant in their intensity, particularly in the initial winter and spring, with maximum SSTAs reaching over 2.5 °C [21]. They are coupled with strong atmospheric convection and warm SSTAs, and experience extraordinary basin-wide growth in the boreal spring. They induce SSTAs that spread easterly, causing abnormalities in the west. MCP El Niño events originate in the CP with continuous moderate warming. They extend eastward and reach their maximum intensity in the CP, accompanied by convective wind anomalies. In contrast to SBW activities, the western SSTA in MCP events occurs in the interior of the basin and develops later. MEP El Niño events begin in the far EP. Owing to SSTA-induced negative wind-pressure anomalies that facilitate the westward movement of warming by inhibiting upwelling, the easterly wind anomalies are uniquely and significantly reversed in the central-western Pacific [20].
The amount of rain varies in the emerging and warming phases of El Niño, and the spatiotemporal changes in water vapor tracks depend on the El Niño types [21]. As the ENSO classification system becomes increasingly refined, the relationship between El Niño and TCs characteristics can be analyzed in greater detail. Owing to the delayed atmospheric response to oceanic behavior in El Niño, better knowledge of regional precipitation patterns could simplify rain forecasting [22]. Therefore, this study analyzed differences between the effects of three El Niño types (MCP, MEP, and SBW) on TC activities in the WNP and on the seasonal variability of TC-induced rainfall in China. In addition, this study analyzed rainfall indices for fractional TC-induced precipitation during the study period and applied them to determine optimum forecasting models for the study region. The results of this study could support measures to reduce and mitigate TC-related disasters and improve water-supply management under changing climate conditions.

2. Materials and Methods

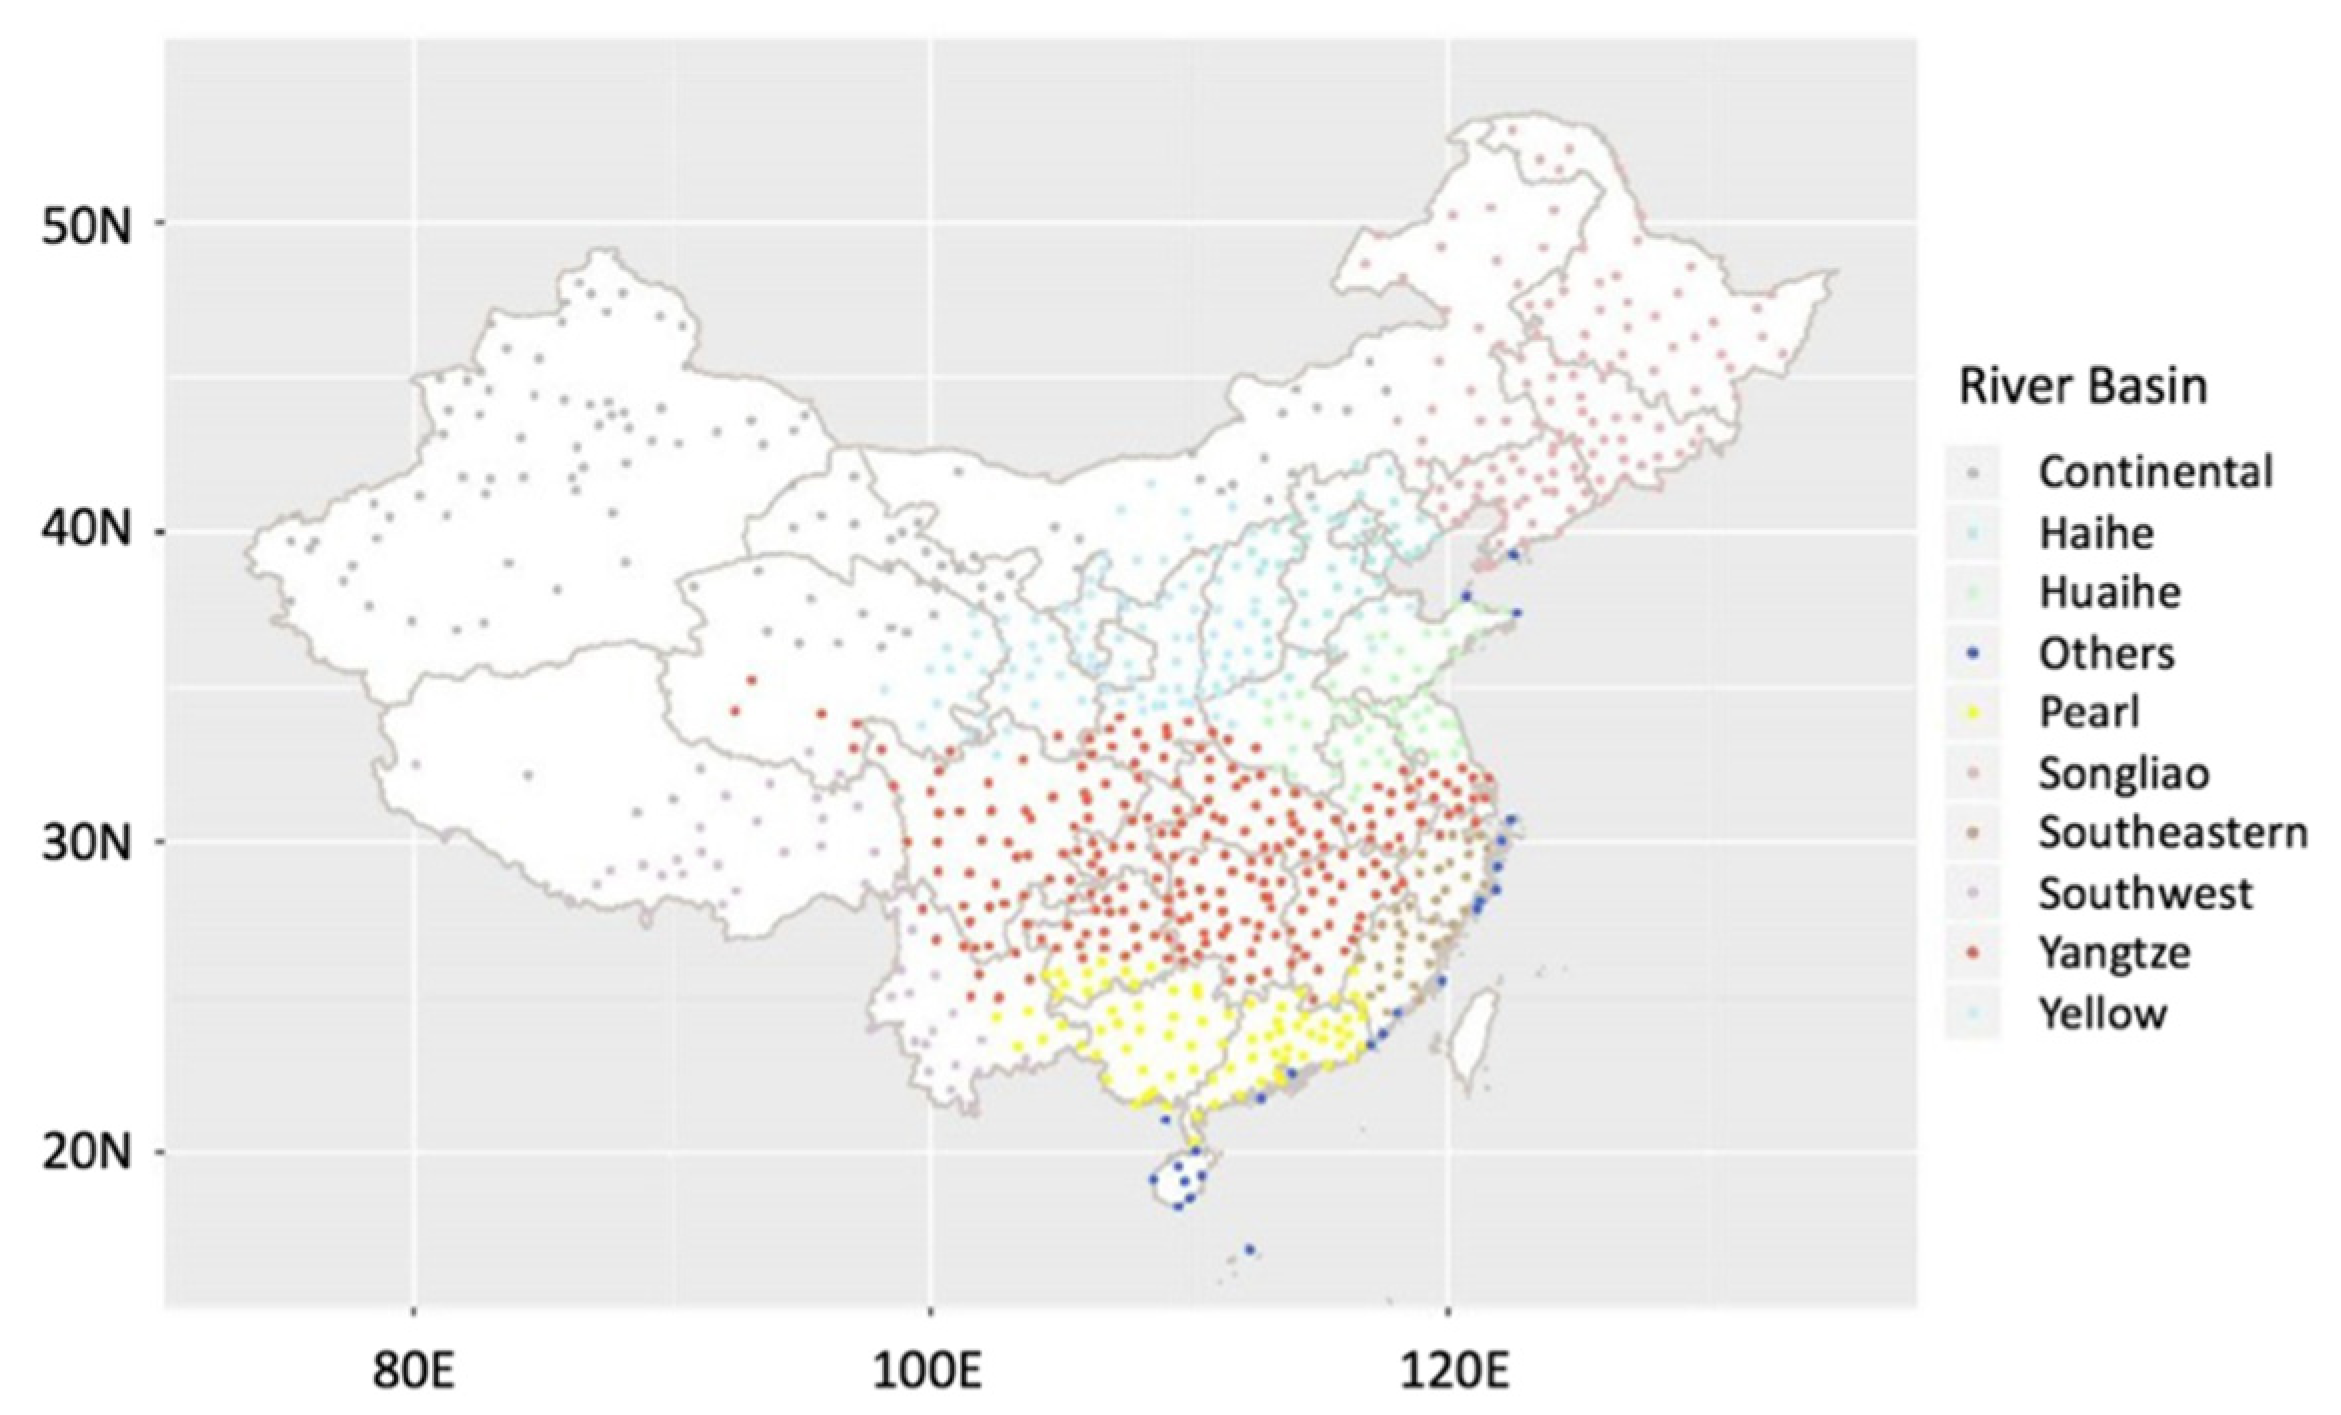
2.1. Study Area and Weather Stations

Figure 1 shows the study area and location of active weather stations in China. TC impacts are experienced throughout China, but especially in the country’s southeastern area and the Pearl River basin. Therefore, this study selected the area spanning from the equator (EQ) to 60° N and 60° E to 180° E, which includes all regions of China and the areas tracked by TCs. When analyzing the tracks of TCs throughout Asia, the application of a grid map allows the effective visualization of the density of TC distribution. This study utilized daily precipitation data from 839 meteorological stations within nine river basins in China, which were provided by China’s Meteorological Data Service Center. Some relatively early data were missing because of observation errors and underdeveloped equipment. Therefore, we selected daily accumulated rainfall data from 1961 to 2017 at 839 stations to measure the influence of different TC patterns on all river basins throughout China.
To study the local impacts of TCs, this study considered TC-induced precipitation separately from daily rainfall, which increased the accuracy of the comparative analysis. Kim et al. [23] used different time windows and TC radii to consider the spatiotemporal impacts of TCs. Time windows, an empirical methodology developed by Kim and Jain [23] to study seasonal flow separation in the Korean Peninsula, specify the timeframes impacted by TCs and extract TC-induced rainfall from daily precipitation data. This study adopted a three-day time window to reflect the duration of the relevant moisture supply [24]. Among precipitation indices widely applied in previous studies to perform trend analyses and regional rainfall calculations [7,8,25], this study selected seasonal total precipitation on wet days when daily precipitation >1 mm (PRCPTOT), the maximum number of consecutive TC-induced precipitation days (CTPD), to help to analyze regional rainfall characteristics and summarize the distribution of precipitation.

2.2. Classification of El Niño Events

To distinguish the impacts of diverse TCs, this study focused on TCs that occurred during different types of El Niño events. By applying the K-means cluster analysis to the development of the SSTA for 33 extreme El Niño events from 1901 to 2017, first-year El Niño events were classified into three types—MCP, MEP, and SBW—which vary in origin, initiation, outspreading, strength, and other features (see Table 1). These parameters were determined based on the Niño 3.4 index, which is derived from SSTAs calculated using the Hadley Center Sea Ice and SST dataset version 1 (HadISST1) from the Met Office Marine Data Bank and WMO GTS data by removing the mean SST in the region (170° W–120° W, 5° S–5° N). “Extreme” El Niño events were defined according to Wang et al. [20]. The SST data and Niño 3.4 index values were obtained from the Ocean Observations Panel for Climate (OOPC) and the Joint WMO-IOC Commission for Oceanography and Marine Meteorology (JCOMM) Services program area. They served to verify the characteristics of selected El Niño events to reduce errors owing to different data-capture regions.
In general, during the mature phases of MCP, MEP, and SBW events, their associated SSTAs are clearly distinguishable in terms of temperature distribution and intensities and thus result in spatiotemporal precipitation and track variations [20]. Considering their intensity and rapid propagation, the developing years are defined as the years in which El Niño occurs. Our cluster-based approach classified 1986/87, 1991/92, 1994/95, 2002/03, 2004/05, 2006/07, 2009/10, and 2014/15 as years of MCP; 1957/58, 1963/64, 1965/66, 1968/69, and 1976/77 as years of MEP; and 1972/73, 1982/83, 1997/98, and 2015/16 as years of SBW.

2.3. Tropical Cyclone Data

The Regional Specialized Meteorological Center (RSMC), a Tokyo-based meteorological organization, provided the original data and attributes for TCs. These data describe the propagation of TCs, including the geographical coordinates of the TC center, the central pressure, the TC identification number at fixed 6-h time intervals from 1951 to 2017. This information is also recorded in the dataset describing the strength of the max wind speed since 1977. Among these data, this study focused on those pertinent to TCs that occurred in the selected decaying years and affected China, including their genesis position, tracks recorded at 6-h intervals, recurving location (location at which the TC, at its westernmost position, shifts its track to the northeast), central pressure, wind speed, and duration. In general, non-recurving TCs were excluded when calculating the recurving location density over an area [26]. Non-recurving TCs represented 72.04% (for MCP events), 78.57% (for MEP events), and 83.72% (for SBW events) of events. The subtropical high was another considered parameter. The subtropical high (based on the contour line of 5880 gpm at 500 hPa) was derived from the National Centers for Environmental Prediction/National Center for Atmospheric Research (NCEP/NCAR) reanalysis 1 [27].
TC tracks are defined as a series of points over which the TC centers (defined as the center of a circle) pass. Therefore, it is important to define a suitable TC radius to distinguish TC-induced effects from other weather patterns. Assuming all TCs have an equal effect over China, a fixed radius of 500 km was found to include some non-TC-induced rainfall in the total calculated [28]. Mature TC winds usually impact a radius of less than 500 km [26]. Thus, to obtain more accurate statistics on TC-induced precipitation, this study considered a range of TC radii (400–600 km) to reduce error related to non-TC-induced rainfall. This study extracted TC-induced rainfall based on these tracks from the total rainfall during May to October in the selected years using an n-day time window. On days of TC landfall, most rainfall could be assumed to be TC-induced; thus, all rainfall from these days was included.

2.4. Methodology

2.4.1. Kriging

In statistical calculations, primarily in geostatistics, kriging (or Gaussian process regression) is an interpolation method modeled on Gaussian procedures wherein interpolated values are controlled by prior covariances, thus providing a computationally stable and efficient output [28]. Kriging is often applied in the fields of geographic science, environmental science, and atmospheric science [29]. Meteorological data, such as precipitation, have significant spatial characteristics. Since this kind of data comes from spatially discretely distributed monitoring stations, which are unevenly distributed and limited in number, the kriging method is applied to make an overall and coherent rainfall distribution. Many studies have used this kriging method for distribution analysis [30,31,32].

2.4.2. Welch’s t-Test

The t-test is an inference-based statistical method used to determine whether differences exist between different samples [33]. Among these, Welch’s t-test is applied when the number of items within each set is different and the variances of the two groups are unknown or unidentical to identify discrepancies. Welch’s t-test was selected to compare rainfall indices during different El Niño events with a long-term mode, which have usually been considered “unpaired” or “independent samples” [34].
Decadal hydro-meteorological indices, with a relatively small and nonstationary number of samples, meet the requirements for Welch’s t-test [35]. Welch’s t-test is defined as follows by the statistic t in the following formula (Equation (1)):
t   =   X ¯ 1 X ¯ 2 S 1 2 n 1 + S 2 2 n 2
where X ¯ 1 ,   X ¯ 2 are the sample means, n1 and n2 are the sample sizes for sample 1 and sample 2, respectively. S 1 2 and S 1 2 are the sample variances.
The variance is a function calculated as follows (Equation (2)):
S 2 = ( X X ¯ ) 2 n 1
By selecting data that satisfied t at the 95% significance level, this study ensured that the included data were representative of the stations in each river basin and were sensitive to TCs.

2.4.3. Pettitt Test

The Pettitt test is a nonparametric test used to assess the occurrence of sudden changes in records [36]. The Pettitt test is the most commonly utilized method of breakout detection owing to its sensitivity [37]. Many studies have adopted this test, including those analyzing precipitation and temperature [38,39], as it can detect a mutation points within specific periods of time in many climate records [40].
The regions affected by TCs change over time and are subject to various TC intensities and tracks. Therefore, it is necessary to consider the long-term “ramping-up point” in each river basin and to comprehensively determine propagation of the TC-induced rainfall. However, the Pettitt test can be applied to discern a significant transformation in the mean of a time series without prior knowledge of the ramp-up point. The nonparametric statistic K   T , the ramping-up within period T, is defined as follows (Equation (3)):
K   T = Max | U t , T |
U t , T = i = 1 t j = t + 1 T sign ( x i x j ) ,   1 t < T
where U t ,   T is a statistical index, and x is a random variable.
Subsequently, for the significance analysis, the correlative confidence level ρ and the roughly critical value p were defined as follows (Equation (5)):
ρ = 2   exp ( 6   K T 2 T 2 + T 3 )
p = 1 ρ

3. Analysis Results

3.1. Characteristics of TCs under Different Types of El Niños

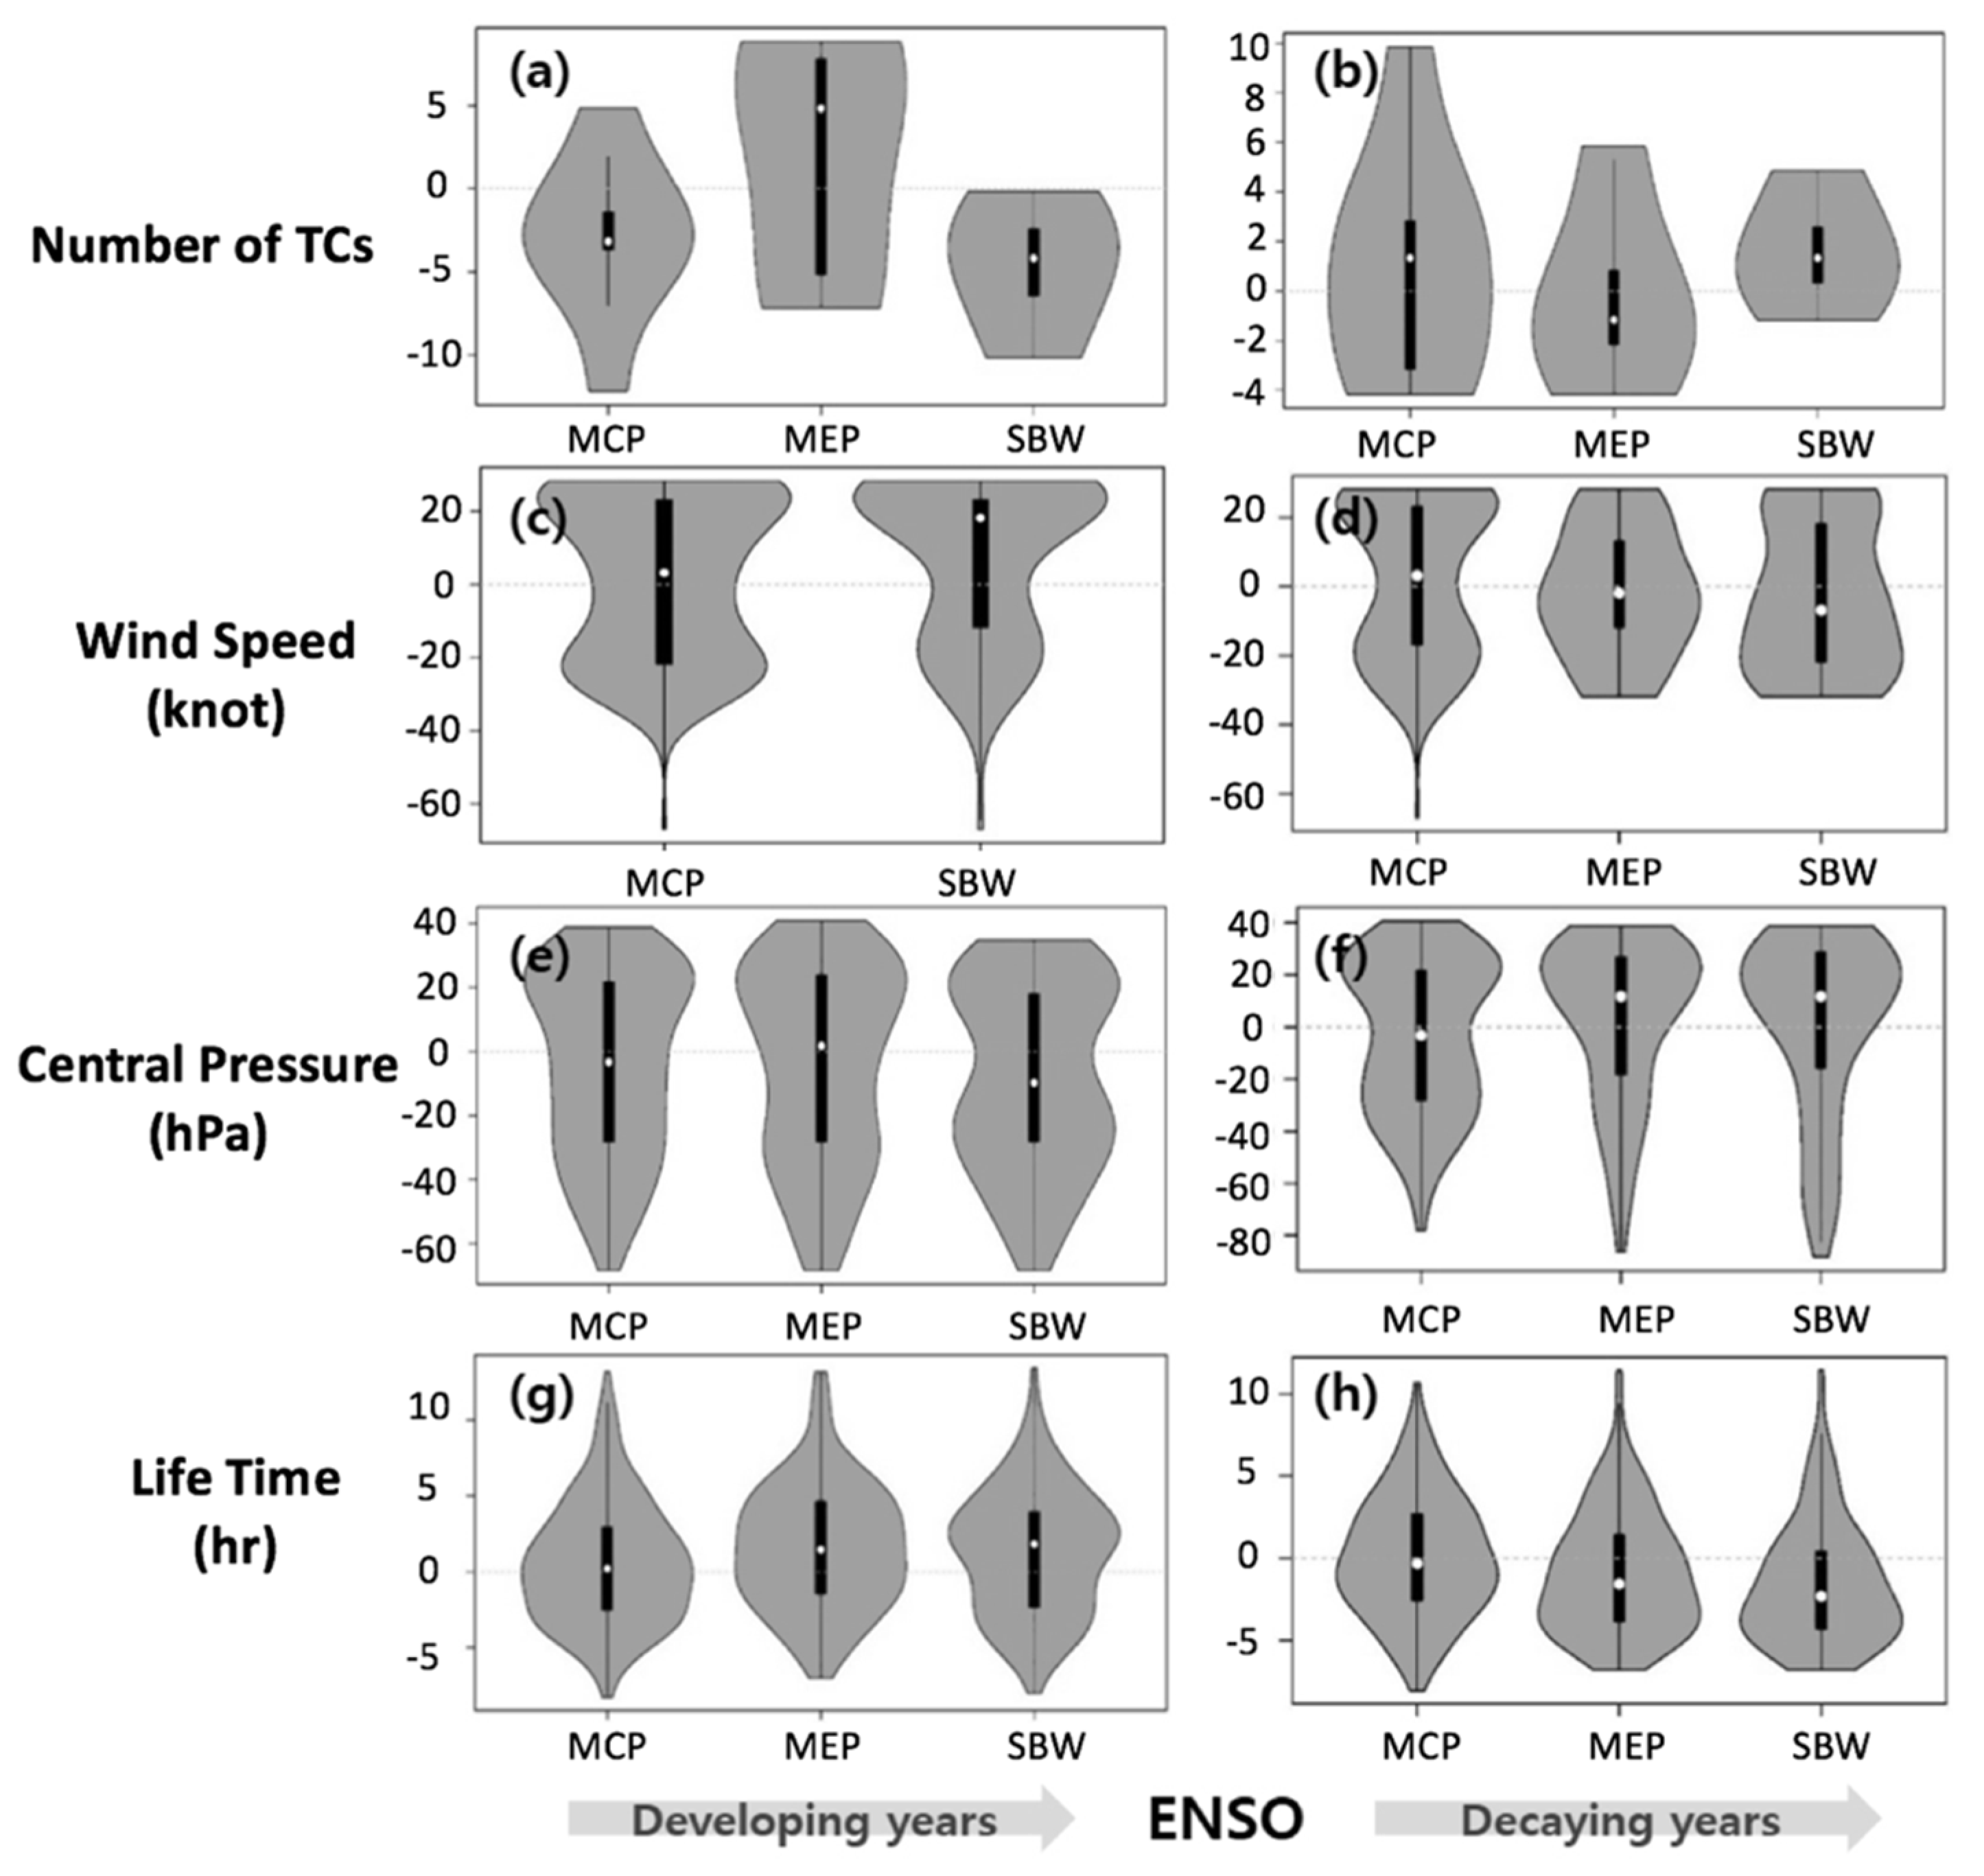
3.1.1. Magnitude of TCs

To analyze the characteristics of TCs, we discussed variations in TCs during the developing and decaying years of MCP, MEP, and SBW El Niño events and compared them with long-term averages to help predict the behavior of TCs occurring under different ENSO types and phases.
Figure 2 shows the distribution of TC data observed across the WNP and its probability density during the developing and decaying years of ENSO. TCs were recorded, with 186, 140, and 86 events, respectively, during MCP, MEP, and SBW decaying years. TCs occurred more frequently during MEP events than during the other El Niño types with an average of 28 times a year. During SBW decaying years, the number of annual TCs was above average. To explore the varying effects throughout El Niño periods, we studied both the emerging and decaying years. During MCP, MEP, and SBW developing years, 217, 130, and 112 TC events were recorded, respectively. In addition, there was little interannual variation within the El Niño types, and the number of TC events in MCP and SBW decaying years was greater than that during developing years. However, the number of TCs increased significantly during MEP developing years.
Because wind speed data were only available for 1977, wind speed statistics for MEP events were limited. In 1977 (characterized by MEP decay), only 21 TCs were produced, and no data were available for emerging years. There were 81 TC events during the three SBW events in 1977. The wind speed data indicated that these TCs were weaker than the long-term average and that anomalies were more concentrated in the range of −30 to 20 knots in the decaying years of MEP and SBW events. However, TCs occurring during SBW emerging years had significantly faster wind speeds. TCs during MCP events were little impacted by El Niño phases and featured slightly higher wind speeds than the long-term average. TCs with relatively low wind speeds were observed during SBW decaying years. Central pressure anomaly changes were relatively minor during MCP events, and pressure remained slightly below the multiyear average. TC intensity was obviously greater during SBW emerging years. In MEP and SBW decaying years, most TCs were weaker than average, though a few extremely strong TCs occurred. In terms of duration, the lifespan of TCs ranged widely during El Niño emerging years. The differences in duration were relatively significant in SBW years but were less marked during MCP events.

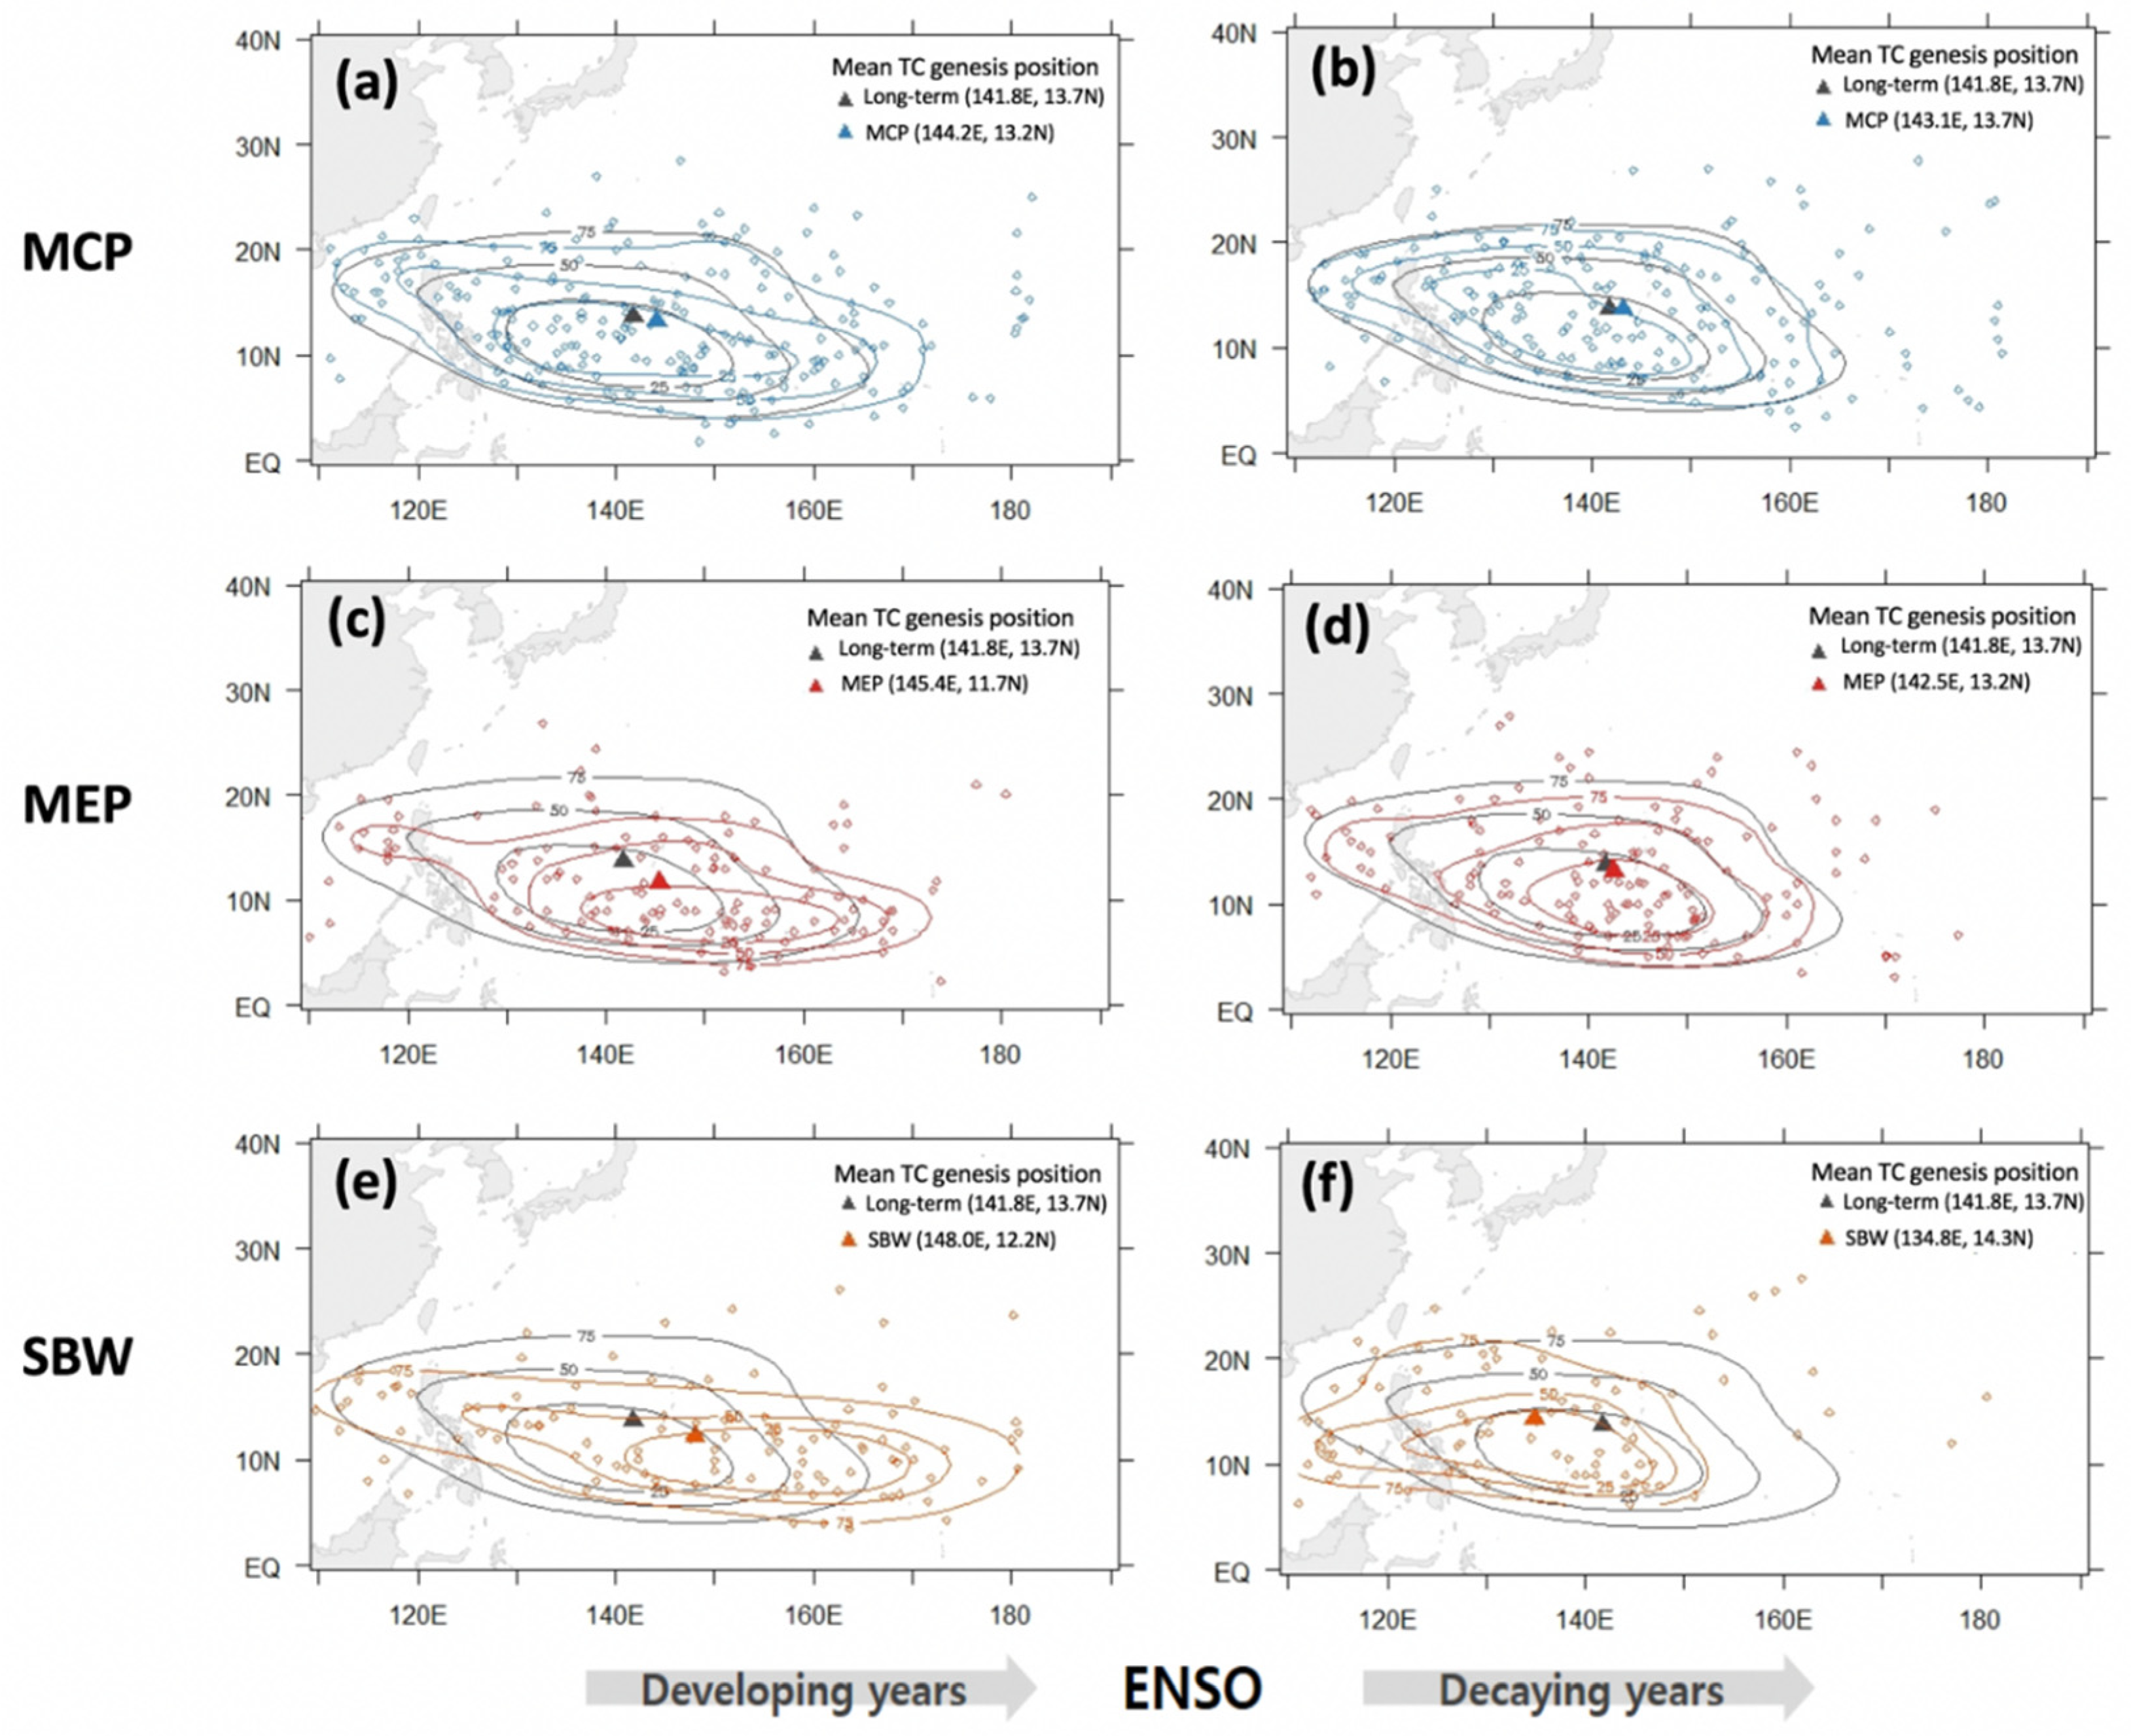
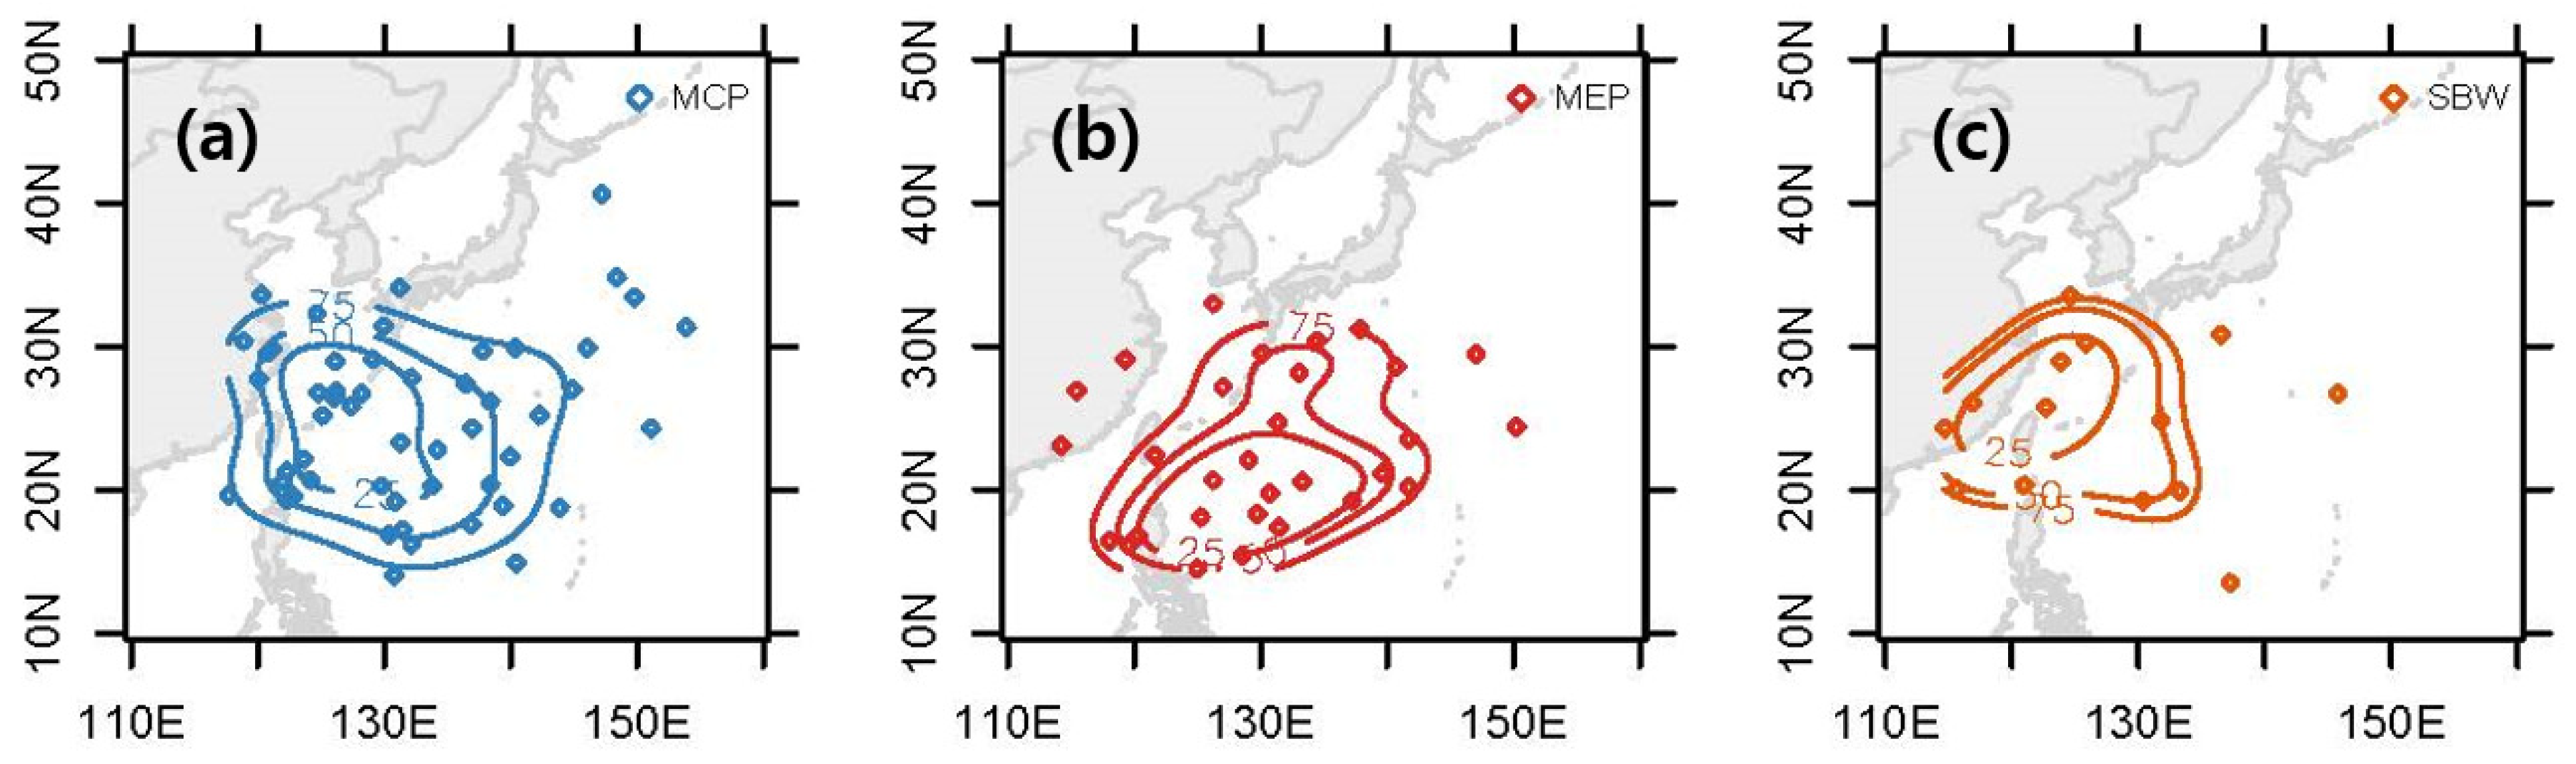
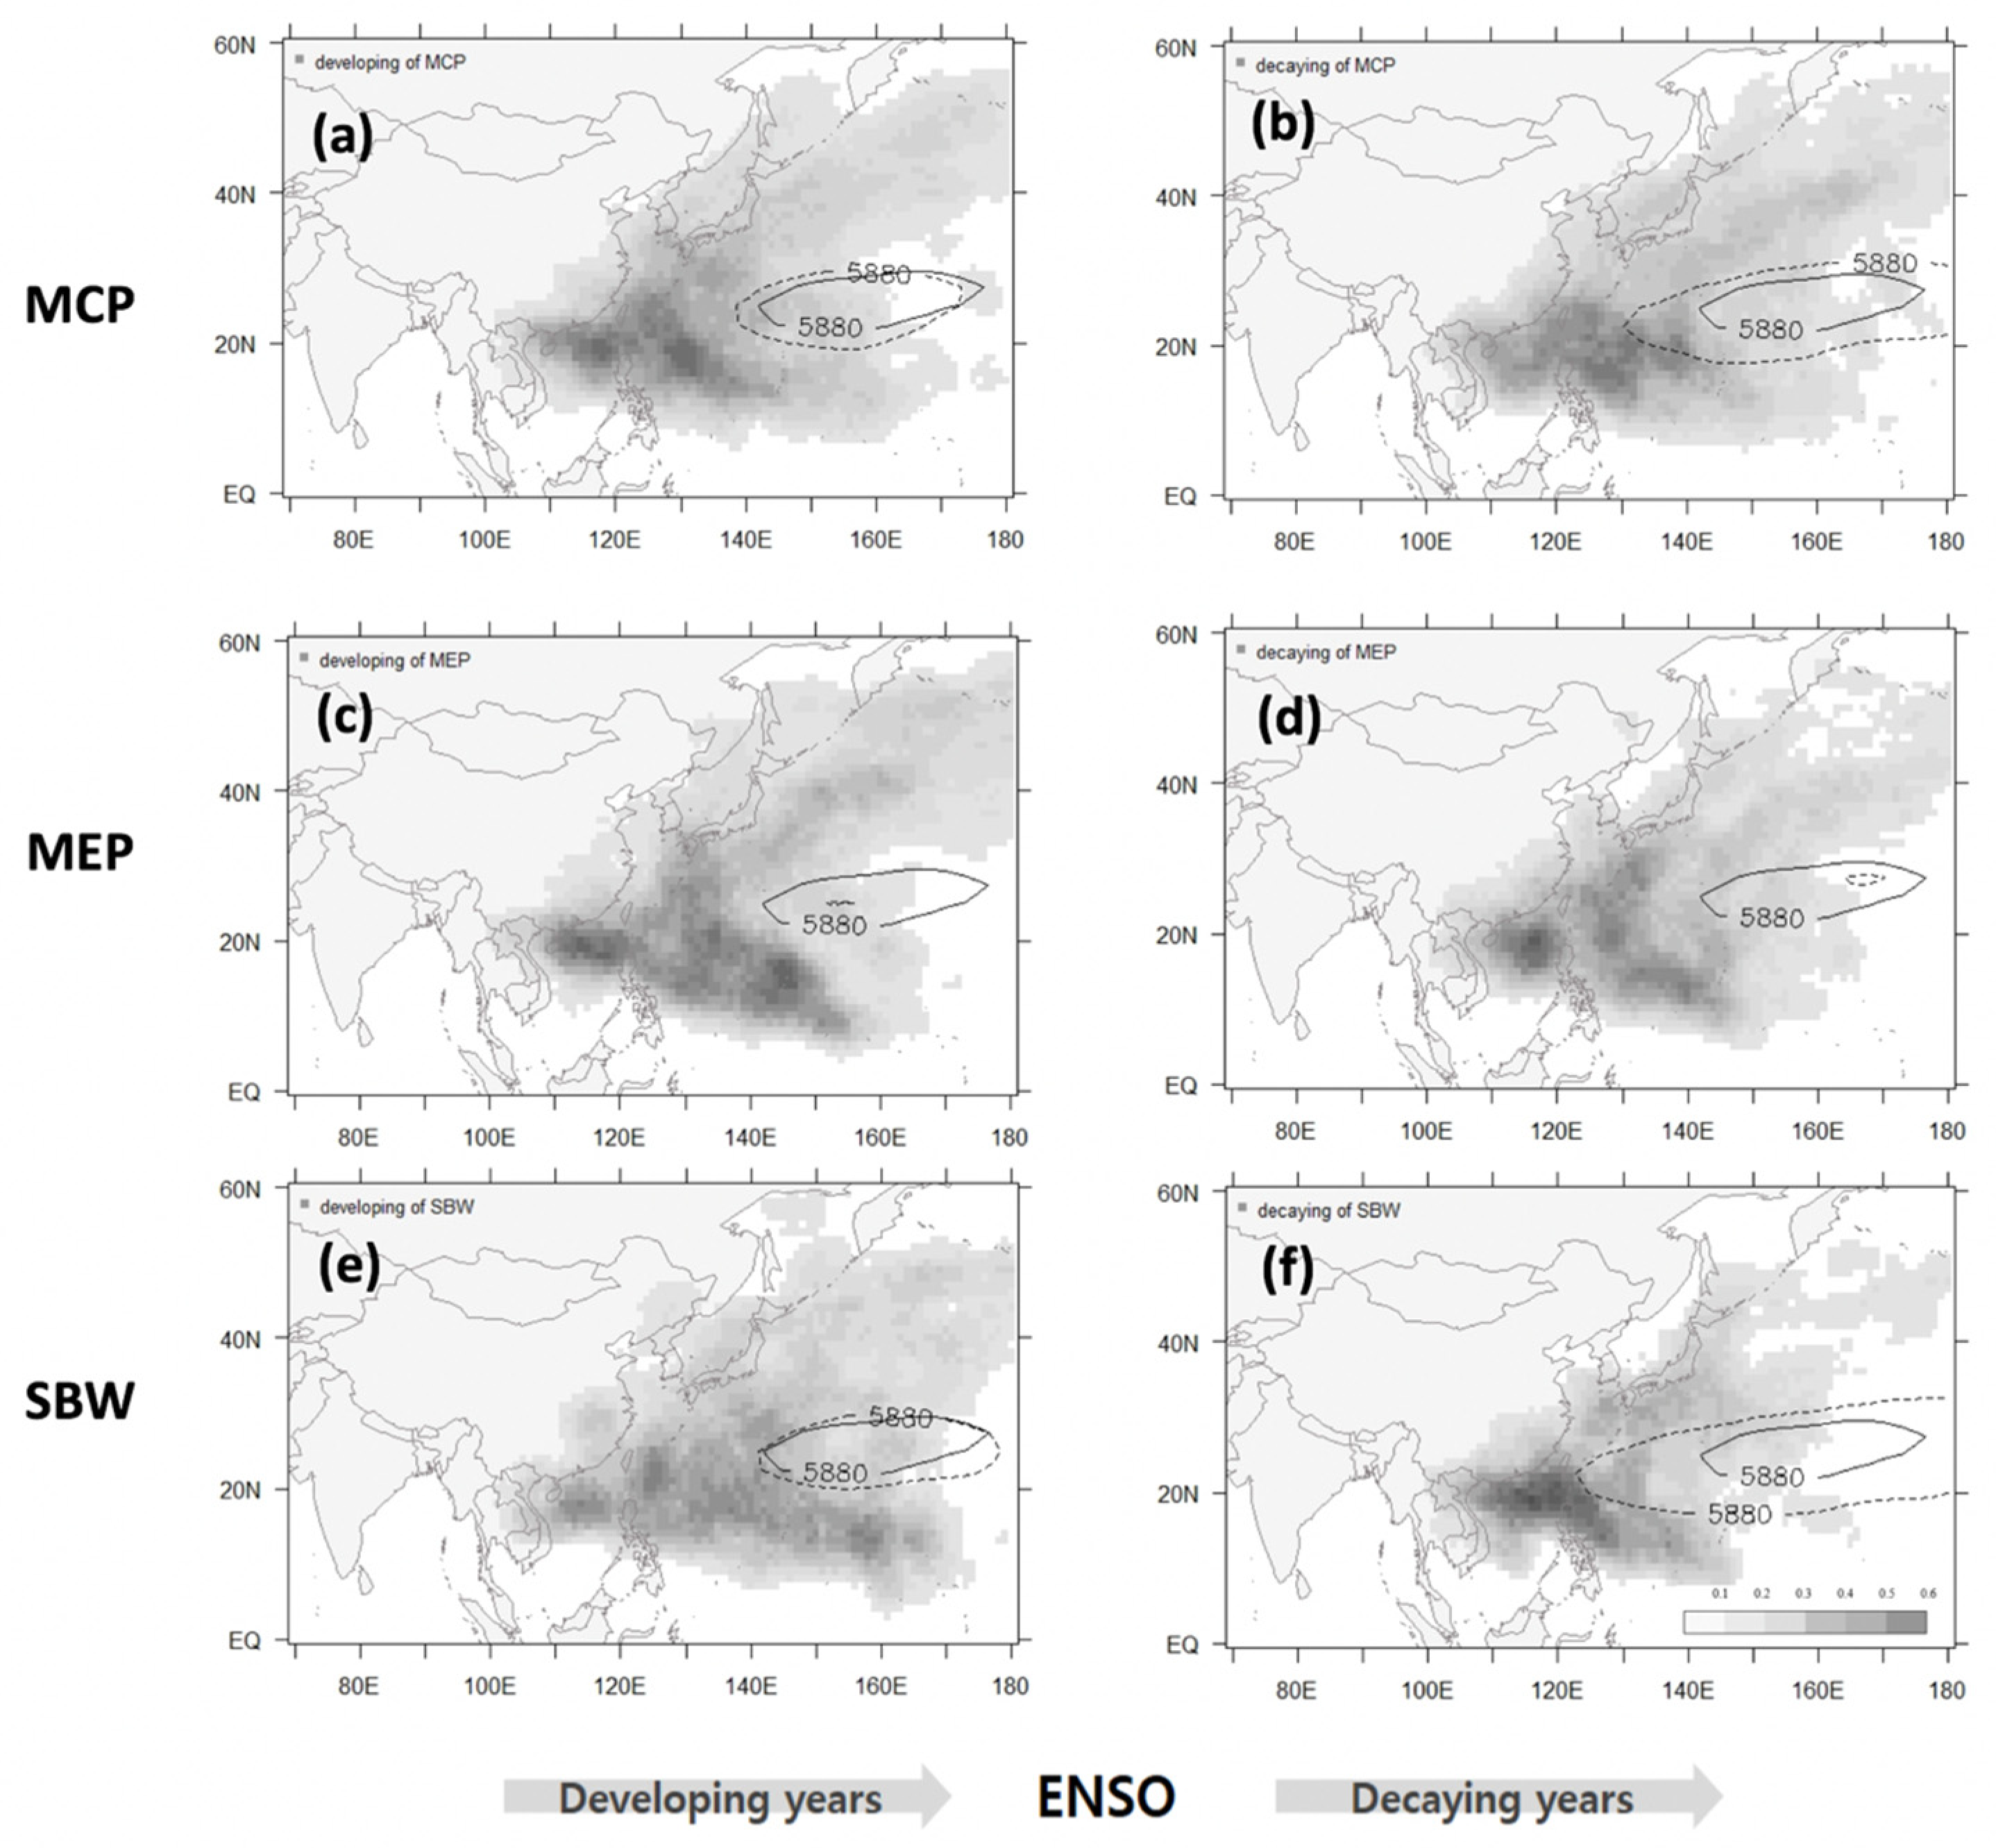
3.1.2. Genesis Positions and Tracks of TCs

Figure 3 shows the genesis positions of TCs in the WNP Ocean region during the different types of El Niño years. The genesis positions in MCP emerging (Figure 3a, average TC genesis: 144.2° E, 13.2° N) and decaying years (Figure 3b, average TC genesis: 143.1° E, 13.7° N) were similar to those in average years (average TC genesis: 141.8° E, 13.7° N). In MEP developing years, genesis locations were relatively concentrated at lower latitudes (Figure 3c, average TC genesis: 145.4° E, 11.7° N). However, during MEP decay, the genesis locations (Figure 3d, average TC genesis: 142.5° E, 13.2° N) were close to their long-term normal distribution. In contrast, the genesis positions in SBW decaying years tended to be more westerly and closer to China (Figure 3f, average TC genesis: 134.8° E, 13.2° N).
Figure 4 shows the density circle of recurving locations during the decay period of three types of El Niño events. Overall, 52, 30, and 14 TCs displayed recurving features (during MCP, MEP, and SBW events, respectively). During SBW events, these points are located close to China, and the contours were wider during MCP events. Recurving points during MEP decay were located in lower latitude zones.
Figure 5 shows the subtropical high, represented by 5880 gpm, in the WNP region for various El Niño conditions. A close relationship exists between the subtropical high and TCs as streams expand and convection occurs [41]. TC expansion and recurving locations were affected by the pressure zone. During MEP decaying years, the subtropical high was distinguished by a limited pressure range. As extreme events propagated, the range of the subtropical high widened during MCP and SBW events. Regarding track density, TCs generated in the WNP usually originated near the southern edge of the subtropical high and moved along its periphery. During MCP and SBW decaying years, the subtropical high was slightly stronger than its long-term average.

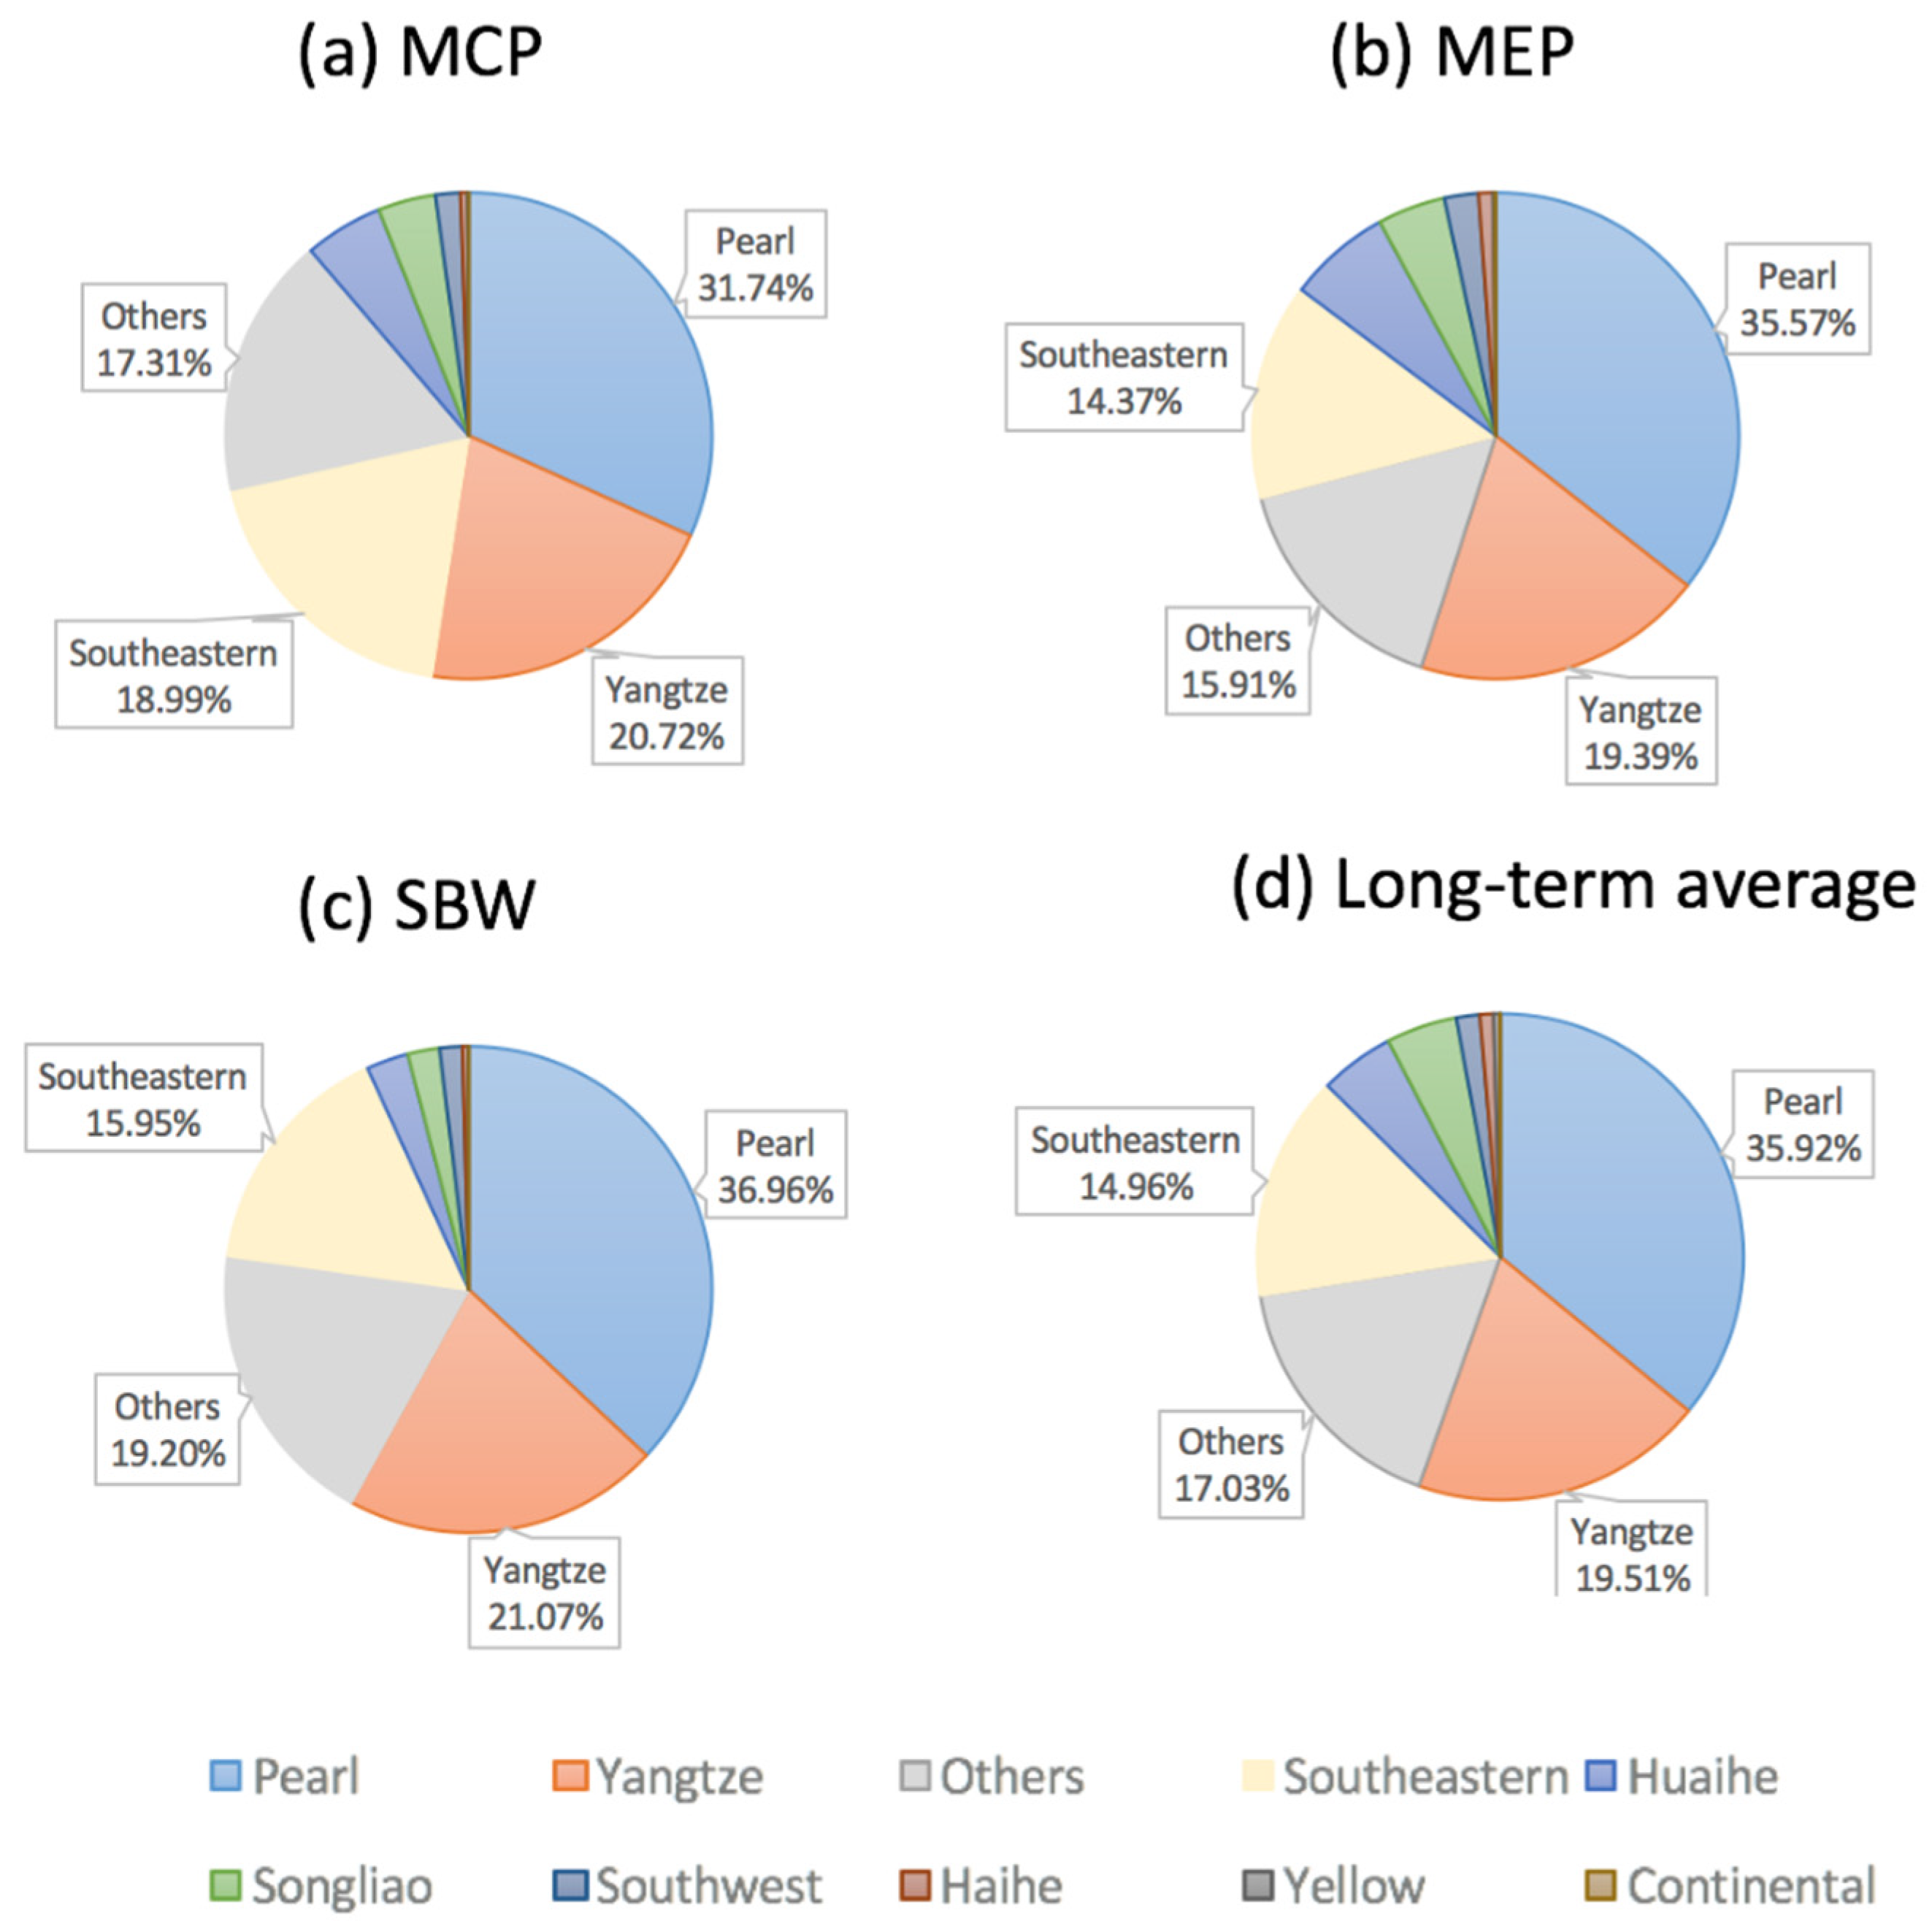
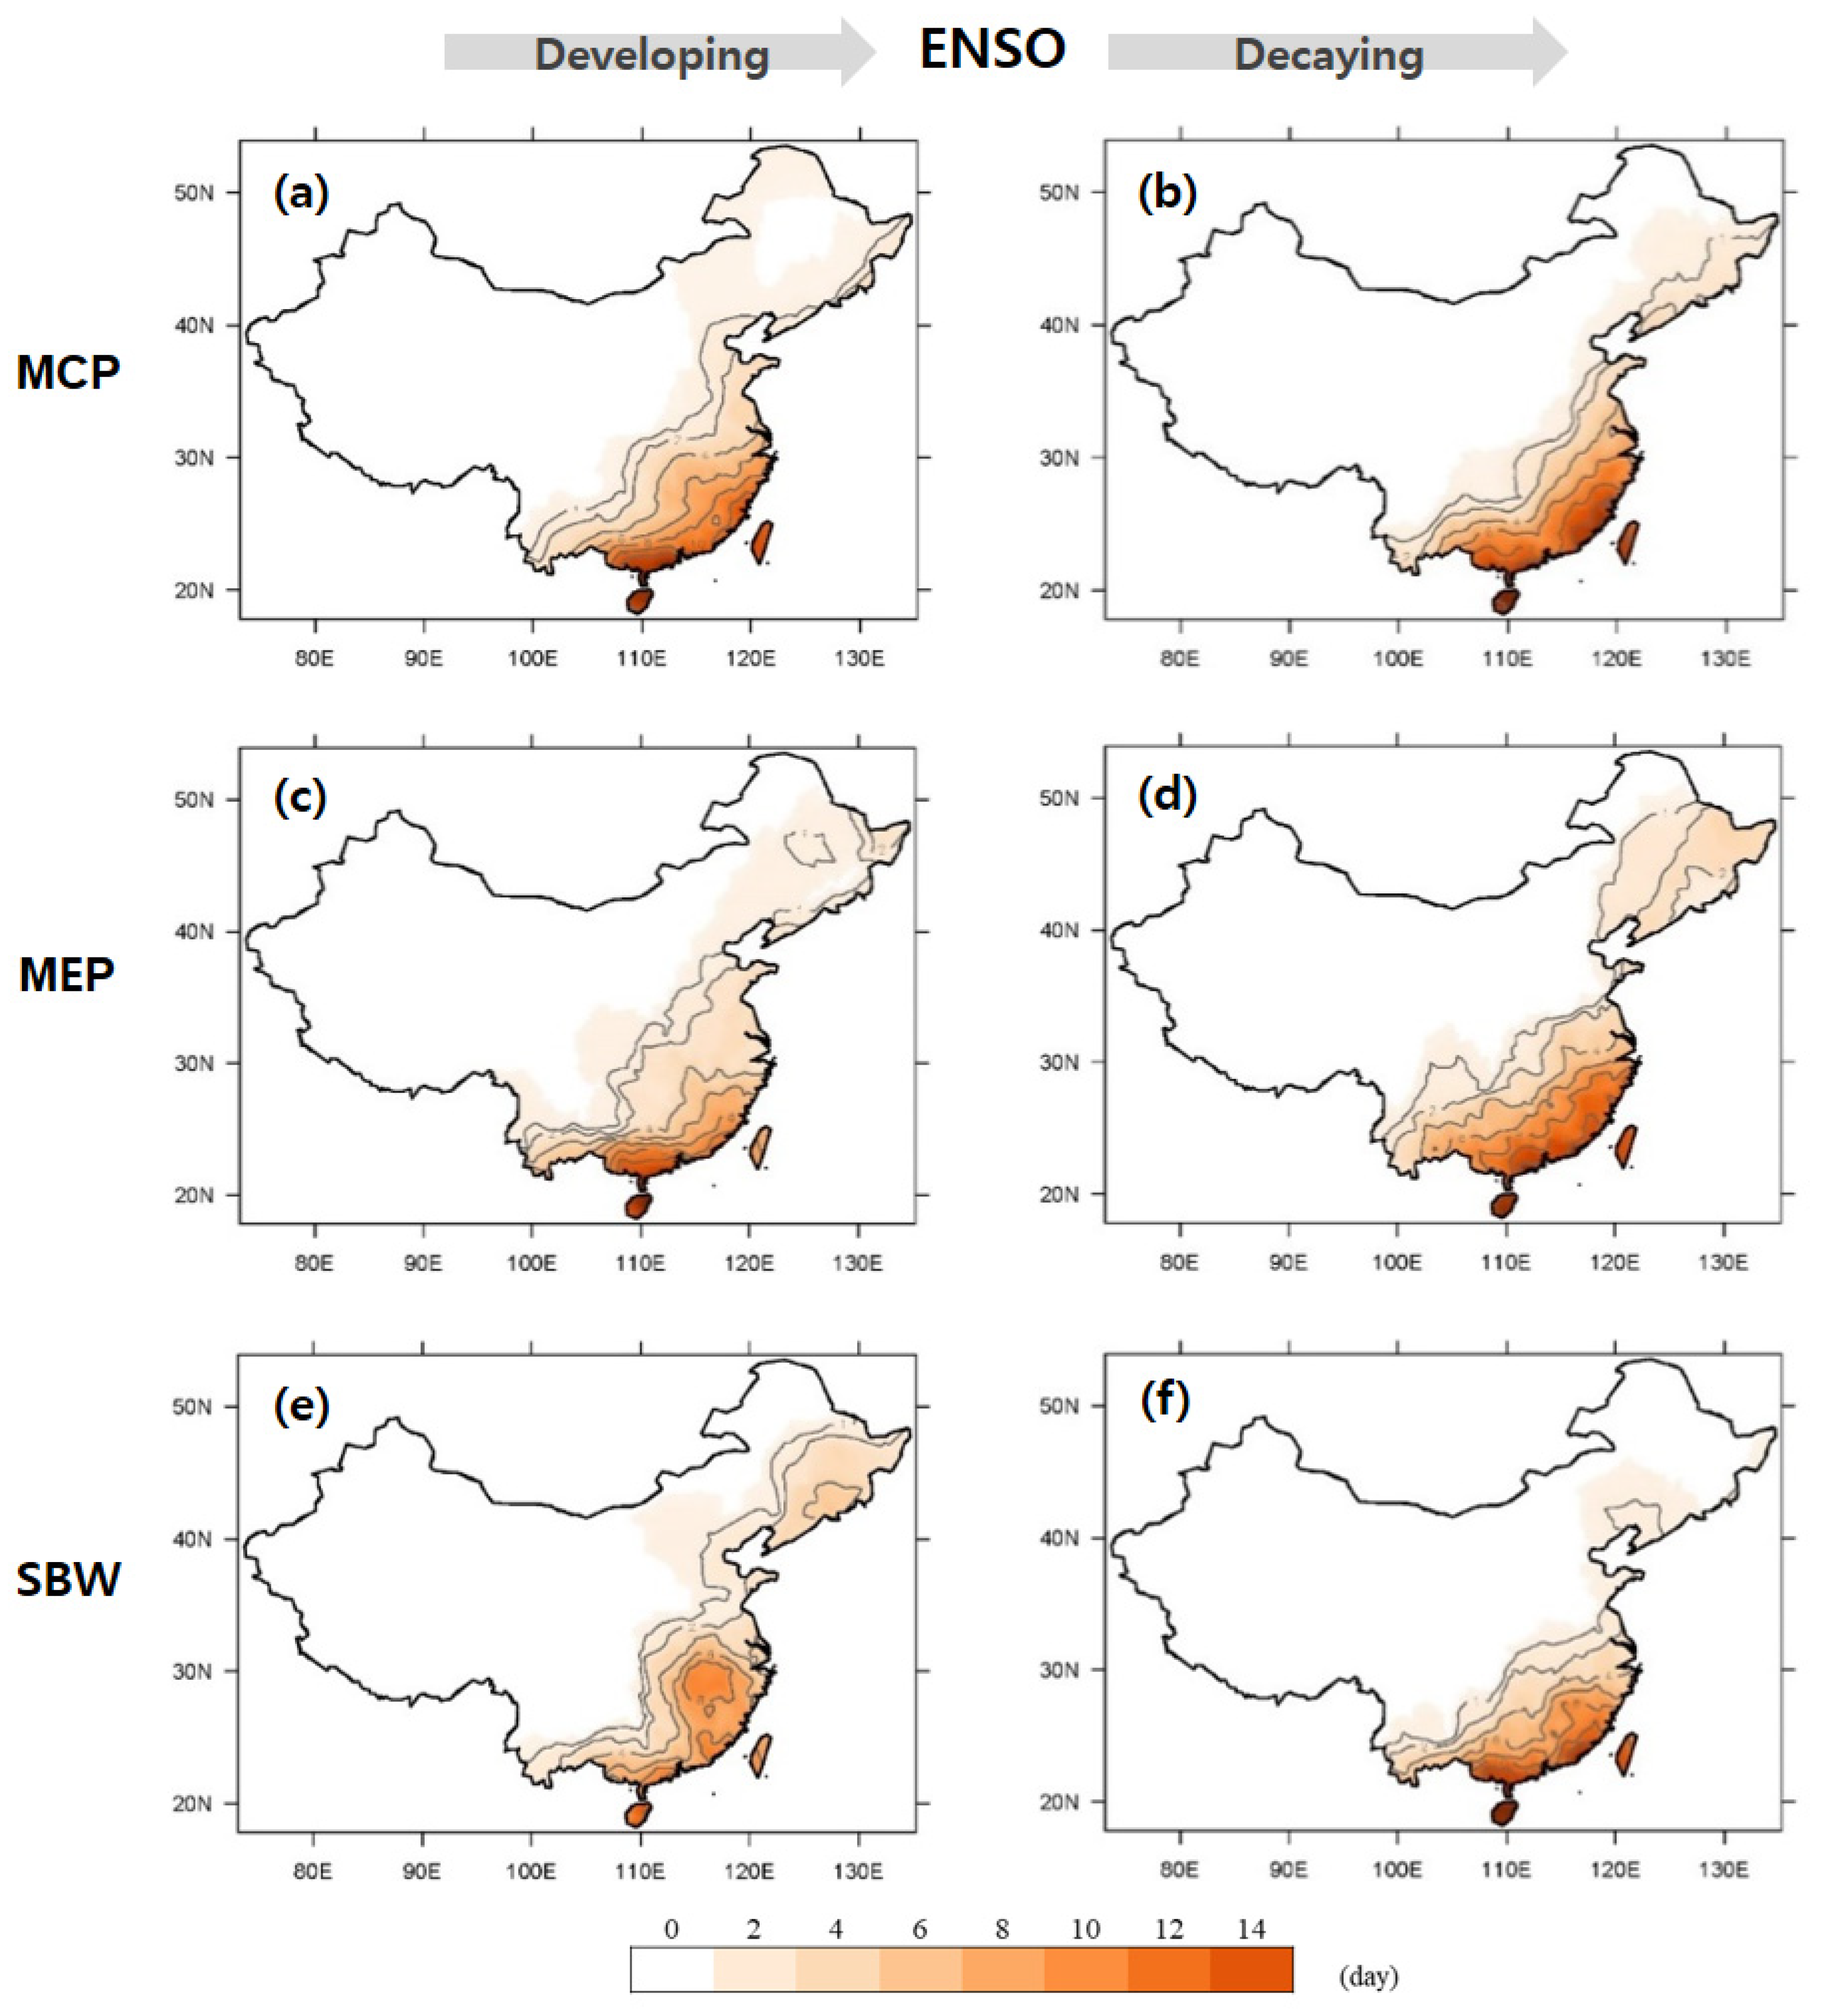
3.2. TC-Induced Rainfall over China

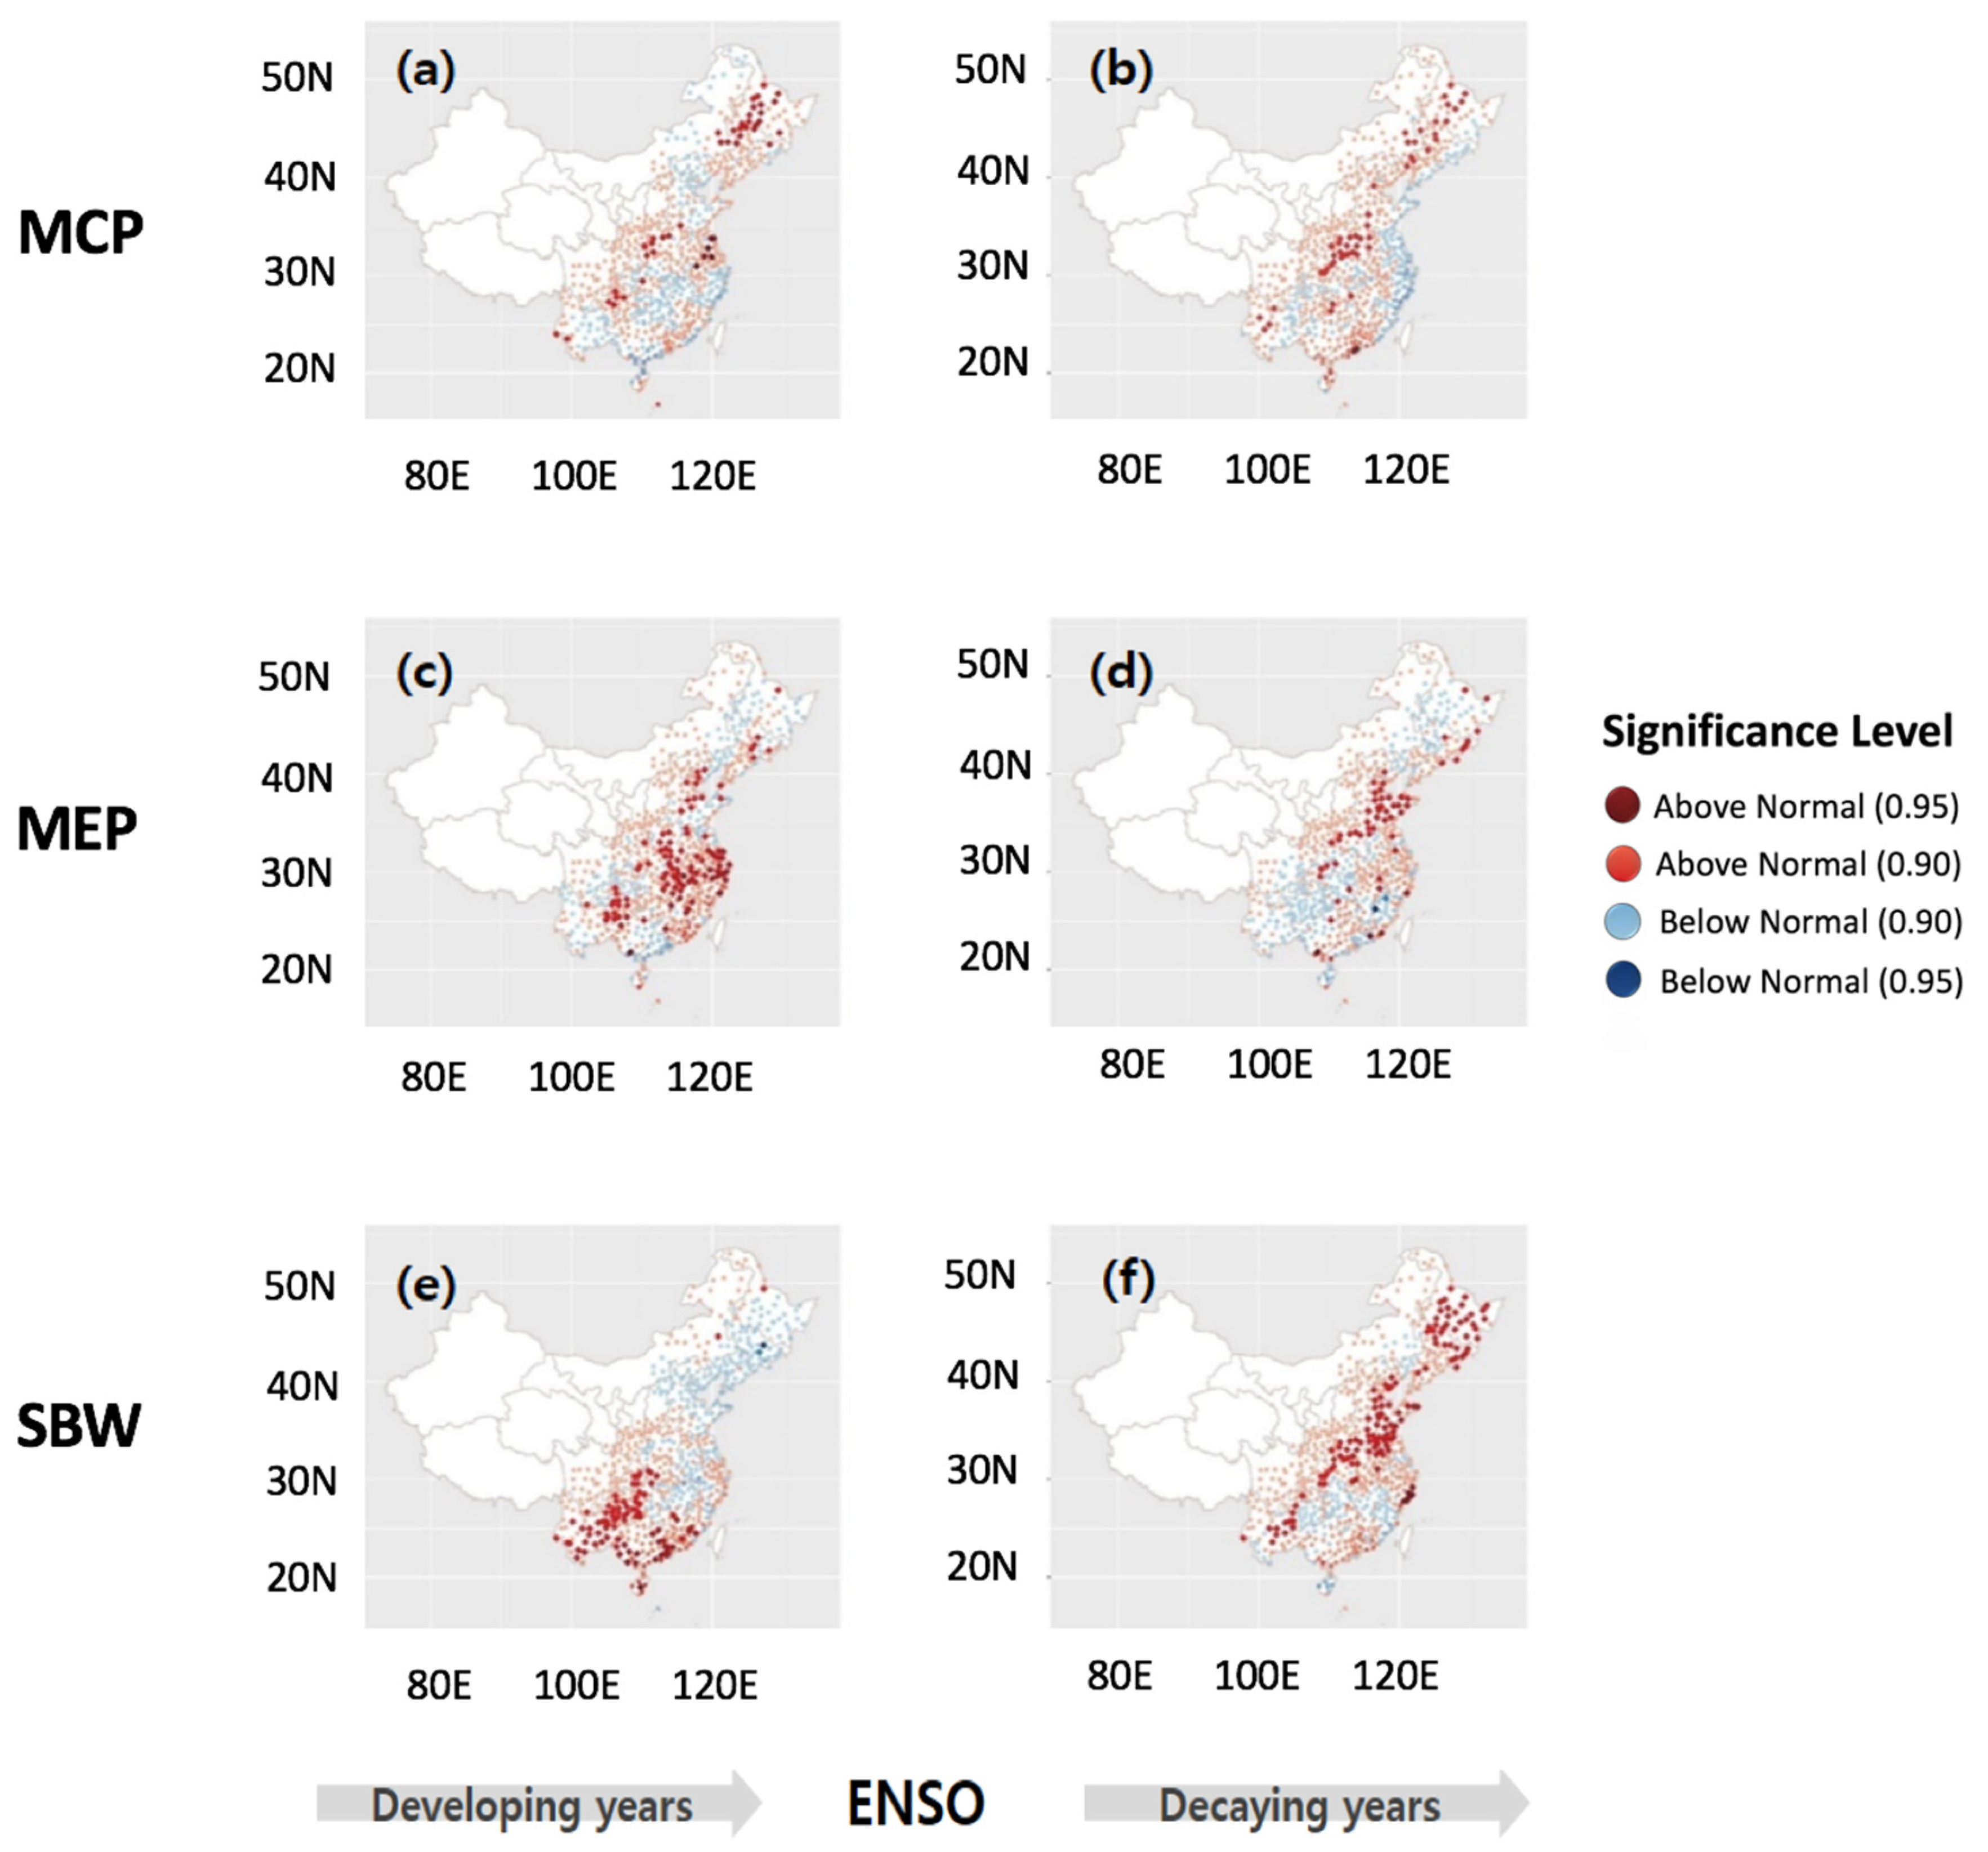
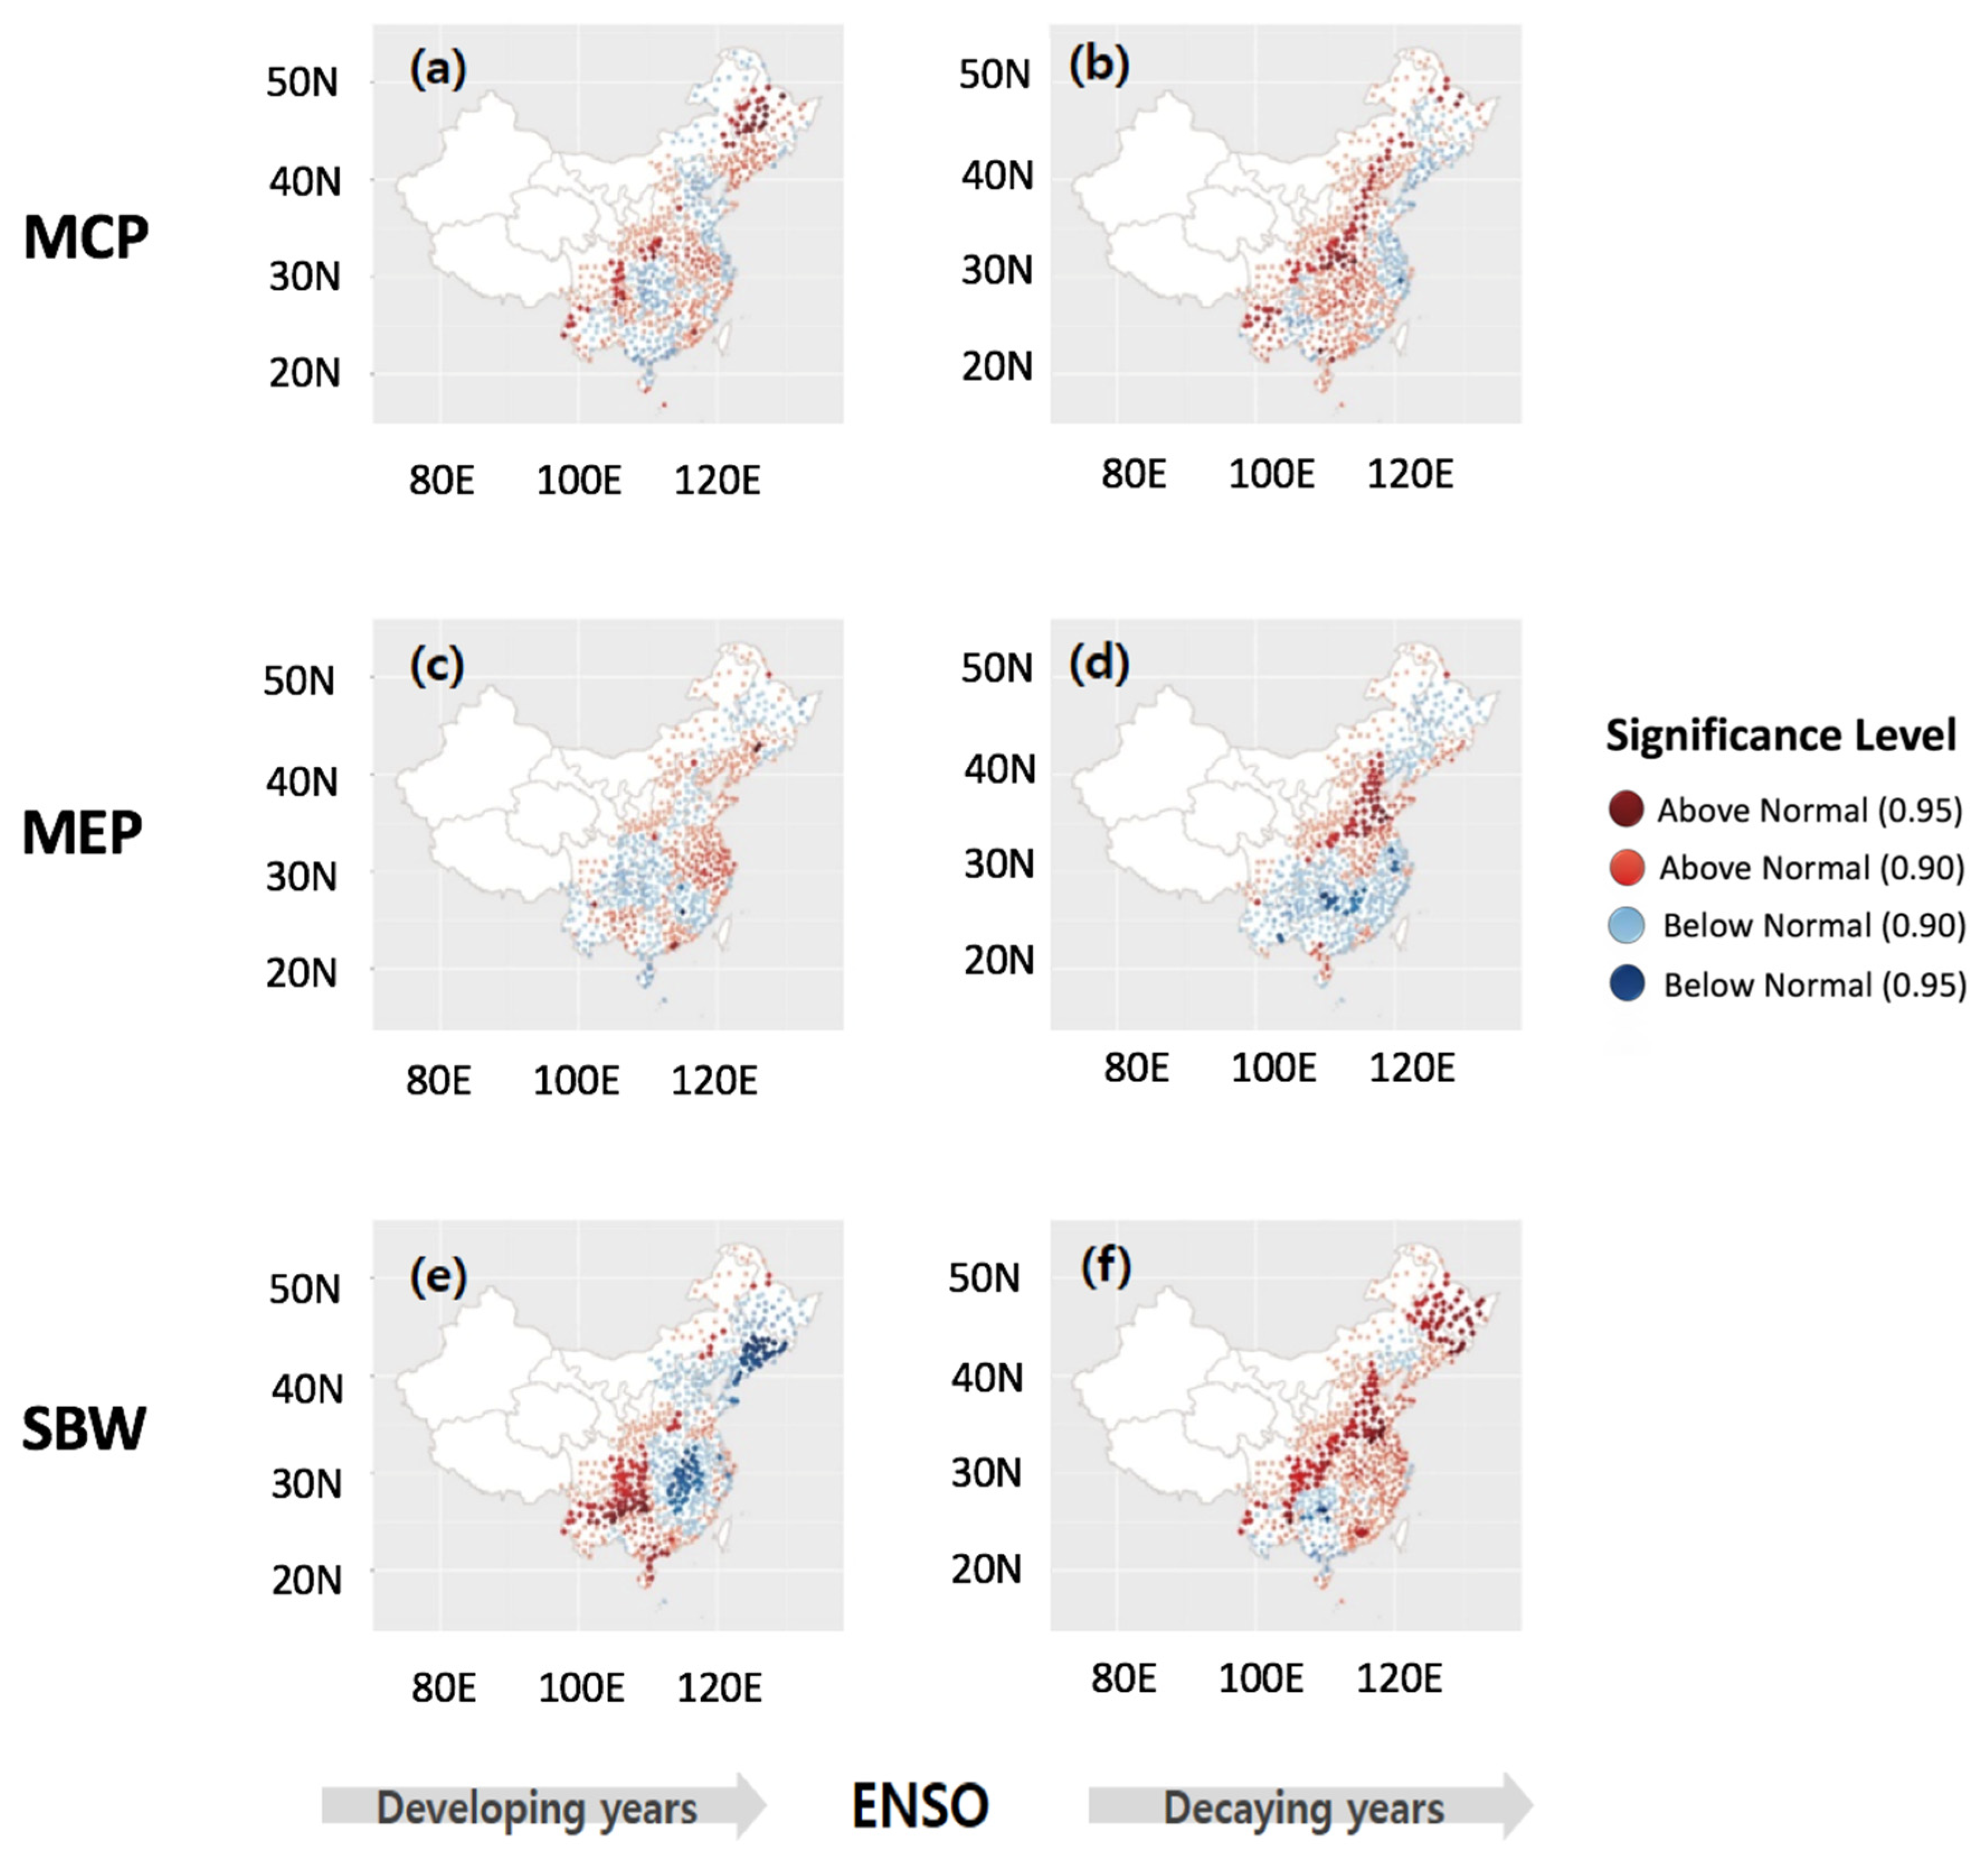
Intensity of TC-Induced Rainfall

Figure 6 shows the proportion of TC-induced rainfall (PTCR) in each river basin throughout China. The Pearl, Yangtze, and Southeastern river basins were the regions most affected by TCs. During MCP events, the PTCR was less than 11.6% (long-term average: 35.92% ≥ MCP years: 31.74%) in the Pearl river basin compared to the long-term normal. In contrast, the PTCR was shown to be large by 26.9% (long-term average: 14.96% ≥ MCP years: 18.99%) and 6.2% (long-term average: 19.51% ≥ MCP years: 20.72%), respectively, in the Southeast and Yangtze river basins. During MEP events, the PTCR in these three river basins dropped slightly compared to the average year. During SBW events, however, the PTCR was larger than usual in all these three basins, indicating a clear increase in rainfall caused by typhoons.
Figure 7 compares TC-induced composite PRCPTOT anomalies with the long-term values observed at each station throughout China. The four significance levels were determined based on Welch’s t-test. Total seasonal precipitation was concentrated in the Yangtze, Pearl, Hong Kong, and Southeastern river basins during MCP development. Then, rainfall moved to the coastal areas of Huaihe and Southeast. During MEP El Niño events, rainfall continued to fall in the Southwest, Pearl, and Songliao river basins. In addition, during SBW events when rain moved to the Yangtze and Hong Kong river basins, more rain was concentrated in the Huaihe, Haihe, and Songliao regions. During the emergence of MEP and SBW events and the decay of MEP events, the Songliao River Basin experienced more TC-induced rainfall than usual. TC-induced rainfall was slightly reduced during SBW events, and TC-induced rainfall increased in the Southeast during MCP decay. The maximum rainfall over China noticeably reduced. However, there was slightly more rain in Hong Kong, and Songliao experienced slightly more rain under MEP decay. The Yangtze and Pearl regions received relatively more rain in almost all cases. Therefore, the results suggest that TC-induced rainfall varied with TC tracks.
Figure 8 shows the maximum number of consecutive TC-induced precipitation days (CTPD), which is presented as a composite anomaly compared to the long-term average. Each CTPD represents a day consistently affected by TCs. During MCP development, CTPD distribution results were not clear, whereas CTPD expanded to the inland and northeastern China during MCP decaying years. However, SBW development was associated with distinct CTPDs; the southwestern region was affected by TCs over a long period, with the eastern and northeastern regions being affected significantly fewer days. During El Niño decay, coastal areas were relatively more affected by TCs during MCP events, and the Pearl River Basin was more affected during SBW events. CTPD was distributed through central and southern China with a clear boundary in the Songliao River Basin.
Figure 9 shows composite anomalies in the average number of days per year affected by TCs. Under extreme El Niño events, slightly fewer days were affected by TCs in China. For inland areas, anomalies generally comprised 10 or fewer days and never exceeded 12. A distinct pattern was observed over the Songliao River Basin, indicating the impact of TCs could extend into northeast China. During SBW years, the range of areas impacted by TCs was narrow, especially in the developing years. However, the Yangtze River Basin was affected by TCs for approximately six days.

4. Summary and Conclusions

El Niño events significantly influence TC characteristics and behaviors in the WNP, as they cause changes in ocean and atmospheric circulation. This statistical study investigated how ENSO types (MCP, MEP, and SBW) affected various TC properties and rainfall over different regions in China to support the development of more accurate prediction models.
This study first analyzed the characteristics of TCs and classified them into TC strength, frequency, and tracks. In terms of TC strength, the MCP El Niño type was associated with a slightly larger than average SSTA in both emerging to decaying phases. However, the strength of TCs declined in the MEP and SBW processes. Among them, the SBW showed more variability. For TC frequency, the annual numbers of TCs increased significantly to reach their maximum, whereas other TCs had opposite patterns. During MEP and SBW development, compared to the long-term distribution, TC track positions were distributed eastward, especially in the case of the SBW. In the decaying years, TC events were similar to long-term distributions during MCP and MEP events, and TCs tended to occur close to the WNP region in SBW. For recurving positions, the situation was similar in that the range of genesis points approached China during SBW years.
TC-induced rainfall anomalies varied by region and ranged from relatively heavy to weak. In all cases, the Pearl River Basin and Southern river basins experienced a high proportion of TC-induced rainfall, especially in coastal areas. Rainfall induced under the three El Niño types is compared to the average TC-induced rainfall, which shows extreme rainfall occurred more often during El Niño events. During MCP events, the proportion of TC-induced rainfall was similar to the average distribution in all years. During MEP events, rainfall was more extensive, spreading to the Songliao River Basin and contributing to TC-induced rainfall in some areas of the Yangtze River Basin.
With respect to TC-induced precipitation indices, two indicators illustrated PRCPTOT, CTPD, and other characteristics in six situations, thereby representing the three types of developing and decaying years of El Niño. Statistical results showed that there was TC-induced heavy rainfall in southern China and coastal areas of the Huaihe River Basin during the developing years of MCP. TC-induced heavy rain occurred in eastern and northeastern China in SBW, rain during MEP years was relatively weak, and the precipitation in the Songliao region was relatively strong. In the decaying years, heavy rain was distributed in the eastern coastal cities, the Southwest and Songliao river basins, and the Yangtze River Basin in MCP, MEP, and SBW, respectively. The frequency showed a similar pattern as TC-induced PRCPTOT, except that the consistent impacts of TCs covered large areas in southern China during the years of MEP. With respect to geographical frequency, TC-induced rainfall at the stage of the SBW El Niño events was distinguished primarily by the narrow range of areas affected by TCs in the Pearl and Southeastern regions of China.
For SBW events, warming started in the western Pacific and initially spread eastward. They have the pronounced westerly anomalies happening during the winter and spring over the western Pacific, possibly reflecting frequent westerly wind-burst events. During the decaying years of SBW events, more TCs occurred in the eastern Philippines and the South China Sea than usual, and the genesis positions of TCs tended to be more westerly and closer to China (Figure 3f, average TC genesis: 134.8° E, 13.2° N), and they moved towards the Pearl River and Southeastern river basins. One of the possible physical processes is that the difference in SSTs between the eastern Pacific and the central Pacific causes westerly anomaly winds, further extending the WNP monsoon trough to the east and resulting in relatively increased TC events in the east WNP. In particular, during SBW events, a subtropical high maintains stronger than usual, and convection activities surrounding the subtropical western pacific stimulate a Rossby wave that propagates from the South China Sea to midlatitudes, causing an anomalous easterly steering flow in the Pearl River and Southeastern river basins. Although numerical studies are needed to confirm the reliability of the results we attained, which were limited by our relatively small sample sizes, this diagnostic study presented a comparative analysis of the characteristics of WNP TCs occurring under three types of El Niño events (MCP, MEP, and SBW) and their local impacts on precipitation.
Though changes in El Niño intensity under anthropogenic warming are critical considerations, current prediction models remain inadequate. For example, they do not distinguish between strong and moderate El Niño events, making it difficult to predict future changes in the intensity of El Niño. We anticipate that our findings will help improve prediction models by promoting a better understanding of the relationship between El Niño and TC characteristics. In addition, the results of this study have helped determine typical rainfall patterns at different stages of various El Niño events and thus could support more accurate rainfall predictions under future climatic conditions in China.

Author Contributions

Conceptualization, Y.L. and J.-S.K.; formal analysis, Y.L.; methodology, Y.L. and J.-S.K.; resources, J.-S.K. and S.-K.Y.; writing—original draft preparation, Y.L., J.-S.K., and J.-H.L.; writing—review and editing, J.-S.K., S.-K.Y., and L.X. All authors have read and agreed to the published version of the manuscript.

Funding

This research is supported by the National Natural Science Foundation of China (NSFC Grant Nos. 41890822 and 51525902). The second author, Dr. Yoon, was partially supported by the Seoul Institute of Technology (2020-AB-003). In addition, this work was supported by Korea Environment Industry & Technology Institute (KEITI) though Water Management Research Program, funded by Korea Ministry of Environment (MOE) (79616).

Acknowledgments

We appreciate the support of the State Key Laboratory of Water Resources and Hydropower Engineering Science, Wuhan University. The authors thank the Editor and three anonymous reviewers for their insightful comments and suggestions.

Conflicts of Interest

The authors declare no conflict of interest.

References

  1. Lin, Y.; Zhao, M.; Zhang, M. Tropical cyclone rainfall area controlled by relative sea surface temperature. Nat. Commun. 2015, 6, 1–7. [Google Scholar] [CrossRef]
  2. Lau, K.-M.; Zhou, Y.P.; Wu, H.-T. Have tropical cyclones been feeding more extreme rainfall? J. Geophys. Res. Atmos. 2008, 113. [Google Scholar] [CrossRef] [Green Version]
  3. Zhao, L.; Bai, X.; Qi, D.; Xing, C. BMA probability quantitative precipitation forecasting of land-falling typhoons in south-east China. Front. Earth Sci. 2019, 13, 758–777. [Google Scholar] [CrossRef]
  4. Zhao, H.; Wang, C. On the relationship between ENSO and tropical cyclones in the western North Pacific during the boreal summer. Clim. Dyn. 2019, 52, 275–288. [Google Scholar] [CrossRef] [Green Version]
  5. Deser, C.; Alexander, M.A.; Xie, S.-P.; Phillips, A.S. Sea surface temperature variability: Patterns and mechanisms. Annu. Rev. Mar. Sci. 2010, 2, 115–143. [Google Scholar] [CrossRef] [PubMed] [Green Version]
  6. Shuqiu, L.X.Y. El Niño and rainfall during the flood season (June-August) in China. Acta Meteorol. Sin. 1993, 51, 434–441. [Google Scholar]
  7. Zhang, X.; Alexander, L.; Hegerl, G.C.; Jones, P.; Tank, A.K.; Peterson, T.C.; Trewin, B.; Zwiers, F.W. Indices for monitoring changes in extremes based on daily temperature and precipitation data. Wiley Interdiscip. Rev. Clim. Chang. 2011, 2, 851–870. [Google Scholar] [CrossRef]
  8. Zhang, Q.; Lai, Y.; Gu, X.; Shi, P.; Singh, V.P. Tropical cyclonic rainfall in China: Changing properties, seasonality, and causes. J. Geophys. Res. Atmos. 2018, 123, 4476–4489. [Google Scholar] [CrossRef]
  9. Yonekura, E.; Hall, T.M. A statistical model of tropical cyclone tracks in the western North Pacific with ENSO-dependent cyclogenesis. J. Appl. Meteorol. Clim. 2011, 50, 1725–1739. [Google Scholar] [CrossRef] [Green Version]
  10. Hirata, H.; Kawamura, R. Scale interaction between typhoons and the North Pacific subtropical high and associated remote effects during the Baiu/Meiyu season. J. Geophys. Res. Atmos. 2014, 119, 5157–5170. [Google Scholar] [CrossRef]
  11. Sun, Y.; Zhong, Z.; Yi, L.; Li, T.; Chen, M.; Wan, H.; Wang, Y.; Zhong, K. Dependence of the relationship between the tropical cyclone track and western Pacific subtropical high intensity on initial storm size: A numerical investigation. J. Geophys. Res. Atmos. 2015, 120, 11–451. [Google Scholar] [CrossRef]
  12. Chen, X.; Zhong, Z.; Lu, W. Association of the poleward shift of East Asian subtropical upper-level jet with frequent tropical cyclone activities over the western North Pacific in summer. J. Clim. 2017, 30, 5597–5603. [Google Scholar] [CrossRef]
  13. Cai, M.; Ding, Y.; Jiang, Z. Extreme Precipitation Experimentation over Eastern China Based on L-moment Estimation. Plateau Meteorol. 2007, 26, 012. [Google Scholar]
  14. Corporal-Lodangco, I.L.; Leslie, L.M.; Lamb, P.J. Impacts of ENSO on Philippine tropical cyclone activity. J. Clim. 2016, 29, 1877–1897. [Google Scholar] [CrossRef]
  15. Camargo, S.J.; Sobel, A.H. Western North Pacific tropical cyclone intensity and ENSO. J. Clim. 2005, 18, 2996–3006. [Google Scholar] [CrossRef]
  16. Colbert, A.J.; Soden, B.J.; Kirtman, B.P. The impact of natural and anthropogenic climate change on western North Pacific tropical cyclone tracks. J. Clim. 2015, 28, 1806–1823. [Google Scholar] [CrossRef]
  17. Liu, Z.; Chen, X.; Sun, C.; Cao, M.; Wu, X.; Lu, S. Influence of ENSO Events on Tropical Cyclone Activity over the Western North Pacific. J. Ocean Univ. China 2019, 18, 784–794. [Google Scholar] [CrossRef]
  18. Okumura, Y.M. ENSO diversity from an atmospheric perspective. Curr. Clim. Chang. Rep. 2019, 5, 245–257. [Google Scholar] [CrossRef] [Green Version]
  19. Cai, W.; McPhaden, M.J.; Grimm, A.M.; Rodrigues, R.R.; Taschetto, A.S.; Garreaud, R.D.; Dewitte, B.; Poveda, G.; Ham, Y.-G.; Santoso, A. Climate impacts of the El Niño–Southern Oscillation on South America. Nat. Rev. Earth Environ. 2020, 1, 215–231. [Google Scholar] [CrossRef]
  20. Wang, B.; Luo, X.; Yang, Y.-M.; Sun, W.; Cane, M.A.; Cai, W.; Yeh, S.-W.; Liu, J. Historical change of El Niño properties sheds light on future changes of extreme El Niño. Proc. Natl. Acad. Sci. USA 2019, 116, 22512–22517. [Google Scholar] [CrossRef] [Green Version]
  21. Li, Y.; Ma, B.; Feng, J.; Lu, Y. Influence of the strongest central Pacific El Niño–Southern Oscillation events on the precipitation in eastern China. Int. J. Clim. 2019, 39, 3076–3090. [Google Scholar] [CrossRef] [Green Version]
  22. Lu, A.; Jia, S.; Yan, H.; Wang, S. El Nino-Southern Oscillation and water resources in headwaters region of the Yellow River: Links and potential for forecasting. Hydrol. Earth Syst. Sci. Discuss. 2010, 7, 8521–8543. [Google Scholar] [CrossRef]
  23. Kim, J.-S.; Jain, S.; Yoon, S.-K. Warm season streamflow variability in the Korean Han River Basin: Links with atmospheric teleconnections. Int. J. Clim. 2012, 32, 635–640. [Google Scholar] [CrossRef]
  24. Kim, J.-S.; Jain, S. Precipitation trends over the Korean peninsula: Typhoon-induced changes and a typology for characterizing climate-related risk. Environ. Res. Lett. 2011, 6, 034033. [Google Scholar] [CrossRef]
  25. Qian, W.; Lin, X. Regional trends in recent precipitation indices in China. Meteorol. Atmos. Phys. 2005, 90, 193–207. [Google Scholar] [CrossRef]
  26. Laing, A.; Evans, J.L. Introduction to Tropical Meteorology; Educational Material from the COMET Program; COMET MetEd: Boulder, CO, USA, 2011. [Google Scholar]
  27. Kalnay, E.; Kanamitsu, M.; Kistler, R.; Collins, W.; Deaven, D.; Gandin, L.; Iredell, M.; Saha, S.; White, G.; Woollen, J.; et al. The NCEP/NCAR 40-year reanalysis project. Bull. Amer. Meteor. Soc. 1996, 77, 437–470. [Google Scholar] [CrossRef] [Green Version]
  28. Matheron, G. Principles of geostatistics. Econ. Geol. 1963, 58, 1246–1266. [Google Scholar] [CrossRef]
  29. Le, N.D.; Zidek, J.V. Statistical Analysis of Environmental Space-Time Processes; Springer Science & Business Media: Berlin, Germany, 2006. [Google Scholar]
  30. Cressie, N. The origins of kriging. Math. Geol. 1990, 22, 239–252. [Google Scholar] [CrossRef]
  31. Delhomme, J.P. Kriging in the hydrosciences. Adv. Water Resour. 1978, 1, 251–266. [Google Scholar] [CrossRef]
  32. Su, S.; Lin, A.; Liu, Q. The application of ordinary Kriging method in spatial interpolation. J. Jiangnan Univ. (Nat. Sci. Ed.) 2004, 3, 18–21. [Google Scholar]
  33. Welch, B.L. The generalization of ‘Student’s’ problem when several different population variances are involved. Biometrika 1947, 34, 28–35. [Google Scholar] [CrossRef] [PubMed]
  34. Yin, X. The Principle and Operation of Econometrics; ChongQing University Press: ChongQing, China, 2009; Volume 8. [Google Scholar]
  35. Machiwal, D.; Jha, M.K. Hydrologic Time Series Analysis: Theory and Practice; Springer Science & Business Media: Berlin, Germany, 2012. [Google Scholar]
  36. Pettitt, A.N. A non-parametric approach to the change-point problem. J. R. Stat. Soc. Ser. C (Appl. Stat.) 1979, 28, 126–135. [Google Scholar] [CrossRef]
  37. Wijngaard, J.B.; Klein Tank, A.M.G.; Können, G.P. Homogeneity of 20th century European daily temperature and precipitation series. Int. J. Clim. J. R. Meteorol. Soc. 2003, 23, 679–692. [Google Scholar] [CrossRef]
  38. Smadi, M.M.; Zghoul, A. A sudden change in rainfall characteristics in Amman, Jordan during the mid 1950s. Am. J. Environ. Sci. 2006, 2, 84–91. [Google Scholar] [CrossRef]
  39. Dhorde, A.G.; Zarenistanak, M. Three-way approach to test data homogeneity: An analysis of temperature and precipitation series over southwestern Islamic Republic of Iran. J. Indian Geophys. Union 2013, 17, 233–242. [Google Scholar]
  40. Jaiswal, R.K.; Lohani, A.K.; Tiwari, H.L. Statistical analysis for change detection and trend assessment in climatological parameters. Environ. Process. 2015, 2, 729–749. [Google Scholar] [CrossRef] [Green Version]
  41. Kim, J.-S.; Kim, S.T.; Wang, L.; Wang, X.; Moon, Y.-I. Tropical cyclone activity in the northwestern Pacific associated with decaying Central Pacific El Ninos. Stoch. Environ. Res. Risk Assess. 2016, 30, 1335–1345. [Google Scholar] [CrossRef]
Figure 1. Map of the study area (5–55° N, 75–135° E) and locations of the weather stations in China.
Atmosphere 12 00059 g001
Figure 2. Violin plots of tropical cyclone (TC) activities and their probability during different types of El Niño–Southern Oscillation (ENSO) events. (a,b) show the annual number of TCs, (c,d) indicate wind speed anomaly patterns of TCs, (e,f) show the central pressure anomaly, and (g,h) indicate lifetime anomalies during developing and decaying years. For each panel, the violin plot shows the kernel probability density of the data, including a dot to mark the median and a thick line to indicate the interquartile range of each dataset. MCP: moderate central Pacific, MEP: moderate eastern Pacific, SBW: strong basin-wide.
Atmosphere 12 00059 g002
Figure 3. Genesis positions of tropical cyclones (TCs) during the development and decay of moderate central Pacific (MCP), moderate eastern Pacific (MEP), and strong basin-wide (SBW) El Niño events. The black contour lines show the long-term trends in TC genesis locations (1961–2017). The TC genesis position is defined as the first location at which a TC was recorded in historical data provided by the Regional Specialized Meteorological Center in Tokyo, Japan. (a,b) moderate central Pacific (MCP); (c,d) moderate eastern Pacific (MEP); (e,f) strong basin-wide (SBW).
Atmosphere 12 00059 g003
Figure 4. Map of the density circle of tropical cyclone recurving positions during the decay periods of (a) moderate central Pacific (MCP), (b) moderate eastern Pacific (MEP), and (c) strong basin-wide (SBW) El Niño events.
Atmosphere 12 00059 g004
Figure 5. Comparison of subtropical highs and tropical cyclone behavior under different types of El Niño–Southern Oscillation (ENSO) events during the developing and decaying years, ((a,b) moderate central Pacific (MCP); (c,d) moderate eastern Pacific (MEP); (e,f) strong basin-wide (SBW)). The solid line shown in each figure indicates the long-term average position of the western North Pacific (WNP) subtropical high (represented by 5880 gpm). Dashed lines indicate different types of ENSO events. The grey shading marks the average path of the tropical cyclones for each case.
Atmosphere 12 00059 g005
Figure 6. Proportion of tropical cyclone-induced precipitation amount in each river basin of China. (ac) show results for moderate central Pacific (MCP), (b) moderate eastern Pacific (MEP), and (c) strong basin-wide (SBW) El Niño events, respectively, and (d) shows the long-term average.
Atmosphere 12 00059 g006
Figure 7. TC-induced composite PRCPTOT anomalies compared to the long-term averages. The red dots indicate above-normal conditions, whereas the blue dots indicate below-normal conditions. In addition, the light (dark) color groups indicate 90% (95%) significance levels for pattern changes. MCP: moderate central Pacific, MEP: moderate eastern Pacific, SBW: strong basin-wide. (a,b) moderate central Pacific (MCP); (c,d) moderate eastern Pacific (MEP); (e,f) strong basin-wide (SBW).
Atmosphere 12 00059 g007
Figure 8. Composite consecutive tropical cyclone-induced precipitation days (CTPD) anomalies compared to long-term averages. The red dots indicate above normal results, whereas the blue dots indicate below normal results. The light- (dark-)colored shaded indicates change at a 90% (95%) significance level. MCP: moderate central Pacific, MEP: moderate eastern Pacific, SBW: strong basin-wide. (a,b) moderate central Pacific (MCP); (c,d) moderate eastern Pacific (MEP); (e,f) strong basin-wide (SBW).
Atmosphere 12 00059 g008
Figure 9. Composite anomaly map showing the average number of days per year affected by tropical cyclones. The contour lines, as they extend from west to east, indicate areas affected on 1, 2, 4, 6, 8, 10, and 12 days per year. Dark orange areas denote areas that were affected by anomalies in all years, which mainly include the Pearl and Southeastern river basins and offshore islands. MCP: moderate central Pacific, MEP: moderate eastern Pacific, SBW: strong basin-wide. (a,b) moderate central Pacific (MCP); (c,d) moderate eastern Pacific (MEP); (e,f) strong basin-wide (SBW).
Atmosphere 12 00059 g009
Table 1. Main properties of moderate central Pacific (MCP), moderate eastern Pacific (MEP), and strong basin-wide (SBW) ENSO events.
Moderate Central Pacific (MCP)Moderate Eastern Pacific (MEP)Strong Basin-Wide (SBW)
  • begin with mild warming in the western Pacific
  • expand eastward
  • originate in the far EP
  • propagate westward
  • westerly SST anomaly followed by distinctive basin-wide development
  • extraordinary intensity (maximum SSTA >2.5 °C)
Publisher’s Note: MDPI stays neutral with regard to jurisdictional claims in published maps and institutional affiliations.

