Next Issue
Volume 12, February
Previous Issue
Volume 11, December


Atmosphere, Volume 12, Issue 1 (January 2021) – 125 articles

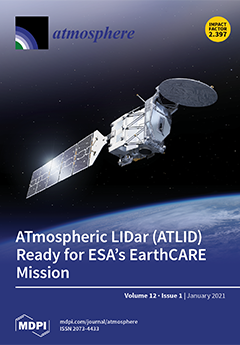
Cover Story (view full-size image): ESA’s EarthCARE (Earth Cloud, Aerosol, and Radiation Explorer) satellite will use ATLID (ATmospheric LIDar), a cloud profiling radar, broadband radiometer, and multispectral imager, to probe the atmosphere and provide synchronous, collocated data from atmospheric profiles. The mission aims to improve understanding of cloud–aerosol–radiation interactions and Earth radiative balance, facilitating better reliability of climate and numerical weather prediction models. ATLID will emit short duration, ultraviolet laser pulses which are backscattered by the atmosphere and collected by the receiver, then optically filtered to separate and measure Mie and Rayleigh scattered signals. Results from ATLID performance characterization, plus in-orbit flight predictions, are presented. View this paper
  • Issues are regarded as officially published after their release is announced to the table of contents alert mailing list.
  • You may sign up for e-mail alerts to receive table of contents of newly released issues.
  • PDF is the official format for papers published in both, html and pdf forms. To view the papers in pdf format, click on the "PDF Full-text" link, and use the free Adobe Reader to open them.
Order results
Result details
Section
Select all
Export citation of selected articles as:
27 pages, 13855 KiB  
Article
Atmospheric Dynamics and Numerical Simulations of Six Frontal Dust Storms in the Middle East Region
by Nasim Hossein Hamzeh, Sara Karami, Dimitris G. Kaskaoutis, Ina Tegen, Mohamad Moradi and Christian Opp
Atmosphere 2021, 12(1), 125; https://doi.org/10.3390/atmos12010125 - 18 Jan 2021
Cited by 40 | Viewed by 5074
Abstract
This study analyzes six frontal dust storms in the Middle East during the cold period (October–March), aiming to examine the atmospheric circulation patterns and force dynamics that triggered the fronts and the associated (pre- or post-frontal) dust storms. Cold troughs mostly located over [...] Read more.
This study analyzes six frontal dust storms in the Middle East during the cold period (October–March), aiming to examine the atmospheric circulation patterns and force dynamics that triggered the fronts and the associated (pre- or post-frontal) dust storms. Cold troughs mostly located over Turkey, Syria and north Iraq played a major role in the front propagation at the surface, while cyclonic conditions and strong winds facilitated the dust storms. The presence of an upper-atmosphere (300 hPa) sub-tropical jet stream traversing from Egypt to Iran constitutes also a dynamic force accompanying the frontal dust storms. Moderate-Resolution Imaging Spectroradiometer (MODIS) and Cloud-Aerosol Lidar and Infrared Pathfinder Satellite Observation (CALIPSO) observations are used to monitor the spatial and vertical extent of the dust storms, while model (Weather Research and Forecasting model coupled with Chemistry (WRF-Chem), Copernicus Atmospheric Monitoring Service (CAMS), Regional Climate Model-4 (RegCM4)) simulations are also analyzed. The WRF-Chem outputs were in better agreement with the MODIS observations compared to those of CAMS and RegCM4. The fronts were identified by WRF-Chem simulations via gradients in the potential temperature and sudden changes of wind direction in vertical cross-sections. Overall, the uncertainties in the simulations and the remarkable differences between the model outputs indicate that modelling of dust storms in the Middle East is really challenging due to the complex terrain, incorrect representation of the dust sources and soil/surface characteristics, and uncertainties in simulating the wind speed/direction and meteorological dynamics. Given the potential threat by dust storms, more attention should be directed to the dust model development in this region. Full article
(This article belongs to the Special Issue Observing Atmospheric Dynamics and Dust Activity - 2nd Volume)
Show Figures

Figure 1

17 pages, 2306 KiB  
Article
Solar Photovoltaic Forecasting of Power Output Using LSTM Networks
by Maria Konstantinou, Stefani Peratikou and Alexandros G. Charalambides
Atmosphere 2021, 12(1), 124; https://doi.org/10.3390/atmos12010124 - 18 Jan 2021
Cited by 49 | Viewed by 5377
Abstract
The penetration of renewable energies has increased during the last decades since it has become an effective solution to the world’s energy challenges. Among all renewable energy sources, photovoltaic (PV) technology is the most immediate way to convert solar radiation into electricity. Nevertheless, [...] Read more.
The penetration of renewable energies has increased during the last decades since it has become an effective solution to the world’s energy challenges. Among all renewable energy sources, photovoltaic (PV) technology is the most immediate way to convert solar radiation into electricity. Nevertheless, PV power output is affected by several factors, such as location, clouds, etc. As PV plants proliferate and represent significant contributors to grid electricity production, it becomes increasingly important to manage their inherent alterability. Therefore, solar PV forecasting is a pivotal factor to support reliable and cost-effective grid operation and control. In this paper, a stacked long short-term memory network, which is a significant component of the deep recurrent neural network, is considered for the prediction of PV power output for 1.5 h ahead. Historical data of PV power output from a PV plant in Nicosia, Cyprus, were used as input to the forecasting model. Once the model was defined and trained, the model performance was assessed qualitative (by graphical tools) and quantitative (by calculating the Root Mean Square Error (RMSE) and by applying the k-fold cross-validation method). The results showed that our model can predict well, since the RMSE gives a value of 0.11368, whereas when applying the k-fold cross-validation, the mean of the resulting RMSE values is 0.09394 with a standard deviation 0.01616. Full article
(This article belongs to the Special Issue Machine Learning for Solar Radiation Estimation)
Show Figures

Figure 1

16 pages, 11256 KiB  
Article
Assessment of Climate Change in Central Asia from 1980 to 2100 Using the Köppen-Geiger Climate Classification
by Huili He, Geping Luo, Peng Cai, Rafiq Hamdi, Piet Termonia, Philippe De Maeyer, Alishir Kurban and Jianjun Li
Atmosphere 2021, 12(1), 123; https://doi.org/10.3390/atmos12010123 - 17 Jan 2021
Cited by 13 | Viewed by 3421
Abstract
The accelerated global warming and heterogeneous change in precipitation have been resulting in climate system shifts, which plays a key role in the stability of ecosystem and social economic development. Central Asia is account 80% of the temperate desert, characterized by fragile ecosystem; [...] Read more.
The accelerated global warming and heterogeneous change in precipitation have been resulting in climate system shifts, which plays a key role in the stability of ecosystem and social economic development. Central Asia is account 80% of the temperate desert, characterized by fragile ecosystem; however, it has experienced the fastest warming in recent decades and projected warming in future. The Köppen-Geiger climate classification is a useful tool to assess the potential impacts of climate change on regional ecosystem. The spatial shift and temporal evolution of each climatic zone based on Köppen-Geiger climate classification are analyzed in historical and future period under different scenarios (RCP2.6, RCP4.5 and RCP8.5), high risk regions that might experience more frequent climatic zone shifts are delimited in this study, which could provide the useful information for developing mitigate strategies in coping with the warming threat. The hotter and dryer subtypes of arid climatic zone and warmer subtypes of temperate climatic zone expanded their coverage in Central Asia, corresponding to the tundra climatic, cooler subtype of arid and temperate climatic zone contracted. Based on a method defining the climate-sensitivity, high risk regions are mainly distributed in northern Kazakhstan and Tianshan Mountains region. Full article
(This article belongs to the Section Climatology)
Show Figures

Figure 1

10 pages, 2394 KiB  
Article
First High-Frequency Underway Observation of DMS Distribution in the Southern Ocean during Austral Autumn
by Intae Kim, Miming Zhang, Kitae Kim and Keyhong Park
Atmosphere 2021, 12(1), 122; https://doi.org/10.3390/atmos12010122 - 16 Jan 2021
Cited by 5 | Viewed by 2490
Abstract
We investigate the distribution of dimethyl sulfide (DMS) in the Southern Ocean’s (50° W to 170° W) surface water, including the Antarctic Peninsula and the marginal sea ice zone (MIZ) in the Ross and Amundsen Seas. This is the first high-frequency observation conducted [...] Read more.
We investigate the distribution of dimethyl sulfide (DMS) in the Southern Ocean’s (50° W to 170° W) surface water, including the Antarctic Peninsula and the marginal sea ice zone (MIZ) in the Ross and Amundsen Seas. This is the first high-frequency observation conducted in the austral autumn (in April) in the Southern Ocean. The mean DMS concentration was 2.7 ± 2.5 nM (1 σ) for the entire study area. Noticeably enhanced DMS (5 to 28 nM) concentrations were observed in the MIZ around the Ross and Amundsen Seas and the coastal regions in the Antarctic Peninsula; this could be attributed to biological production of local ice algae, which appears to be supplied with nutrients from glacial or sea ice melt water. These observed DMS inventories were significantly higher (an order of magnitude) than current climatological DMS inventories. The local DMS sources being transported outward from the polynyas, where strong bloom occurs during summer, could result in larger discrepancies between observed DMS and climatological DMS in the MIZ area (in the Amundsen Sea). Overall, this study is the first to highlight the significance of the underestimation of current DMS fluxes in the austral autumn, which consequently results in significant errors in the climate models. Full article
(This article belongs to the Special Issue Sources, Transport, and Sinks of Biogenic Sulfur in the Atmosphere)
Show Figures

Figure 1

27 pages, 5404 KiB  
Article
Designing a Climate Service for Planning Climate Actions in Vulnerable Countries
by Christiana Photiadou, Berit Arheimer, Thomas Bosshard, René Capell, Maria Elenius, Ilaria Gallo, Frida Gyllensvärd, Katharina Klehmet, Lorna Little, Isabel Ribeiro, Léonard Santos and Elin Sjökvist
Atmosphere 2021, 12(1), 121; https://doi.org/10.3390/atmos12010121 - 16 Jan 2021
Cited by 6 | Viewed by 2735
Abstract
The next generation of climate services needs not only tailoring to specific user needs but to provide, in addition, access to key information in a usable way that satisfies the needs of different users’ profiles; especially web-based services. Here, we present the outcomes [...] Read more.
The next generation of climate services needs not only tailoring to specific user needs but to provide, in addition, access to key information in a usable way that satisfies the needs of different users’ profiles; especially web-based services. Here, we present the outcomes from developing such a new interactive prototype. The service provides data for robust climate analysis to underpin decision-making when planning measures to compensate for climate impact. The goal is to facilitate the communication on climate information between climate modelling communities and adaptation or mitigation initiatives from vulnerable countries that are applying for funds from the Green Climate Fund (GCF). A participatory process was ensured during four workshops in four pilot countries, with an audience of national and international experts. During this process it was made clear that in all countries there is a strong need for knowledge in climate science, while in most countries there was also an increasing need of capacity in hydrological modelling and water management. The active interaction during the workshops was found necessary to facilitate the dialogue between service developers and users. Understanding the users, transparency on potentials and limitations of climate services together with capacity development in climate science and methods were required components in the development of the service. Full article
Show Figures

Figure 1

19 pages, 7741 KiB  
Article
Numerical Simulation of a Heavy Rainstorm in Northeast China Caused by the Residual Vortex of Typhoon 1909 (Lekima)
by Yiping Wang and Tong Wang
Atmosphere 2021, 12(1), 120; https://doi.org/10.3390/atmos12010120 - 16 Jan 2021
Cited by 10 | Viewed by 2170
Abstract
From 14 to 17 August 2019, a heavy rainstorm occurred in Northeast China due to the combined influence of the residual vortex of typhoon 1909 (Lekima) and cold air intrusion. Based on the precipitation data of China Meteorological observation stations, surface and upper [...] Read more.
From 14 to 17 August 2019, a heavy rainstorm occurred in Northeast China due to the combined influence of the residual vortex of typhoon 1909 (Lekima) and cold air intrusion. Based on the precipitation data of China Meteorological observation stations, surface and upper charts, HMW-8 satellite images, NCEP/NCAR 0.25° × 0.25° reanalysis data and WRF4.0 numerical prediction model are used to carry out numerical simulations. According to the weather situation and numerical simulation results, the cause of 1 h severe precipitation is thoroughly studied. Results show that: (1) According to the weather situation, the precipitation process can be divided into two stages. The first stage is from 1412 to 1612 August 2019, which is caused by the interaction between the residual vortex, the inverted trough of typhoon 1909 (Lekima) and the upper trough. The rain belt lies from northeast to southwest, and the rainfall center has typical meso-β-scale characteristics. At the second stage from 1612 to 1712 August 2019, the residual vortex of typhoon reaches Heilongjiang Province, at the same time, 500 hPa cold vortex falls to the south; (2) Based on the 1 h rainfall of automatic weather stations, it can be seen that there are three rainfall peaks from 00 UTC 14 to 12 UTC 17, which are 53.2 mm in the Middle East of Jilin Province, 38.2 mm in the south of 1610 Liaoning Province, and 21.3 mm in the east of 1707 Heilongjiang Province respectively. (3) Before the occurrence of 1 h heavy rainfall, the water vapor is concentrated in the middle and lower troposphere. The residual vortex trough of typhoon 1909 extends northward, converges with the southwest airflow at the edge of the subtropical high, and transports water vapor and energy to the northeast. The convective cloud clusters generated ahead of the trough move southeast, then merge into the mesoscale convective system in the inverted trough; (4) In the Bohai Bay and North Korea, there is a vortex-like zone composed of several convergence centers, and the convergence zone in typhoon-inverted trough meets with the trough in Central Jilin. There exist a rising area and a positive vorticity belt in the typhoon-inverted trough, and the center of heavy rain lies in front of the positive vorticity center. At the west of the inverted trough, there is a large center of positive vertical wind shear, and a small center in the east. The center of heavy rainfall is located on the line between the maximum and minimum centers, which is close to the right of the maximum center; (5) The high energy tongue is transported from the center of the typhoon to the northeast along the inverted trough of the typhoon, and the southwest airflow at the edge of the subtropical high. There is a zone titled downward from northwest to southeast that contains dry and cold air, where there is convective instability; (6) The strong precipitation area is located on the lee in the northwest of Changbai Mountain. There is a convergence area in the middle of the troposphere, and a strong divergence area in the upper troposphere, with remarkable topographic effect, and the west divergence column inclines on the east convergence column. Full article
Show Figures

Figure 1

23 pages, 4956 KiB  
Article
Temporal Variability of Equivalent Black Carbon Components in Atmospheric Air in Southern Poland
by Natalia Zioła, Barbara Błaszczak and Krzysztof Klejnowski
Atmosphere 2021, 12(1), 119; https://doi.org/10.3390/atmos12010119 - 15 Jan 2021
Cited by 10 | Viewed by 2712
Abstract
This study assesses the air quality in Zabrze (southern Poland) based on the ambient concentrations of equivalent black carbon (eBC). eBC measurement campaigns were carried out from April 2019 to March 2020 using a modern AE33 Aethalometer, accompanied by parallel measurements of gaseous [...] Read more.
This study assesses the air quality in Zabrze (southern Poland) based on the ambient concentrations of equivalent black carbon (eBC). eBC measurement campaigns were carried out from April 2019 to March 2020 using a modern AE33 Aethalometer, accompanied by parallel measurements of gaseous pollutants, PM10 and meteorological parameters. The use of the two-component AE33 model allows for the determination of the eBC from fossil fuel combustion (eBCff) and biomass burning (eBCbb). The obtained results showed a clear seasonal variability of eBC concentrations, with higher average levels in the heating season (4.70 µg·m−3) compared to the non-heating one (1.79 µg·m−3). In both seasons, the eBCff component had a dominant share in total eBC, which indicates significant emissions from the combustion of fossil fuels for heating purposes and from local traffic sources. The obtained results showed high correlation coefficients with gaseous and particulate pollutants, with the strongest relationship for eBC and carbon monoxide (CO). During the non-heating and heating period, both anticyclone and cyclone systems played an important role in shaping eBC, eBCff and eBCbb concentrations. High concentrations of all components occurred with a significant decrease in air temperature and solar radiation in winter. Full article
(This article belongs to the Section Air Quality)
Show Figures

Figure 1

21 pages, 4238 KiB  
Article
Public Health Considerations for PM10 in a High-Pollution Megacity: Influences of Atmospheric Condition and Land Coverage
by Carlos Zafra, Joaquín Suárez and Jorge E. Pachón
Atmosphere 2021, 12(1), 118; https://doi.org/10.3390/atmos12010118 - 15 Jan 2021
Cited by 5 | Viewed by 1983
Abstract
This paper analyzes the PM10 concentrations and influences of atmospheric condition (AC) and land coverage (LC) on a high-pollution megacity (Bogota, Colombia) from a public health viewpoint. Information of monitoring stations equipped with measuring devices for PM10/temperature/solar-radiation/wind-speed were used. The [...] Read more.
This paper analyzes the PM10 concentrations and influences of atmospheric condition (AC) and land coverage (LC) on a high-pollution megacity (Bogota, Colombia) from a public health viewpoint. Information of monitoring stations equipped with measuring devices for PM10/temperature/solar-radiation/wind-speed were used. The research period lasted eight years (2007–2014). AC and LC were determined after comparing daily PM10 concentrations (DPM10) to reference limits published by the World Health Organization (WHO). ARIMA models for DPM10 were also developed. The results indicated that urban sectors with lower atmospheric instability (AI) had a 2.85% increase in daily mortality (DM) in relation to sectors with greater AI. In these sectors of lower AI, impervious LC predominated, instead of vegetated LC. An ARIMA analysis revealed that a greater extent of impervious LC around a station led to a greater effect on previous days’ DPM10 concentrations. Extreme PM10 episodes persisted for up to two days. Extreme pollution episodes were probably also preceded by low mixing-layer heights (between 722–1085 m). The findings showed a 13.0% increase in WHO standard excesses (PE) for each 10 µg/m3 increase in DPM10, and a 0.313% increase in DM for each 10% increase in PE. The observed average reduction of 14.8% in DPM10 (−0.79% in DM) was probably due to 40% restriction of the traffic at peak hours. Full article
(This article belongs to the Section Air Quality and Human Health)
Show Figures

Figure 1

17 pages, 15638 KiB  
Article
Integrated Air Quality Monitoring and Alert System Based on Two Image Analysis Techniques for Reportable Fire Events
by Chen-Jui Liang, Sheng-Hua Lu, Jeng-Jong Liang, Feng-Cheng Lin and Pei-Rong Yu
Atmosphere 2021, 12(1), 117; https://doi.org/10.3390/atmos12010117 - 15 Jan 2021
Cited by 1 | Viewed by 2526
Abstract
In this paper, a new monitoring alert system for air pollution emergencies is proposed. The proposed system can perform air quality monitoring to provide real-time alerts of an individual event. The system uses two image analysis techniques, namely pixel recognition and haze extraction, [...] Read more.
In this paper, a new monitoring alert system for air pollution emergencies is proposed. The proposed system can perform air quality monitoring to provide real-time alerts of an individual event. The system uses two image analysis techniques, namely pixel recognition and haze extraction, for video fire smoke detection. The image analysis process is divided into daytime and nighttime image analyses, which involve the analysis of red-green-blue (RGB) and gray scale images. The images analyzed in this study were captured by the video camera of an air quality monitoring station. Seven fire accidents around a selected industrial park and downtown area were analyzed in detail. Among these accidents, three occurred at daytime, one occurred over 7 days, and three occurred at nighttime. Alert models based on pixel recognition and haze extraction were established. These models incorporated the formulas of haze equivalent (HT(t)) and separated pixels (XT(t)), as well as the threshold equations of haze equivalent (∇H) and separated pixels (∇X). An alert signal is sent to the administrator when HT(t) > ∇H or XT(t) > ∇X. The obtained results indicate that a real-time observation and alert system based on two image analysis techniques can be designed for air quality monitoring without expensive hardware devices. This alert system can be used by administrators to understand the course of a reportable event, especially as evidence for the appraisal of fire accidents. It is recommended that this system be connected to the fire brigades in order to obtain early fire information. Full article
(This article belongs to the Section Air Quality)
Show Figures

Graphical abstract

14 pages, 1009 KiB  
Article
Circadian Deregulation as Possible New Player in Pollution-Induced Tissue Damage
by Mascia Benedusi, Elena Frigato, Cristiano Bertolucci and Giuseppe Valacchi
Atmosphere 2021, 12(1), 116; https://doi.org/10.3390/atmos12010116 - 15 Jan 2021
Cited by 5 | Viewed by 2422
Abstract
Circadian rhythms are 24-h oscillations driven by a hypothalamic master oscillator that entrains peripheral clocks in almost all cells, tissues and organs. Circadian misalignment, triggered by industrialization and modern lifestyles, has been linked to several pathological conditions, with possible impairment of the quality [...] Read more.
Circadian rhythms are 24-h oscillations driven by a hypothalamic master oscillator that entrains peripheral clocks in almost all cells, tissues and organs. Circadian misalignment, triggered by industrialization and modern lifestyles, has been linked to several pathological conditions, with possible impairment of the quality or even the very existence of life. Living organisms are continuously exposed to air pollutants, and among them, ozone or particulate matters (PMs) are considered to be among the most toxic to human health. In particular, exposure to environmental stressors may result not only in pulmonary and cardiovascular diseases, but, as it has been demonstrated in the last two decades, the skin can also be affected by pollution. In this context, we hypothesize that chronodistruption can exacerbate cell vulnerability to exogenous damaging agents, and we suggest a possible common mechanism of action in deregulation of the homeostasis of the pulmonary, cardiovascular and cutaneous tissues and in its involvement in the development of pathological conditions. Full article
(This article belongs to the Special Issue Contributions of Aerosol Sources to Health Impacts)
Show Figures

Figure 1

22 pages, 8305 KiB  
Article
Building Performance Evaluation of a New Hospital Building in the UK: Balancing Indoor Environmental Quality and Energy Performance
by Nishesh Jain, Esfand Burman, Samuel Stamp, Clive Shrubsole, Roderic Bunn, Tin Oberman, Edward Barrett, Francesco Aletta, Jian Kang, Peter Raynham, Dejan Mumovic and Mike Davies
Atmosphere 2021, 12(1), 115; https://doi.org/10.3390/atmos12010115 - 15 Jan 2021
Cited by 17 | Viewed by 5392
Abstract
Hospitals are controlled yet complex ecosystems which provide a therapeutic environment that promotes healing, wellbeing and work efficiency for patients and staff. As these buildings accommodate the sick and vulnerable, occupant wellbeing and good indoor environmental quality (IEQ) that deals with indoor air [...] Read more.
Hospitals are controlled yet complex ecosystems which provide a therapeutic environment that promotes healing, wellbeing and work efficiency for patients and staff. As these buildings accommodate the sick and vulnerable, occupant wellbeing and good indoor environmental quality (IEQ) that deals with indoor air quality (IAQ), thermal comfort, lighting and acoustics are important objectives. As the specialist nature of hospital function demands highly controlled indoor environments, this makes them energy intensive buildings due to the complex and varying specifications for their functions and operations. This paper reports on a holistic building performance evaluation covering aspects of indoor air quality, thermal comfort, lighting, acoustics, and energy use. It assesses the performance issues and inter-relationships between IEQ and energy in a new building on a hospital campus in the city of Bristol, United Kingdom. The empirical evidence collated from this case study and the feedback received from the hospital staff help identify the endemic issues and constraints related to hospital buildings, such as the need for robust ventilation strategies in hospitals in urban areas that mitigate the effect of indoor and outdoor air pollution and ensuring the use of planned new low-carbon technologies. Whilst the existing guidelines for building design provide useful instructions for the protection of hospital buildings against ingress of particulate matter from outdoors, more advanced filtration strategies may be required to enact chemical reactions required to control the concentration levels of pollutants such as nitrogen dioxide and benzene. Further lessons for improved performance in operation and maintenance of hospitals are highlighted. These include ensuring that the increasingly available metering and monitoring data in new buildings, through building management systems, is used for efficient and optimal building operations for better IEQ and energy management. Overall, the study highlights the need for an integrated and holistic approach to building performance to ensure that healthy environments are provided while energy efficiency targets are met. Full article
(This article belongs to the Special Issue Indoor Air Quality in Healthcare Facilities and Healing Environments)
Show Figures

Figure 1

15 pages, 7923 KiB  
Article
Diagnosing ISO Forecast from GloSea5 Using Dynamic-Oriented ISO Theory
by Young-Min Yang, Taehyoun Shim, Ja-Yeon Moon, Ki-Young Kim and Yu-Kyung Hyun
Atmosphere 2021, 12(1), 114; https://doi.org/10.3390/atmos12010114 - 15 Jan 2021
Cited by 3 | Viewed by 1728
Abstract
A Madden–Jillian oscillation (MJO) and boreal summer intraseasonal oscillation (BSISO) are important climate variabilities, which affect a forecast of weather and climate. In this study, the MJO and the BSISO hindcasts from the Global Seasonal Forecast System, version 5 (GS5) were diagnosed using [...] Read more.
A Madden–Jillian oscillation (MJO) and boreal summer intraseasonal oscillation (BSISO) are important climate variabilities, which affect a forecast of weather and climate. In this study, the MJO and the BSISO hindcasts from the Global Seasonal Forecast System, version 5 (GS5) were diagnosed using dynamic-oriented theories. We additionally analyzed the GS5 climatological run to identify whether the weakness of the GS5 hindcast results from the model physics or initialization processes. The GS5 hindcast captures three-dimensional dynamics and thermodynamics structure of MJO eastward propagation well in the Indian Ocean. The model produces the boundary layer (BL) moisture convergence anomalies to the east of the MJO deep precipitation with easterly anomalies associated with the Kelvin wave. The enhanced BL moisture convergence increases upward transport of moisture from the surface to the lower troposphere, inducing the moist lower troposphere and the positive convective instability by destabilization of the lower atmosphere and, thus, generating the next convection to the east of MJO deep convection and promoting MJO eastward propagation. However, the signal for eastward propagation is relatively weak in the Maritime Continent (MC) and the Western Pacific (WP). To improve the MJO eastward propagation in the MC and WP, improved heating induced by shallow (or congestus) clouds interacting with enhanced BL dynamics may be required. On the other hand, the GS5 hindcast reproduces the BSISO northward propagation reasonably well in the Indian Ocean, which is attributed to positive vorticity anomalies induced by strong vertical shear. Full article
(This article belongs to the Section Atmospheric Techniques, Instruments, and Modeling)
Show Figures

Figure 1

15 pages, 5555 KiB  
Article
Origin and Transport Pathway of Dust Storm and Its Contribution to Particulate Air Pollution in Northeast Edge of Taklimakan Desert, China
by Aishajiang Aili, Hailiang Xu, Tursun Kasim and Abudumijiti Abulikemu
Atmosphere 2021, 12(1), 113; https://doi.org/10.3390/atmos12010113 - 14 Jan 2021
Cited by 19 | Viewed by 3032
Abstract
The Taklimakan Desert in Northwest China is the major source of dust storms in China. The northeast edge of this desert is a typical arid area which houses a fragile oasis eco-environment. Frequent dust storms cause harmful effects on the oasis ecosystem and [...] Read more.
The Taklimakan Desert in Northwest China is the major source of dust storms in China. The northeast edge of this desert is a typical arid area which houses a fragile oasis eco-environment. Frequent dust storms cause harmful effects on the oasis ecosystem and negative impacts on agriculture, transportation, and human health. In this study, the major source region, transport pathway, and the potential contribution of dust storms to particulate air pollution were identified by using both trajectory analysis and monitoring data. To assess the source regions of dust storms, 48 h backward trajectories of air masses arriving at the Bugur (Luntai) County, which is located at the northeast edge of Taklimakan Desert, China on the dusty season (spring) and non-dusty month (August, representing non-dusty season) in the period of 1999–2013, were determined using Hybrid Single Particle Lagrangian Integrated Trajectory model version 4 (HYSPLIT 4). The trajectories were categorized by k-means clustering into 5 clusters (1a–5a) in the dusty season and 2 clusters (1b and 2b) in the non-dusty season, which show distinct features in terms of the trajectory origins and the entry direction to the site. Daily levels of three air pollutants measured at a station located in Bugur County were analyzed by using Potential Source Contribution Function (PSCF) for each air mass cluster in dusty season. The results showed that TSP is the major pollutant, with an average concentration of 612 µg/m3, as compared to SO2 (23 µg/m3) and NO2 (32 µg/m3) in the dusty season. All pollutants were increased with the dust weather intensity, i.e., from suspended dust to dust storms. High levels of SO2 and NO2 were mostly associated with cluster 1a and cluster 5a which had trajectories passing over the anthropogenic source regions, while high TSP was mainly observed in cluster 4a, which has a longer pathway over the shifting sand desert area. Thus, on strong dust storm days, not only higher TSP but also higher SO2 and NO2 levels were observed as compared to normal days. The results of this study could be useful to forecast the potential occurrence of dust storms based on meteorological data. Research focusing on this dust-storm-prone region will help to understand the possible causes for the changes in the dust storm frequency and intensity, which can provide the basis for mitigation of the negative effects on human health and the environment. Full article
(This article belongs to the Special Issue Advances in Air Quality Data Analysis and Modeling)
Show Figures

Figure 1

14 pages, 3641 KiB  
Article
Ozone Variation Trends under Different CMIP6 Scenarios
by Lin Shang, Jiali Luo and Chunxiao Wang
Atmosphere 2021, 12(1), 112; https://doi.org/10.3390/atmos12010112 - 14 Jan 2021
Cited by 5 | Viewed by 2598
Abstract
This study compares and analyzes simulations of ozone under different scenarios by three CMIP6 models (IPSL-CM6A, MRI-ESM2 and CESM-WACCM). Results indicate that as the social vulnerability and anthropogenic radiative forcing is increasing, the change of total column ozone in the tropical stratosphere is [...] Read more.
This study compares and analyzes simulations of ozone under different scenarios by three CMIP6 models (IPSL-CM6A, MRI-ESM2 and CESM-WACCM). Results indicate that as the social vulnerability and anthropogenic radiative forcing is increasing, the change of total column ozone in the tropical stratosphere is not linear. Compared to the SSP2-4.5 and SSP5-8.5 scenarios, the SSP1-2.6 and SSP3-7.0 are more favorable for the increase in stratospheric ozone mass in the tropics. Arctic ozone would never recover under the SSP1-2.6 scenario; however, the Antarctica ozone would gradually recover in all scenarios. Under the SSP1-2.6 and SSP2-4.5 scenarios, the trend of tropical total column ozone is mainly determined by the trend of column ozone in the tropical troposphere. Under the SSP3-7.0 scenario, tropospheric ozone concentration will significantly increase; under the SSP5-8.5 scenario, ozone concentration will distinctly increase in the middle and lower troposphere. Full article
(This article belongs to the Special Issue Ozone and Stratospheric Dynamics)
Show Figures

Figure 1

17 pages, 9560 KiB  
Article
Anomalous Atmospheric Circulation Associated with the Extremely Persistent Dense Fog Events over Eastern China in the Late Autumn of 2018
by Shengjie Chen, Duanyang Liu, Zhiming Kang, Yan Shi and Mei Liu
Atmosphere 2021, 12(1), 111; https://doi.org/10.3390/atmos12010111 - 14 Jan 2021
Cited by 8 | Viewed by 1699
Abstract
Under a declining trend of fog days in China, the duration of fog events since the 1990s reached a significant peak in the late autumn of 2018 over Eastern China. The average anomalous fog days were 4.74 d in November 2018 over Jiangsu [...] Read more.
Under a declining trend of fog days in China, the duration of fog events since the 1990s reached a significant peak in the late autumn of 2018 over Eastern China. The average anomalous fog days were 4.74 d in November 2018 over Jiangsu Province in Eastern China, with a 1.73 standard deviation departure from climatology. Those fogs can thus be identified as a significantly abnormal climatic event with long duration, strong intensity, and extensive coverage. Based on the daily evolutions and correlations of atmospheric parameters, the dense fogs are revealed to be well configured by favorable metrological conditions such as weak dynamic progress, strong inversion in the lower troposphere and saturated air near the surface. If not disturbed, the intensification or duration of these conditions will further promote and maintain the development of fogs. The anomalous atmospheric background associated with those favorable meteorological conditions is revealed by composing the standardized anomalies of circulation fields during the fog days. Over the fog areas, vortex activities or cold air invasion is effectively hampered and the atmosphere inclines to be stable, due to the anomalous circulation pattern composed of the broadened jet stream, weakened jet core over Eastern China, undermined East Asian trough, declined East Asian winter monsoon, and enhanced anomalous southerly flows that transport abnormal warm and wet air to Eastern China. The vapor supplement is intensified by both sustained anomalous northward wind at the lower troposphere and anomalous westward wind in the near-surface. Overall, the numbers of standardized anomalies of 1000–200-hPa height, temperature, wind, and moisture fields during these fog days all significantly depart from climatology for that locale and time of the season, further demonstrating that the persistent dense fogs over Eastern China in the late autumn of 2018 is an unusual weather event with extreme synoptic-scale departures from normal. Full article
Show Figures

Figure 1

22 pages, 3785 KiB  
Review
How Is Indoor Air Quality during Sleep? A Review of Field Studies
by Nuno Canha, Catarina Teixeira, Mónica Figueira and Carolina Correia
Atmosphere 2021, 12(1), 110; https://doi.org/10.3390/atmos12010110 - 14 Jan 2021
Cited by 25 | Viewed by 7343
Abstract
This review aimed to provide an overview of the characterisation of indoor air quality (IAQ) during the sleeping period, based only on real life conditions’ studies where, at least, one air pollutant was considered. Despite the consensual complexity of indoor air, when focusing [...] Read more.
This review aimed to provide an overview of the characterisation of indoor air quality (IAQ) during the sleeping period, based only on real life conditions’ studies where, at least, one air pollutant was considered. Despite the consensual complexity of indoor air, when focusing on sleeping environments, the available scientific literature is still scarce and falls to provide a multipollutants’ characterisation of the air breathed during sleep. This review, following PRISMA’s approach, identified a total of 22 studies that provided insights of how IAQ is during the sleeping period in real life conditions. Most of studies focused on carbon dioxide (77%), followed by particles (PM2.5, PM10 and ultrafines) and only 18% of the studies focused on pollutants such as carbon monoxide, volatile organic compounds and formaldehyde. Despite the high heterogeneity between studies (regarding the geographical area, type of surrounding environments, season of the year, type of dwelling, bedrooms’ ventilation, number of occupants), several air pollutants showed exceedances of the limit values established by guidelines or legislation, indicating that an effort should be made in order to minimise human exposure to air pollutants. For instance, when considering the air quality guideline of World Health Organisation of 10 µg·m−3 for PM2.5, 86% of studies that focused this pollutant registered levels above this threshold. Considering that people spend one third of their day sleeping, exposure during this period may have a significant impact on the daily integrated human exposure, due to the higher amount of exposure time, even if this environment is characterised by lower pollutants’ levels. Improving the current knowledge of air pollutants levels during sleep in different settings, as well as in different countries, will allow to improve the accuracy of exposure assessments and will also allow to understand their main drivers and how to tackle them. Full article
(This article belongs to the Special Issue Indoor Air Quality—What Is Known and What Needs to Be Done)
Show Figures

Figure 1

19 pages, 6086 KiB  
Article
Data-Driven Wildfire Risk Prediction in Northern California
by Ashima Malik, Megha Rajam Rao, Nandini Puppala, Prathusha Koouri, Venkata Anil Kumar Thota, Qiao Liu, Sen Chiao and Jerry Gao
Atmosphere 2021, 12(1), 109; https://doi.org/10.3390/atmos12010109 - 13 Jan 2021
Cited by 28 | Viewed by 7143
Abstract
Over the years, rampant wildfires have plagued the state of California, creating economic and environmental loss. In 2018, wildfires cost nearly 800 million dollars in economic loss and claimed more than 100 lives in California. Over 1.6 million acres of land has burned [...] Read more.
Over the years, rampant wildfires have plagued the state of California, creating economic and environmental loss. In 2018, wildfires cost nearly 800 million dollars in economic loss and claimed more than 100 lives in California. Over 1.6 million acres of land has burned and caused large sums of environmental damage. Although, recently, researchers have introduced machine learning models and algorithms in predicting the wildfire risks, these results focused on special perspectives and were restricted to a limited number of data parameters. In this paper, we have proposed two data-driven machine learning approaches based on random forest models to predict the wildfire risk at areas near Monticello and Winters, California. This study demonstrated how the models were developed and applied with comprehensive data parameters such as powerlines, terrain, and vegetation in different perspectives that improved the spatial and temporal accuracy in predicting the risk of wildfire including fire ignition. The combined model uses the spatial and the temporal parameters as a single combined dataset to train and predict the fire risk, whereas the ensemble model was fed separate parameters that were later stacked to work as a single model. Our experiment shows that the combined model produced better results compared to the ensemble of random forest models on separate spatial data in terms of accuracy. The models were validated with Receiver Operating Characteristic (ROC) curves, learning curves, and evaluation metrics such as: accuracy, confusion matrices, and classification report. The study results showed and achieved cutting-edge accuracy of 92% in predicting the wildfire risks, including ignition by utilizing the regional spatial and temporal data along with standard data parameters in Northern California. Full article
(This article belongs to the Special Issue Wildfire Spread and Weather: Theory, Models and Reality)
Show Figures

Figure 1

22 pages, 2766 KiB  
Article
Simultaneous Monitoring of Particle-Bound PAHs Inside a Low-Energy School Building and Outdoors over Two Weeks in France
by Céline Liaud, Sarah Chouvenc and Stéphane Le Calvé
Atmosphere 2021, 12(1), 108; https://doi.org/10.3390/atmos12010108 - 13 Jan 2021
Cited by 8 | Viewed by 1820
Abstract
The emergence of new super-insulated buildings to reduce energy consumption can lead to a degradation of the indoor air quality. While some studies were carried out to assess the air quality in these super-insulated buildings, they were usually focused on the measurement of [...] Read more.
The emergence of new super-insulated buildings to reduce energy consumption can lead to a degradation of the indoor air quality. While some studies were carried out to assess the air quality in these super-insulated buildings, they were usually focused on the measurement of gas phase pollutants such as carbon dioxide and volatile organic compounds. This work reports the first measurements of Polycyclic Aromatic Hydrocarbons (PAHs) associated with particles as a function of time and particle size in a low-energy building. The airborne particles were collected indoors and outdoors over three to four days of sampling using two three-stage cascade impactors allowing to sample simultaneously particles with aerodynamic diameter Dae > 10 µm, 2.5 µm < Dae < 10 µm, 1 µm < Dae < 2.5 µm, and Dae < 1 µm. The 16 US-EPA priority PAHs were then extracted and quantified by high-performance liquid chromatography (HPLC) coupled to fluorescence detection. The resulting total particle concentrations were low, in the ranges 3.73 to 9.66 and 0.60 to 8.83 µg m-3 for indoors and outdoors, respectively. Thirteen PAHs were always detected in all the samples. The total PAH concentrations varied between 290 and 415 pg m−3 depending on the particle size, the environment (indoors or outdoors) and the sampling period considered. More interestingly, the temporal variations of individual PAHs highlighted that high molecular weight PAHs were mainly associated to the finest particles and some of them exhibited similar temporal behaviors, suggesting a common emission source. The indoor-to-outdoor concentration ratios of individual PAH were usually found close to or less than 1, except during the event combining rainy conditions and limited indoor ventilation rate. Full article
(This article belongs to the Special Issue Air Pollution and Environment in France)
Show Figures

Figure 1

22 pages, 10339 KiB  
Article
The Potential of Low-Cost Tin-Oxide Sensors Combined with Machine Learning for Estimating Atmospheric CH4 Variations around Background Concentration
by Rodrigo Rivera Martinez, Diego Santaren, Olivier Laurent, Ford Cropley, Cécile Mallet, Michel Ramonet, Christopher Caldow, Leonard Rivier, Gregoire Broquet, Caroline Bouchet, Catherine Juery and Philippe Ciais
Atmosphere 2021, 12(1), 107; https://doi.org/10.3390/atmos12010107 - 13 Jan 2021
Cited by 6 | Viewed by 2904
Abstract
Continued developments in instrumentation and modeling have driven progress in monitoring methane (CH4) emissions at a range of spatial scales. The sites that emit CH4 such as landfills, oil and gas extraction or storage infrastructure, intensive livestock farms account for [...] Read more.
Continued developments in instrumentation and modeling have driven progress in monitoring methane (CH4) emissions at a range of spatial scales. The sites that emit CH4 such as landfills, oil and gas extraction or storage infrastructure, intensive livestock farms account for a large share of global emissions, and need to be monitored on a continuous basis to verify the effectiveness of reductions policies. Low cost sensors are valuable to monitor methane (CH4) around such facilities because they can be deployed in a large number to sample atmospheric plumes and retrieve emission rates using dispersion models. Here we present two tests of three different versions of Figaro® TGS tin-oxide sensors for estimating CH4 concentrations variations, at levels similar to current atmospheric values, with a sought accuracy of 0.1 to 0.2 ppm. In the first test, we characterize the variation of the resistance of the tin-oxide semi-conducting sensors to controlled levels of CH4, H2O and CO in the laboratory, to analyze cross-sensitivities. In the second test, we reconstruct observed CH4 variations in a room, that ranged from 1.9 and 2.4 ppm during a three month experiment from observed time series of resistances and other variables. To do so, a machine learning model is trained against true CH4 recorded by a high precision instrument. The machine-learning model using 30% of the data for training reconstructs CH4 within the target accuracy of 0.1 ppm only if training variables are representative of conditions during the testing period. The model-derived sensitivities of the sensors resistance to H2O compared to CH4 are larger than those observed under controlled conditions, which deserves further characterization of all the factors influencing the resistance of the sensors. Full article
(This article belongs to the Section Atmospheric Techniques, Instruments, and Modeling)
Show Figures

Figure 1

13 pages, 3072 KiB  
Article
Mobile Monitoring for the Spatial and Temporal Assessment of Local Air Quality (NO2) in the City of London
by Fabio Galatioto, James Ferguson-Moore and Ruth Calderwood
Atmosphere 2021, 12(1), 106; https://doi.org/10.3390/atmos12010106 - 13 Jan 2021
Cited by 1 | Viewed by 2221
Abstract
This paper reports on the analysis and findings of the data collected during a mobile air quality campaign commissioned by the City of London Corporation (CoL). This was done using an equipped vehicle capable of taking continuous precision measurements of local air quality [...] Read more.
This paper reports on the analysis and findings of the data collected during a mobile air quality campaign commissioned by the City of London Corporation (CoL). This was done using an equipped vehicle capable of taking continuous precision measurements of local air quality while travelling within the City. Several comparative analyses on measured Nitrogen Dioxide (NO2) data have been performed between Smogmobile data and those available from CoL precision systems as well as with indicative systems, namely Diffusion Tubes, distributed across the City. Key findings highlight that data collected from the Smogmobile, in terms of average concentration of NO2 across the City (62 µg/m3), are very similar to those obtained by averaging the values from the 48 indicative systems (59.5 µg/m3), with an error of just 4%. Overall, this study demonstrates significant potential and value in using mobile air quality measurements to support assessment of air quality over large areas by Local authorities. Full article
(This article belongs to the Special Issue Air Quality in the UK)
Show Figures

Figure 1

2 pages, 139 KiB  
Editorial
Exposure and Health Impacts Related to Outdoor and Indoor Air Pollutants
by Haider A. Khwaja
Atmosphere 2021, 12(1), 105; https://doi.org/10.3390/atmos12010105 - 13 Jan 2021
Viewed by 1825
Abstract
The five papers included in this Special Issue represent a diverse selection of contributions [...] Full article
18 pages, 6183 KiB  
Article
Investigation of the North Atlantic Oscillation and Indian Ocean Dipole Influence on Precipitation in Turkey with Cross-Spectral Analysis
by Umut Sakine Demir and Abdullah Cem Koc
Atmosphere 2021, 12(1), 99; https://doi.org/10.3390/atmos12010099 - 12 Jan 2021
Cited by 1 | Viewed by 2317
Abstract
Predicting the future behavior of precipitation is of the utmost importance for planning agriculture or water resource management and in designing water structures. Determining the relationships between precipitation and the oceans may enable more accurate predictions. Therefore, oceanic and other persistent indices called [...] Read more.
Predicting the future behavior of precipitation is of the utmost importance for planning agriculture or water resource management and in designing water structures. Determining the relationships between precipitation and the oceans may enable more accurate predictions. Therefore, oceanic and other persistent indices called teleconnection patterns can be used, namely the North Atlantic oscillation (NAO) and the Indian Ocean dipole (IOD). The NAO affects the precipitation patterns in the Atlantic Ocean and Mediterranean countries, such as in Turkey. The IOD is related to temperature and precipitation in the Indian Ocean coastal countries and in some areas far from the Indian Ocean. In this study, the effects of the NAO and IOD indices on precipitation in Turkey were investigated by means of cross-spectral analysis between the monthly total precipitation (mm) and monthly NAO and IOD index values. Phase shift values were also calculated for the selected periods and their accuracy was evaluated statistically, using the determination coefficient (R2) and Akaike information criterion (AIC) as performance criteria for the linear model. The results indicated strong correlations for the 13-, 14-, 16-, and 22–23-month periods between the NAO index and precipitation values; and for the 13-, 14-, 16–17-, and 20–21-month periods between the IOD index and precipitation values. After cross-spectral analysis between the NAO and IOD indices and precipitation values, the maximum phase shift values increased as the periods increased, while the maximum phase shift value for each period was almost half of the period value. Moreover, the maximum cross-power spectral density (CPSD) values increased as the periods increased. High CPSD values were observed in the west of Turkey for the NAO and in the east of Turkey for the IOD. Full article
(This article belongs to the Special Issue The Impact of Climate on the Water Environment)
Show Figures

Figure 1

15 pages, 5036 KiB  
Article
A Computational Methodology for the Calibration of Tephra Transport Nowcasting at Sakurajima Volcano, Japan
by Alexandros P. Poulidis, Atsushi Shimizu, Haruhisa Nakamichi and Masato Iguchi
Atmosphere 2021, 12(1), 104; https://doi.org/10.3390/atmos12010104 - 12 Jan 2021
Cited by 4 | Viewed by 2458
Abstract
Ground-based remote sensing equipment have the potential to be used for the nowcasting of the tephra hazard from volcanic eruptions. To do so raw data from the equipment first need to be accurately transformed to tephra-related physical quantities. In order to establish these [...] Read more.
Ground-based remote sensing equipment have the potential to be used for the nowcasting of the tephra hazard from volcanic eruptions. To do so raw data from the equipment first need to be accurately transformed to tephra-related physical quantities. In order to establish these relations for Sakurajima volcano, Japan, we propose a methodology based on high-resolution simulations. An eruption that occurred at Sakurajima on 16 July 2018 is used as the basis of a pilot study. The westwards dispersal of the tephra cloud was ideal for the observation network that has been installed near the volcano. In total, the plume and subsequent tephra cloud were recorded by 2 XMP radars, 1 lidar and 3 optical disdrometers, providing insight on all phases of the eruption, from plume generation to tephra transport away from the volcano. The Weather Research and Forecasting (WRF) and FALL3D models were used to reconstruct the transport and deposition patterns. Simulated airborne tephra concentration and accumulated load were linked, respectively, to lidar backscatter intensity and radar reflectivity. Overall, results highlight the possibility of using such a high-resolution modelling-based methodology as a reliable complementary strategy to common approaches for retrieving tephra-related quantities from remote sensing data. Full article
Show Figures

Figure 1

14 pages, 4226 KiB  
Article
Short-Term Aerial Pollutant Concentrations in a Southwestern China Pig-Fattening House
by Shihua Pu, Xiao Rong, Jiaming Zhu, Yaqiong Zeng, Jian Yue, TengTeeh Lim and Dingbiao Long
Atmosphere 2021, 12(1), 103; https://doi.org/10.3390/atmos12010103 - 12 Jan 2021
Cited by 10 | Viewed by 2569
Abstract
Concentrations of critical aerial pollutants within animal farms are important to the health of animals and farm staff and can be reduced via manure management, ventilation control, and barn design. This study characterized measurements of ammonia (NH3), total suspended particle (TSP), [...] Read more.
Concentrations of critical aerial pollutants within animal farms are important to the health of animals and farm staff and can be reduced via manure management, ventilation control, and barn design. This study characterized measurements of ammonia (NH3), total suspended particle (TSP), and airborne microbial communities of a large-scale pig-fattening house, as well as their correlations with environmental variables in Southwestern China. Monitoring was conducted for 15 consecutive days during both August and January, at various locations inside the pig house. The concentrations of NH3 and TSP averaged 3.22 and 0.55 mg m−3, respectively, while the average number of airborne microbial colonies was 3.91 log cfu m−3. The aerial pollutant concentrations displayed significant seasonal differences (p < 0.05). Specifically, concentrations in winter were significantly higher than those in summer (p < 0.05), and the 07:00 measurements were the highest among the three measurement times. The concentrations were significantly correlated with indoor temperature and relative humidity. In summer, TSP concentration was negatively correlated with temperature (correlation coefficient = −0.732), while NH3 concentration was positively correlated with temperature (correlation coefficient = 0.58). In winter, TSP and NH3 concentrations were negatively correlated with relative humidity (correlation coefficients = −0.739 and −0.713, respectively), while the airborne microbial colonies were not correlated with either humidity or temperature in summer or winter. These findings confirm that the aerial pollutant concentrations in a Southwestern China pig-fattening house exhibited significant seasonal and diurnal variations. Air quality can be improved by more precise ventilation control as observed by the correlation of concentrations with ventilation control, indoor temperature, and humidity. Full article
(This article belongs to the Special Issue Livestock Odor and Air Quality)
Show Figures

Figure 1

17 pages, 6989 KiB  
Article
Calculation of NH3 Emissions, Evaluation of Backward Lagrangian Stochastic Dispersion Model and Aerodynamic Gradient Method
by Jesper Nørlem Kamp, Christoph Häni, Tavs Nyord, Anders Feilberg and Lise Lotte Sørensen
Atmosphere 2021, 12(1), 102; https://doi.org/10.3390/atmos12010102 - 12 Jan 2021
Cited by 3 | Viewed by 2835
Abstract
Two campaigns measuring ammonia (NH3) emissions with different measurement techniques were performed on a large grass field (26 ha) after the application of liquid animal manure. The aim was to compare emissions from a confined area estimated from either (i) concentration [...] Read more.
Two campaigns measuring ammonia (NH3) emissions with different measurement techniques were performed on a large grass field (26 ha) after the application of liquid animal manure. The aim was to compare emissions from a confined area estimated from either (i) concentration measurements, both point and line-integrated measurements, combined with backward Lagrangian stochastic (bLS) dispersion modeling or by (ii) estimation of the vertical flux by the aerodynamic gradient method (AGM) with and without footprint correction approximated by the bLS model estimates of the flux footprint. The objective of the comparison is to establish the best practice to derive NH3 emissions from a large field. NH3 emissions derived from bLS agreed well when comparing point and line-integrated measurements. Simple point measurements combined with bLS yield good emission estimations for the confined area. Without footprint correction, the AGM underestimates the emissions by up to 9% compared to the footprint-corrected AGM results. The sensitivity of the measurement methods makes it possible to quantify NH3 emissions with diurnal patterns even five days after a field application of liquid animal manure under wet conditions. The bLS model proves to be a strong tool to determine the NH3 emissions from point concentration measurements inside a large field after a slurry application. Full article
(This article belongs to the Section Atmospheric Techniques, Instruments, and Modeling)
Show Figures

Figure 1

13 pages, 5659 KiB  
Article
Complex Networks Reveal Teleconnections between the Global SST and Rainfall in Southwest China
by Panjie Qiao, Wenqi Liu, Yongwen Zhang and Zhiqiang Gong
Atmosphere 2021, 12(1), 101; https://doi.org/10.3390/atmos12010101 - 12 Jan 2021
Cited by 4 | Viewed by 2542
Abstract
Droughts and floods have frequently occurred in Southwest China (SWC) during the past several decades. Yet, the understanding of the mechanism of precipitation in SWC is still a challenge, since the East Asian monsoon and Indian monsoon potentially influence the rainfall in this [...] Read more.
Droughts and floods have frequently occurred in Southwest China (SWC) during the past several decades. Yet, the understanding of the mechanism of precipitation in SWC is still a challenge, since the East Asian monsoon and Indian monsoon potentially influence the rainfall in this region. Thus, the prediction of precipitation in SWC has become a difficult and critical topic in climatology. We develop a novel multi-variable network-based method to delineate the relations between the global sea surface temperature anomalies (SSTA) and the precipitation anomalies (PA) in SWC. Our results show that the out-degree patterns in the Pacific, Atlantic and Indian Ocean significantly influence the PA in SWC. In particular, we find that such patterns dominated by extreme precipitation change with the seasons. Furthermore, we uncover that the teleconnections between the global SSTA and rainfall can be described by the in-degree patterns, which dominated by several vital nodes within SWC. Based on the characteristics of these nodes, we find that the key SSTA areas affect the pattern of the nodes in SWC with some specific time delays that could be helpful to improve the long-term prediction of precipitation in SWC. Full article
(This article belongs to the Special Issue New Approaches to Complex Climate Systems)
Show Figures

Figure 1

21 pages, 4514 KiB  
Article
Potential of ARIMA-ANN, ARIMA-SVM, DT and CatBoost for Atmospheric PM2.5 Forecasting in Bangladesh
by Shihab Ahmad Shahriar, Imrul Kayes, Kamrul Hasan, Mahadi Hasan, Rashik Islam, Norrimi Rosaida Awang, Zulhazman Hamzah, Aweng Eh Rak and Mohammed Abdus Salam
Atmosphere 2021, 12(1), 100; https://doi.org/10.3390/atmos12010100 - 12 Jan 2021
Cited by 38 | Viewed by 5023
Abstract
Atmospheric particulate matter (PM) has major threats to global health, especially in urban regions around the world. Dhaka, Narayanganj and Gazipur of Bangladesh are positioned as top ranking polluted metropolitan cities in the world. This study assessed the performance of the application of [...] Read more.
Atmospheric particulate matter (PM) has major threats to global health, especially in urban regions around the world. Dhaka, Narayanganj and Gazipur of Bangladesh are positioned as top ranking polluted metropolitan cities in the world. This study assessed the performance of the application of hybrid models, that is, Autoregressive Integrated Moving Average (ARIMA)-Artificial Neural Network (ANN), ARIMA-Support Vector Machine (SVM) and Principle Component Regression (PCR) along with Decision Tree (DT) and CatBoost deep learning model to predict the ambient PM2.5 concentrations. The data from January 2013 to May 2019 with 2342 observations were utilized in this study. Eighty percent of the data was used as training and the rest of the dataset was employed as testing. The performance of the models was evaluated by R2, RMSE and MAE value. Among the models, CatBoost performed best for predicting PM2.5 for all the stations. The RMSE values during the test period were 12.39 µg m−3, 13.06 µg m−3 and 12.97 µg m−3 for Dhaka, Narayanganj and Gazipur, respectively. Nonetheless, the ARIMA-ANN and DT methods also provided acceptable results. The study suggests adopting deep learning models for predicting atmospheric PM2.5 in Bangladesh. Full article
(This article belongs to the Section Air Quality)
Show Figures

Figure 1

12 pages, 9509 KiB  
Article
A Comparison of Meteor Radar Observation over China Region with Horizontal Wind Model (HWM14)
by Qiong Tang, Yufeng Zhou, Zhitao Du, Chen Zhou, Jiandong Qiao, Yi Liu and Guanyi Chen
Atmosphere 2021, 12(1), 98; https://doi.org/10.3390/atmos12010098 - 11 Jan 2021
Cited by 14 | Viewed by 2789
Abstract
This paper compares the wind fields measured by the meteor radar at Mohe, Beijing, Wuhan, and Sanya stations and horizontal wind model (HWM14) predictions. HWM14 appears to successfully reproduce the height-time distribution of the monthly mean zonal winds, although large discrepancies occur in [...] Read more.
This paper compares the wind fields measured by the meteor radar at Mohe, Beijing, Wuhan, and Sanya stations and horizontal wind model (HWM14) predictions. HWM14 appears to successfully reproduce the height-time distribution of the monthly mean zonal winds, although large discrepancies occur in wind speed between the model and measurement, especially in the summer and winter months. For meridional wind, the consistency between model prediction and radar observation is worse than that of zonal wind. The consistency between radar measurements and model prediction at Sanya station is worse than other sites located at higher latitudes. Harmonic analysis reveals large discrepancies in diurnal, semidiurnal, and terdiurnal tides extracted from meteor radar observations and HWM14 predictions. Full article
Show Figures

Figure 1

26 pages, 5540 KiB  
Article
Future Projections and Uncertainty Assessment of Precipitation Extremes in the Korean Peninsula from the CMIP6 Ensemble with a Statistical Framework
by Yonggwan Shin, Yire Shin, Juyoung Hong, Maeng-Ki Kim, Young-Hwa Byun, Kyung-On Boo, Il-Ung Chung, Doo-Sun R. Park and Jeong-Soo Park
Atmosphere 2021, 12(1), 97; https://doi.org/10.3390/atmos12010097 - 11 Jan 2021
Cited by 10 | Viewed by 2684
Abstract
Scientists occasionally predict projected changes in extreme climate using multi-model ensemble methods that combine predictions from individual simulation models. To predict future changes in precipitation extremes in the Korean peninsula, we examined the observed data and 21 models of the Coupled Model Inter-Comparison [...] Read more.
Scientists occasionally predict projected changes in extreme climate using multi-model ensemble methods that combine predictions from individual simulation models. To predict future changes in precipitation extremes in the Korean peninsula, we examined the observed data and 21 models of the Coupled Model Inter-Comparison Project Phase 6 (CMIP6) over East Asia. We applied generalized extreme value distribution (GEVD) to a series of annual maximum daily precipitation (AMP1) data. Multivariate bias-corrected simulation data under three shared socioeconomic pathway (SSP) scenarios—namely, SSP2-4.5, SSP3-7.0, and SSP5-8.5—were used. We employed a model weighting method that accounts for both performance and independence (PI-weighting). In calculating the PI-weights, two shape parameters should be determined, but usually, a perfect model test method requires a considerable amount of computing time. To address this problem, we suggest simple ways for selecting two shape parameters based on the chi-square statistic and entropy. Variance decomposition was applied to quantify the uncertainty of projecting the future AMP1. Return levels spanning over 20 and 50 years, as well as the return periods relative to the reference years (1973–2010), were estimated for three overlapping periods in the future, namely, period 1 (2021–2050), period 2 (2046–2075), and period 3 (2071–2100). From these analyses, we estimated that the relative increases in the observations for the spatial median 20-year return level will be approximately 18.4% in the SSP2-4.5, 25.9% in the SSP3-7.0, and 41.7% in the SSP5-8.5 scenarios, respectively, by the end of the 21st century. We predict that severe rainfall will be more prominent in the southern and central parts of the Korean peninsula. Full article
Show Figures

Figure 1

11 pages, 1269 KiB  
Article
Mitigation of Gaseous Emissions from Stored Swine Manure with Biochar: Effect of Dose and Reapplication on a Pilot-Scale
by Baitong Chen, Jacek A. Koziel, Chumki Banik, Hantian Ma, Myeongseong Lee, Samuel C. O’Brien, Peiyang Li, Daniel S. Andersen, Andrzej Białowiec and Robert C. Brown
Atmosphere 2021, 12(1), 96; https://doi.org/10.3390/atmos12010096 - 11 Jan 2021
Cited by 13 | Viewed by 3148
Abstract
Rural communities are affected by gaseous emissions from intensive livestock production. Practical mitigation technologies are needed to minimize emissions from stored manure and improve air quality inside barns. In our previous research, the one-time surficial application of biochar to swine manure significantly reduced [...] Read more.
Rural communities are affected by gaseous emissions from intensive livestock production. Practical mitigation technologies are needed to minimize emissions from stored manure and improve air quality inside barns. In our previous research, the one-time surficial application of biochar to swine manure significantly reduced emissions of NH3 and phenol. We observed that the mitigation effect decreased with time during the 30-day trials. In this research, we hypothesized that bi-weekly reapplication of biochar could improve the mitigation effect on a wider range of odorous compounds using a larger scale and longer trials. The objective was to evaluate the effectiveness of biochar dose and reapplication on mitigation of targeted gases (NH3, odorous, volatile organic compounds VOCs, odor, greenhouse gases (GHG)) from stored swine manure on a pilot-scale setup over 8-weeks. The bi-weekly reapplication of the lower biochar dose (2 kg/m2) showed much higher significant percentage reductions in emissions for NH3 (33% without and 53% with reapplication) and skatole (42% without and 80% with reapplication), respectively. In addition, the reapplication resulted in the emergence of a statistical significance to the mitigation effect for all other targeted VOCs. Specifically, for indole, the percentage reduction improved from 38% (p = 0.47, without reapplication) to 78% (p = 0.018, with reapplication). For phenol, the percentage reduction improved from 28% (p = 0.71, without reapplication) to 89% (p = 0.005, with reapplication). For p-cresol, the percentage reduction improved from 31% (p = 0.86, without reapplication) to 74% (p = 0.028, with reapplication). For 4-ethyl phenol, the percentage emissions reduction improved from 66% (p = 0.44, without reapplication) to 87% (p = 0.007, with reapplication). The one-time 2 kg/m2 and 4 kg/m2 treatments showed similar effectiveness in mitigating all targeted gases, and no statistical difference was found between the dosages. The one-time treatments showed significant percentage reductions of 33% and 42% and 25% and 48% for NH3 and skatole, respectively. The practical significance is that the higher (one-time) biochar dose may not necessarily result in improved performance over the 8-week manure storage, but the bi-weekly reapplication showed significant improvement in mitigating NH3 and odorous VOCs. The lower dosages and the frequency of reapplication on the larger-scale should be explored to optimize biochar treatment and bring it closer to on-farm trials. Full article
(This article belongs to the Special Issue Livestock Odor and Air Quality)
Show Figures

Figure 1

Previous Issue
Next Issue
Back to TopTop