Changes in Methane Emission and Community Composition of Methane-Cycling Microorganisms Along an Elevation Gradient in the Dongting Lake Floodplain, China

Abstract
:1. Introduction
2. Experiments
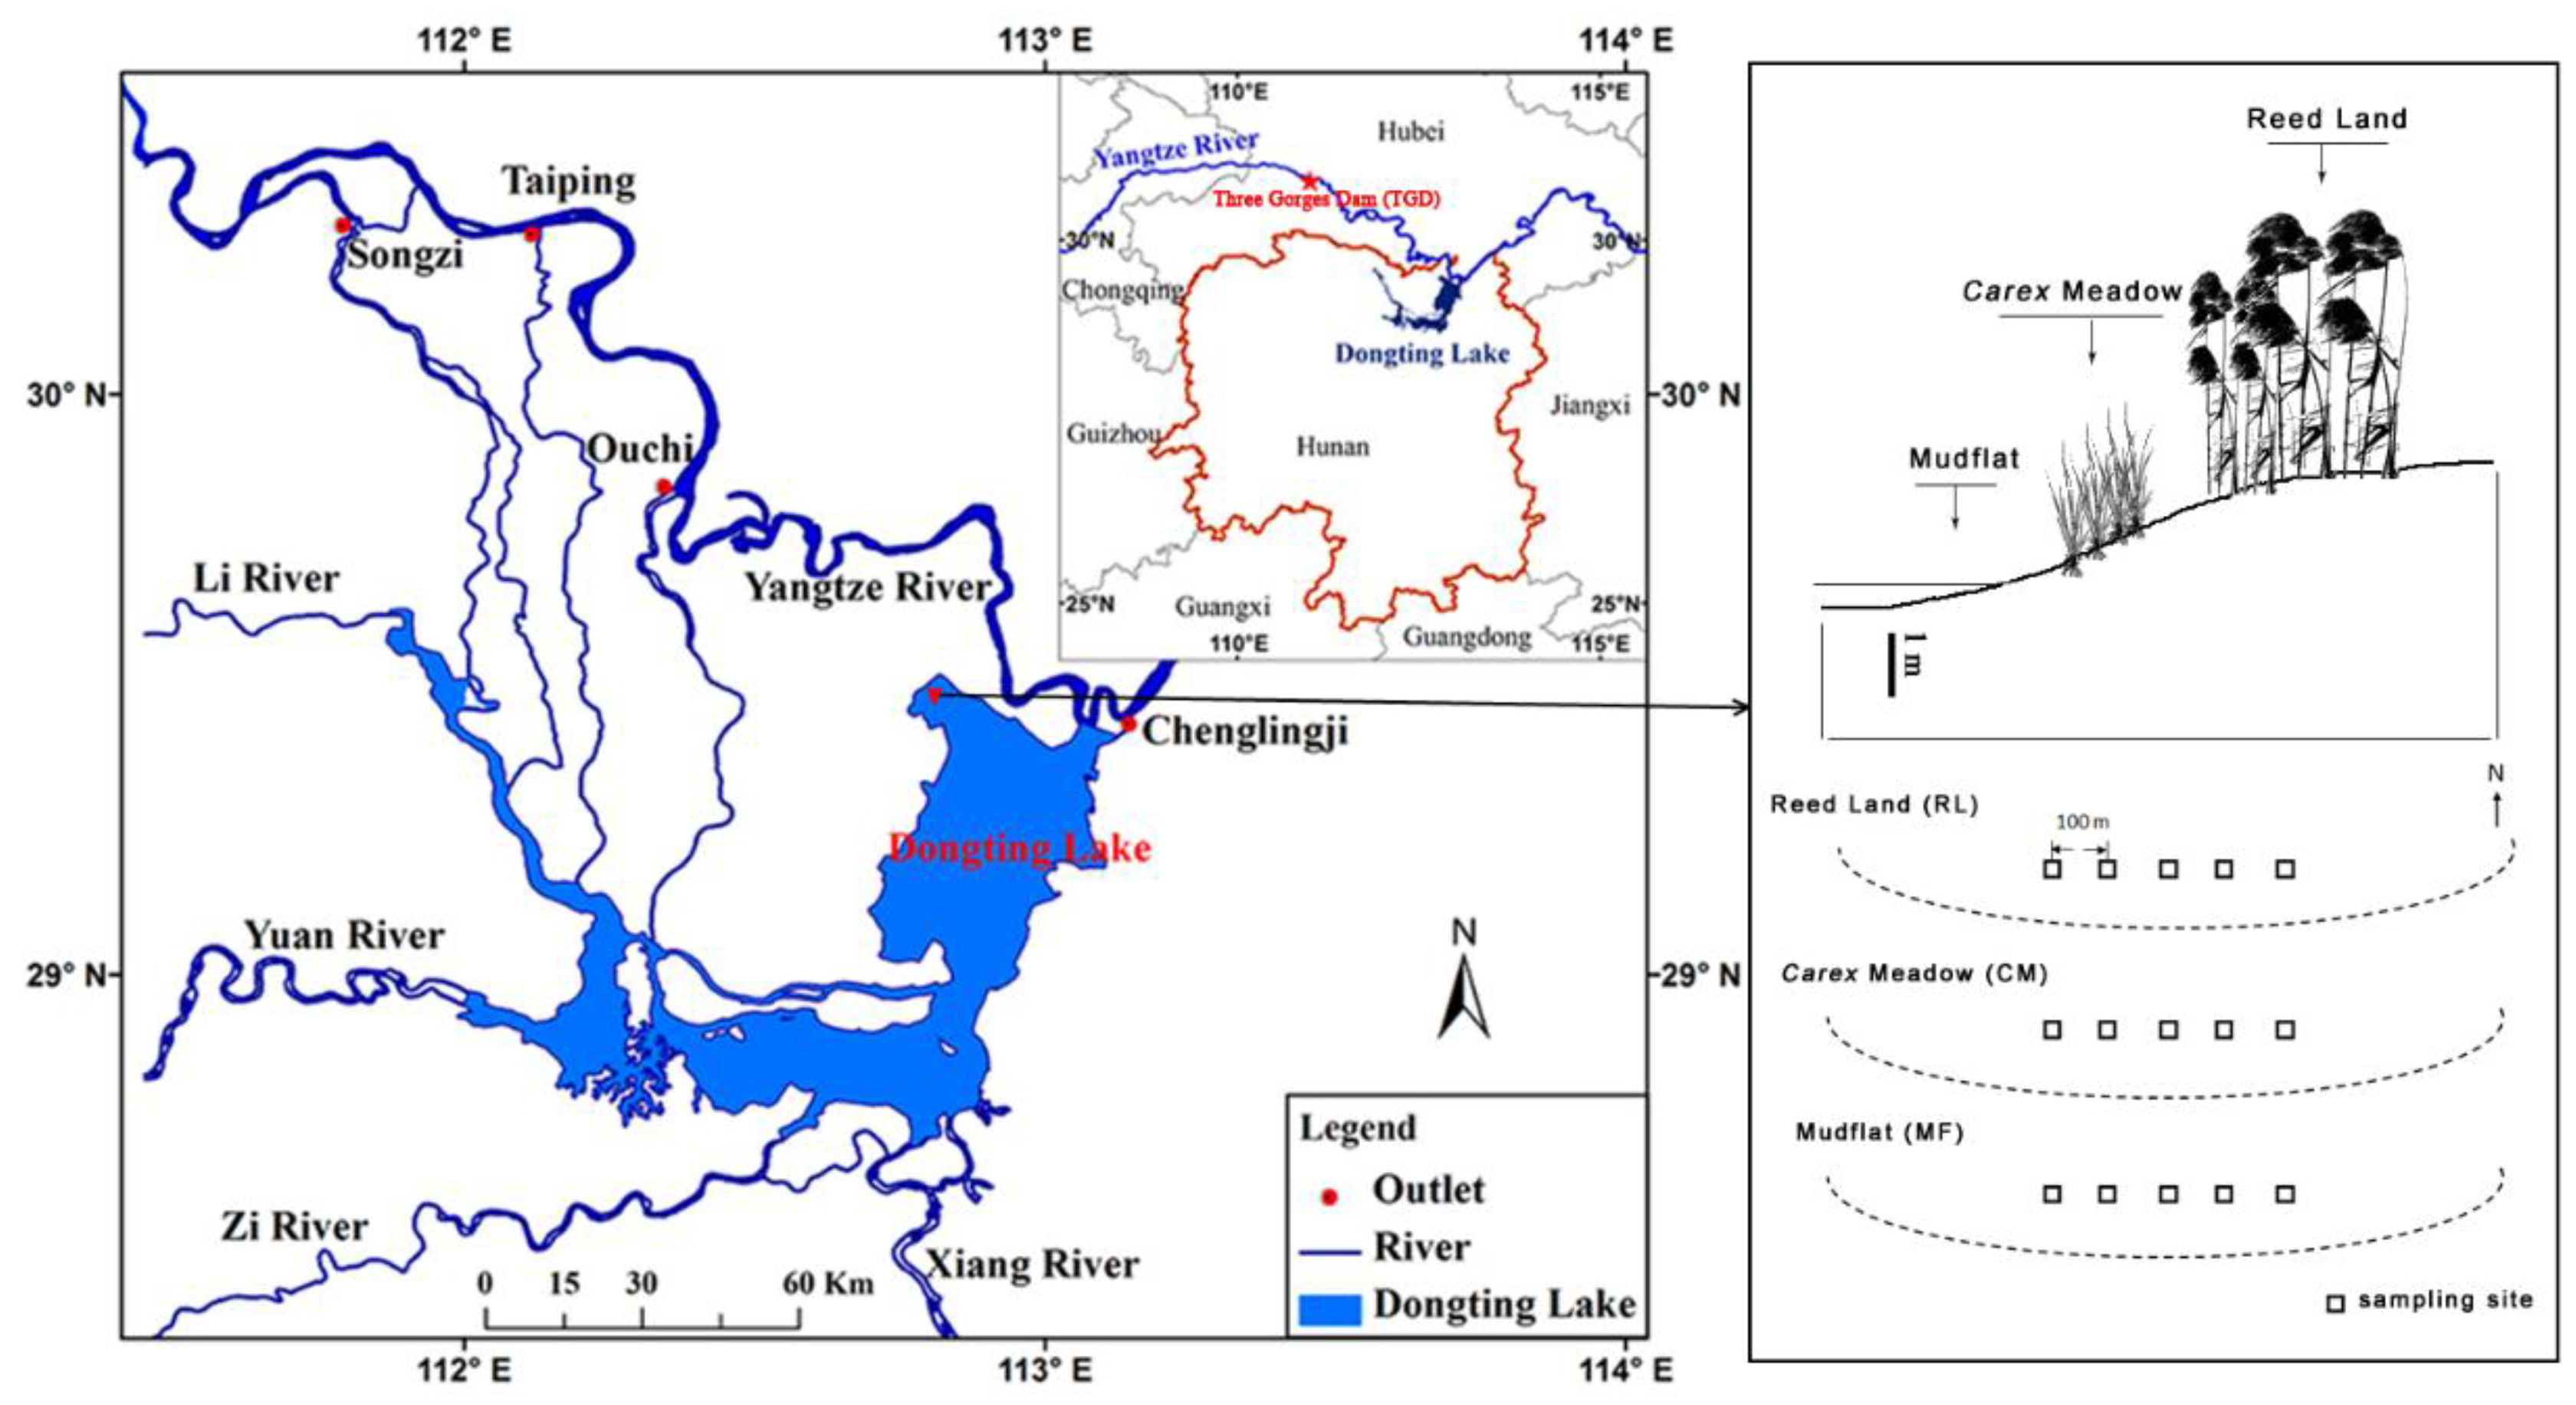
2.1. Study Site
2.2. Soil Sampling Process
2.3. Soil Physical and Chemical Analysis
2.4. Gas Sampling and CH4 Lux Calculation
2.5. DNA Extraction, PCR Amplification, and High-Throughput Sequencing
2.6. Real-Time Quantitative PCR
2.7. Data Analysis
3. Results
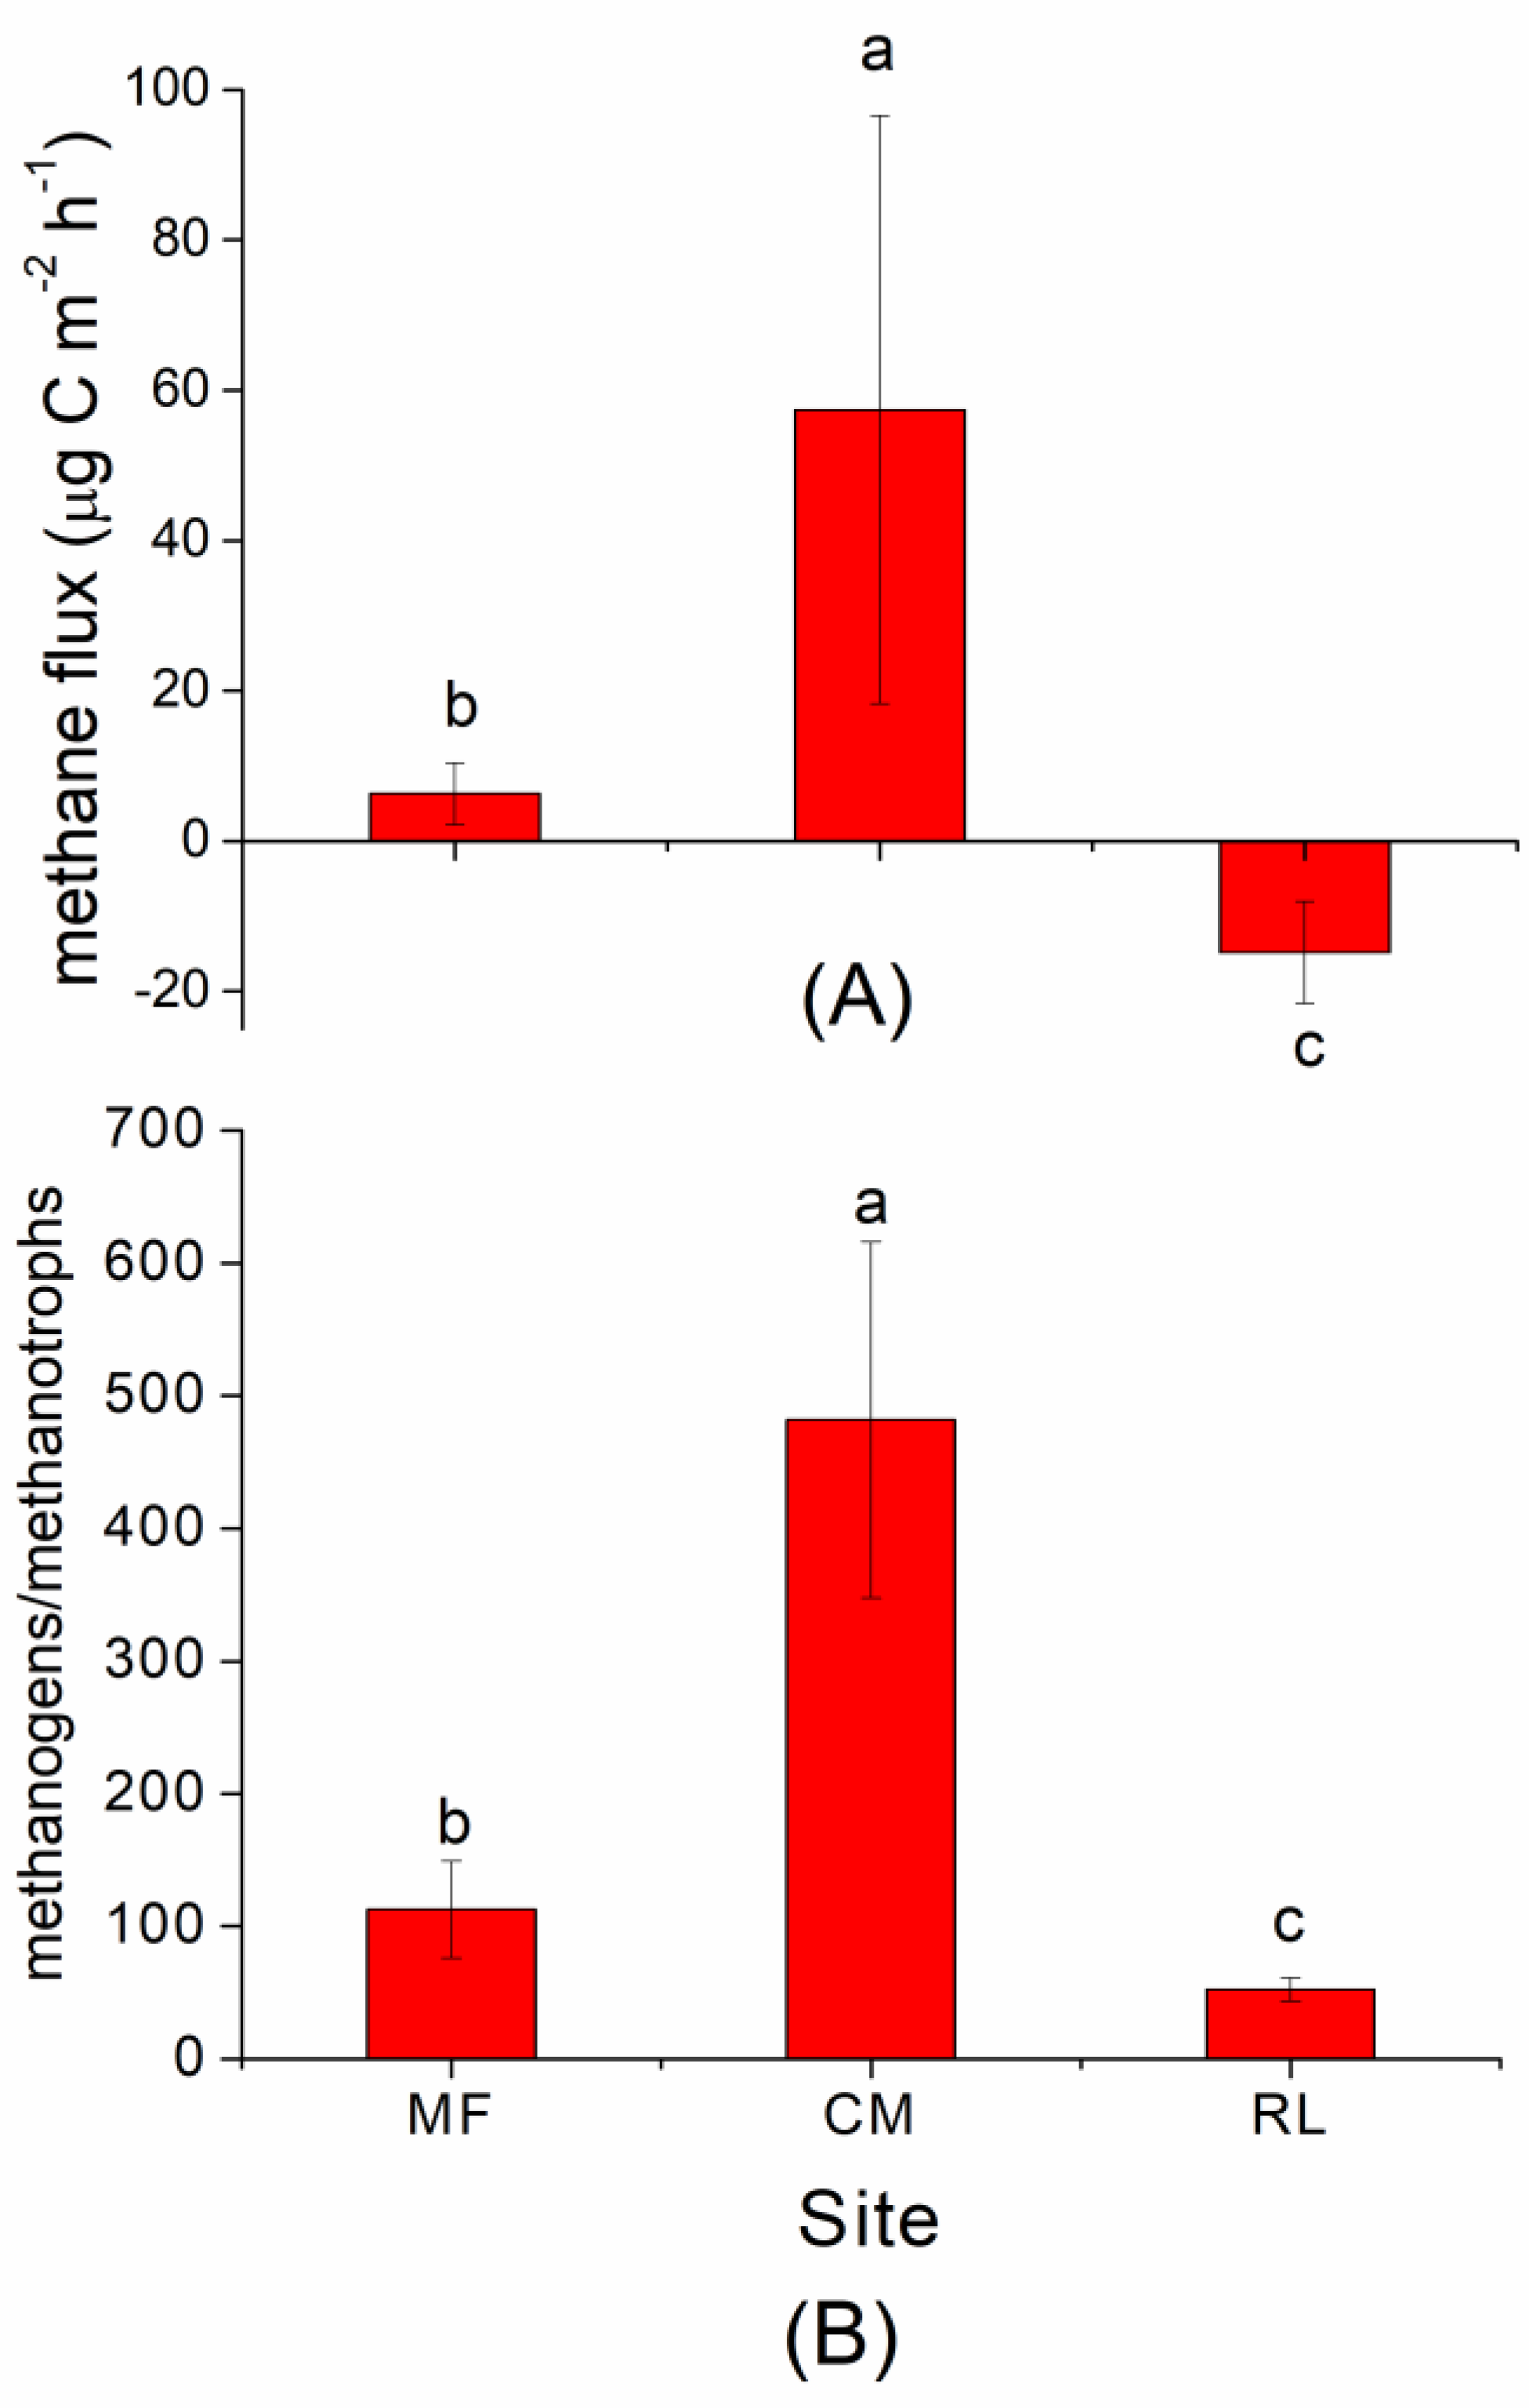
3.1. CH4 Flux and Abundance of Methanogens and Methanotrophs
3.2. Diversity and Richness of Methanogens and Methanotrophs
3.3. Community Composition of Methanogens and Methanotrophs
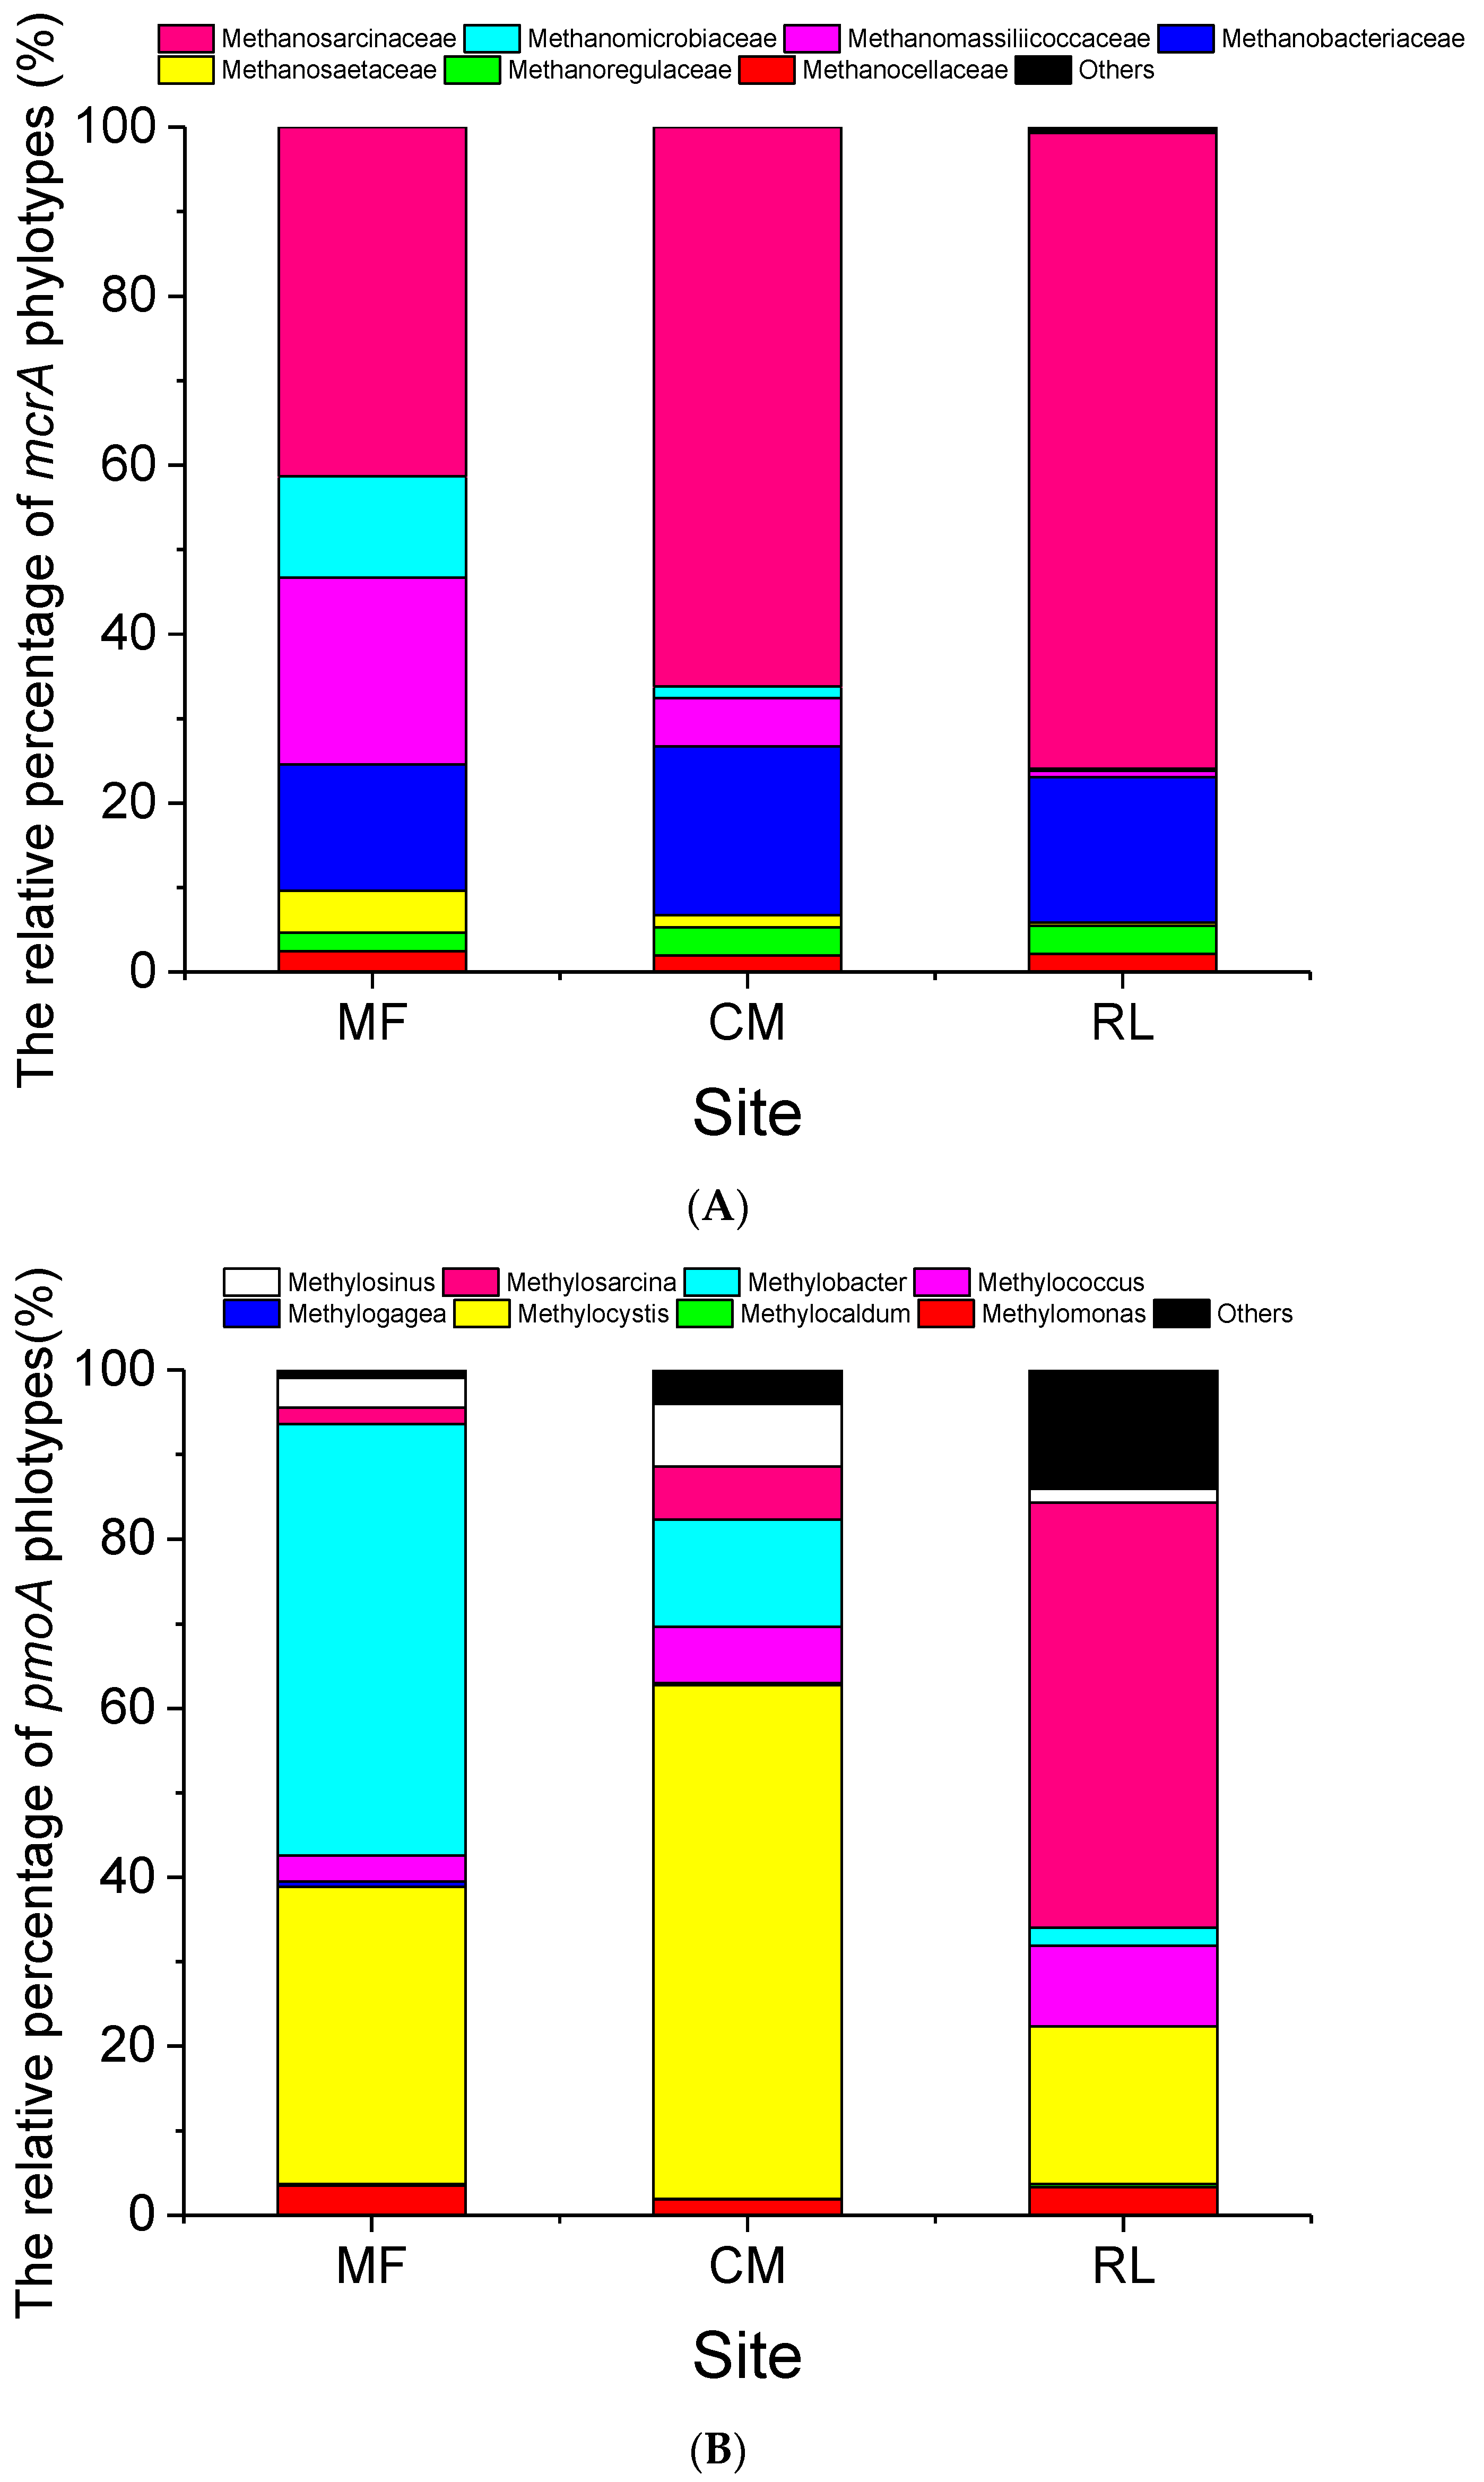
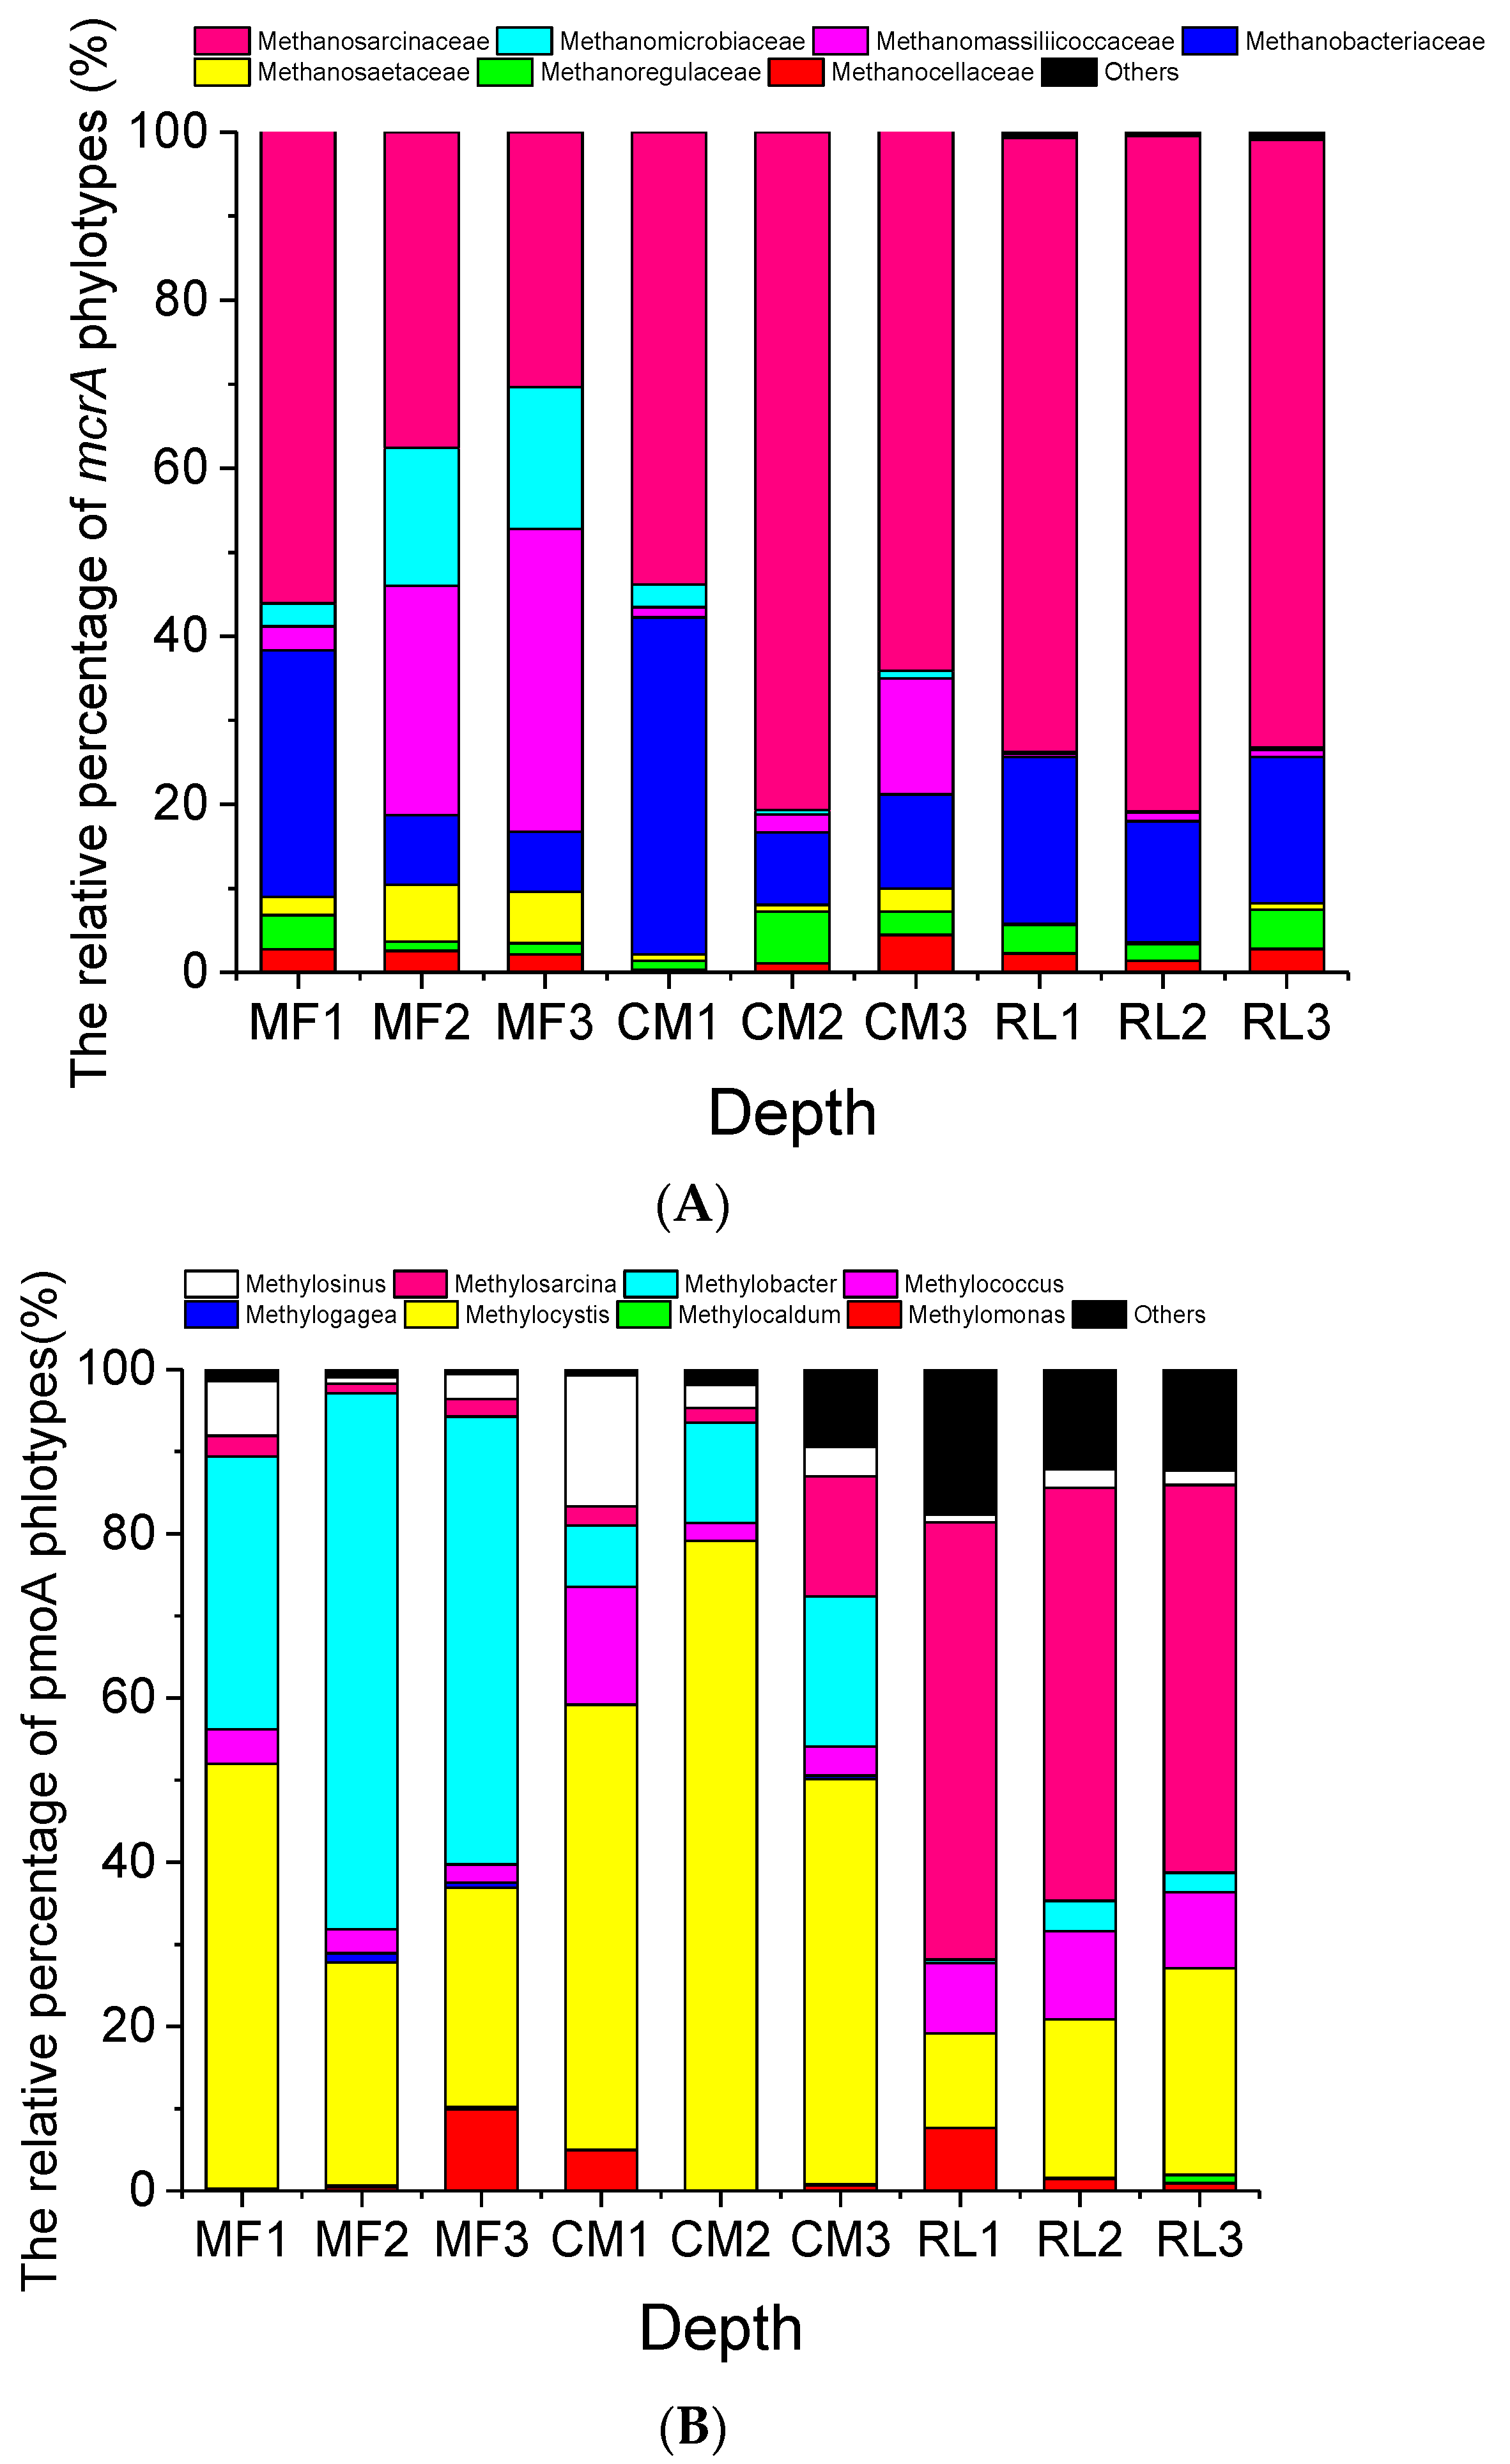
3.3.1. Methanogens
3.3.2. Methanotrophs
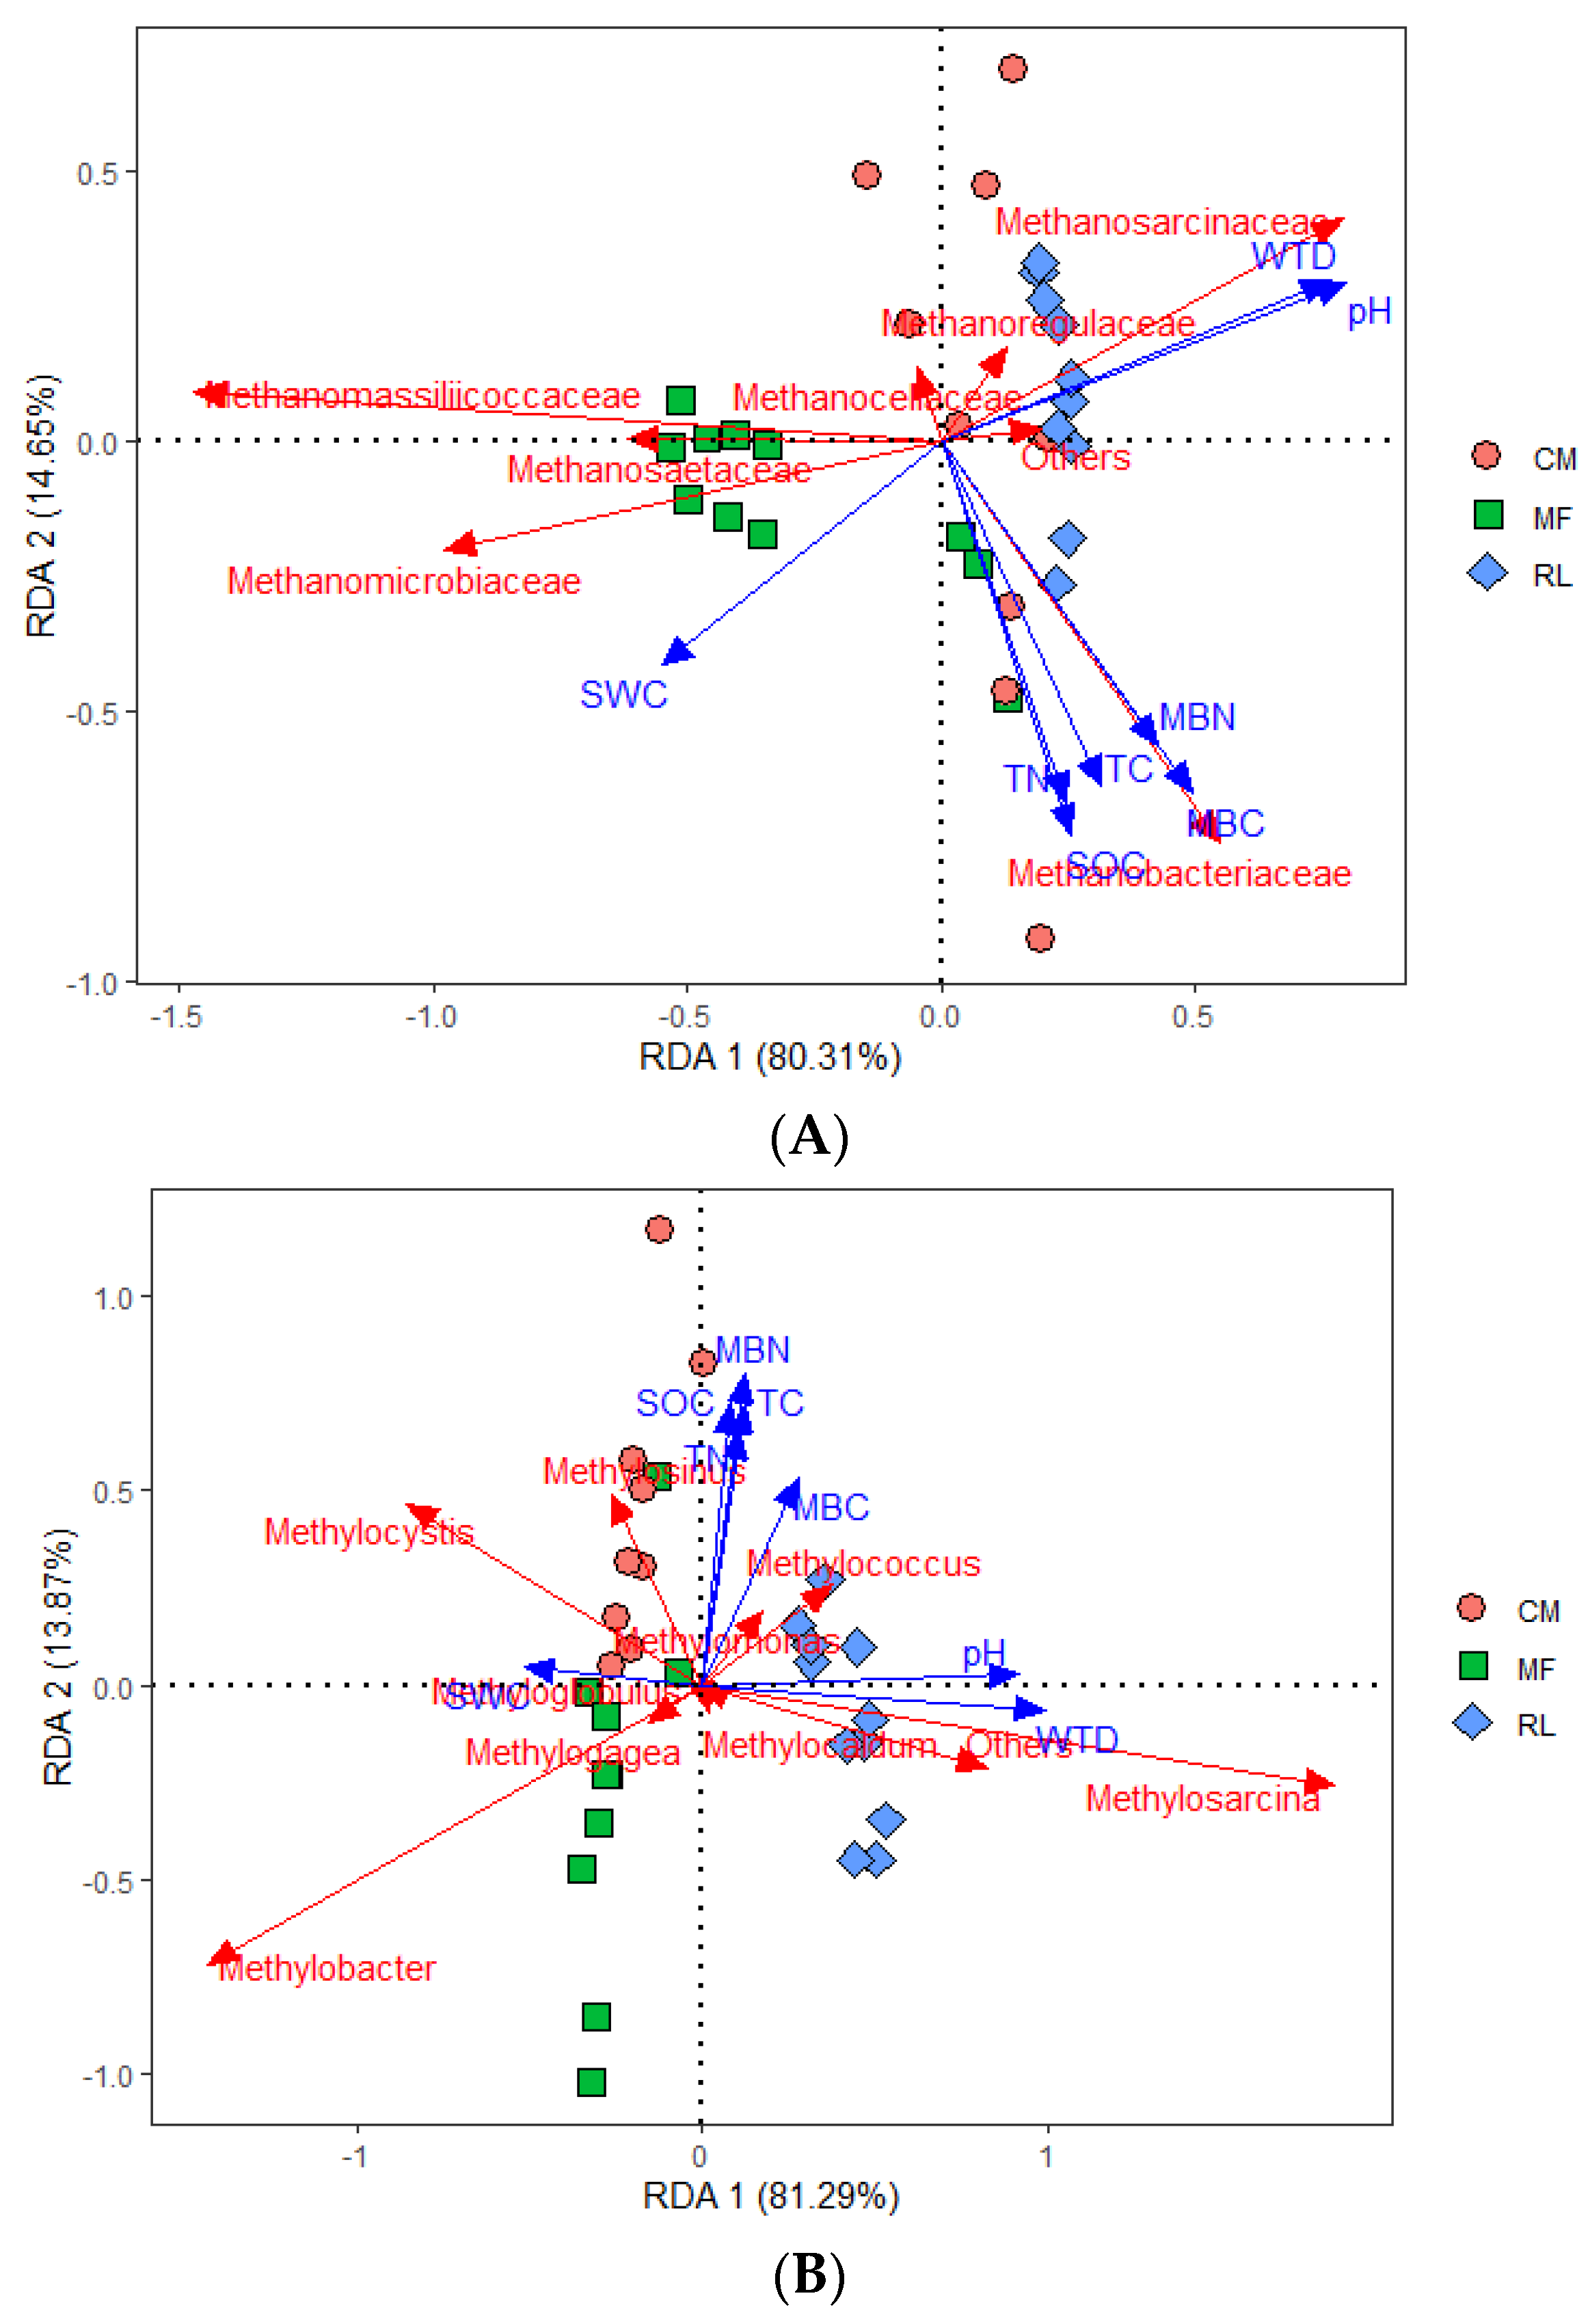
3.4. The Relationship between Methanogen and Methanotroph Communities and Environmental Factors
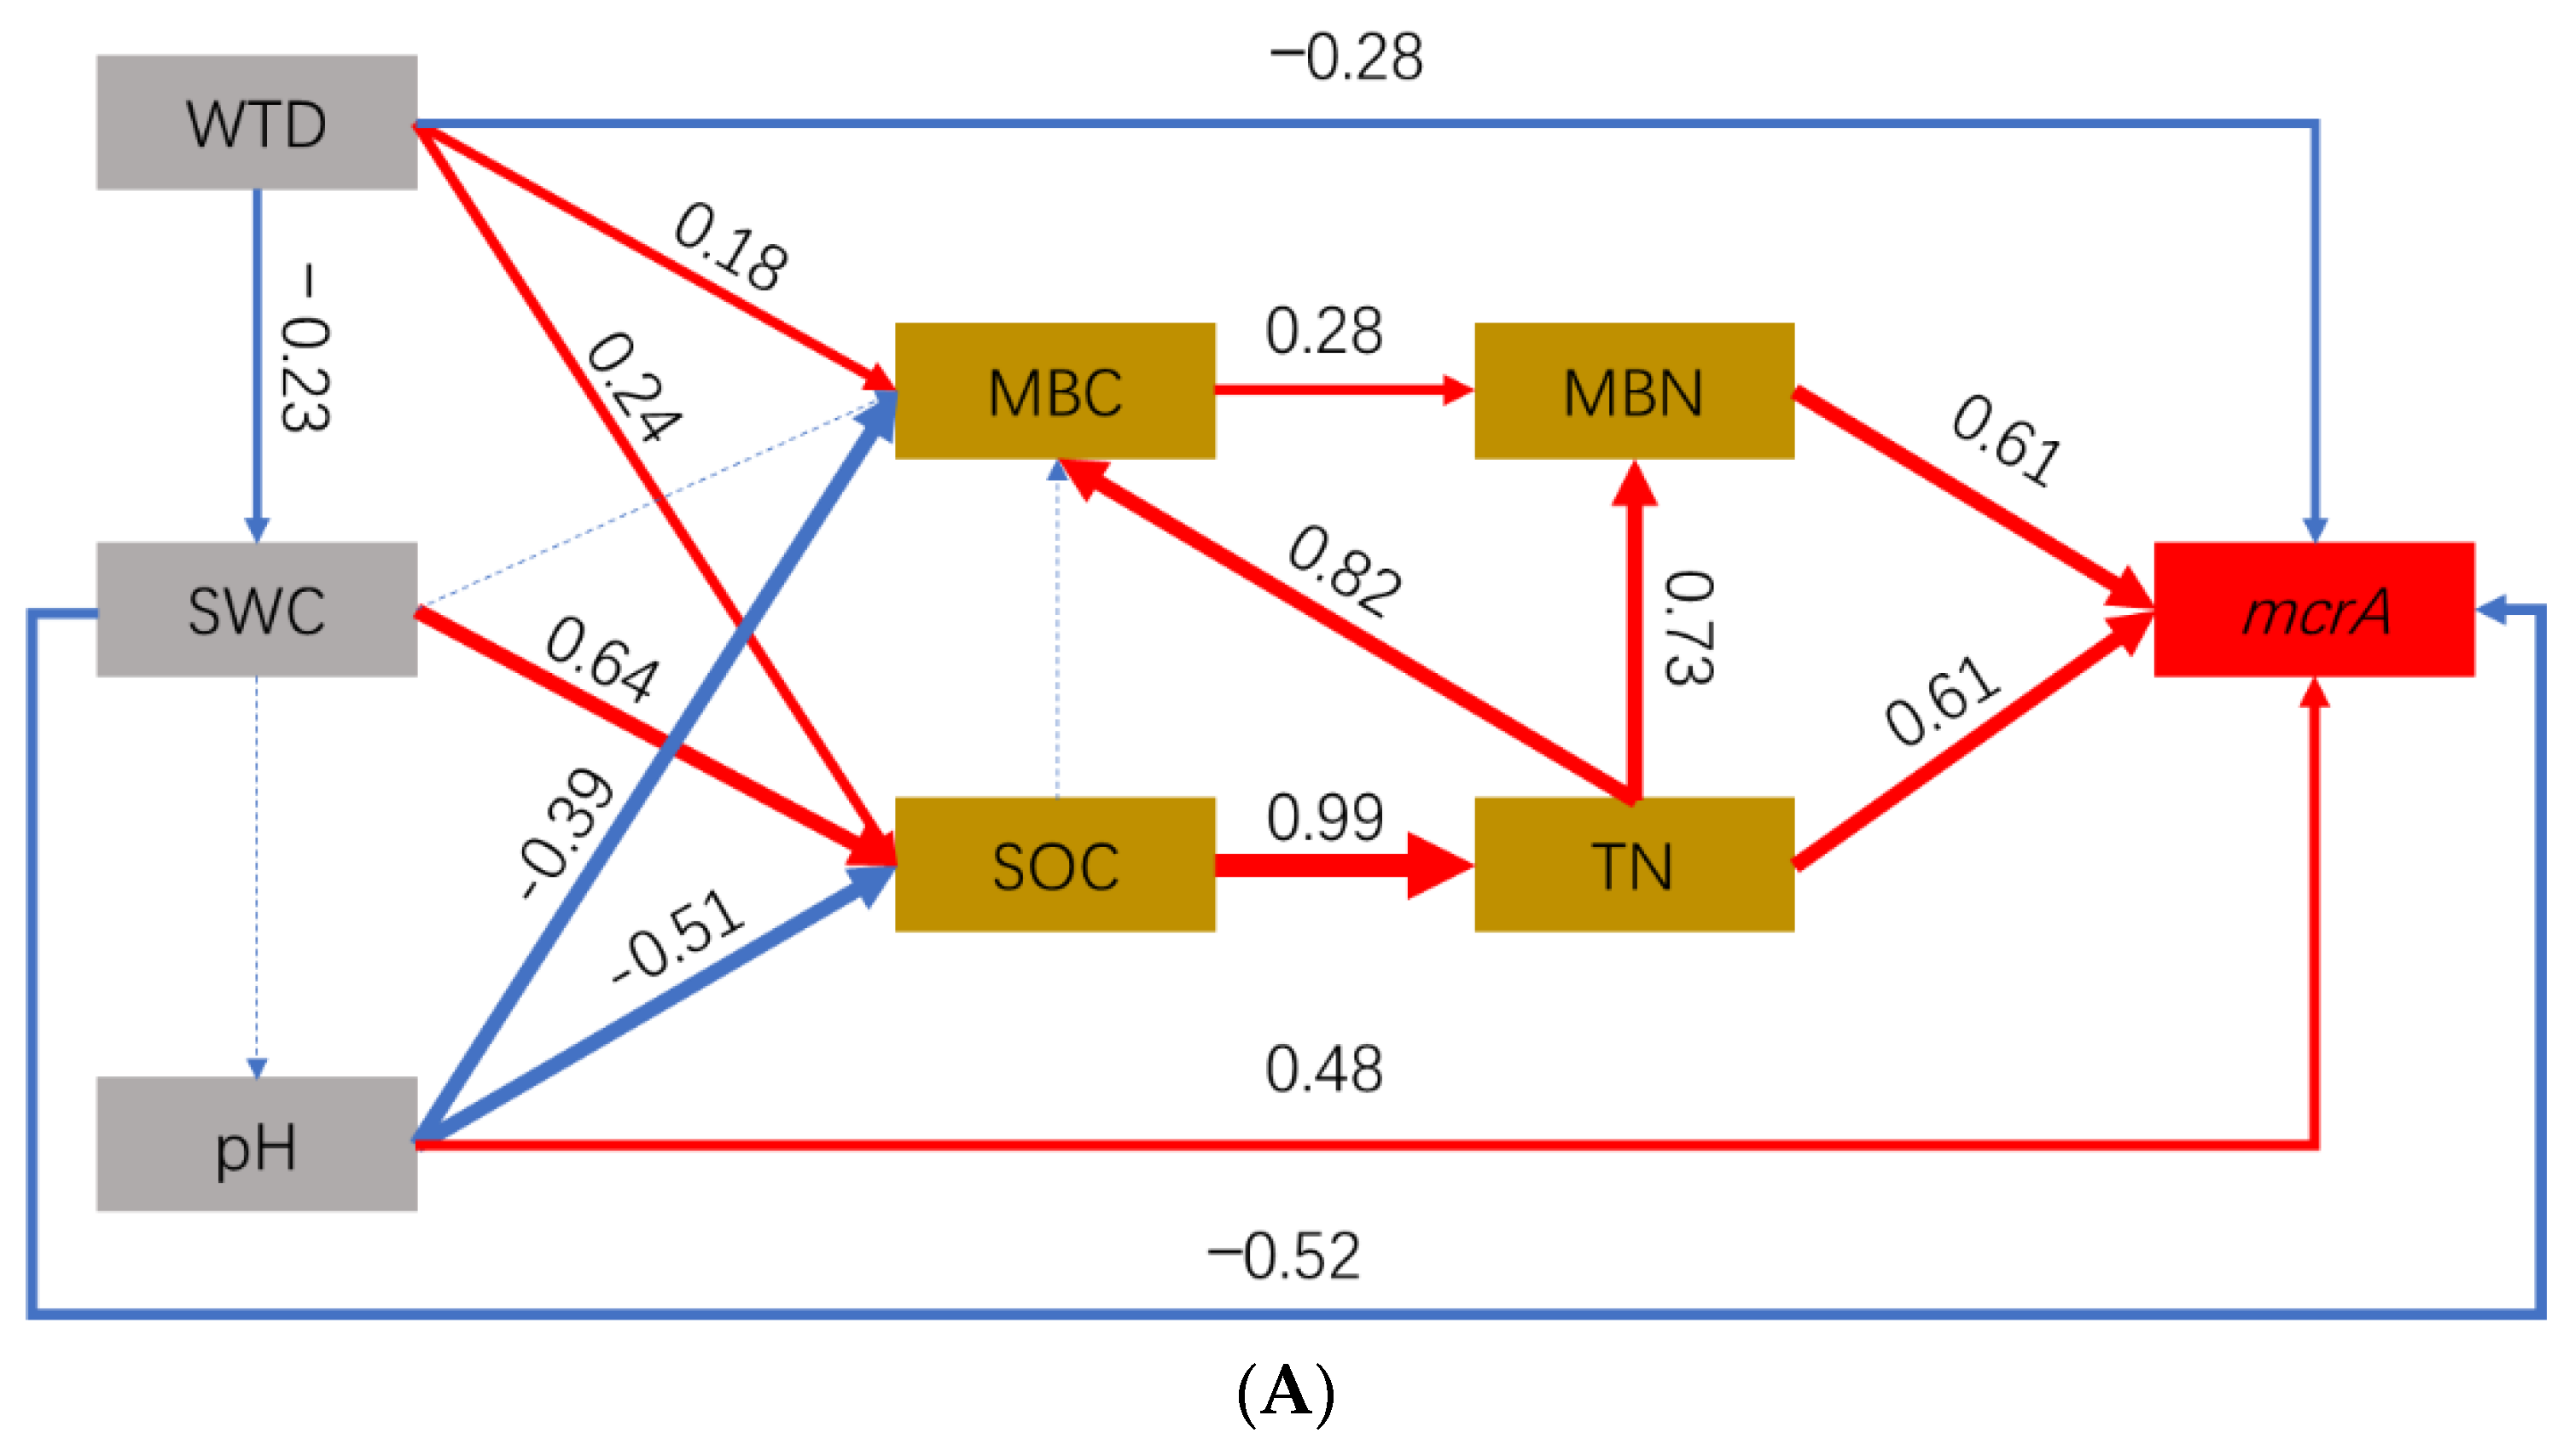
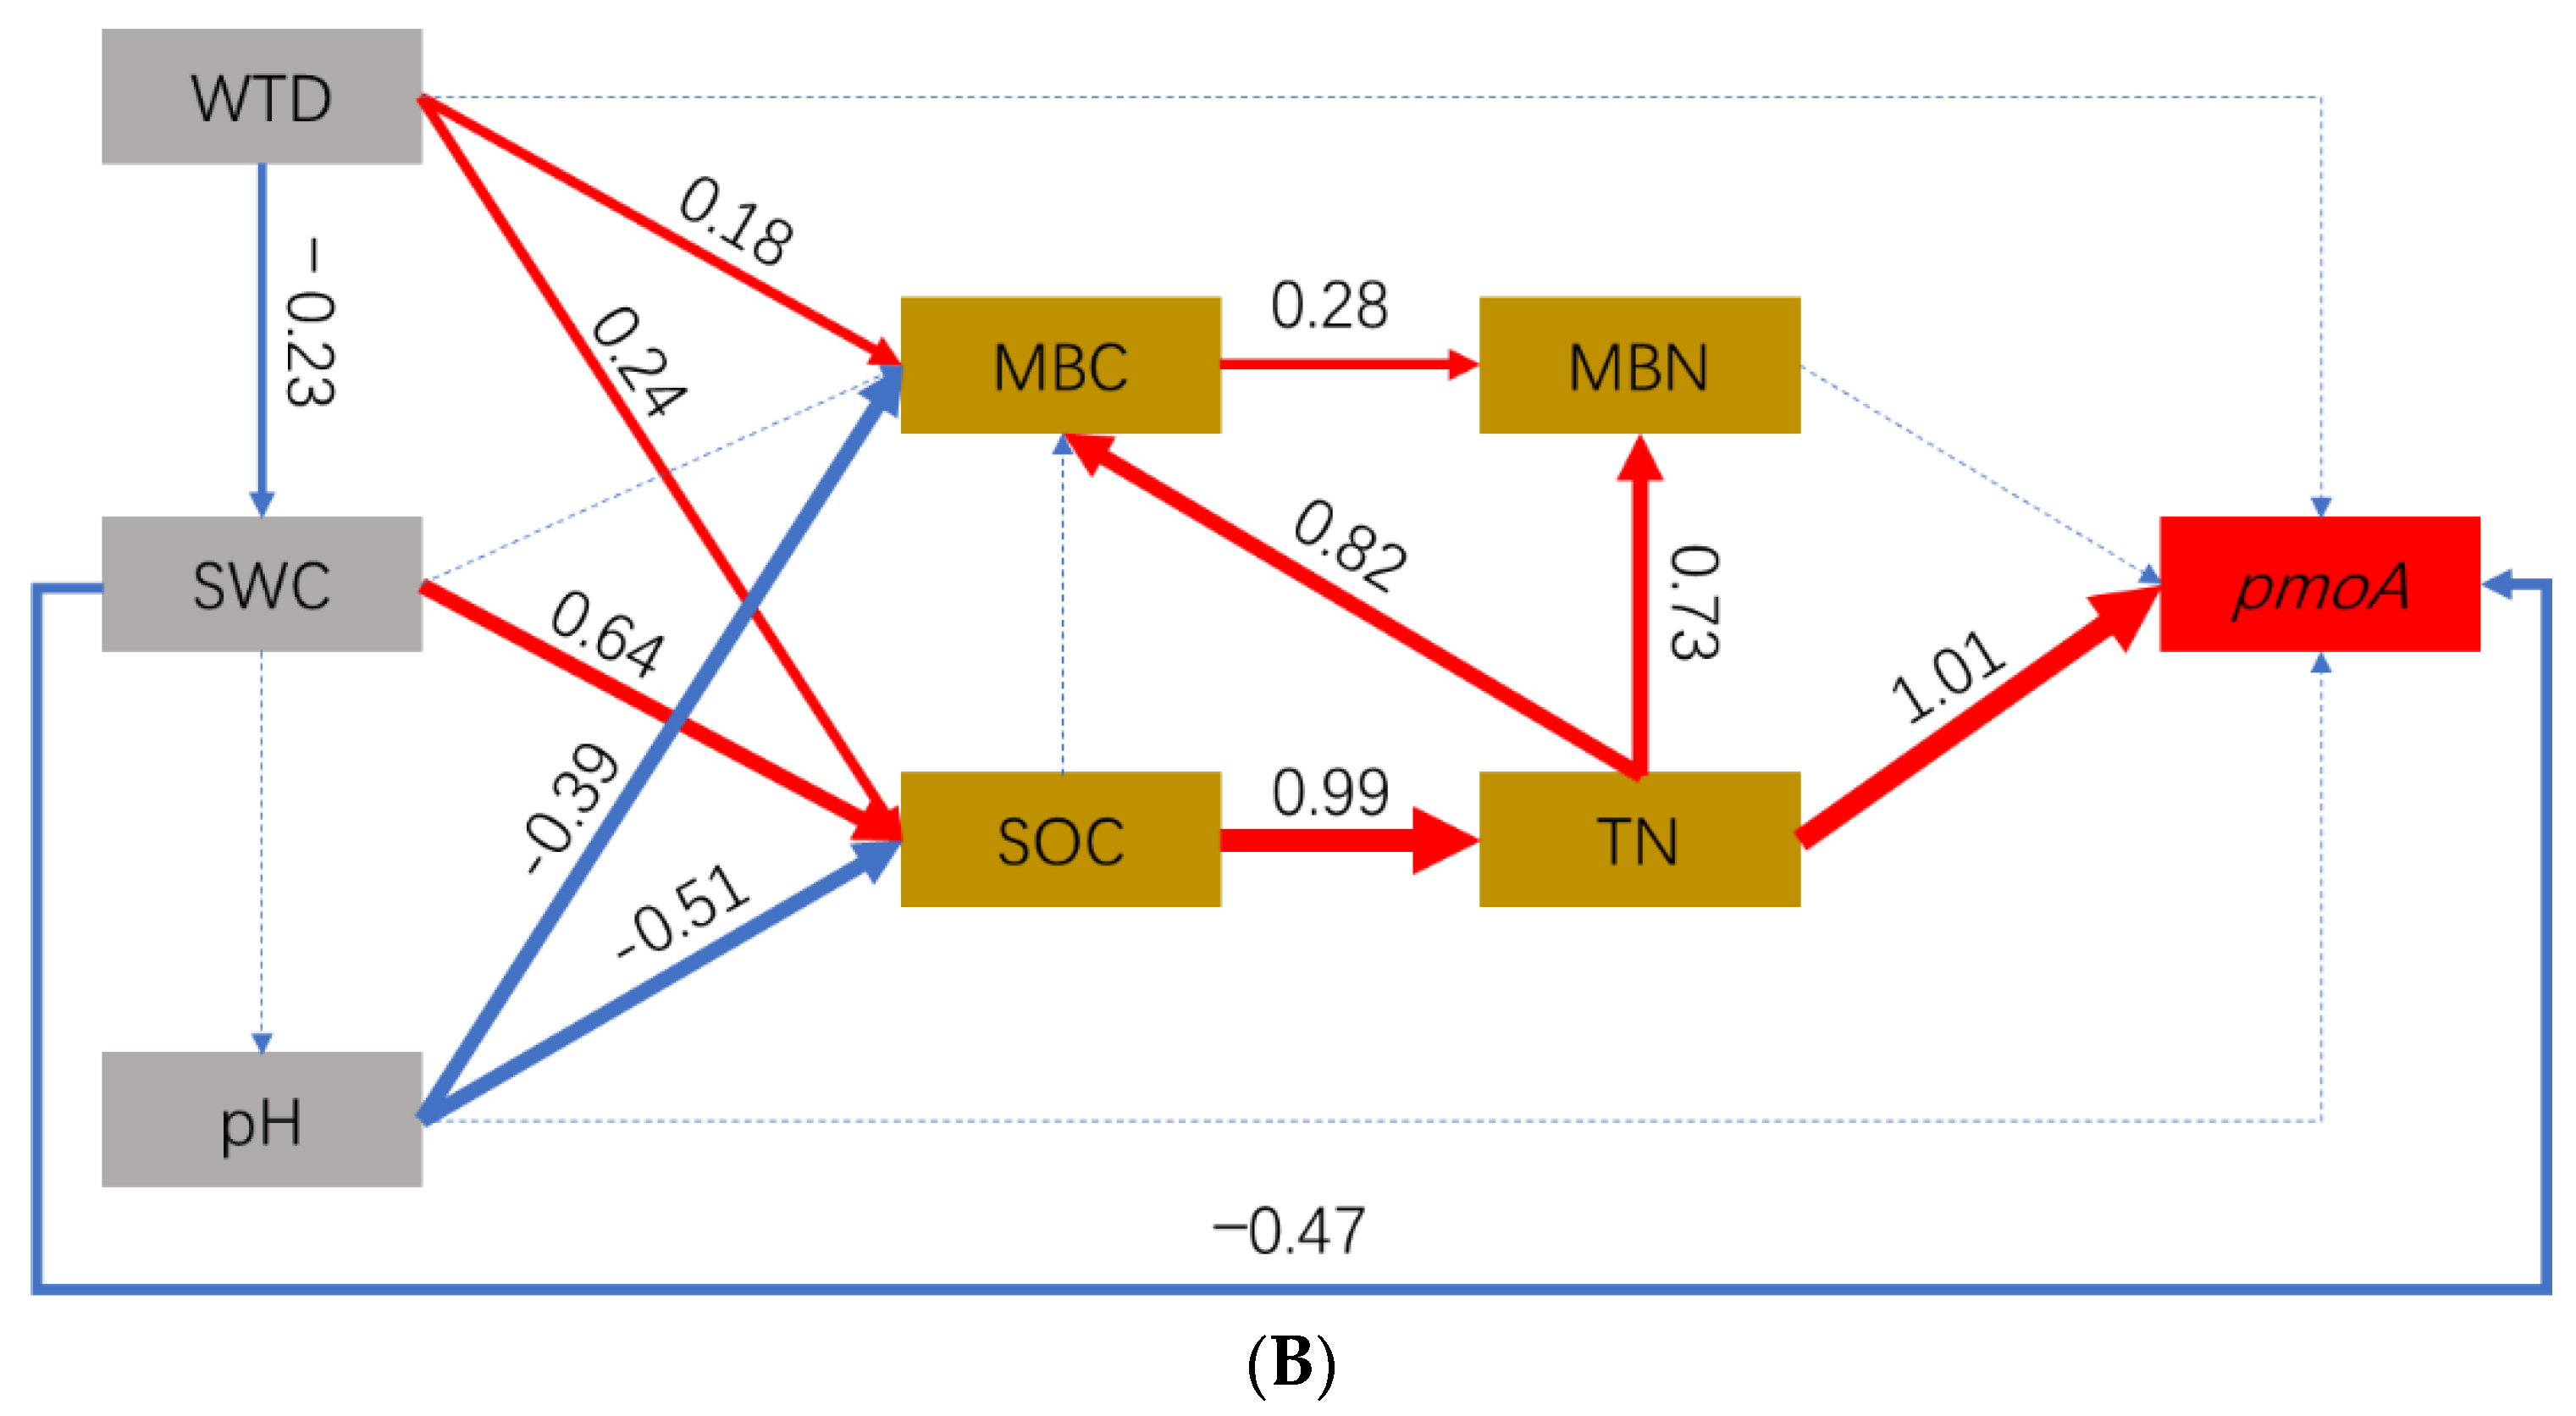
3.5. Effect Pathways of Environmental Factors on CH4-Cycling Microorganisms
4. Discussion
4.1. CH4 Flux and Abundance of CH4-Aycling Microorganisms
4.2. CH4-Cycling Microorganism Composition
4.2.1. Methanogen Composition in Three Vegetation Types
4.2.2. Methanotroph Composition in Three Vegetation Types Along an Elevation Gradient
4.3. Environmental Controls on CH4-Cycling Microorganisms
5. Conclusions
Supplementary Materials
Author Contributions
Funding
Acknowledgments
Conflicts of Interest
References
- IPCC. Climate Change 2014: Synthesis Report. Contribution of Working Groups I, II and III to the Fifth Assessment Report of the Intergovernmental Panel on Climate Change; Team, C.W., Pachauri, R.K., Meyer, L., Eds.; IPCC: Geneva, Switzerland, 2014. [Google Scholar]
- Saunois, M.; Bousquet, P.; Poulter, B.; Peregon, A.; Ciais, P.; Canadell, J.G.; Dlugokencky, E.J.; Etiope, G.; Bastviken, D.; Houweling, S.; et al. The global methane budget 2000–2012. Earth Syst. Sci. Data 2016, 8, 697–751. [Google Scholar] [CrossRef] [Green Version]
- Zhang, Z.; Zimmermann, N.E.; Stenke, A.; Li, X.; Hodson, E.L.; Zhu, G.; Huang, C.; Poulter, B. Emerging role of wetland methane emissions in driving 21st century climate change. Proc. Natl. Acad. Sci. USA 2017, 114, 9647–9652. [Google Scholar] [CrossRef] [PubMed] [Green Version]
- Basiliko, N.; Yavitt, J.B.; Dees, P.M.; Merkel, S.M. Methane biogeochemistry and methanogen communities in two northern peatland ecosystems, New York State. Geomicrobiol. J. 2003, 20, 563–577. [Google Scholar] [CrossRef]
- Cadillo-Quiroz, H.; Brauer, S.; Yashiro, E.; Sun, C.; Yavitt, J.; Zinder, S. Vertical profiles of methanogenesis and methanogens in two contrasting acidic peatlands in central New York State, USA. Environ. Microbiol. 2006, 8, 1428–1440. [Google Scholar] [CrossRef] [PubMed]
- Horn, M.A.; Matthies, C.; Küsel, K.; Schramm, A.; Drake, H.L. Hydrogenotrophic methanogenesis by moderately acid-tolerant methanogens of a methane-emitting acidic peat. Appl. Environ. Microbiol. 2003, 69, 74–83. [Google Scholar]
- Rooney-Varga, J.N.; Giewat, M.W.; Duddleston, K.N.; Chanton, J.P.; Hines, M.E. Links between archaeal community structure, vegetation type and methanogenic pathway in Alaskan peatlands. FEMS Microbiol. Ecol. 2007, 60, 240–251. [Google Scholar] [CrossRef] [Green Version]
- Williams, R.T.; Crawford, R.L. Methanogenic bacteria, including an acid-tolerant strain, from peatlands. Appl. Environ. Microbiol. 1985, 50, 1542–1544. [Google Scholar]
- Bloom, A.A.; Palmer, P.I.; Fraser, A.; Reay, D.S. Seasonal variability of tropical wetland CH4 emissions: The role of the methanogen-available carbon pool. Biogeosciences 2012, 9, 2821–2830. [Google Scholar]
- Pangala, S.R.; Enrich-Prast, A.; Basso, L.S.; Peixoto, R.B.; Bastviken, D.; Hornibrook, E.R.C.; Gatti, L.V.; Marotta, H.; Braucks Calazans, L.S.; Sakuragui, C.M.; et al. Large emissions from floodplain trees close the Amazon methane budget. Nature 2017, 552, 230–234. [Google Scholar] [CrossRef]
- Batson, J.; Noe, G.B.; Hupp, C.R.; Krauss, K.W.; Rybicki, N.B.; Schenk, E.R. Soil greenhouse gas emissions and carbon budgeting in a short-hydroperiod floodplain wetland. J. Geophys. Res. Biogeosci. 2015, 120, 77–95. [Google Scholar] [CrossRef]
- Koh, H.-S.; Ochs, C.; Yu, K. Hydrologic gradient and vegetation controls on CH4 and CO2 fluxes in a spring-fed forested wetland. Hydrobiologia 2009, 630, 271–286. [Google Scholar] [CrossRef]
- Miao, G.; Noormets, A.; Domec, J.-C.; Trettin, C.C.; McNulty, S.G.; Sun, G.; King, J.S. The effect of water table fluctuation on soil respiration in a lower coastal plain forested wetland in the southeastern U.S. J. Geophys. Res. Biogeosci. 2013, 118, 1748–1762. [Google Scholar] [CrossRef]
- Kemnitz, D.; Chin, K.J.; Bodelier, P.; Conrad, R. Community analysis of methanogenic archaea within a riparian flooding gradient. Environ. Microbiol. 2004, 6, 449–461. [Google Scholar] [CrossRef]
- Narihiro, T.; Hori, T.; Nagata, O.; Hoshino, T.; Yumoto, I.; Kamagata, Y. The Impact of Aridification and Vegetation Type on Changes in the Community Structure of Methane-Cycling Microorganisms in Japanese Wetland Soils. Biosci. Biotechnol. Biochem. 2011, 75, 1727–1734. [Google Scholar] [CrossRef] [PubMed] [Green Version]
- Tian, J.; Chen, H.; Dong, X.; Wang, Y. Relationship between archaeal community structure and vegetation type in a fen on the Qinghai–Tibetan Plateau. Biol. Fertil. Soils 2012, 48, 349–356. [Google Scholar] [CrossRef]
- Ye, F.; Wu, S.; Jiang, Y.; den Camp, H.J.O.; Li, Z.; Zhu, G.; Zheng, J.; Wang, Y. Shifts of archaeal community structure in soil along an elevation gradient in a reservoir water level fluctuation zone. J. Soils Sediments 2016, 16, 2728–2739. [Google Scholar] [CrossRef]
- Freire Silva, T.S.; Costa, M.P.F.; Novo, E.M.L.M.; Melack, J.M. A Multisensor, Multitemporal Approach for Monitoring Herbaceous Vegetation Growth in the Amazon Floodplain; IEEE: Banff, AB, Canada, 2013. [Google Scholar]
- Hu, J.-Y.; Xie, Y.-H.; Tang, Y.; Li, F.; Zou, Y.-A. Changes of vegetation distribution in the east Dongting Lake after the operation of the Three Gorges Dam, China. Front. Plant Sci. 2018, 9, 582. [Google Scholar] [PubMed] [Green Version]
- Xie, Y.H.; Yue, T.; Xin-sheng, C.; Feng, L.; Zheng-miao, D. The impact of Three Gorges Dam on the downstream eco-hydrological environment and vegetation distribution of East Dongting Lake. Ecohydrology 2015, 8, 738–746. [Google Scholar] [CrossRef]
- Deng, Z.-M.; Chen, X.-S.; Xie, Y.-H.; Xie, Y.-J.; Hou, Z.-Y.; Li, F. The role of seedling recruitment from juvenile populations of Carex brevicuspis (Cyperaceae) at the Dongting Lake wetlands, China. Sci. Rep. 2015, 5, 8646. [Google Scholar] [CrossRef] [PubMed]
- Chen, X.S.; Li, X.; Xie, Y.H.; Li, F.; Hou, Z.Y.; Zeng, J. Combined influence of hydrological gradient and edaphic factors on the distribution of macrophyte communities in Dongting Lake wetlands, China. Wetl. Ecol. Manag. 2015, 23, 481–490. [Google Scholar] [CrossRef]
- O’Kelly, B.C. Accurate Determination of Moisture Content of Organic Soils Using the Oven Drying Method. Dry. Technol. 2004, 22, 1767–1776. [Google Scholar] [CrossRef]
- Tong, C.; Cadillo-Quiroz, H.; Zeng, Z.H.; She, C.X.; Yang, P.; Huang, J.F. Changes of community structure and abundance of methanogens in soils along a freshwater-brackish water gradient in subtropical estuarine marshes. Geoderma 2017, 299, 101–110. [Google Scholar] [CrossRef]
- Wu, J.; Joergensen, R.; Pommerening, B.; Chaussod, R.; Brookes, P. Measurement of soil microbial biomass C by fumigation-extraction-an automated procedure. Soil Biol. Biochem. 1990, 22, 1167–1169. [Google Scholar] [CrossRef]
- Deng, Z.; Li, Y.; Xie, Y.; Peng, C.; Chen, X.; Li, F.; Ren, Y.; Pan, B.; Zhang, C. Hydrologic and Edaphic Controls on Soil Carbon Emission in Dongting Lake Floodplain, China. J. Geophys. Res. Biogeosci. 2018, 123, 3088–3097. [Google Scholar] [CrossRef]
- Luton, P.E.; Wayne, J.M.; Sharp, R.J.; Riley, P.W. The mcrA gene as an alternative to 16S rRNA in the phylogenetic analysis of methanogen populations in landfillb. Microbiology 2002, 148, 3521–3530. [Google Scholar] [CrossRef] [Green Version]
- Holmes, A.J.; Costello, A.; Lidstrom, M.E.; Murrell, J.C. Evidence that participate methane monooxygenase and ammonia monooxygenase may be evolutionarily related. FEMS Microbiol. Lett. 1995, 132, 203–208. [Google Scholar] [CrossRef]
- Costello, A.M.; Lidstrom, M.E. Molecular characterization of functional and phylogenetic genes from natural populations of methanotrophs in lake sediments. Appl. Environ. Microbiol. 1999, 65, 5066–5074. [Google Scholar] [CrossRef] [Green Version]
- Jing, X.; Sanders, N.J.; Shi, Y.; Chu, H.; Classen, A.T.; Zhao, K.; Chen, L.; Shi, Y.; Jiang, Y.; He, J.-S. The links between ecosystem multifunctionality and above- and belowground biodiversity are mediated by climate. Nat. Commun. 2015, 6, 8159. [Google Scholar] [CrossRef] [PubMed]
- Chen, X.; Ma, H.; Zheng, Y.; Liu, J.; Liang, X.; He, C. Changes in methane emission and methanogenic and methanotrophic communities in restored wetland with introduction of Alnus trabeculosa. J. Soils Sediments 2017, 17, 181–189. [Google Scholar] [CrossRef]
- Rey-Sanchez, C.; Bohrer, G.; Slater, J.; Li, Y.; Grau-Andrés, R.; Hao, Y.; Rich, V.; Davies, G. The ratio of methanogens to methanotrophs and water-level dynamics drive methane exchange velocity in a temperate kettle-hole peat bog. Biogeosciences 2019, 16, 3207–3231. [Google Scholar] [CrossRef] [Green Version]
- Bourne, D.G.; McDonald, I.R.; Murrell, J.C. Comparison of pmoA PCR primer sets as tools for investigating methanotroph diversity in three Danish soils. Appl. Environ. Microbiol. 2001, 67, 3802–3809. [Google Scholar] [CrossRef] [PubMed] [Green Version]
- Galand, P.E.; Saarnio, S.; Fritze, H.; Yrjala, K. Depth related diversity of methanogen Archaea in Finnish oligotrophic fen. FEMS Microbiol. Ecol. 2002, 42, 441–449. [Google Scholar] [CrossRef] [PubMed]
- Zhou, X.; Jin, F.; Lu, C.H.; Baoyin, T.G.T.; Jia, Z.J. Shifts in the community composition of methane-cycling microorganisms during lake shrinkage. Geoderma 2018, 311, 9–14. [Google Scholar] [CrossRef]
- Liu, D.; Ding, W.; Jia, Z.; Cai, Z. The impact of dissolved organic carbon on the spatial variability of methanogenic archaea communities in natural wetland ecosystems across China. Appl. Microbiol. Biotechnol. 2012, 96, 253–263. [Google Scholar] [CrossRef]
- Sollinger, A.; Schwab, C.; Weinmaier, T.; Loy, A.; Tveit, A.T.; Schleper, C.; Urich, T. Phylogenetic and genomic analysis of Methanomassiliicoccales in wetlands and animal intestinal tracts reveals clade-specific habitat preferences. FEMS Microbiol. Ecol. 2016, 92, fiv149. [Google Scholar] [CrossRef] [Green Version]
- Zou, Y.-A.; Zhang, P.-Y.; Zhang, S.-Q.; Chen, X.-S.; Li, F.; Deng, Z.-M.; Yang, S.; Zhang, H.; Li, F.-Y.; Xie, Y.-H. Crucial sites and environmental variables for wintering migratory waterbird population distributions in the natural wetlands in East Dongting Lake, China. Sci. Total Environ. 2019, 655, 147–157. [Google Scholar] [CrossRef]
- Ho, A.; Kerckhof, F.M.; Luke, C.; Reim, A.; Krause, S.; Boon, N.; Bodelier, P.L. Conceptualizing functional traits and ecological characteristics of methane-oxidizing bacteria as life strategies. Environ. Microbiol. Rep. 2013, 5, 335–345. [Google Scholar] [CrossRef] [PubMed]
- Ho, A.; Luke, C.; Frenzel, P. Recovery of methanotrophs from disturbance: Population dynamics, evenness and functioning. ISME J. 2011, 5, 750–758. [Google Scholar] [CrossRef] [PubMed] [Green Version]
- Dam, B.; Dam, S.; Blom, J.; Liesack, W. Genome Analysis Coupled with Physiological Studies Reveals a Diverse Nitrogen Metabolism in Methylocystis sp. Strain SC2. PLoS ONE 2013, 8, e74767. [Google Scholar] [CrossRef] [Green Version]
- Hoefman, S.; van der Ha, D.; Boon, N.; Vandamme, P.; De Vos, P.; Heylen, K. Niche differentiation in nitrogen metabolism among methanotrophs within an operational taxonomic unit. BMC Microbiol. 2014, 14, 83. [Google Scholar] [CrossRef] [Green Version]
- Stein, L.Y.; Klotz, M.G. Nitrifying and denitrifying pathways of methanotrophic bacteria. Biochem. Soc. Trans. 2011, 39, 1826–1831. [Google Scholar] [CrossRef] [Green Version]
- Auman, A.J.; Speake, C.C.; Lidstrom, M.E. nifH sequences and nitrogen fixation in type I and type II methanotrophs. Appl. Environ. Microbiol. 2001, 67, 4009–4016. [Google Scholar] [CrossRef] [Green Version]
- Ramette, A. Multivariate analyses in microbial ecology. FEMS Microbiol. Ecol. 2007, 62, 142–160. [Google Scholar] [CrossRef] [Green Version]
- Bao, Y.; Gao, P.; He, X. The water-level fluctuation zone of Three Gorges Reservoir—A unique geomorphological unit. Earth Sci. Rev. 2015, 150, 14–24. [Google Scholar] [CrossRef]
- Hoyos-Santillan, J.; Craigon, J.; Lomax, B.H.; Lopez, O.R.; Turner, B.L.; Sjogersten, S. Root oxygen loss from Raphia taedigera palms mediates greenhouse gas emissions in lowland neotropical peatlands. Plant Soil 2016, 404, 47–60. [Google Scholar] [CrossRef]
- Xie, Y.; Xie, Y.; Xiao, H.; Chen, X.; Li, F. Controls on Litter Decomposition of Emergent Macrophyte in Dongting Lake Wetlands. Ecosystems 2017, 20, 1383–1389. [Google Scholar] [CrossRef]
- Bridgham, S.D.; Cadillo-Quiroz, H.; Keller, J.K.; Zhuang, Q. Methane emissions from wetlands: Biogeochemical, microbial, and modeling perspectives from local to global scales. Glob. Chang. Biol. 2013, 19, 1325–1346. [Google Scholar] [CrossRef]
- Lay, J.-J.; Li, Y.-Y.; Noike, T. Influences of pH and moisture content on the methane production in high-solids sludge digestion. Water Res. 1997, 31, 1518–1524. [Google Scholar] [CrossRef]
- Wang, Z.P.; DeLaune, R.D.; Patrick, W.H.; Masscheleyn, P.H. Soil Redox and pH Effects on Methane Production in a Flooded Rice Soil. Soil Sci. Soc. Am. J. 1993, 57, 382–385. [Google Scholar] [CrossRef]
- Bodelier, P.L.E. Interactions between nitrogenous fertilizers and methane cycling in wetland and upland soils. Curr. Opin. Environ. Sustain. 2011, 3, 379–388. [Google Scholar] [CrossRef]
- Haque, M.F.U.; Crombie, A.T.; Ensminger, S.A.; Baciu, C.; Murrell, J.C. Facultative methanotrophs are abundant at terrestrial natural gas seeps. Microbiome 2018, 6, 118. [Google Scholar]
- Hanson, R.S.; Hanson, T.E. Methanotrophic bacteria. Microbiol. Mol. Biol. Rev. 1996, 60, 439–471. [Google Scholar] [CrossRef] [Green Version]
- Bray, M.S.; Wu, J.; Reed, B.C.; Kretz, C.B.; Belli, K.M.; Simister, R.L.; Henny, C.; Stewart, F.J.; DiChristina, T.J.; Brandes, J.A.; et al. Shifting microbial communities sustain multiyear iron reduction and methanogenesis in ferruginous sediment incubations. Geobiology 2017, 15, 678–689. [Google Scholar] [CrossRef] [PubMed]
- Mohanty, S.R.; Bandeppa, G.S.; Dubey, G.; Ahirwar, U.; Patra, A.K.; Bharati, K. Methane oxidation in response to iron reduction-oxidation metabolism in tropical soils. Eur. J. Soil Biol. 2017, 78, 75–81. [Google Scholar] [CrossRef]
- Sivan, O.; Shusta, S.; Valentine, D. Methanogens rapidly transition from methane production to iron reduction. Geobiology 2016, 14, 190–203. [Google Scholar] [CrossRef]
- Luo, M.; Zeng, C.-S.; Tong, C.; Huang, J.-F.; Chen, K.; Liu, F.-Q. Iron Reduction Along an Inundation Gradient in a Tidal Sedge (Cyperus malaccensis) Marsh: The Rates, Pathways, and Contributions to Anaerobic Organic Matter Mineralization. Estuaries Coasts 2016, 39, 1679–1693. [Google Scholar] [CrossRef]


| Microorganisms | Depth(cm) | MF | CM | RL |
|---|---|---|---|---|
| methanogens | 0–10 cm | 0.67 ± 0.34 a | 10.17 ± 1.49 a | 2.29±0.50 a |
| 10–20 cm | 0.06 ± 0.03 b | 4.66 ± 0.45 b | 1.33 ± 0.72 ab | |
| 20–30 cm | 0.31 ± 0.14 ab | 3.61 ± 1.13 b | 0.41 ± 0.20 b | |
| Average | 0.32 ± 0.11 B | 6.15 ± 1.16 A | 1.43 ± 0.38 B | |
| methanotrophs | 0–10 cm | 1.17 ± 0.80 a | 11.73 ± 3.60 a | 3.47 ± 0.76 a |
| 10–20 cm | 0.45 ± 0.32 a | 1.11 ± 0.50 b | 1.98 ± 0.78 a | |
| 20–30 cm | 0.18 ± 0.077 a | 0.57 ± 0.20 b | 1.56 ± 0.78 a | |
| Average | 0.62 ± 0.32 B | 4.47 ± 2.10 A | 2.41 ± 0.48 AB |
| Environmental Factors | Methanogen | Methanotroph | ||||
|---|---|---|---|---|---|---|
| RDA1(β1) | RDA2(β2) | r2 | RDA1(β1) | RDA2(β2) | r2 | |
| WTD | 0.96 | 0.29 | 0.54 *** | 0.99 | 0.02 | 0.94 *** |
| SWC | −0.86 | −0.52 | 0.35 ** | −0.99 | −0.02 | 0.26 * |
| pH | 0.96 | 0.27 | 0.57 *** | 0.99 | −0.03 | 0.80 *** |
| MBC | 0.69 | −0.72 | 0.48 *** | 0.72 | −0.69 | 0.21 * |
| MBN | 0.69 | −0.72 | 0.36 ** | 0.30 | −0.95 | 0.32 ** |
| SOC | 0.41 | −0.91 | 0.40 ** | 0.22 | −0.97 | 0.26 * |
| TC | 0.53 | −0.84 | 0.35 ** | 0.33 | −0.94 | 0.27 * |
| TN | 0.42 | −0.90 | 0.34 ** | 0.31 | −0.95 | 0.22 * |
| Dependent Variables | Fisher.c | p Value | AIC | R2 |
|---|---|---|---|---|
| methanogens | 13.81 | 0.46 | 77.81 | 0.77 |
| methanotrophs | 9.95 | 0.62 | 81.95 | 0.75 |
© 2020 by the authors. Licensee MDPI, Basel, Switzerland. This article is an open access article distributed under the terms and conditions of the Creative Commons Attribution (CC BY) license (http://creativecommons.org/licenses/by/4.0/).
Share and Cite
Ren, Y.; Zhu, L.; Deng, Z.; Xie, Y.; Zhang, C.; Xiao, F.; Chen, X.; Li, F.; Zou, Y.; Sheng, R.; et al. Changes in Methane Emission and Community Composition of Methane-Cycling Microorganisms Along an Elevation Gradient in the Dongting Lake Floodplain, China. Atmosphere 2020, 11, 997. https://doi.org/10.3390/atmos11090997
Ren Y, Zhu L, Deng Z, Xie Y, Zhang C, Xiao F, Chen X, Li F, Zou Y, Sheng R, et al. Changes in Methane Emission and Community Composition of Methane-Cycling Microorganisms Along an Elevation Gradient in the Dongting Lake Floodplain, China. Atmosphere. 2020; 11(9):997. https://doi.org/10.3390/atmos11090997
Chicago/Turabian StyleRen, Yijie, Lianlian Zhu, Zhengmiao Deng, Yonghong Xie, Chengyi Zhang, Fengjin Xiao, Xinsheng Chen, Feng Li, Yeai Zou, Rong Sheng, and et al. 2020. "Changes in Methane Emission and Community Composition of Methane-Cycling Microorganisms Along an Elevation Gradient in the Dongting Lake Floodplain, China" Atmosphere 11, no. 9: 997. https://doi.org/10.3390/atmos11090997